Abstract
Elevated nitrogen (N) deposition may further acidify soils in tropical forests. Yet, we have limited evidence on this prediction and it remained unclear how this would affect fine root growth therein. Here, we report responses of fine root biomass, vitality, and chemistry, as well as related soil parameters to eight years of N additions in three tropical forests different in initial soil N status, with one primary forest being N-saturated, and another two younger forests (one secondary forest and one planted forest) less N-rich. Results showed that in the primary forest, fine root biomass decreased and fine root necromass increased following N addition, resulting in lower live fine root proportion (fine root vitality). Declining fine root vitality was associated with fine root Fe accumulation and soil acidification indicated by regression analysis. These alterations of fine root growth and chemistry co-occurred with soil pH decline, soil exchangeable Fe3+ mobilization, exchangeable Ca2+, and Mg2+ depletion after N treatments in the primary forest. In contrast, N addition only elevated fine root K, Al, and Fe content in the secondary forest. In the planted forest, moderate but significant decreases in soil pH, soil exchangeable K+, and Mg2+ were found after N treatment, with fine root biomass negatively correlated with soil exchangeable Al3+ and Al3+/(Ca2+ + Mg2+) ratio. Our results suggested that long-term N fertilization may negatively affect fine root growth, via severed soil acidification, Fe mobilization, and base cation depletion in highly acidified, N-saturated primary tropical forests. Initial forest N status, influenced by different land-use history, mediates N deposition effects on fine root growth.
1. Introduction
Fine roots are in close contact with soil and turn over rapidly. Thus, they can be sensitive to changes in soil nutrient availabilities [1]. Nitrogen availability has been suggested as the major factor governing belowground carbon (C) allocation [2]. It is generally accepted that total fine root biomass (live + dead) or fine root production rate decreases along the positive N availability gradient. This is consistent with the allocation theory that plants maintain a large amount of fine roots when soil nutrients are scarce [3,4,5,6]. Notably, many of these studies were carried out in temperate and boreal forests, which are usually N-limited [7]. Primary lowland tropical forests were considered rich in N due to their long-term development and highly weathered soils [8]. Thus, the key role of N in influencing belowground carbon allocation may not be straightforward and predictable as observed by numerous studies which often dealt with N-limited situations [2].
Aside from changes in tree growth allocation pattern [3], decline in fine root biomass could be related to the N-induced effect of soil acidification, especially in sites where initial N status is high [9]. Continuous atmospheric N deposition to terrestrial ecosystems can lead to pronounced soil acidification [10]. As consequences of soil acidification, net decreases in soil pH and nutrient cations (K+, Ca2+, Mg2+), but increases in phytotoxic soluble Al3+ were often observed, which can potentially damage tree fine roots [11,12]. Low availability of certain mineral nutrients, e.g., P, K, and Mg, is often related to root damages visualized by a decreased live to dead ratio of fine roots [13,14]. The ratio of living fine root biomass over the dead fine root necromass (live to dead ratio or live fine root proportion, %) is a useful proxy of root vitality [14,15,16]. Conversely, increased percentage of living fine roots and increased “vitality” of fine roots of Norway spruce (Picea abies (L.) Karst.) were observed in the ROOF catchment with reduced N and S deposition in SW Sweden [14]. Thus fine root vitality is a useful and sensitive indicator of N-induced stress to fine root growth.
Aluminum can be toxic even when soil pH is neutral [17]. Aluminum accumulates preferentially in the root tips where it can influence cell division and cell elongation [18]. Presence of Al can also block root uptake of Ca and K, resulting in nutrient imbalance and thus malfunction of fine roots [19]. Experimental evidence of such adverse effects of N mainly came from research from central and northern Europe and eastern North America, where nitrogen and sulfur precipitation has resulted in environmental degradation of surface waters, forests, and grasslands during the past five decades [20,21]. In contrast, we know very little about how continuous N deposition would affect soil acidification and fine root growth in tropical forests where the most drastic increases in N deposition will be seen [22]. Indeed, it was demonstrated that N deposition of 5 kg ha−1 yr−1 has altered N concentrations and 15N signatures in plant tissues and influenced the nitrogen cycle in remote tropical forest sites over the past 40 years [23].
Soils undergo transitions through different ranges of buffering associated with the weathering and liberation of different elements [24]. Many temperate soils are buffered by base cations (K+, Na+, Ca2+, Mg2+), and will be replaced by Al3+ when pH drops below 4.2, at the cost of base cation depletion. Tropical forests are usually poorly buffered against acid deposition due to the highly weathered soils with low base cation pools. Thus, as chronic N deposition keeps adding N to these tropical forests, it is reasonable to hypothesize that soil buffering systems would adjust accordingly. Indeed, in one N-saturated primary forest in Dinghushan, southern China, where ambient N deposition is high (32~34 kg ha−1 yr−1, inorganic N, wet deposition) [25], exchangeable Al3+ mobilization, but Ca2+, Mg2+ depletion were demonstrated in the beginning years of N treatments, which was associated with lower fine root biomass (2 years of N additions, 150 kg N ha−1 yr−1) [26,27]. However, Al3+ mobilization ceased after 6 years of N additions (no further increases in exchangeable Al3+ when compared to control, N addition of 150 kg N ha−1 yr−1) [28]. Due to the fast turnover rate and sensitive nature of fine roots, they may also respond accordingly, which has not been examined. In this study, we reported responses of fine root growth (biomass, necromass, and live fine root proportion), fine root chemistry, and related soil parameters to longer-term N treatments, and compared them with short-term responses.
To evaluate the effect of elevated N deposition at sites with a long legacy of high N deposition, a long-term N addition experiment was initiated in July 2003 at Dinghushan Biosphere Reserve of southern China. Atmospheric N deposition rates are commonly above 30 kg N ha−1 yr−1 in the study sites [25,28]. Three types of forests were included, one primary forest (forest age > 400-years-old) and two younger forests (one secondary forest and one planted forest, both at ages of about 75-years-old). These younger forests are common in southern China, largely due to the reforestation of degraded lands over the last few decades [29,30]. The primary forest was demonstrated to be N-saturated based on the negative response of litter decomposition and high N leaching after N additions, in contrast to the relatively less N-rich status of the two younger forests [25,31,32]. Long-term records showed significant decreasing trend in soil pH at all the three forests over the past four decades, but reasons remain unclear. In this study, we reported the effects of 8 years of N treatments on fine root biomass, vitality (live fine root proportion), chemistry, and related soil parameters from this experiment. We hypothesized that: (1) fine root growth and vitality will be inhibited in the N-saturated primary forest, with responses different in magnitude from those of the secondary forest and the planted forest being less N-rich; (2) fine root responses will be closely related with soil acidity and exchangeable cation responses, in the view that fine roots directly contact soil and take up nutrients; (3) these relative longer-term responses (8 years of N treatments) differ from shorter-term patterns, characterized by soil Al3+ mobilization and possibly Al toxicity to fine root growth after 2 years of N additions [9,27]. To our knowledge, this study is, to date, the first to explore effects of long-term N addition (8 years) on fine root biomass, vitality, and chemistry in contrasting but representative tropical forest types in China.
2. Methods
2.1. Site Description
This study was conducted in Dinghushan Natural Reserve (112°33′ E and 23°10′ N), located in the central section of Guangdong province, southern China. The climate is warm and humid, with annual precipitation of 1927 mm and mean annual temperature of 21.0 °C [33]. Soils are classified as oxisols formed from sandstone with soil depth of roughly 30 cm to 70 cm (lateritic red earth) [34]. Bulk precipitation of inorganic and organic N averages approximately 33 and 18 kg N ha−1 yr−1 in 2004–2005, respectively [25].
Three types of forest within the reserve (~2–4 km apart) were used in this study: a primary forest, considered the regional climax type, a younger secondary mixed species forest, and a similarly younger planted forest (Table 1) [31,32,35]. All forest types are of similar elevation range (50–250 m above mean sea level), slope aspect, and degree [32]. The age of the primary forest was determined to be older than 400 years using the 14C dating technique [36]. The 14C dating technique hinges on the fact that the 14C signature within organisms after death decays at a first-order reaction and the decay rate is proportional to the number of 14C atoms present. Then, by comparing with the known half-life of 14C, the mean age of a certain sample or the residence time of soil organic matter can be calculated. The two younger forests originated from clear-cut harvesting and subsequent planting of Pinus massoniana in the 1930s, during which time the sites became badly eroded and degraded [31,32]. Sharply contrasting intensity and frequency of litter and vegetation harvesting between 1930s and 1998 resulted in contrasting tree species composition. Pinus massoniana dominates in the planted forest, whereas several broadleaf species co-dominate with P. massoniana in the secondary forest. The three forest types exhibit different nutrient status, with lower mineral soil C:N ratio and higher N leaching rates in the primary forest (Table 1), which is characteristic of N saturation [37]. The two younger forests are similar with respect to most characteristics and are considered N-limited, based on positive effects of N on litter decomposition rates [31]. In the primary forest, however, N addition imposed a negative effect on the decomposition rate [31].

Table 1.
Characteristics of the three study forests.
2.2. Experimental Design
The long-term N addition experiments began in July 2003. Four treatments (0, 5, 10, and 15 g N m−2 yr−1, or control, low-N, medium-N, and high-N, respectively) in the primary forest and three treatments (0, 5, and 10 g N m−2 yr−1, or control, low-N and medium-N, respectively) in both the planted and secondary forests were established [31]. There were three replicated plots for each N treatment within each forest. Each plot measured 10 m × 20 m and was surrounded by about 10 m wide buffer strips to prevent inter-contamination. All plots of the N-addition experiment were located at the same slope aspect of each forest. Dissolved NH4NO3 was backpack-sprayed monthly to the forest floor of each plot as 12 equal monthly applications per year. Fertilizer was weighed and mixed with 20 L of water (equivalent of 1 mm rainfall). Control plots received an equivalent volume of deionized H2O.
2.3. Sampling
We sampled soil and fine root samples from the three forests in July 2011 after 8 years of N treatment (2012 fine root biomass data are only shown in Supporting Information). Using a 5 cm diameter corer, eight cores of mineral soil to 10 cm depth were combined to yield two composite samples in each plot from the three forests. The cores were refrigerated until processed (<1.5 day). Roots with diameter less than 2 mm (fine roots) were separated by hand using latex gloves and washed with deionized water. Live and dead fine root fragments were subsequently separated by visual inspection. The xylem of dead roots looks darker and is deteriorated, the degree of cohesion between the cortex and the periderm decreases, and root tips become brittle and less resilient [38]. Sorted roots were dried at 65 °C, weighed, and fine root biomass, fine root necromass, and live fine root proportion were determined. The soils were sieved to pass 2 mm screen.
2.4. Chemical Analysis
Subsamples of live fine roots collected were used to determine N, P, K, Ca, Mg, Al, and Fe concentrations and N:P ratios. About 0.2 g of dried and ground fine root samples were microwave-oven digested with HNO3 and analyzed for P, K, Ca, Mg, Al, and Fe using ICP (Optima 2000, Perkin Elmer, Waltham, MA, USA). Fine root 15N, N, and carbon concentrations were determined by EA-IRMS (EA1112 coupled with Delta-XP, Thermo Fisher Scientific K.K., Yokohama, Japan).
Sieved soil was extracted by 2 mol L−1 KCl and analyzed by the indophenol blue method followed by colorimetry to determine concentration of NH4+-N. Nitrate was analyzed after cadmium reduction to NO2−, followed by sulfanilamide-NAD reaction. Soil available P was determined by adding an acid-ammonium fluoride extraction solution (0.025 mol L−1 HCl + 0.03 mol L−1 NH4F) [39]. Air-dried and sieved mineral soil samples were used to determine soil acidity (soil:water ratio of 1:2.5; Liu et al., 1996). Exchangeable K+, Ca2+, and Mg2+ were extracted with 1 mol L−1 NH4OAC, and exchangeable Al3+ and Fe3+ were extracted with 1mol L−1 KCl (soil:solution = 1:10) [26]. All cations were determined by inductively coupled plasma optical emission spectrometer (Optima 2000, Perkin Elmer, Waltham, MA, USA).
2.5. Data Analysis
Soil cation exchange capacity (CEC) was calculated as the sum of exchangeable cations (i.e., K+, Na+, Ca2+, Mg2+, H+, Al3+, Fe3+) on an equivalent basis. Fraction of base cations (i.e., K+, Na+, Ca2+, Mg2+) in CEC was calculated as soil base saturation (BS). We also calculated the relative composition of soil exchangeable cations, expressed as percentage charge of total CEC. Effects of N treatments on the responses of fine root biomass, necromass, and live fine root proportion were evaluated using least-squares linear regression. One-way ANOVA with Fisher least-significant difference (LSD) multiple range test was employed to identify N-treatment effects on other fine root response variables (fine root cation concentrations, Al and Fe concentrations) and soil exchangeable cations, soil pH, BS, and CEC. Pearson’s correlation analysis with two-tailed significance was adopted to examine the relationships between fine root biomass, necromass, live fine root proportion, and certain soil and fine root parameters in each forest. All analyses were conducted using SPSS 22.0 for Windows® (SPSS, Chicago, IL, USA). Level of significance was set at p < 0.05 unless otherwise stated.
3. Results
3.1. Historical Changes in Soil pH and Fine Root Biomass in the Three Forests and Role of Ambient N Deposition
Figure 1 shows the historical trend in soil pH (water) changes (0–10 cm mineral soil) in the three study forests in southern China (Figure 1). In the primary forest, soil pH decreased from 4.75 in the 1980s to ca. 3.98 in the 2000s to an average of 3.83 in the 2010s. It showed a decreasing rate of −0.032 unit per year from 1982 to 2014, indicated by the regression against years (p < 0.001; Figure 1a). In the secondary forest, soil pH decreased from 4.39 in 1990 to 4.0 in the 2000s and to 3.98 in the 2010s, with annual decreasing rate of −0.026 unit per year from 1990 to 2014 (p = 0.001; Figure 1b). At last, in the planted forest, soil pH decreased from 4.73 in 1990 to an average of 4.18 in the 2000s and to 3.93 in the 2010s (Figure 1c). Its declining rate was -0.035 units per year from 1990 till 2014.
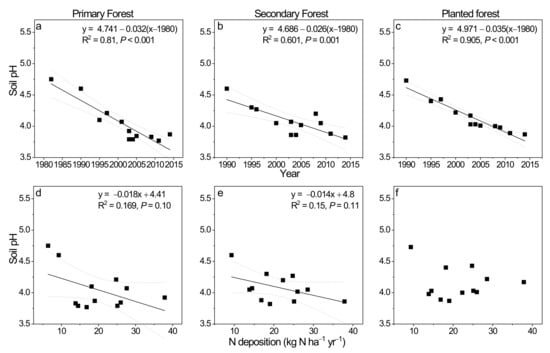
Figure 1.
Soil pH (water) changes at upper 20 cm mineral soil and its relationship with ambient N deposition (kg N ha−1 yr−1) during the 1980s to 2010s in the primary forest (a,d), the secondary forest (b,e), and the planted forest (c,f) of Dinghushan Biosphere Reserve in southern China. Soil pH (water) data for 1980s to 2005 were from Liu et al. (2010) [40], while those for 2008, 2009, 2011, and 2014 were measured by authors using a similar method. N deposition data were from Liu et al. (2013) [41] for specific year averages (1982, 1990, 1995, 1997, 2000, 2003, 2004, 2005, 2008, 2009, and 2010) reported for southeast China (SE China) which included our study site Dinghushan.
The role of concurrent regional N deposition levels in influencing soil pH changes was revealed by regression analysis (Figure 1d–f). It appeared that atmospheric N deposition contributed around 17% and 15% to soil pH changes in the primary and the secondary forest, respectively (Figure 1d,e; p = 0.10 and 0.11), both being marginally significant. Soil pH decreased at −0.018 and −0.014 units per unit increase in N deposition in the two forests (Figure 1d,e). In contrast, no significant relationship can be found in the planted forest (Figure 1f).
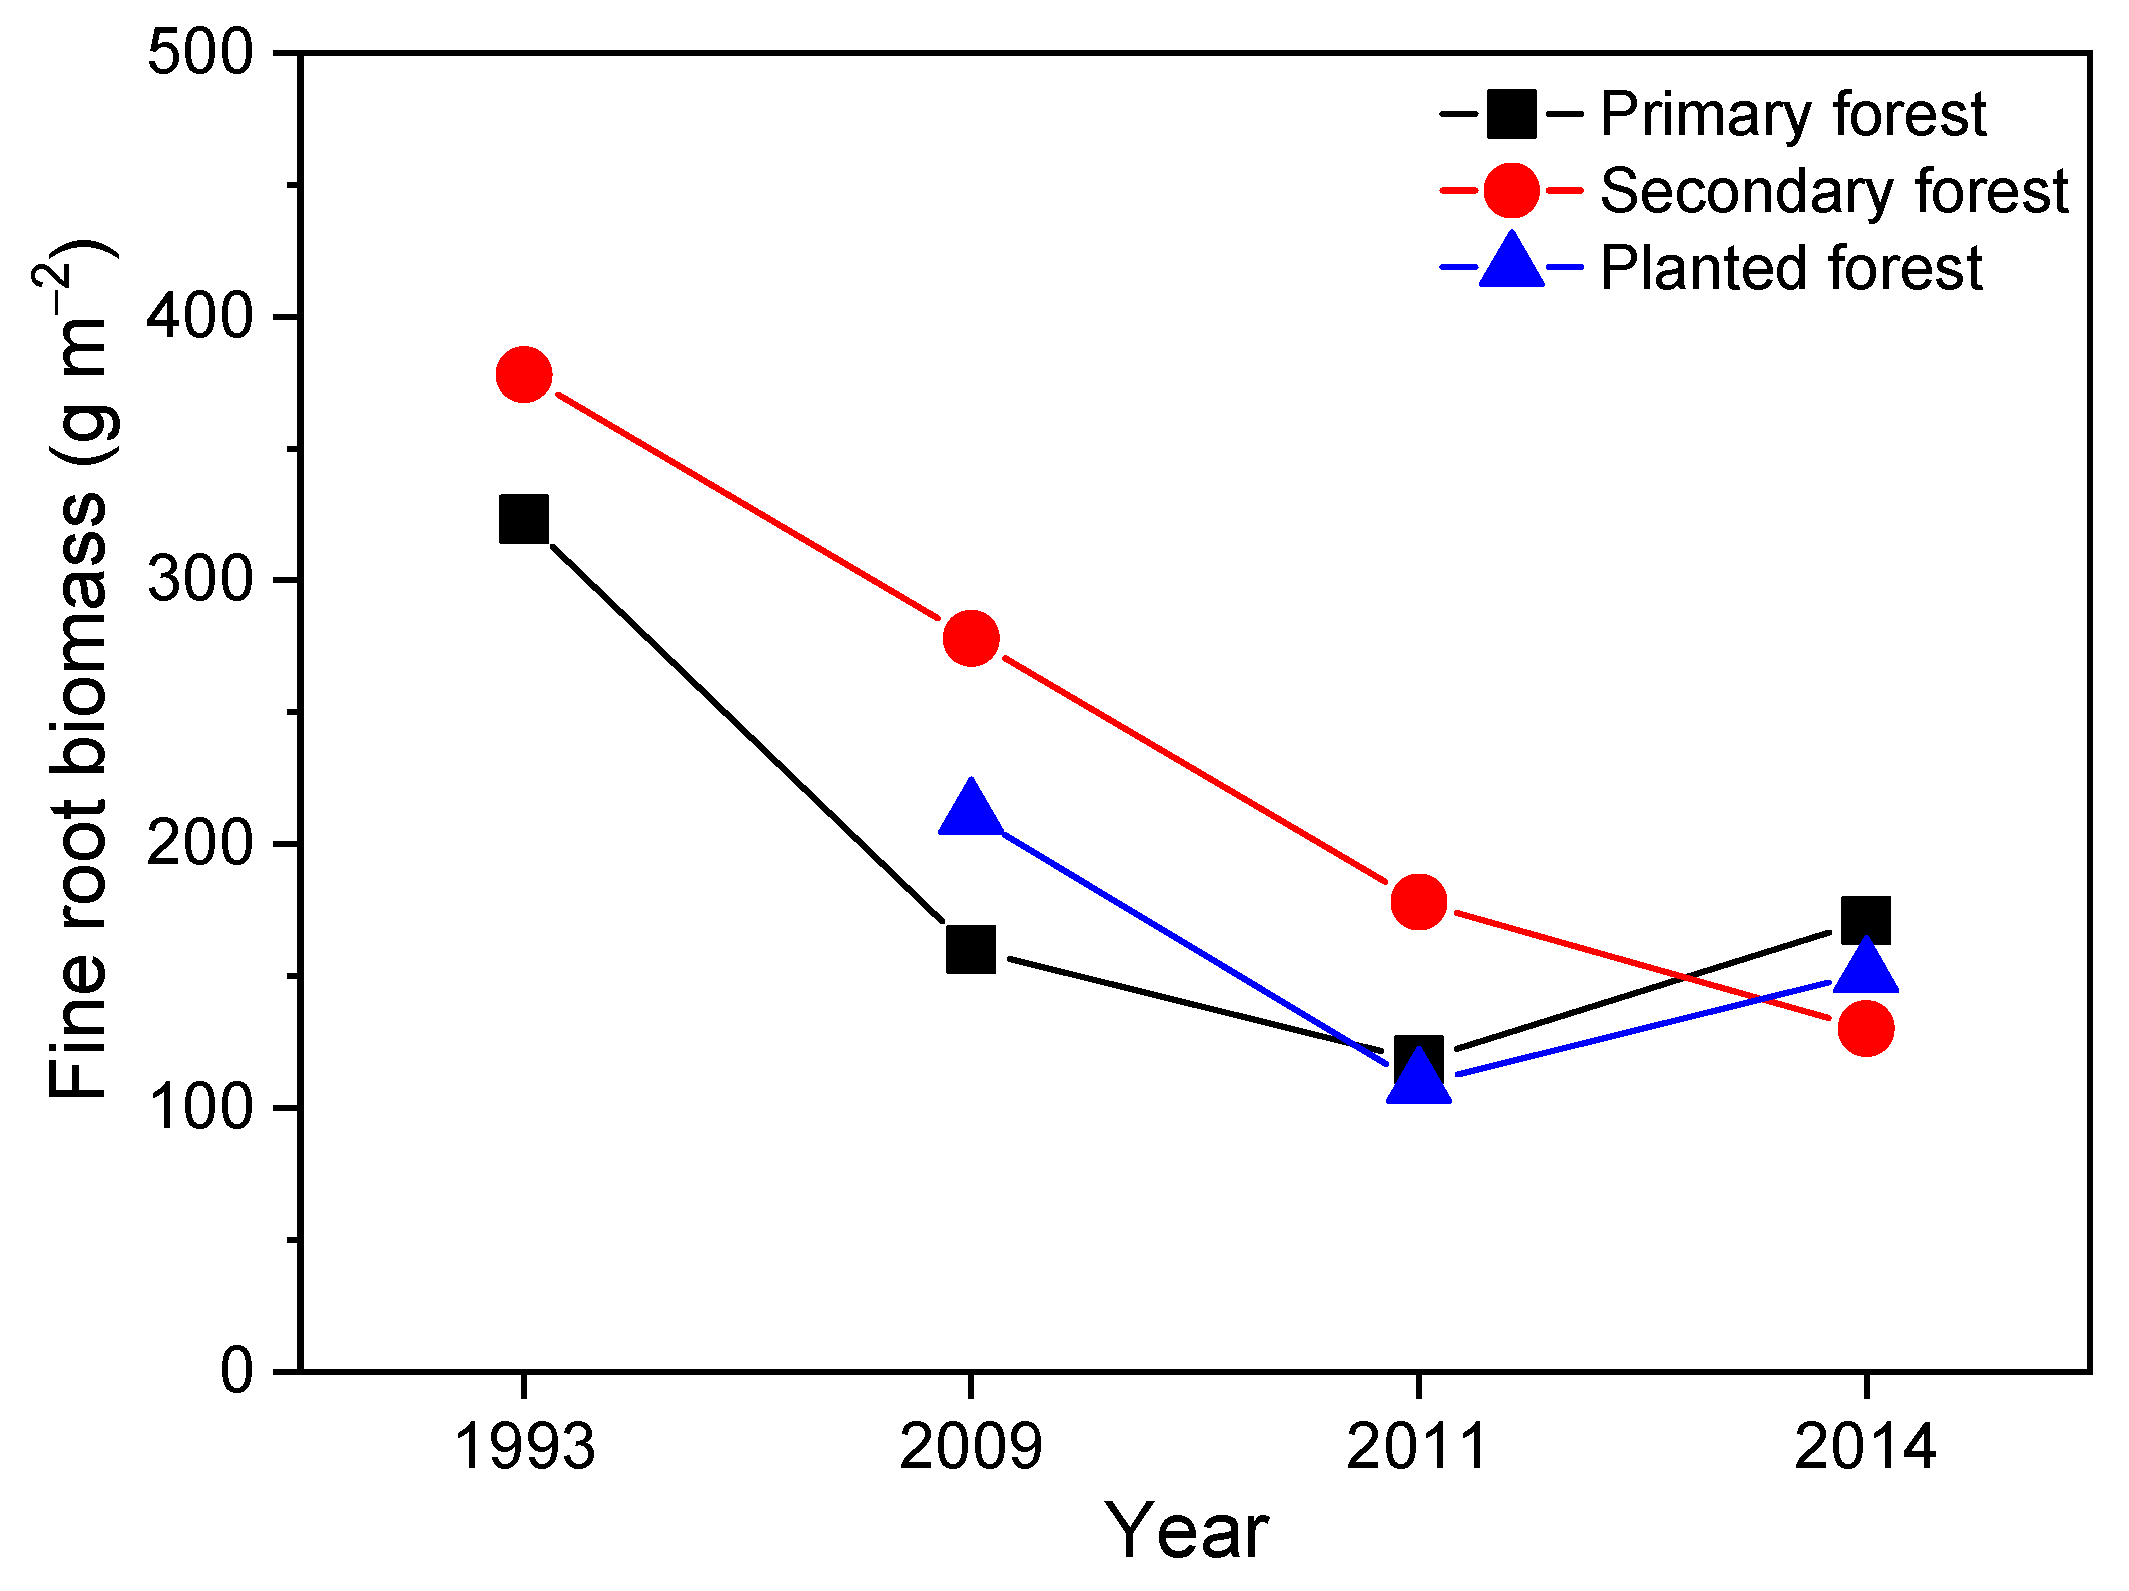
On the other hand, fine root biomass at the 0–10 cm depth of mineral soil amounted to 323 g m−2 at 1993 in the primary forest, and decreased to 160, 118, and 171 g m−2 at 2009, 2011, and 2014 (by 48%, 63%, and 47%, respectively, Figure 2). Similarly, values in the mixed forest decreased from 378 g m−2 at 1993 to 278, 178, and 130 g m−2 at 2009, 2011, and 2014 (by 26%, 53%, and 66%, respectively, Figure 2). In the planted forest, fine root biomass data for 1993 were not available. Values for 2009, 2011, and 2014 were 109, 165, and 151 g m−2 (Figure 2).
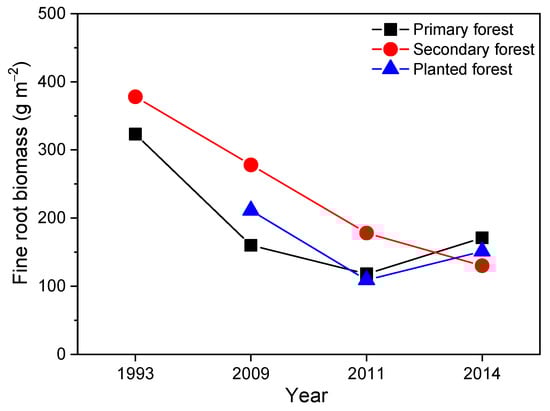
Figure 2.
Fine root biomass in 1993 (Wen et al., 1999) [42], 2009, 2011, and 2014 at 0–10 cm mineral soil in the primary forest, the secondary forest, and the planted forest of Dinghushan Biosphere Reserve in southern China. Data for year 1993 were from Wen et al., (1999) [42]. Others were determined by authors.
3.2. Fine Root Responses
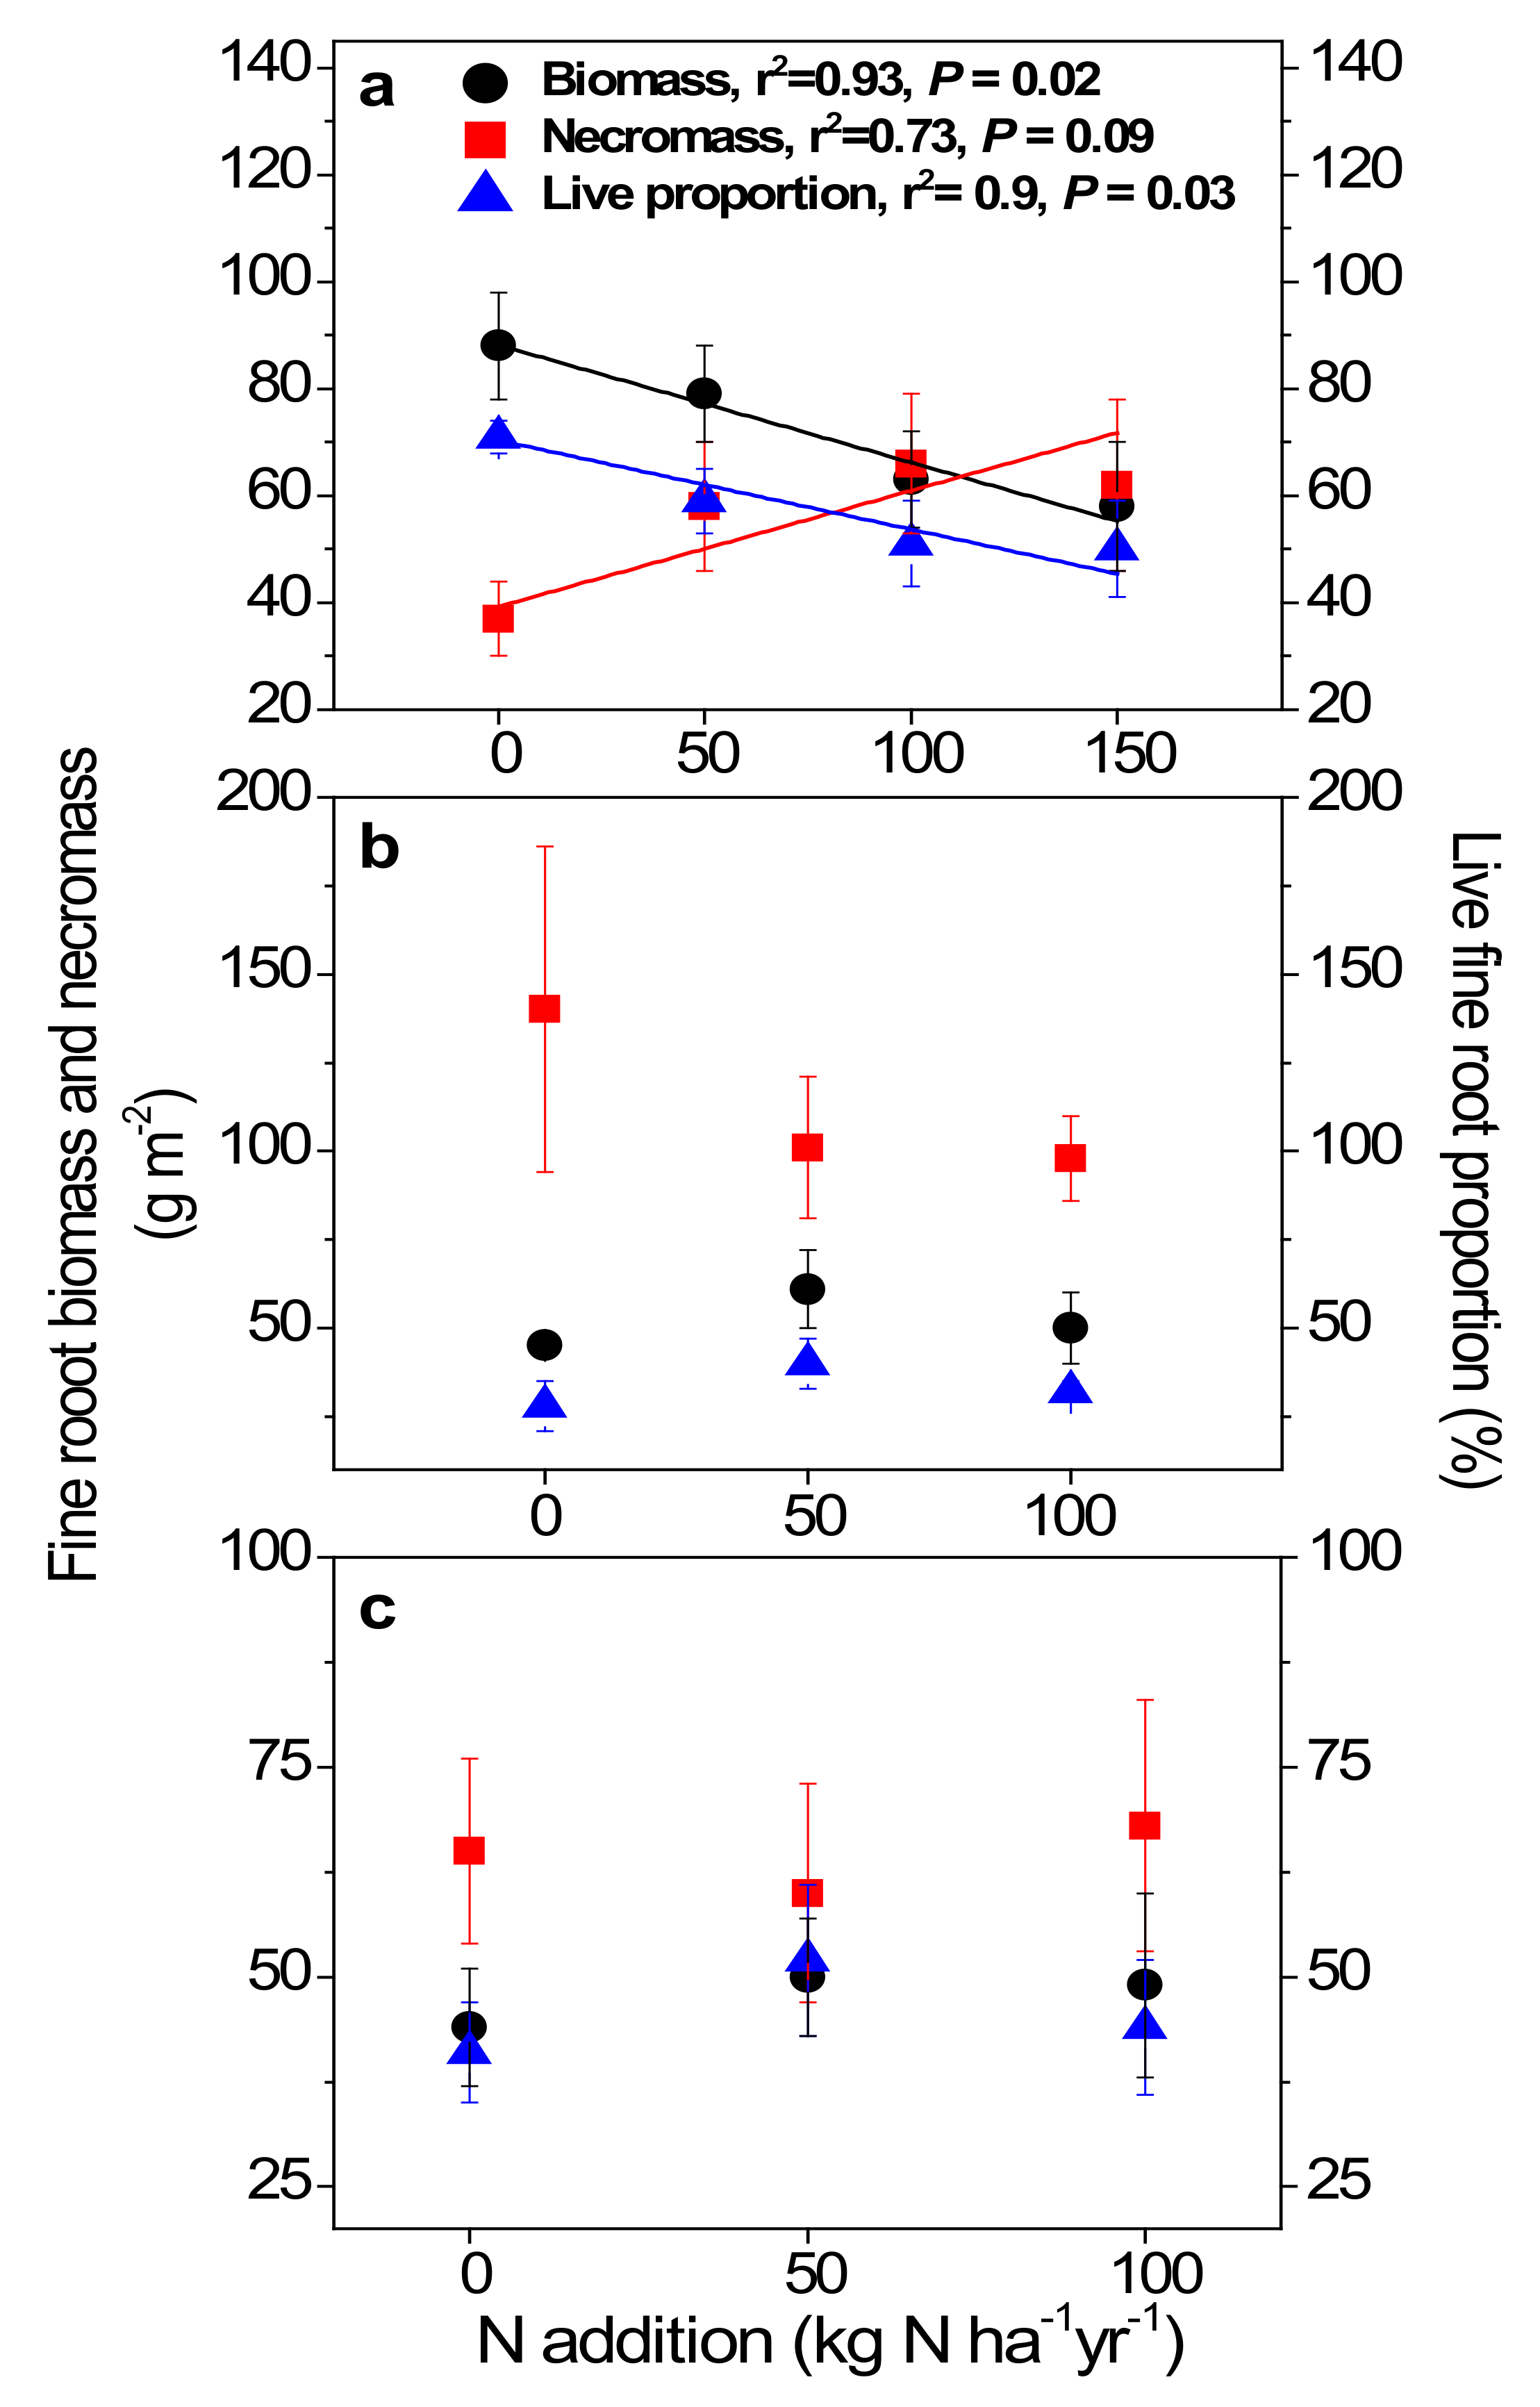
In the primary forest, fine root biomass decreased (p = 0.02), fine root necromass increased (p = 0.09) with increasing treatment rates of inorganic N, resulting in declining live fine root proportion (p = 0.03; Figure 3a). In contrast, no such significant changes in either fine root biomass, necromass, or live fine root proportion were observed in the two younger forests (Figure 3b,c).
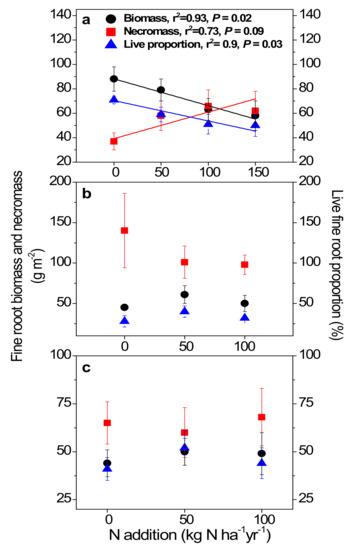
Figure 3.
Fine root biomass, necromass, and live fine root proportion (vitality) in the 0–10 cm mineral soil of the primary forest (a), the secondary forest (b), and the planted forest (c) in southern China following 8 years of N addition. Lines represent significant least-squares linear regression fits, with goodness of fit (r2) and P values reported above the lines. Error bars show SE (n = 3).
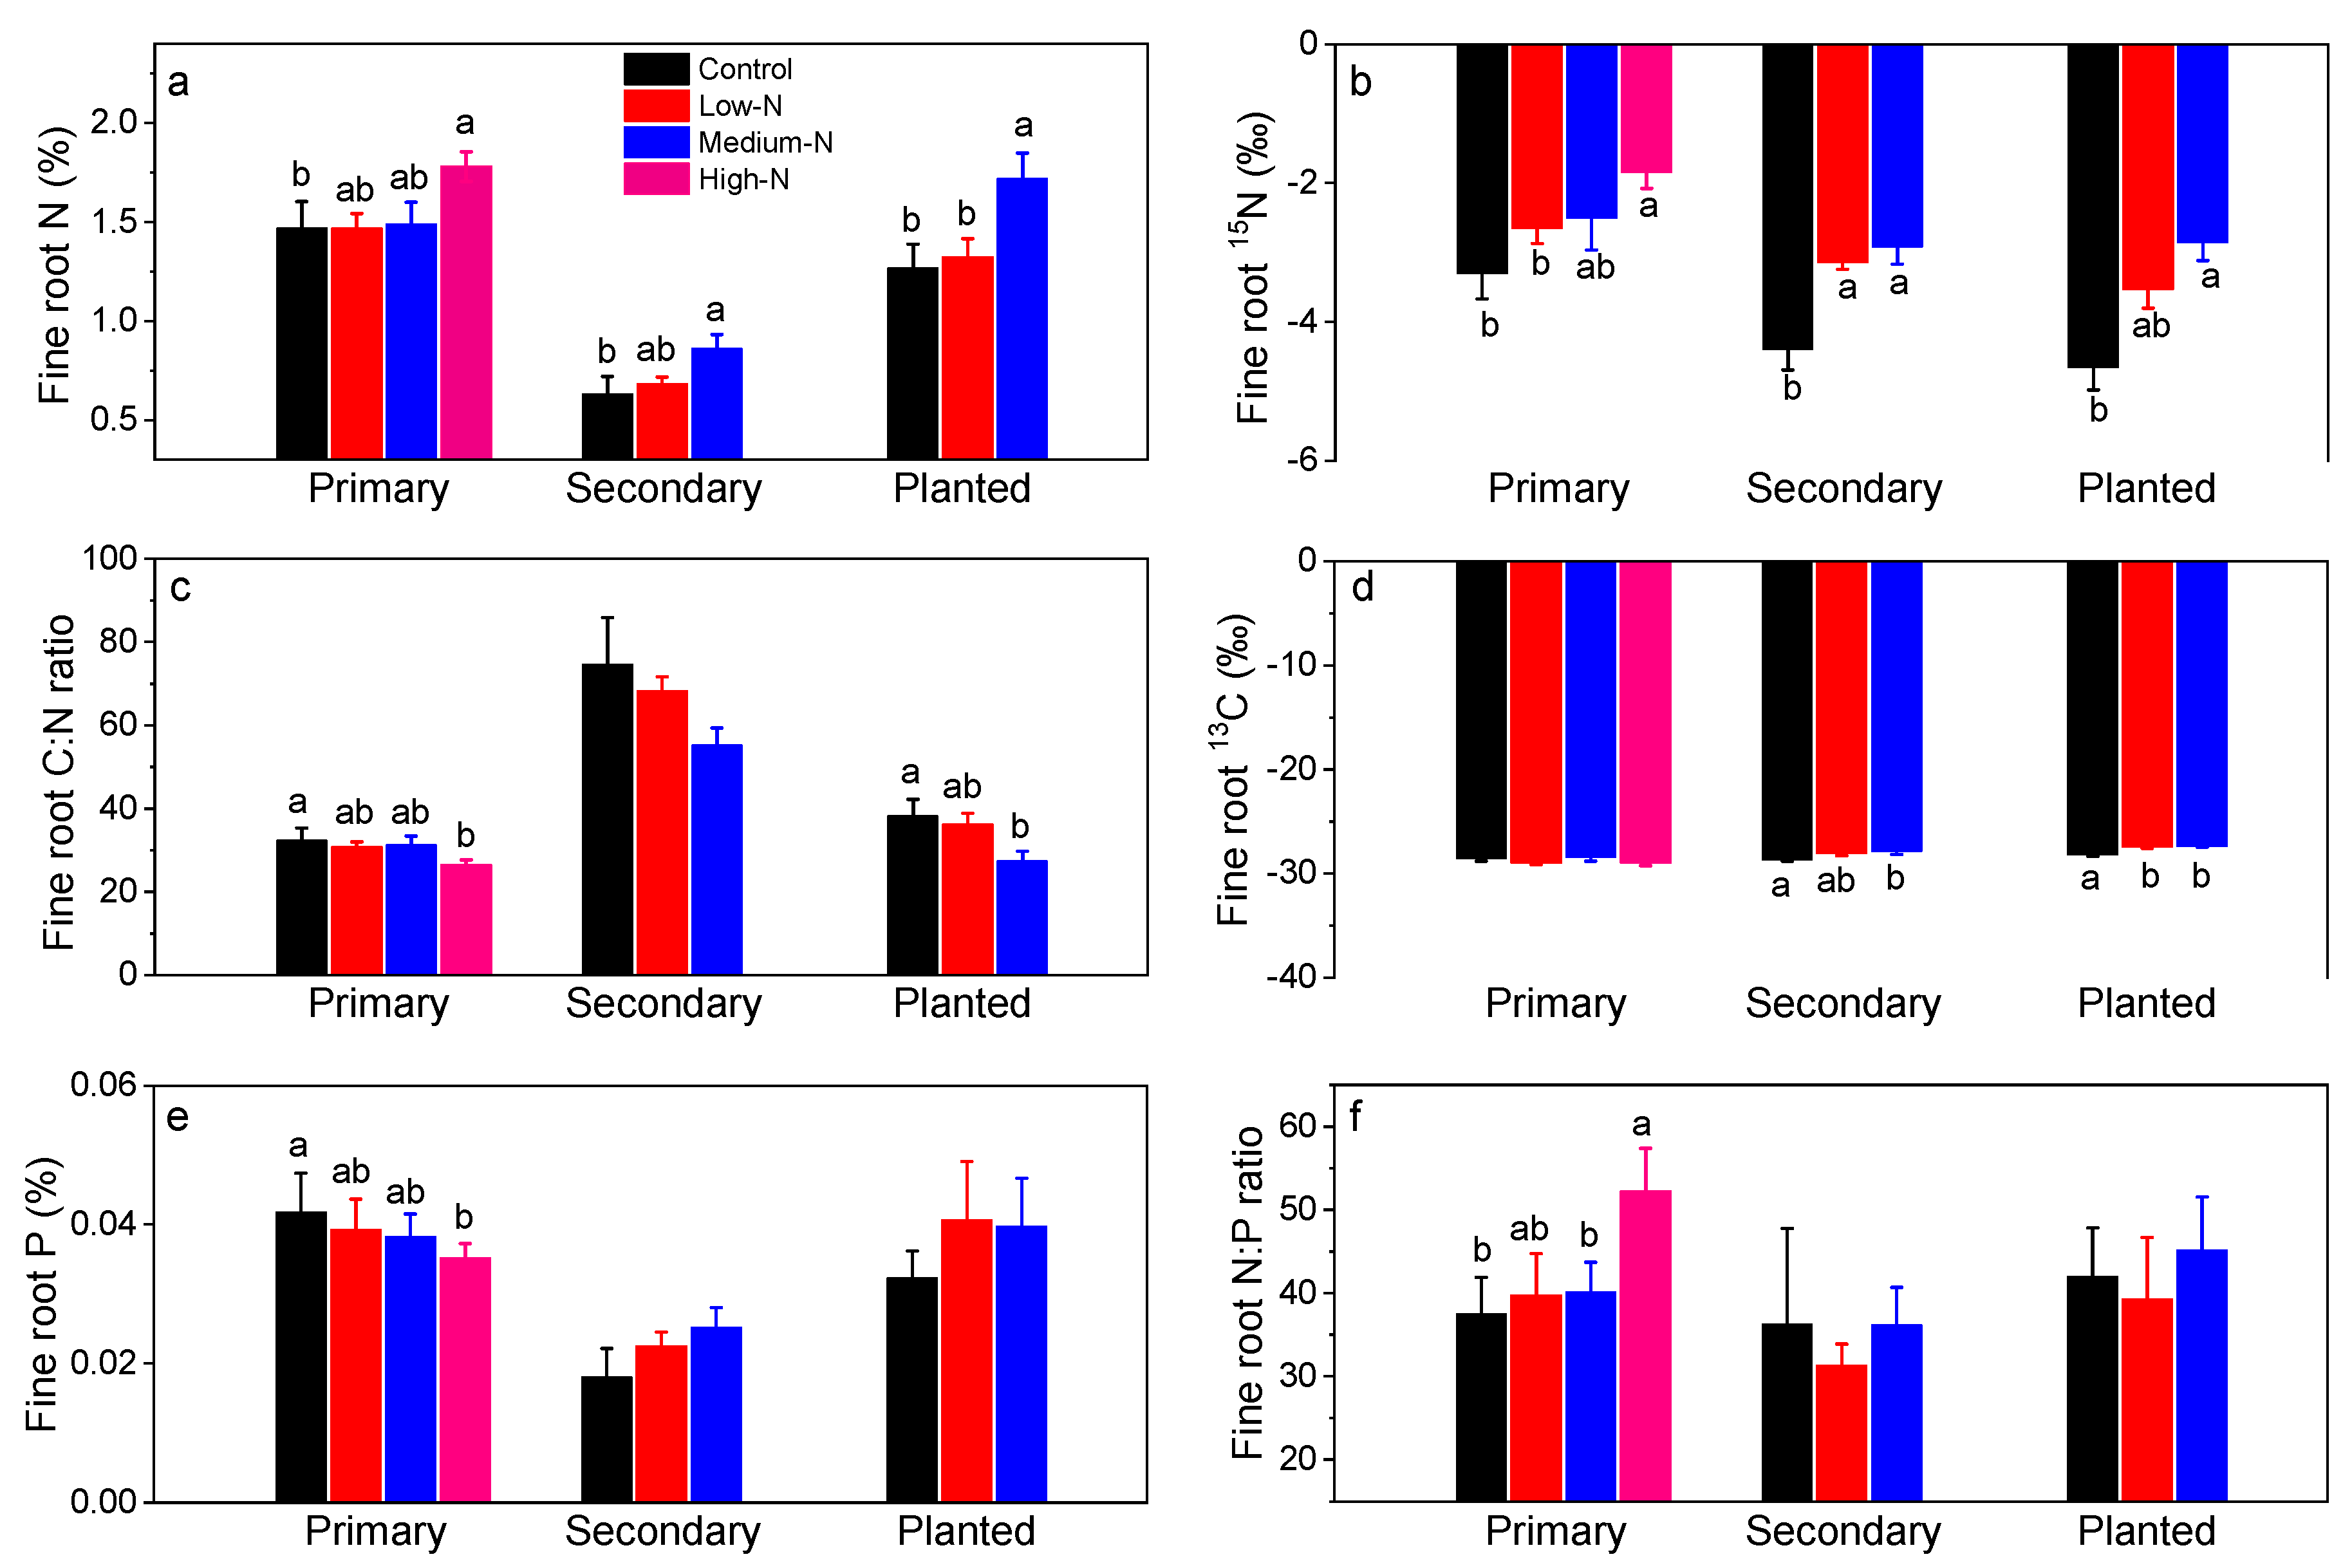
Fine root N content (%) ranged from 0.63% to 1.47% in control plots in these forests and were elevated by 21% after high-N treatment in the primary forest, and by 37% and 35% after medium-N treatments in the secondary forest and in the planted forest, respectively (Figure 4a). Fine root 15N signature (‰) was elevated significantly from −3.3 to −1.8 by high-N treatment in the primary forest, from −4.7 to −3.1 and −2.9 after low-N and medium-N treatments in the secondary forest, and from −4.4 to −2.9 by medium-N treatments in the planted forest (Figure 4b; all p < 0.05). Fine root C:N ratio decreased significantly from 32.3 to 31.2 in high-N plots in the primary forest, and from 38.2 to 27.4 in medium-N plots in the planted forest (Figure 4c). Fine root 13C signature averaged −28.2 in these forests, and was increased significantly by N treatments in the secondary and the planted forests (all p < 0.05; Figure 4d). On the other hand, fine root P content decreased significantly only after high-N treatment in the primary forest, resulting in significantly lower fine root N:P ratio (Figure 4f).
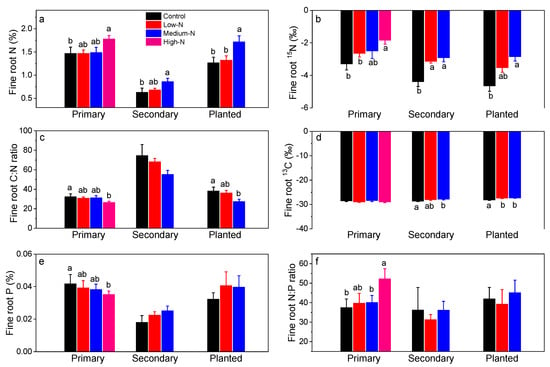
Figure 4.
Fine root N concentration (%, a), 15N signature (‰, b), C:N ratio (c), 13C signature (‰, d), P concentration (%, e), and N:P ratio (f) after 8 years of low-N, medium-N, and high-N treatments in the three forests of southern China. 15N signature of N source (NH4NO3) was 3.6‰ (±0.03‰). Different lowercase letters indicate significant differences among treatments (p < 0.05). Error bars show SE (n = 3).
Fine root Fe increased by 88% following high-N treatment with respect to that in the control in the primary forest (Table 2). Increases in fine root Fe corresponded with increases in soil exchangeable Fe3+ in this forest (Table 3). In the secondary forest, fine root Al and Fe concentrations increased significantly following low-N treatment (Table 2); fine root K in this forest increased in both low-N and medium-N treatments (Table 2). In contrast, in the planted forest, no significant responses in fine root cation concentration were observed (Table 2). Fine root Ca:Al molar ratio averaged 0.5, 1.0, and 0.7 in control plots in the three forests, respectively, and was not significantly altered by N treatment in any forest (Table 2).
Table 2.
Fine root K, Na, Ca, Mg, Al, and Fe concentrations and Ca:Al molar ratio. Unit is mg g−1 fine root dry mass. Different lower case letters indicate significant difference between treatments in each forest (One-way ANOVA, LSD test, p < 0.05).
Table 3.
Soil exchangeable cation concentrations, Ca:Al molar ratio and Al/(Ca + Mg). Unit is mmol kg−1 dry soil. Different lower case letters indicate significant difference between treatments in each forest (One-way ANOVA, LSD test, p < 0.05).
3.3. Soil Responses
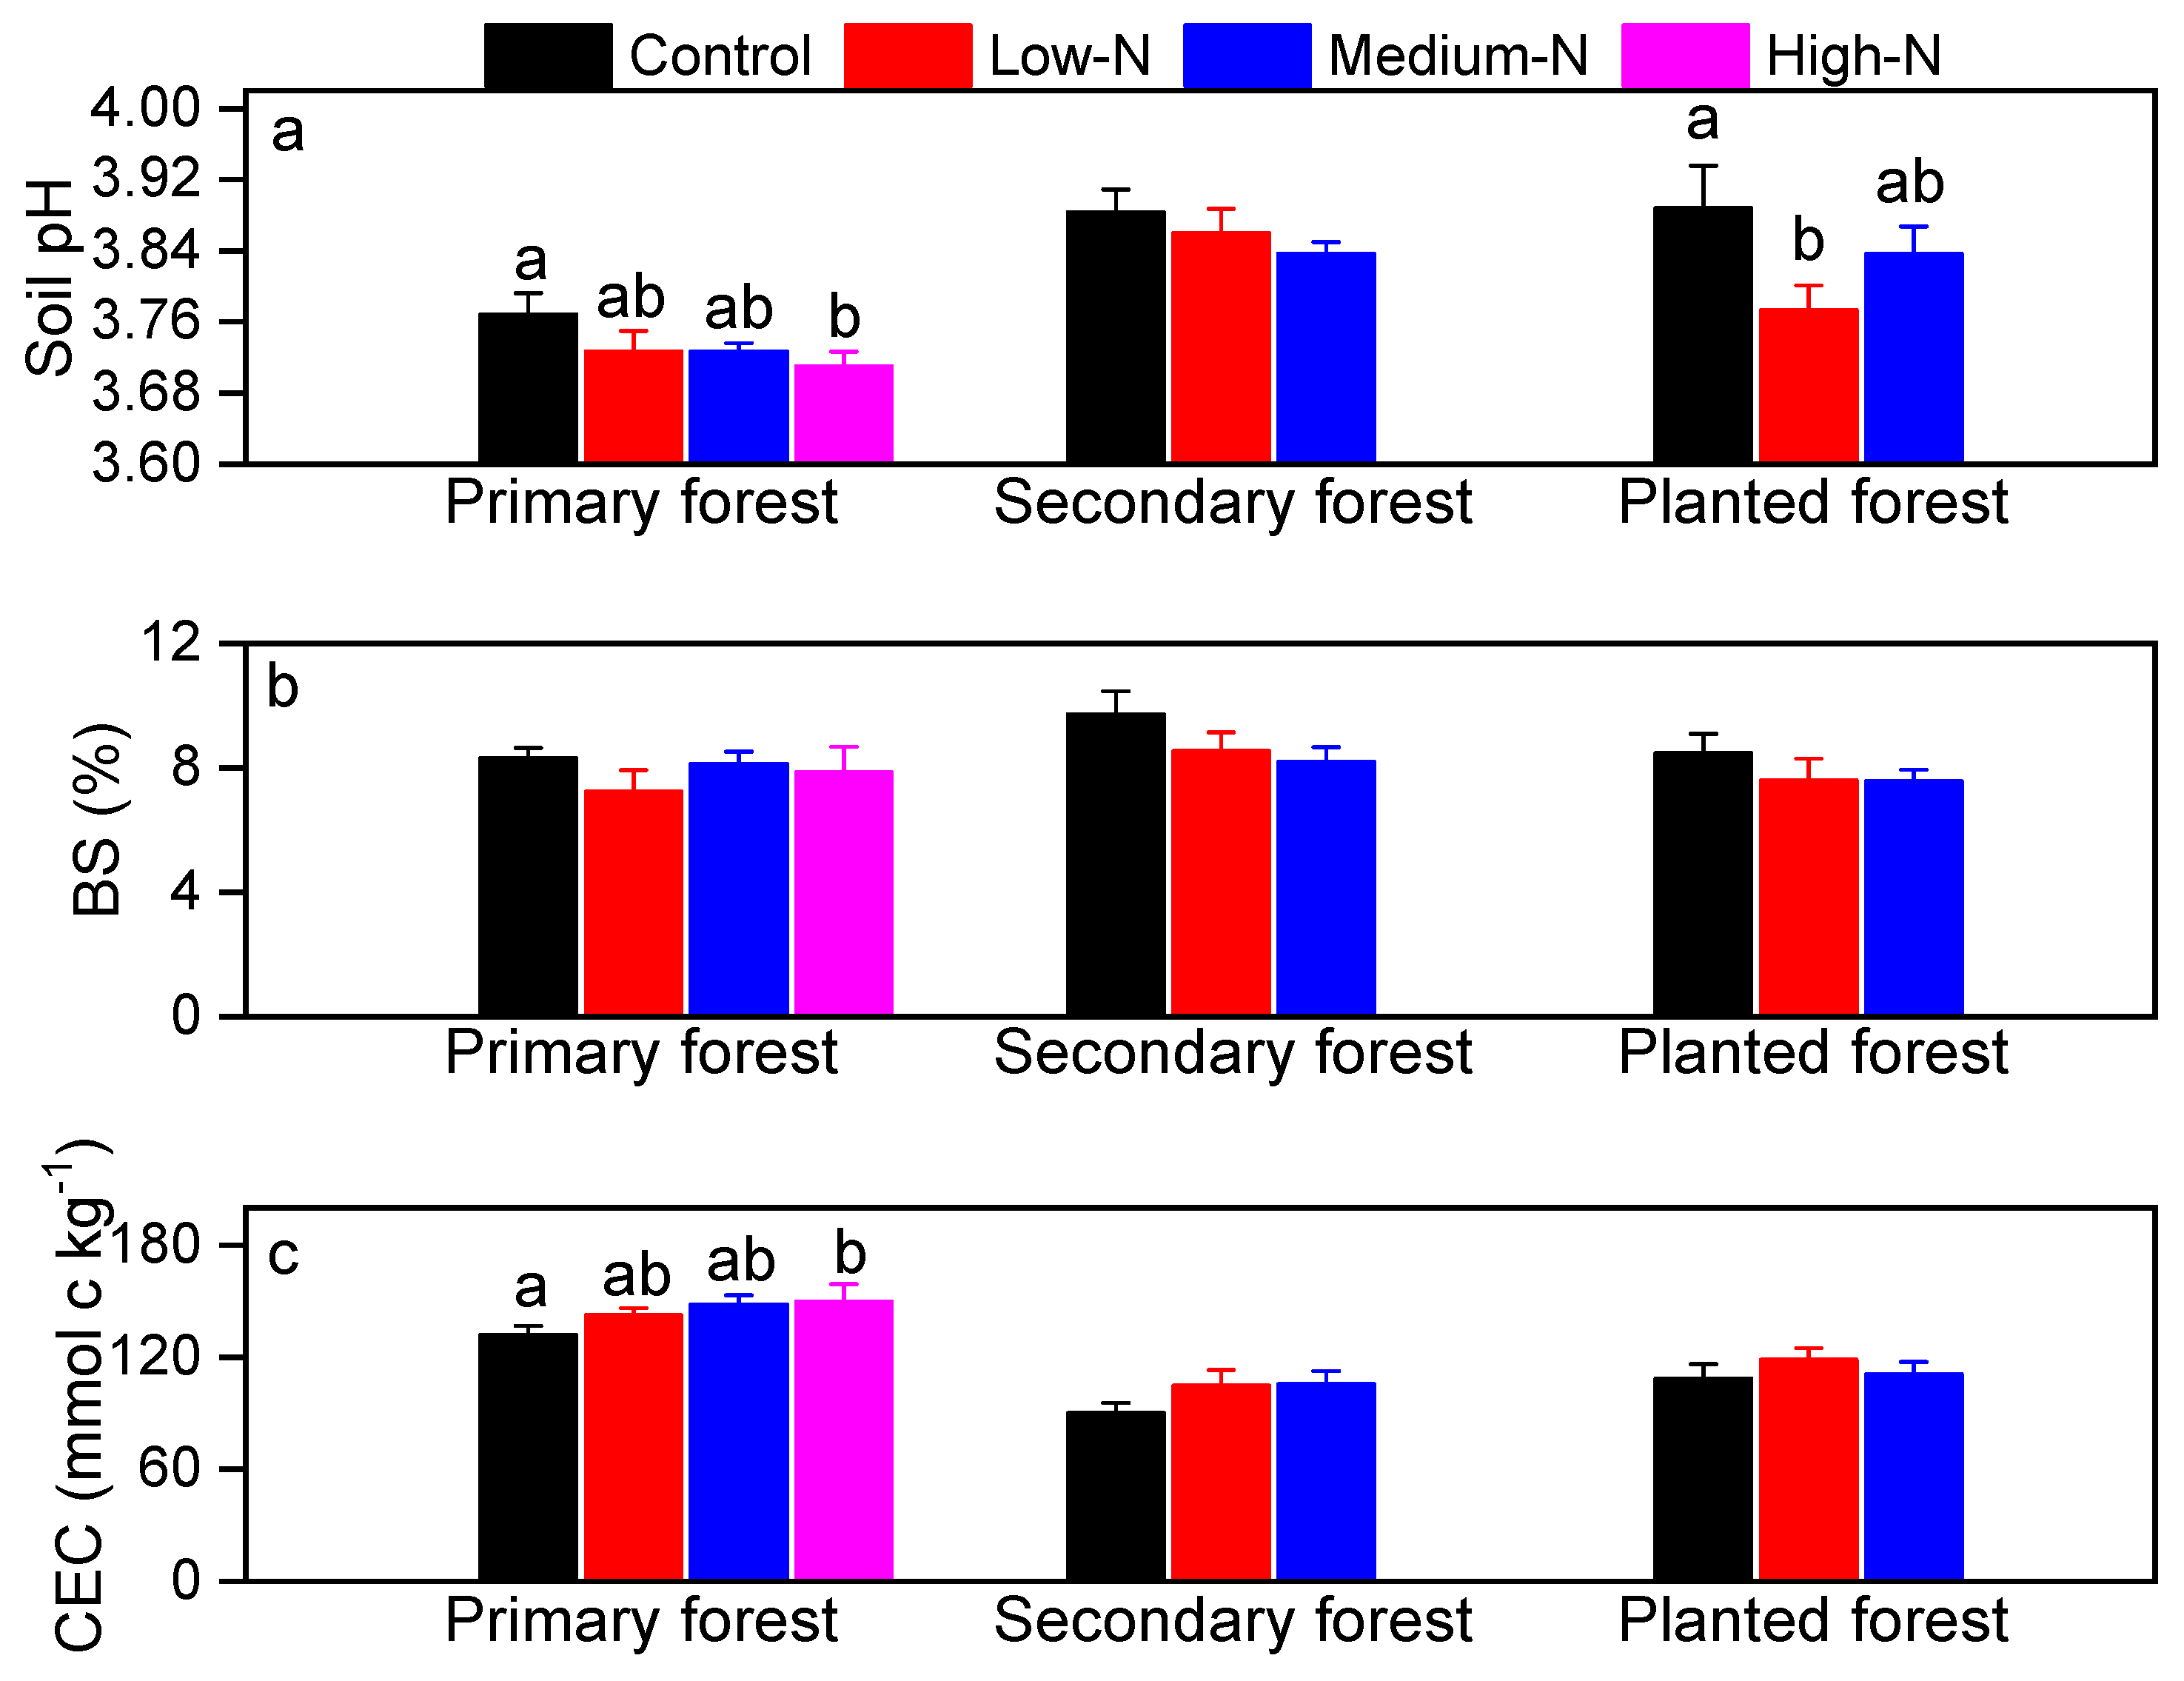
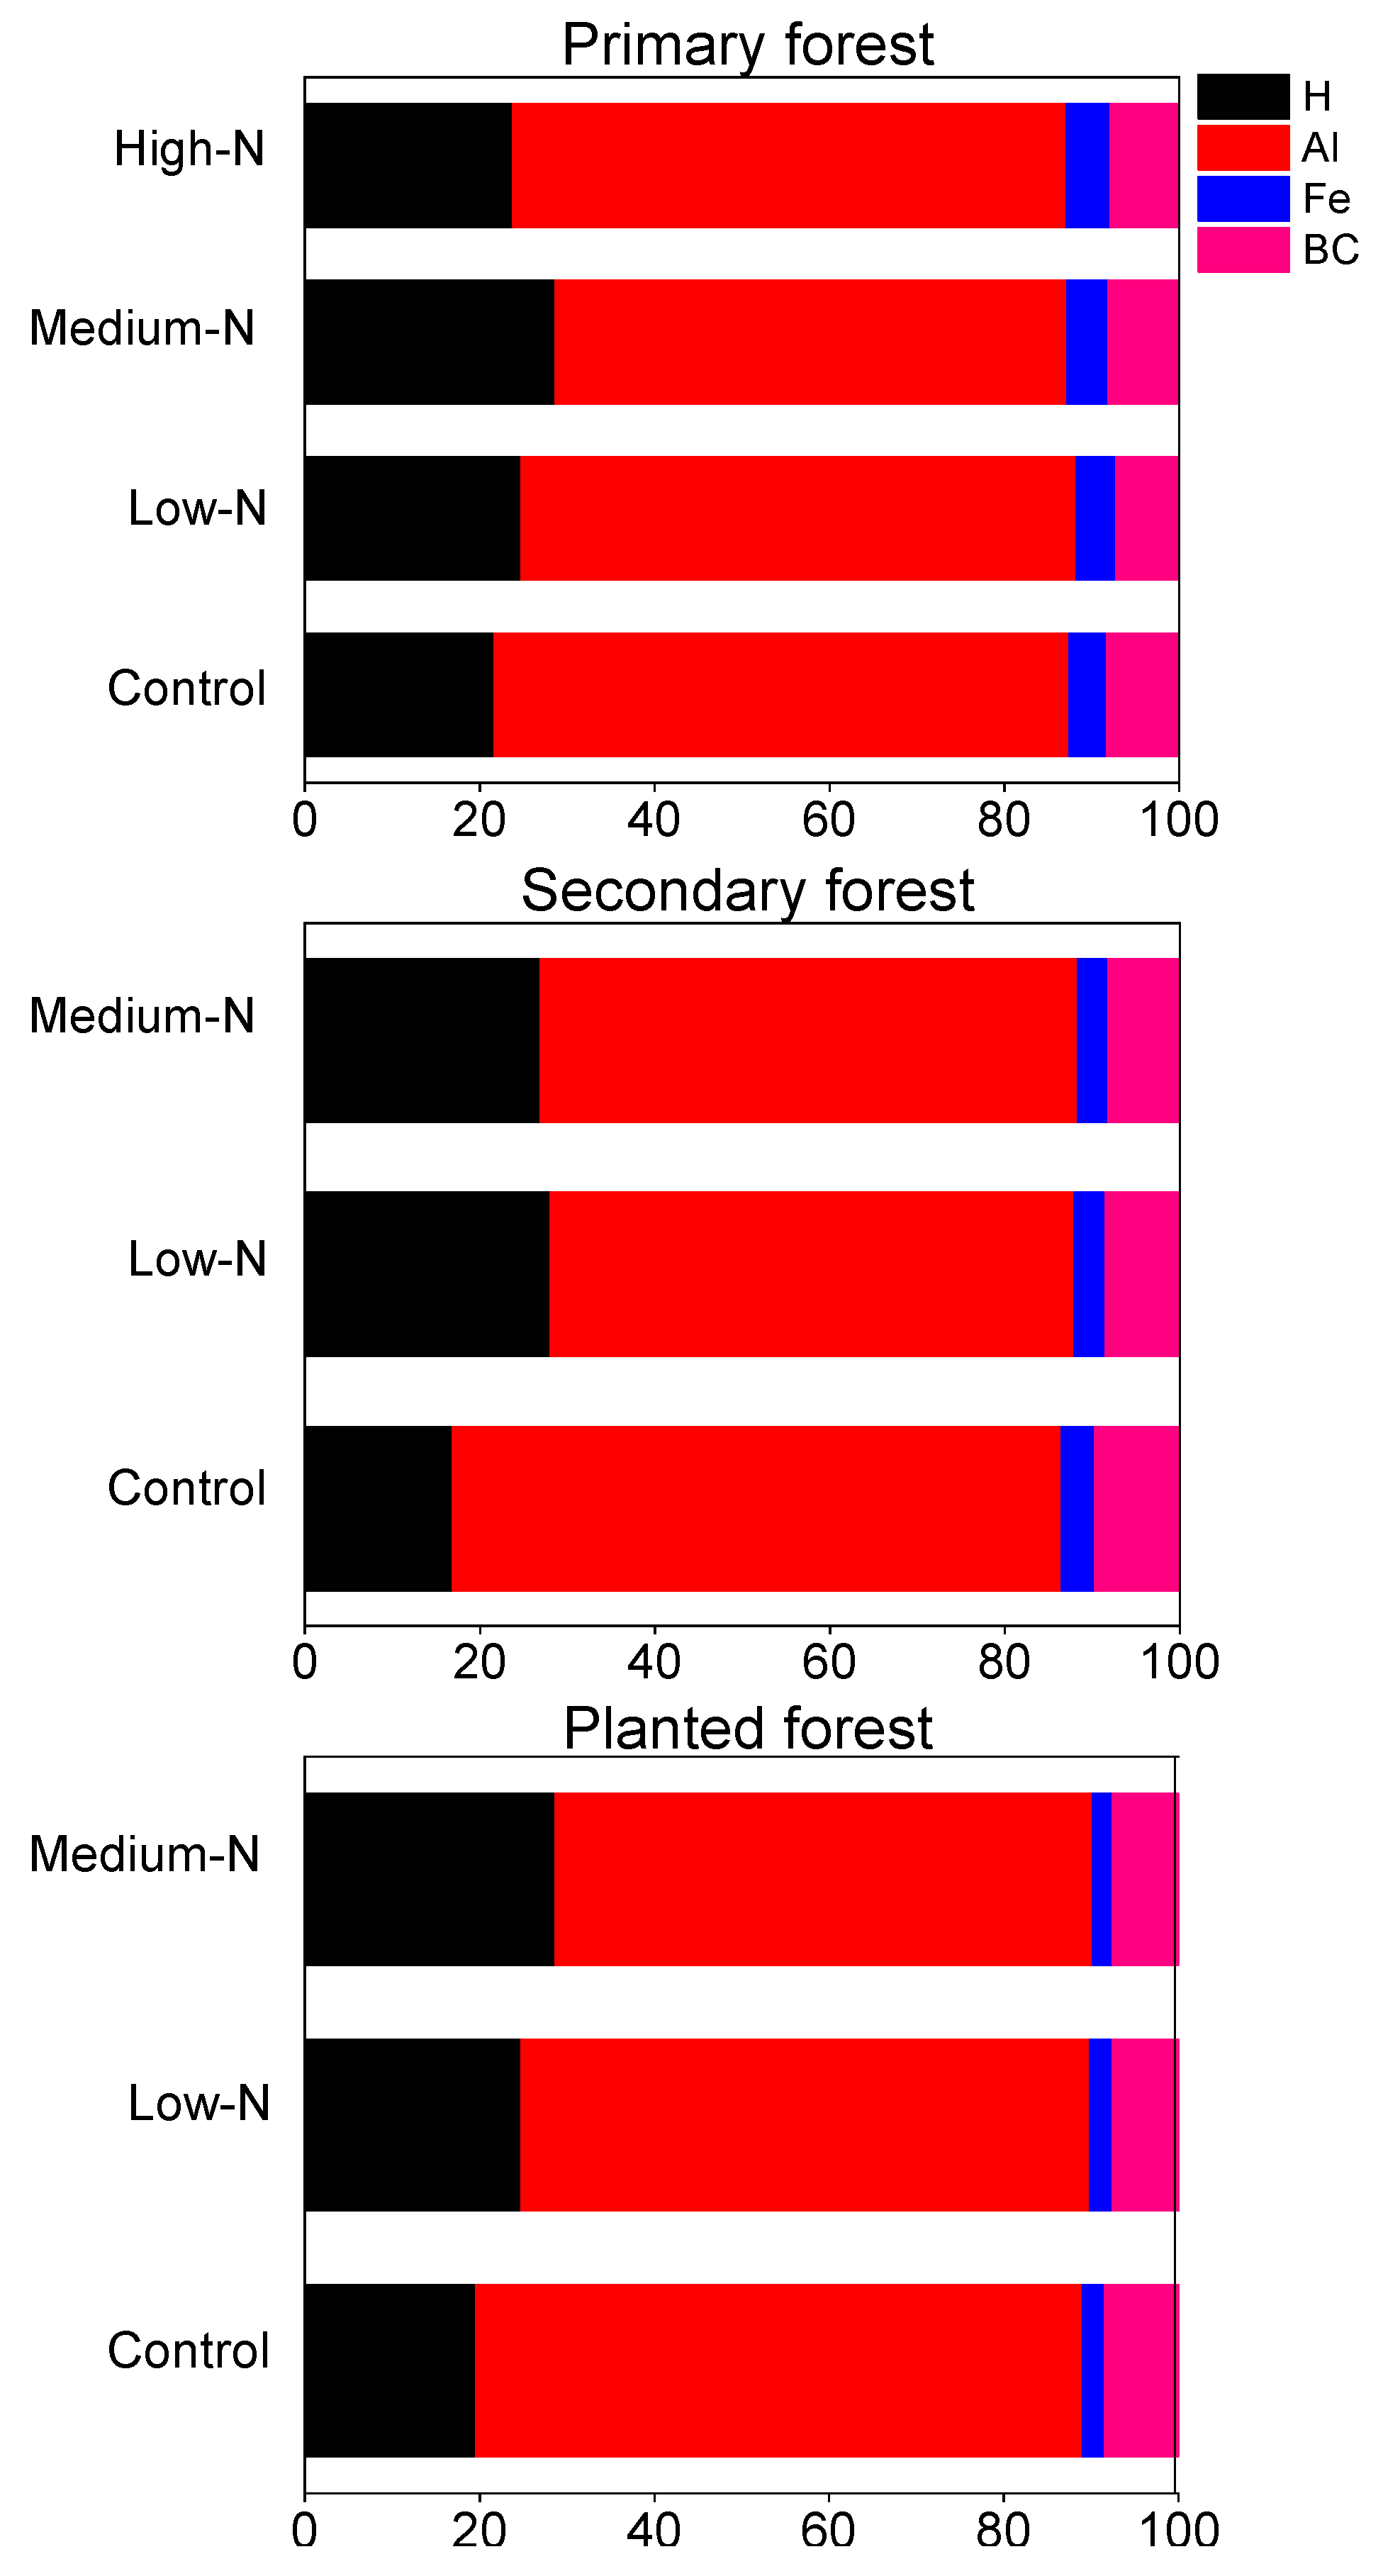
Soil pH values averaged 3.76, 3.88, and 3.88 in the primary, the secondary, and the planted forests, respectively (Figure 5a). Base cations accounted for on average 8% of total exchangeable cations in all the three forests (base saturation, BS, sum of K+, Na+, Ca2+, Mg2+, Figure 5b). Cation exchange capacity (CEC) ranged from 80 to 130 mmolc kg−1, and was highest in the primary forest (Figure 5c). Consistent with the low pH values of these soils, exchangeable cation pools were dominated by Al3+ in all three forests, followed by H+, with Al3+ proportioned 48% to 89% and H+ proportioned 17% to 29% (Table 3; Figure 6). Soil Ca:Al molar ratio averaged 0.1, 0.12, and 0.12 in control plots in all three forests (Table 3). The Al3+/(Ca2+ + Mg2+) averaged 8.2, 6.9, and 7.8 in control plots in the three forests (Table 3).

Figure 5.
Soil pH (a), base saturation (BS, %, b), cation exchange capacity (CEC, c) in the primary forest, the secondary forest, and the planted forest in southern China after 8 years of N additions. Different lowercase letters indicate significant differences among treatments (p < 0.05). Error bars show SE (n = 3).
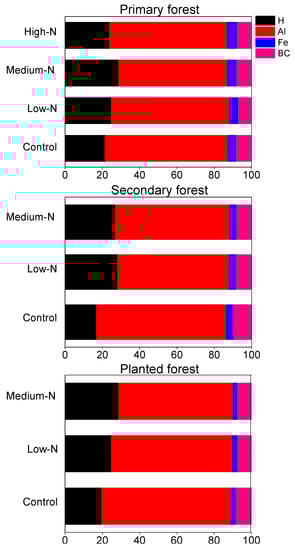
Figure 6.
Effects of 8 years of N addition on the relative proportion (%) of soil exchangeable H+, Al3+, and Fe3+ and base cations (at an equivalent basis; sum of K+, Ca2+, Na+, Mg2+) at 0–10 cm mineral soils in the primary forest, the secondary forest, and the planted forest in southern China.
After 8 years of N additions, soil pH decreased by 0.06 pH units after high-N treatment in the primary forest (p = 0.043; Figure 5a) and by 0.115 pH units after low-N treatment in the planted forest (p = 0.04; Figure 5a). Base saturation in all three forests showed decreasing trend, but failed to be significant (Figure 5b). CEC became significantly higher after high-N treatment only in the primary forest (p = 0.04; Figure 4c). No significant responses of BS or CEC to N treatments were found in other treatments or forests (Figure 5). Soil exchangeable H+ increased significantly by 50% and 55% following medium-N and high-N additions in the primary forest (p = 0.028 and 0.022; Table 3). Soil Fe3+ increased by 34% after high-N treatment in the primary forest (p = 0.015; Table 3). In contrast, soil exchangeable Ca2+ and Mg2+ decreased by 54%, 64% and 50%, 63% following medium-N and high-N treatments in this forest (p = 0.015, 0.01, 0.024, 0.02, respectively; Table 3). In the planted forest, soil exchangeable K+ and Mg2+ decreased following low-N and medium-N treatments (p = 0.04 for both; Table 3). No other significant responses were found in either forest, including soil exchangeable Al3+, Ca:Al molar ratio or Al3+/(Ca2+ + Mg2+) (Table 3). Relative proportion of H+, Al3+, Fe3+, and base cations to total exchange cation capacity was not significantly changed by N treatments at any N level in any forest (Figure 6).
3.4. Relationships between Fine Root and Soil Responses
To discern the mechanisms behind fine root response and detect the relationship between fine roots and soil responses, we correlated fine root biomass, necromass, and live fine root proportion with related soil and fine root parameters (Table 4). In the primary forest, fine root biomass negatively correlated with fine root Fe concentrations (p < 0.05; Table 4), while fine root necromass negatively correlated with soil pH (p < 0.05; Table 4). In the planted forest, fine root biomass correlated positively with soil exchangeable Ca2+ concentration (p < 0.05; Table 4) and Ca:Al ratio (p < 0.01; Table 4), negatively with soil exchangeable Al3+ (p < 0.05; Table 4) and Al3+/(Ca2+ + Mg2+) ratio (p < 0.01; Table 4).
Table 4.
Pearson’s correlation coefficients among soil and fine root variables.
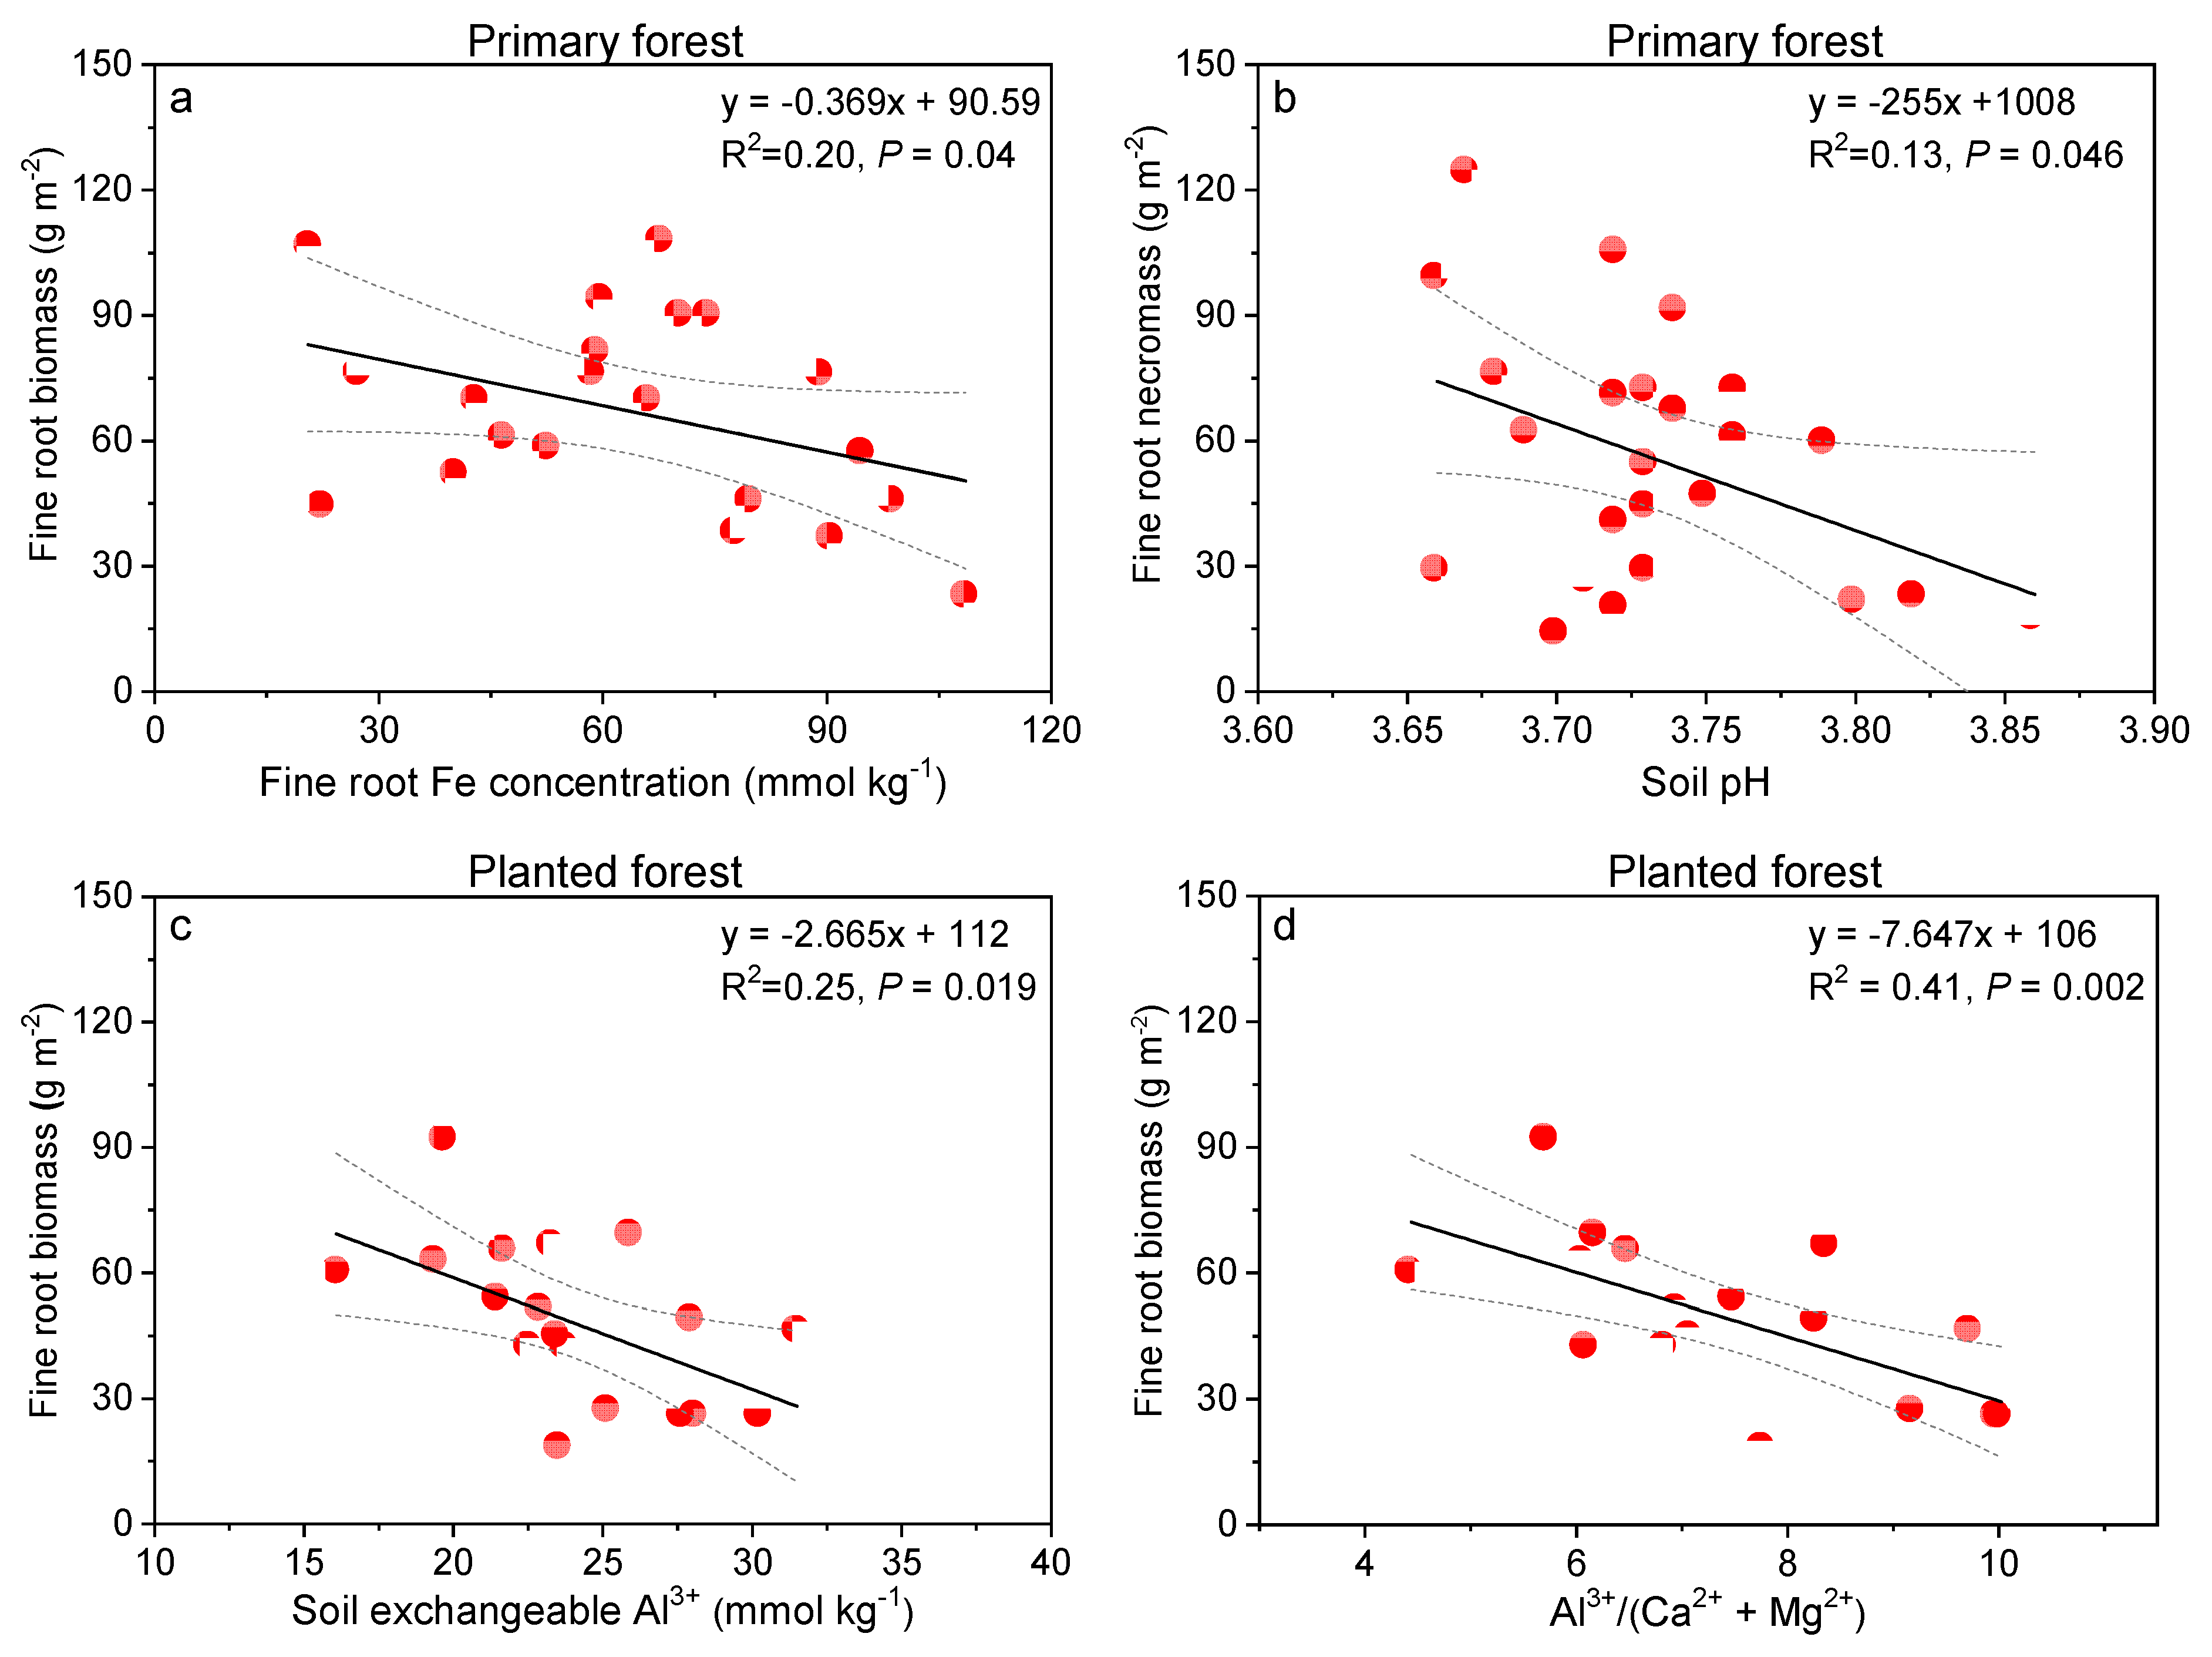
When examined specifically, fine root Fe concentration explained around 20% variation in fine root biomass decreases in the primary forest (p = 0.04, Figure 7a). On the other hand, soil pH decreases in this forest contributed around 13% of fine root necromass increases in this forest (p = 0.046; Figure 7b). In the planted forest, we showed fine root biomass decreased significantly with soil exchangeable Al3+ (25% explanation p = 0.019; Figure 7c), and Al3+/(Ca2+ + Mg2+) ratio (41% explanation, p = 0.002; Figure 7d).
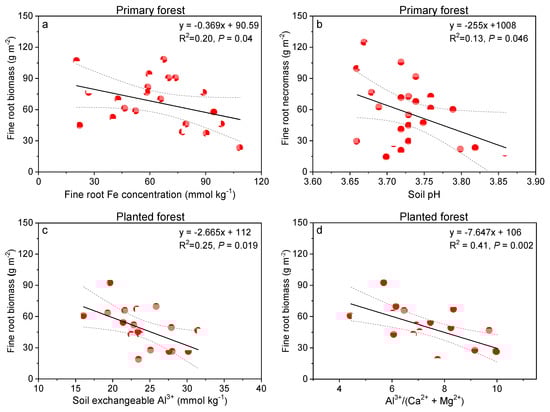
Figure 7.
Relationships between fine root Fe concentration (mmol kg−1) and fine root biomass (g m−2, a), soil pH and fine root necromass (g m−2, b) in the primary forest, and between soil exchangeable Al3+ (mmol kg−1, c), Ca:Al ratio (d), and fine root biomass (g m−2) in the planted forest in southern China after 8 years of N treatment.
4. Discussion
Our results showed that eight years of N additions resulted in lower fine root vitality (live fine root proportion) in the N-saturated primary forest, which was the result of decreased fine root biomass, but increased fine root necromass. The declining fine root vitality occurred in association with soil pH decline and fine root Fe accumulation, which reflected the pattern of soil exchangeable Fe3+ mobilization accompanying decreased soil pH. These response patterns of fine root biomass decrease in association with soil pH decline were also reflected in the long-term trend of changes in fine root biomass and soil pH in these study sites. Furthermore, soil exchangeable Ca2+ and Mg2+ also decreased after N treatments, although fine root Ca and Mg concentration failed to respond significantly. In fact, chemistry analysis of soil drainage solution from this experiment also showed a great decrease in pH of soil solution at 20 cm depth (as large as 0.2 units), with greater mobilization of base cations (Ca2+, Mg2+) draining with NO3− to deeper soils [43]. Given the rather low soil pH (3.76~3.88) and low base saturation of average 8% in these forest soils, we suggested soils and fine root growth and vitality in these forests to be rather sensitive to further N or acid input. Results from this study and companion studies evidenced that chronic N deposition can accelerate soil acidification, driving soil Ca2+ and Mg2+ deficiency, with uniqueness of minor Al3+ response, but with Fe3+ mobilization in some tropical forests [28,43], which could have been negative for fine root growth and vitality therein. This is different from the often observed N-induced Al3+ mobilization in temperate/boreal forests. In this study, we will focus on fine root responses. For more detailed depiction of soil acidification responses, please refer to our parallel studies of [26,28,43].
4.1. Historical Trend in Soil pH Changes and Fine Root Biomass in the Three Tropical Forests
Soil pH in all three forests showed significant decreases from 1980s to 2010s, as shown in Figure 1. The decrease rates were highest in the planted forest (−0.035 units per year), followed by that in the primary forest (−0.032 units per year) and the secondary forest (−0.026 units per year). These rates are comparable to or slightly higher than those estimated for forest soils across China which showed −0.02 units change in pH per year from 1981–1985 to 2006–2010 in south central China including Guangdong province [44]. Our rates were also comparable to what was estimated for evergreen broadleaved forests (−0.025 units per year from 1980s to 2000s) which dominated in our primary forest and secondary forest in Dinghushan [45]. These decreasing trends could be driven by high ambient N deposition in this region in southern China (bulk deposition, 33 kg N ha−1 yr−1) [25]. To test this hypothesis, we examined the relationship between soil pH and wet/bulk deposition during 1980s to 2010s [41]. It was indicated that soil pH negatively correlated with the strength of ambient N deposition in two of our study forests, suggesting the differences in atmospheric N deposition can partially explain the soil pH decreasing trend. In fact, on average, 0.36 units decrease in soil pH was detected in China’s forest soils in the period of 1981–1985 to 2006–2010, with the most serious pH decline in southwest China (0.63 pH units), followed by northeast China (0.55 pH units) and south central China (0.50 pH units) [44]. By dividing sources, they found acid input from atmospheric deposition (84% explanation) as the most important factor in the pH decline, against forest growth and harvest [44]. Thus, high ambient N deposition could have contributed to historical soil pH decline in our studied forests. Dry N deposition could also have contributed to regional soil pH decline, since it can form a proportion of 9.6 to 53.6% (average 23.5%) to total N deposition across China [46]. Thus, it is highly possible that dry N deposition could promote soil acidification processes [26,47]. However, this was not evaluated in this study due to paucity of data.
Soil pH decline in these tropical forests implied that they had experienced obvious and continuous soil acidification driven by various factors [44]. In fact, national scale soil acidification has been detected in various types of ecosystems in China, including crop lands [48], grasslands [49], broadleaved forests [45], and forests in general [44]. Drivers for forest soil acidification mainly include acidic and N, S deposition, soil base cation depletion driven by forest growth, and high precipitation [45]. Acidic and N, S deposition can drive soil base cation leaching and depletion. Forest growth, especially high-nutrient-demanding secondary and young planted forests, will sequester large amounts of base cation nutrients into wood biomass. High precipitation has become more frequent across China, which will enhance base cation leaching from surface soil [50]. Thus, these factors combined could reduce soil base cations in forest soils, which will weaken the buffering capacity of soils and lead them to be more sensitive to external acid input.
Furthermore, a long-term decreasing trend in fine root biomass was also detected in our study forests. In the primary and the secondary forest, fine root biomass in the surface soil decreased by 26% to 66% when compared to that of two decades ago in 1993 [42]. In addition, both live (88 g m−2, 0–10 cm, 2011) and total fine root biomass (125 g m−2, 0–10 cm, 2011) determined in this study are at the low end of ranges reported from other undisturbed lowland tropical forests. They exceeded only one study from tropical forests in La Selva, Costa Rica (live, 74 g m−2, total, 85 g m−2, 0–20 cm depth) [51]. The decreasing trend (Figure 2) and relatively smaller amount of fine root biomass compared to other tropical forests could be related to historical decreasing soil pH and severing soil acidity herein. In all three forests, soil pH decreased by −0.032, −0.026, and −0.035 units per year from 1980s to 2014 in these forests (Figure 1). The co-occurring decreasing soil pH and fine root biomass implied that soil acidification may have to some extent contributed to long-term fine root biomass decline. Soil acidification can be toxic to fine root growth. Forest soil acidification, often accompanied by elevated Al release from solid phase, was considered to be a major stress to tree fine root growth in forests [52]. Al toxicity is considered to be a predisposing factor in forest decline that reduces root growth and inhibits uptake of mineral nutrients, evidenced by 45Ca uptake studies [11]. In solution culture, root growth was inhibited by levels of Al similar to those found in forest soils [53]. Al interferes with root uptake of mineral nutrients. Conversely, Ca and Mg can ameliorate the adverse effects of Al [54]. Thus, the Al concentration itself was not most important; the molar ratio between Ca and Al mattered most (Ca:Al molar ratio) [11]. Thus, it was possible that long-term high ambient N deposition in Dinghushan in southern China had enhanced soil acidification, driven by Al or other heavy metal toxicity in regards to fine root growth, resulting in decreasing fine root biomass compared to that of 1990s in these study forests [43].
4.2. Effects of Long-Term N Additions on Fine Root Biomass and Vitality in the Primary Forest
The field N addition experiments in the three typical forest types in Dinghushan commenced in 2003, and were the first forest stand scale N manipulation experiment in China [31]. Two years of N additions from this experiment resulted in significant decreases in fine root biomass from 124 g m−2 in control plots to 50 g m−2 in high-N plots in the primary forest [9]. In this study, 8 years of N treatment also drove decreases in fine root biomass in the primary forest, from 88 g m−2 in control plots to 58 g m−2 in high-N plots. Furthermore, we detected accumulated fine root necromass after N treatments. These responses together resulted in significantly lower fine root vitality in the primary forest. We suggest four possible underlying mechanisms behind the N-driven lower fine root vitality in this N-saturated forest.
First, it may have occurred through N-induced decreasing soil pH, which may have been toxic to fine root growth. Elevated N inputs can further acidify soils, resulting in lower fine root vitality (live fine root proportion) [12,14], being unhospitable for fine root growth therein [26,27,55]. In Norway spruce stands in Sweden, acidification caused by addition of ammonium sulfate resulted in faster rates of root death [56,57]. Our results support this observation, with soil pH decreasing significantly with N addition in the primary forest (by 0.06 units after high-N treatment; Figure 5a). In fact, we also observed significant pH decline following medium-N and high-N treatment in soil solution collected during May 2009 to July 2010 in the primary forest at 20 cm depth (decrease from 3.81 in the control to 3.77 and 3.69 in medium- and high-N treatments) [43]. This declining soil pH might have been toxic to fine roots. This was further confirmed by the significantly negative correlation between soil pH and fine root necromass in the primary forest (Figure 6; Table 4), suggesting the potential causal relationships between N-lowered soil pH and higher fine root mortality. Higher fine root mortality was reflected by the significantly lower fine root biomass, but higher fine root necromass occurred with N additions.
Second, possibly retarded dead fine root decomposition could also have contributed to higher fine root necromass in this primary forest. We found support from our measured fine root N content and fine root C:N ratio, which both are the key to fine root decomposition [58]. Fine root N content was significantly elevated by 17, 27, and 26% when compared to those of controls in the primary, the secondary, and the planted forests (Figure 4a). Given that the carbon content of fine roots was not significantly changed, this resulted in significant decreases in fine root C:N ratio in the primary and the planted forest after high-N and medium-N treatments. Fine roots (<2 mm), especially lower-order roots, are characterized by higher N concentration, shorter life span, fewer total nonstructural carbohydrates, and more recalcitrant acid-insoluble carbohydrates (acid-insolubles) than higher-order roots [59]. These combined factors resulted in their slower decomposition rates when compared to higher-order roots. Nitrogen treatment further enhanced fine root N concentrations, which will inhibit their decomposition [60]. Inhibition of deposition by high N has been widely detected in both foliage and fine roots [61,62], possibly due to high N suppression on ligninase activity or promotion on humus formation [58,60]. Fine root C:N ratio, on the other hand, reflected the balance between C and N availability on influencing fine root decomposition. The “C limitation hypothesis” on fine root decomposition posits that low carbon quality (fewer total nonstructural carbohydrates, but more acid-insolubles) of lower-order roots retarded root decomposition by limiting C availability to microbes [63]. Thus, our results of lower fine root C:N ratio after N addition (18% and 28% decreases in the primary and the planted forests, respectively; Figure 4c) implied even lower C availability and quality relative to N to microbes, causing severer C limitation and inhibition for fine root decomposition [58]. This, combined with higher fine root mortality, leads to accumulated fine root necromass as observed. Meta-analysis on N deposition effects on fine roots in forests also revealed that simulated nitrogen deposition significantly increased fine root N content (+17.6%), but did not affect C content, and thus decreased the fine root C:N ratio (by 13.5%) [64].
Third, Fe mobilization appeared to have been toxic to fine root growth in our primary forest. Iron functions to accept and donate electrons and plays important roles in the electron-transport chains of photosynthesis and respiration. However, iron can be toxic when it accumulates to high levels. It can act catalytically via the Fenton reactions to generate hydroxyl radicals, which can damage lipids, proteins, and DNA. In this study, fine root Fe concentration almost doubled after N additions in the primary forest (from 2.6 mg g−1 fine root in the control to 4.9 mg g−1 fine root in high-N plots, Table 2), corresponding with the observed soil Fe3+ mobilization (34% increase, Table 3). Soil pH of our primary forest dropped from 3.77 (control) to 3.71 (high N), largely lower than 4.5, below which Fe3+ is released and contributes to soil acidity buffering [65]. Eight years of N additions in our primary forest acidified soil to pH 3.71, and increased soil extractable Fe3+ to 2.5 mmol kg−1 (Figure 2), exceeding the value of 1.78 mmol kg−1 (at pH 3.7) determined to be toxic to plant roots [66]. Fe toxicity to fine roots in our primary forest was further corroborated by the significant negative relationship between fine root Fe concentration and biomass (Figure 7a), implying that Fe toxicity happened to some extent to fine root growth, resulting in fine root biomass decreases. This is different from what had been observed in temperate and boreal forests, where N-induced soil Al3+ mobilization, and to a lesser extent, Fe3+ mobilization, have been related to inhibition of fine root or shoot growth [13,65]. Bowman et al. [65] reported that N addition to an alpine grassland ecosystem with a long legacy of acid deposition resulted in base cation and Al3+ depletion, but increases in extractable Fe3+, with soil pH being 3.3 to 3.5, resulted in reduced vascular plant biomass. Conditions of Al stress are corroborated by fine root Ca/Al molar ratios of 0.2–0.5 and are strongly indicated by 0.1 or less [13,52]. Fine root Ca:Al molar ratios in the three study forests averaged overall 0.6, but with 47% of fine root samples having values lower than 0.5. Thus it is possible that fine roots in these forests also experienced some extent of Al toxicity in addition to Fe.
Finally, nutrient imbalance of too low P and K content in fine roots could have contributed to lower fine root vitality in these forests. Nitrogen to phosphorus ratio of fine roots became as high as 53 in high-N plots in the primary forest (Figure 4f), indicating severe P limitation to fine root growth and vitality [67]. Fine root K deficiency, indicated by the relative proportion of N to other nutrients (Table A1), might also have some contribution [13]. Soil base saturation in all three forests was among the lowest ever reported for tropical or temperate ecosystems. Decreasing trend of BS following N addition was observed in all forests (Figure 5). Reductions in fine root length and biomass of naturally grown young beech trees (Fagus sylvatica L.) were found in plots with lower base saturation, but higher N deposition was found along the gradient of 26 forest plots differing in base saturation and nitrogen deposition [68], and the authors suggested that fine roots of Fagus sylvatica are impaired by low base saturation. Meanwhile, we failed to detect any significantly lower fine root cation concentrations following N treatment in either forest, which could be related to base cation availability in soil solutions that are accessible for fine roots to take up. Indeed, soil solution chemistry at 20 cm depth in this forest during May 2009 to July 2010 was monitored, and it showed that base cation concentrations, including Ca2+ and Mg2+, mostly showed no responses to various N treatments, except one large decrease in Ca2+ in high-N plots when compared to the control on December 2009. This might be related to less plant uptake, lower precipitation, and subsequent dilution effects on cation concentrations. Furthermore, significant decreases in soil solution pH (from 3.81 in the control to 3.69 in high-N plots), but increases in Al3+ concentration (highest value 422 μM) were observed in some months [43], which could also have been toxic to fine root growth [11].
4.3. Effects of Long-Term N Additions on Fine Root Biomass and Soil Cation Conditions in the Two Younger Forests
In the two younger forests, we failed to observe significant changes in fine root biomass, necromass, or live fine root proportion (vitality) after 8 years of N additions. This is different from many studies which showed decreases in fine root biomass [2] or vitality (live fine root proportion) accompanying N-driven obvious soil acidification [14,69]. It was notable that most of these results came from research in N-limited ecosystems, where additional N alleviates or eliminates N limitation, leading to less investment in fine roots for N uptake. In our study, lack of fine root responses to N additions suggested a less important role of N in influencing plant growth in the two younger forests. Previous results from this experiment showed positive responses for litter decomposition and litter production in the secondary and the planted forests to short-term N additions [31,70]. It appeared that high ambient N deposition may have reduced N limitation in these two younger forests, especially the planted forest, where soil pH significantly decreased by 0.11 units (Figure 4). Soil exchangeable K+ and Mg2+ also decreased significantly in the planted forest (Table 3). Fine root biomass in the planted forest also negatively correlated with soil exchangeable Al3+ and positively correlated with soil exchangeable Ca:Al molar ratio (Table 2; Figure 7), implying the possible interactive relationship between these parameters. In the mixed forest, significantly higher fine root K, Al, and Fe concentration following medium N treatment were observed (Table 2), which cannot be explained by soil exchangeable cation concentration remaining unchanged. Fine root uptake of these elements from soil solutions is possible to contribute and deserves further examination.
We also observed significant decreases in soil exchangeable K+, Na+, and Mg2+ (all of 0.1 mmol/kg decreases in the planted forest (Table 3), in contrast to no effects of shorter-term (2 years) N addition on base cations in either of the younger forests [26]. The lack of responses was attributed to retention of additional N by strong plant demand [26]. However, after a longer period of N treatment, substantial dissolved inorganic nitrogen (DIN, ammonium plus nitrate) leaching occurred in the planted forest [32], with 38% and 43% of added N leaching out during 2004 to 2006 in low-N and medium-N plots, respectively. Thus more cations should have leached together with DIN in the planted forest. Overall, the planted forest, not the secondary forest, started to show soil exchangeable base cation depletions (K+, Na+, Mg2+) after 8 years of N additions, resembling what was found in the primary forest after 2 years of N treatments [26]. At the Harvard forest, USA, long-term (15 years) NH4NO3 inputs drove the red pine plantation to reach N saturation earlier than a mixed hardwood stand [71]. These results combined implied that pure conifer plantations could be more prone to adverse effects caused by further N input and may develop faster along the N saturation stages than secondary forests.
5. Implications
A previous study quantifying soil organic C content over two decades in our primary forest demonstrated an accumulation of soil C at rates of 54 g C m−2 yr−1 (0–20 cm depth of mineral soil) [72]. Although reasons for this accumulation remain uncertain, accelerated soil acidification induced by N deposition may be an indirect factor contributing to soil C accumulation. Previous study in the same N addition experiment suggested a 9% reduction in soil respiration would be enough to explain the observed accumulation of soil C if dissolved C losses remain unaltered [32]. In fact, 14% decrease in soil respiration was detected in high-N plots after 2 years of N addition in the primary forest [9], which could have contributed at least partly to the observed C accruement in this forest [72]. In the present study, we found that eight years of N addition led to an increase of 21 to 29 g m−2 in dead fine root mass (Table 3), suggesting that increased N input may drive more dead fine root biomass contribution to the soil carbon pool. To compensate for reduced fine root biomass and to maintain nutrient uptake, fine root production and turnover rates might be enhanced after N treatment in our primary forest, which deserves further study. These responses cannot yet be observed in many other lowland tropical forests, where ambient N deposition is lower and soils are not as acidified as our studied forest [73], and in some aggrading tropical forests like the two younger forests we studied here, where great plant demand for N may delay such a response. Nevertheless, with increasing N deposition widespread in the tropics, the response of belowground processes deserves more attention for better understanding of how N deposition affects tropical forest ecosystems under global climate change.
6. Conclusions
In conclusion, N fertilization for 8 years resulted in forest-type-dependent responses of both fine root growth and related soil parameters in our three studied tropical forests different in initial soil N status. Specifically, most significant responses were observed in the N-saturated primary forest, where N treatments resulted in significantly lower fine root vitality (live fine root proportion) derived from decreased fine root biomass but increased fine root necromass. This declining fine root vitality was associated with fine root Fe accumulation, soil pH decline, and soil exchangeable Fe3+ mobilization, but Ca2+ and Mg2+ depletion after N treatments in the primary forest. In contrast, no effects of N addition on fine root vitality were observed in either young forest, despite the significantly negative correlation between fine root biomass and soil exchangeable Al3+ and Al3+/(Ca2+ + Mg2+) ratio in the planted forest. Moderate but significant decreases in soil pH and soil exchangeable K+ and Mg2+ were also found after N treatment in the planted forest. We suggest that long-term N fertilization to highly acidified tropical forests may negatively affect fine root growth, via severed soil acidification, Fe mobilization, and base cation depletion.
Author Contributions
Conceptualization, F.Z., X.L. and J.M. (Jiangming Mo); methodology, F.Z.; software, F.Z.; validation, F.Z., X.L. and J.M. (Jiangming Mo); formal analysis, F.Z., X.L. and J.M. (Jiangming Mo); investigation, F.Z.; resources, X.L. and J.M. (Jiangming Mo); data curation, F.Z. and X.L.; writing—original draft preparation, F.Z.; writing—review and editing, F.Z., X.L., J.M. (Jiangming Mo) F.S.G., M.Y., J.M. (Jan Mulder); visualization, F.Z., X.L. and J.M. (Jiangming Mo); supervision, X.L., M.Y. and J.M. (Jiangming Mo); project administration, F.Z., X.L. and J.M. (Jiangming Mo); funding acquisition, F.Z., X.L. and J.M. (Jiangming Mo). All authors have read and agreed to the published version of the manuscript.
Funding
This research was funded by the National Natural Science Foundation of China (grant number 42173077, 41922056, 31770498).
Institutional Review Board Statement
Not applicable.
Informed Consent Statement
Not applicable.
Data Availability Statement
The data are available on request from the corresponding author.
Acknowledgments
We would like to thank Xiaoming Fang, Dingsheng Mo, Tao Zhang, Lei Liu, and Wei Zhang for their skillful assistance in field work; we thank Juan Huang and Shaowei Chen for their assistance in laboratory work.
Conflicts of Interest
The authors declare no conflict of interest.
Appendix A
Table A1.
Nutrient weight proportions (N = 100) in living fine roots (<2 mm in diameter) in the 0–10 cm depth of mineral soil in the three forests in Dinghushan in southern China. According to Ingestad (1979), the optimum weight proportions are 100 N:15 P:45 K:6 Ca:6 Mg for Picea abies seedlings.
Table A1.
Nutrient weight proportions (N = 100) in living fine roots (<2 mm in diameter) in the 0–10 cm depth of mineral soil in the three forests in Dinghushan in southern China. According to Ingestad (1979), the optimum weight proportions are 100 N:15 P:45 K:6 Ca:6 Mg for Picea abies seedlings.
| Forest | Treatment | Root N | Root P | Root K | Root Ca | Root Mg |
|---|---|---|---|---|---|---|
| Primary forest | Control | 100 | 3.0 (0.5) | 21.5 (2.6) | 16.1 (1.6) | 6.4 (0.9) |
| Low-N | 100 | 2.7 (0.4) | 28.8 (5.5) | 26.0 (3.6) | 6.0 (0.6) | |
| Medium-N | 100 | 2.6 (0.2) | 19.9 (3.1) | 17.2 (3.3) | 6.3 (0.7) | |
| High-N | 100 | 2.0 (0.2) | 12.7 (1.5) | 13.7 (4.1) | 4.4 (0.6) | |
| Secondary forest | Control | 100 | 3.9 (0.9) | 16.2 (5.2) | 37.5 (12.8) | 12.1 (4.0) |
| Low-N | 100 | 3.3 (0.3) | 26.8 (2.8) | 32.9 (6.2) | 11.3 (2.3) | |
| Medium-N | 100 | 3.0 (0.4) | 21.9 (4.8) | 28.0 (4.0) | 9.5 (1.1) | |
| Plantation forest | Control | 100 | 2.7 (0.5) | 20.2 (7.3) | 27.4 (6.6) | 9.5 (3.0) |
| Low-N | 100 | 3.1 (0.6) | 18.2 (3.6) | 30.0 (6.5) | 7.6 (1.6) | |
| Medium-N | 100 | 2.0 (0.5) | 18.8 (5.9) | 22.2 (5.7) | 7.1 (2.4) |
References
- Hendrick, R.L.; Pregitzer, K.S. Patterns of fine root mortality in two sugar maple forests. Nature 1993, 361, 59–61. [Google Scholar] [CrossRef]
- Nadelhoffer, K.J. The potential effects of nitrogen deposition on fine-root production in forest ecosystems. New Phytol. 2000, 147, 131–139. [Google Scholar] [CrossRef]
- Bloom, A.J.; Chapin, F.S., III; Mooney, H.A. Resource Limitation in Plants-An Economic Analogy. Annu. Rev. Ecol. Evol. Syst. 1985, 16, 363–392. [Google Scholar] [CrossRef]
- Gower, S.T.; Vitousek, P.M. Effects of nutrient amendments on fine root biomass in a primary successional forest in Hawai’i. Oecologia 1989, 81, 566–568. [Google Scholar] [CrossRef]
- Albough, T.; Allen, H.; Dougherty, P.; Kress, L.; King, J. Leaf area and above- and belowground growth responses of loblolly pine to nutrient and water additions. For. Sci. 1998, 44, 317–328. [Google Scholar]
- Tateno, R.; Hishi, T.; Tkeda, H. Above-and below-ground biomass and net primary production in a cool-temperate deciduous forest in relation to topographical changes in soil nitrogen. For. Ecol. Manag. 2004, 193, 297–306. [Google Scholar] [CrossRef]
- Brassard, B.W.; Chen, H.; Bergeron, Y. Influence of Environmental Variability on Root Dynamics in Northern Forests. Crit. Rev. Plant Sci. 2009, 28, 179–197. [Google Scholar] [CrossRef]
- Vitousek, P.M.; Porder, S.; Houlton, B.Z.; Chadwick, O.A. Terrestrial phosphorus limitation: Mechanisms, implications, and nitrogen–phosphorus interactions. Ecol. Appl. 2010, 20, 5–15. [Google Scholar] [CrossRef]
- Mo, J.; Zhang, W.; Zhu, W.; Gundersen, P.; Fang, Y.; Li, D.; Wang, H. Nitrogen addition reduces soil respiration in a mature tropical forest in southern China. Glob. Change Biol. 2007, 14, 403–412. [Google Scholar] [CrossRef]
- Van Breeman, N.; Mulder, J.; Driscoll, C. Acidification and alalizaiton of soils. Plant Soil 1983, 75, 283–308. [Google Scholar] [CrossRef]
- Godbold, D.L.; Fritz, E.; Hüttermann, A. Aluminum toxicity and forest decline. Proc. Natl. Acad. Sci. USA 1988, 85, 3888–3892. [Google Scholar] [CrossRef]
- Godbold, D.L.; Fritz, H.-W.; Jentschke, G.; Meesenburg, H.; Rademacher, P. Root turnover and root necromass accumulation of Norway spruce (Picea abies) are affected by soil acidity. Tree Physiol. 2003, 23, 915–921. [Google Scholar] [CrossRef]
- Persson, H.; Majdi, H.; Clemensson-Lindell, A. Effects of acid deposition on tree roots. Ecol. Bull. 1995, 44, 158–167. [Google Scholar]
- Persson, H.; Ahlström, K. Fine-root response to nitrogen supply in nitrogen manipulated Norway spruce catchment areas. For. Ecol. Manag. 2002, 168, 29–41. [Google Scholar] [CrossRef]
- Clemensson-Lindell, A.; Persson, H. The effects of nitrogen addition and removal on Norway spruce fine-root vitality and distribution in three catchment areas at Gårdsjön. For. Ecol. Manag. 1995, 71, 123–131. [Google Scholar] [CrossRef]
- Persson, H.; Stadenberg, I. Spatial distribution of fine-roots in boreal forests in eastern Sweden. Plant Soil 2008, 318, 1–14. [Google Scholar] [CrossRef]
- Widell, S.; Asp, H.; Jensen, P. Activities of plasma member-bound enzymes isolated from roots of spruce (Picea abies) grown in the presence of aluminum. Physiol. Plant. 1994, 92, 459–466. [Google Scholar] [CrossRef]
- Puhe, J. Growth and development of the root system of Norway spruce (Picea abies) in forest stands—A review. For. Ecol. Manag. 2003, 175, 253–273. [Google Scholar] [CrossRef]
- Horst, W. The role of the apoplast in aluminum toxicity and resistance of higher plants: A review. Z. Pflanz. Bodenk 1995, 158, 419–428. [Google Scholar] [CrossRef]
- Galloway, J.N.; Dentener, F.J.; Capone, D.G.; Boyer, E.W.; Howarth, R.W.; Seitzinger, S.P.; Asner, G.P.; Cleveland, C.C.; Green, P.A.; Holland, E.A.; et al. Nitrogen Cycles: Past, Present, and Future. Biogeochemistry 2004, 70, 153–226. [Google Scholar] [CrossRef]
- Likens, G.E.; Driscoll, C.T.; Buso, D.C. Long-Term Effects of Acid Rain: Response and Recovery of a Forest Ecosystem. Science 1996, 272, 244–246. [Google Scholar] [CrossRef]
- Galloway, J.; Townsend, A.; Erisman, J.; Bekunda, M.; Cai, Z.; Freney, J.; Martinelli, L.; Seitzinger, S.; Sutton, M. Transfor-mation of the nitrogen cycle: Recent trends, questions, and potential solutions. Science 2008, 320, 889–892. [Google Scholar] [CrossRef]
- Hietz, P.; Turner, B.L.; Wanek, W.; Richter, A.; Nock, C.A.; Wright, S.J. Long-Term Change in the Nitrogen Cycle of Tropical Forests. Science 2011, 334, 664–666. [Google Scholar] [CrossRef]
- Ulrich, B. Natural and anthropogenic components of soil acidification. Z. Pflanz. Bodenkd. 1986, 149, 702–717. [Google Scholar] [CrossRef]
- Fang, Y.T.; Gundersen, P.; Mo, J.M.; Zhu, W.X. Input and output of dissolved organic and inorganic nitrogen in subtropical forests of South China under high air pollution. Biogeosciences 2008, 5, 339–352. [Google Scholar] [CrossRef]
- Lu, X.; Mo, J.; Gundersen, P.; Zhu, W.; Zhou, G.; Li, D.; Zhang, X. Effects of simulated N deposition on soil exchangeable cat-ions in three forest types of subtropical China. Pedosphere 2009, 19, 189–198. [Google Scholar] [CrossRef]
- Lu, X.K.; Mo, J.M.; Gilliam, F.S.; Zhou, G.Y.; Fang, Y.T. Effects of experimental nitrogen additions on plant diversity in an old-growth tropical forest. Glob. Change Biol. 2010, 16, 2688–2700. [Google Scholar] [CrossRef]
- Lu, X.; Gilliam, F.; Yu, G.; Li, L.; Mao, Q.; Chen, H.; Mo, J. Long-term nitrogen addition decreases carbon leaching in nitro-gen-rich forest ecosystems. Biogeosciences 2013, 10, 3931–3941. [Google Scholar] [CrossRef]
- Brown, S.; Lenart, M.; Mo, J.; Kong, G. Structure and Organic Matter Dynamics of a Human-Impacted Pine Forest in a MAB Reserve of Subtropical China. Biotropica 1995, 27, 276. [Google Scholar] [CrossRef]
- Mo, J.; Brown, S.; Lenart, M.; Kong, G. Nutrient Dynamics of a Human-Impacted Pine Forest in a MAB Reserve of Subtropical China. Biotropica 1995, 27, 290. [Google Scholar] [CrossRef]
- Mo, J.; Brown, S.; Xue, J.; Fang, Y.; Li, Z. Response of litter decomposition to simulated N deposition in a disturbed, rehabilitated and mature forests in subtropical China. Plant Soil 2006, 282, 135–151. [Google Scholar] [CrossRef]
- Fang, Y.; Gundersen, P.; Mo, J.; Zhu, W. Nitrogen leaching in response to increased nitrogen inputs in subtropical monsoon forests in southern China. For. Ecol. Manag. 2009, 257, 332–342. [Google Scholar] [CrossRef]
- Huang, Z.; Fan, Z. The climate of Ding Hu Shan. Trop. Subtrop. For. Ecosys. 1982, 1, 11–23. [Google Scholar]
- He, J.; Chen, Z.; Liang, Y. The soil of Ding Hu Shan. Trop. Subtrop. For. Ecosys. 1982, 1, 25–38. [Google Scholar]
- Fang, Y.; Zhu, W.; Mo, J.; Zhou, G.; Gundersen, P. Dynamics of soil inorganic nitrogen and their responses to nitrogen additions in three subtropical forests, south China. J. Environ. Sci. 2006, 18, 752–759. [Google Scholar]
- Shen, C.; Liu, D.; Peng, S.; Sun, Y.; Jiang, M.; Yi, W.; Xing, C.; Gao, Q.; Li, Z.; Zhou, G. 14C measurement of forest soils in Ding hu shan Biosphere Reserve. Chin. Sci. Bull. 1999, 44, 251–256. [Google Scholar] [CrossRef]
- Gilliam, F.S. Response of the herbaceous layer of forest ecosystems to excess nitrogen deposition. J. Ecol. 2006, 94, 1176–1191. [Google Scholar] [CrossRef]
- Janssens, I.; Sampson, D.; Curiel-Yuste, J.; Carrara, A.; Ceulemans, R. The carbon cost of fine root turnover in a Scots pine forest. For. Ecol. Manag. 2002, 168, 231–240. [Google Scholar] [CrossRef]
- Bray, R.H.; Kurtz, L.T. Determination of total, organic, and available forms of phosphorus in soils. Soil Sci. 1945, 59, 39–46. [Google Scholar] [CrossRef]
- Liu, K.; Fang, Y.; Yu, F.; Liu, Q.; Li, F.; Peng, S. Soil acidification in response to acid deposition in three subtropical forests of subtropical China. Pedosphere 2010, 20, 399–408. [Google Scholar] [CrossRef]
- Liu, X.; Zhang, Y.; Han, W.; Tang, A.; Shen, J.; Cui, Z.; Vitousek, P.; Erisman, J.W.; Goulding, K.; Christie, P.; et al. Enhanced nitrogen deposition over China. Nature 2013, 494, 459–462. [Google Scholar] [CrossRef] [PubMed]
- Wen, D.; Wei, P.; Kong, G.; Ye, W. Production and turnover rate of fine roots in two lower subtropical forest sites at Ding hu shan. Acta Phytoecol. Sin. 1999, 23, 361–369. [Google Scholar]
- Lu, X.; Mao, Q.; Gilliam, F.; Luo, Y.; Mo, J. Nitrogen deposition contributes to soil acidification in tropical ecosystems. Glob. Change Biol. 2014, 20, 3790–3801. [Google Scholar] [CrossRef] [PubMed]
- Zhu, Q.; De Vries, W.; Liu, X.; Zeng, M.; Hao, T.; Du, E.; Zhang, F.; Shen, J. The contribution of atmospheric deposition and forest harvesting to forest soil acidification in China since 1980. Atmos. Environ. 2016, 146, 215–222. [Google Scholar] [CrossRef]
- Yang, Y.; Li, P.; He, H.; Zhao, X.; Datta, A.; Ma, W.; Zhang, Y.; Liu, X.; Han, W.; Wilson, M.C.; et al. Long-term changes in soil pH across major forest ecosystems in China. Geophys. Res. Lett. 2015, 42, 933–940. [Google Scholar] [CrossRef]
- Lu, C.; Tian, H. Spatial and temporal patterns of nitrogen deposition in China: Synthesis of observational data. J. Geophys. Res. Earth Surf. 2007, 112, D22S05. [Google Scholar] [CrossRef]
- Larssen, T.; Seip, H.; Semb, A.; Mulder, J.; Muniz, I.; Vogt, R.; Lydersen, E.; Angell, V.; Dagang, T.; Eilertsen, O. Acid rain in China. Environ. Sci. Technol. 2006, 40, 418–425. [Google Scholar] [CrossRef]
- Guo, J.; Liu, X.; Zhang, Y.; Shen, J.; Han, W.; Zhang, W.; Christie, P.; Goulding, K.; Zhang, F. Significant acidification in major Chinese croplands. Science 2010, 327, 1008–1010. [Google Scholar] [CrossRef]
- Yang, Y.; Fang, J.; Ji, C.; Ma, W.; Mohammat, A.; Wang, S.; Wang, S.; Datta, A.; Robinson, D.; Smith, P. Widespread decreases in topsoil inorganic carbon stocks across China’s grasslands during 1980s–2000s. Glob. Change Biol. 2012, 18, 3672–3680. [Google Scholar] [CrossRef]
- Zhai, P.; Zhang, X.; Wan, H.; Pan, X. Trends in Total Precipitation and Frequency of Daily Precipitation Extremes over China. J. Clim. 2005, 18, 1096–1108. [Google Scholar] [CrossRef]
- Espeleta, J.F.; Clark, D.A. Multi-scale variation in fine-root biomass in a tropical rain forest: A seven-year study. Ecol. Monogr. 2007, 77, 377–404. [Google Scholar] [CrossRef]
- Cronan, C.S.; Grigal, D.F. Use of Calcium/Aluminum Ratios as Indicators of Stress in Forest Ecosystems. J. Environ. Qual. 1995, 24, 209–226. [Google Scholar] [CrossRef]
- Rost-Siebert, K. Untersuchungen zur H+—und Al-Ionentoxizit/it an Keimpflanzen von Fichte (Picea abies, Kartst.) und Buche (Fagus sylvatica, L.) in L/Ssingskultur. Ber. Forsch. Waldokosyst./Waldsterben Forsch. Wald. Göttingen 1985, 12, 1–219. [Google Scholar]
- Jorns, A.; Hecht-Buchholz, C. AlIg. Forstz 1985, 46, 1249–1252. [Google Scholar]
- Matson, P.; McDowell, W.; Townsend, A.; Vitousek, P. The globalization of nitrogen deposition: Ecosystem consequences in tropical environments. Biogeochemistry 1999, 46, 67–83. [Google Scholar] [CrossRef]
- Clemensson-Lindell, A.; Persson, H. Fine-root vitality in a Norway spruce stand subjected to various nutrient supplies. Plant Soil 1995, 168, 167–172. [Google Scholar] [CrossRef]
- Majdi, H.; Kangas, P. Demography of fine roots in response to nutrient applications in a Norway spruce stand in southwestern Sweden. Ecoscience 1997, 4, 199–205. [Google Scholar] [CrossRef]
- Fan, P.; Guo, D. Slow decomposition of lower order roots: A key mechanism of root carbon and nutrient retention in the soil. Oecologia 2010, 163, 509–515. [Google Scholar] [CrossRef]
- Guo, D.; Li, H.; Mitchell, R.; Han, W.; Hendricks, J.; Fahey, T.; Hendrick, R. Fine root heterogeneity by branch order: Exploring the discrepancy in root turnover estimates between minirhizotron and carbon isotopic methods. New Phytol. 2008, 177, 443–456. [Google Scholar] [CrossRef]
- Berg, B.; McClaugherty, C. Plant Litter-Decomposition, Humus Formation, Carbon Sequestration; Springer: Berlin, Germany, 2003. [Google Scholar]
- Hobbie, S.E. Contrasting Effects of Substrate and Fertilizer Nitrogen on the Early Stages of Litter Decomposition. Ecosystems 2005, 8, 644–656. [Google Scholar] [CrossRef]
- Hobbie, S.E. Nitrogen effects on decomposition: A five-year experiment in eight temperate sites. Ecology 2008, 89, 2633–2644. [Google Scholar] [CrossRef]
- Guo, D.L.; Mitchell, R.J.; Hendricks, J.J. Fine root branch orders respond differentially to carbon source-sink manipulations in a longleaf pine forest. Oecologia 2004, 140, 450–457. [Google Scholar] [CrossRef]
- Li, W.; Jin, C.; Guan, D.; Wang, Q.; Wang, A.; Yuan, F.; Wu, J. The effects of simulated nitrogen deposition on plant root traits: A meta-analysis. Soil Biol. Biochem. 2015, 82, 112–118. [Google Scholar] [CrossRef]
- Bowman, W.; Cleveland, C.; Halada, L.; Hreško, J.; Baron, J. Negative impact of nitrogen deposition on soil buffering capacity. Nat. Geosci. 2008, 1, 767–770. [Google Scholar] [CrossRef]
- Foy, C.D.; Chaney, R.L.; White, M.C. The Physiology of Metal Toxicity in Plants. Annu. Rev. Plant Physiol. 1978, 29, 511–566. [Google Scholar] [CrossRef]
- Adamek, M.; Corre, M.D.; Hölscher, D. Responses of fine roots to experimental nitrogen addition in a tropical lower montane rain forest, Panama. J. Trop. Ecol. 2010, 27, 73–81. [Google Scholar] [CrossRef]
- Braun, S.; Cantaluppi, L.; Fluckiger, W. Fine roots in stands of Fagus sylvatica and Picea abies along a gradient of soil acidifica-tion. Environ. Pollut. 2005, 137, 574–579. [Google Scholar] [CrossRef]
- Majdi, H.; Persson, H. A study on fine-root dynamics in response to nutrient applications in a Norway spruce stand using the minirhizotron technique. J. Plant Nutr. Soil Sci. 1995, 158, 429–433. [Google Scholar] [CrossRef]
- Lu, X.; Mo, J.; Gilliam, F.; Fang, H.; Zhu, F.; Fang, Y.; Zhang, W.; Huang, J. Nitrogen addition shapes soil phosphorus availability in two reforested tropical forests in southern China. Biotropica 2012, 44, 302–311. [Google Scholar] [CrossRef]
- Magill, A.H.; Aber, J.D.; Currie, W.S.; Nadelhoffer, K.J.; Martin, M.E.; McDowell, W.H.; Melillo, J.M.; Steudler, P. Ecosystem response to 15 years of chronic nitrogen additions at the Harvard Forest LTER, Massachusetts, USA. For. Ecol. Manag. 2004, 196, 7–28. [Google Scholar] [CrossRef]
- Zhou, G.; Liu, S.; Li, Z.; Zhang, D.; Tang, X.; Zhou, C.; Yan, J.; Mo, J. Old-Growth Forests Can Accumulate Carbon in Soils. Science 2006, 314, 1417. [Google Scholar] [CrossRef] [PubMed]
- Yavitt, J.; Harms, K.; Garcia, M.; Mirabello, A.; Wright, S. Soil fertility and fine root dynamics in response to 4 years of nutrient (N, P, K) fertilization in a lowland tropical moist forest, Panama. Austral Ecol. 2011, 36, 433–445. [Google Scholar] [CrossRef]

Publisher’s Note: MDPI stays neutral with regard to jurisdictional claims in published maps and institutional affiliations. |
© 2022 by the authors. Licensee MDPI, Basel, Switzerland. This article is an open access article distributed under the terms and conditions of the Creative Commons Attribution (CC BY) license (https://creativecommons.org/licenses/by/4.0/).