Article

Genetic Structure of Pinus Populations in the Urals

1
Faculty of Biology, Perm State University, Bukireva, 15, 614990 Perm, Russia
2
National Laboratory Astana, Nazarbayev University, 53 Kabanbay Batyr Ave., Nur-Sultan 010000, Kazakhstan
3
Helsinki Institute of Life Science HiLIFE, University of Helsinki, Biocenter 3, Viikinkaari 1, FI-00014 Helsinki, Finland
*
Authors to whom correspondence should be addressed.
Forests 2022, 13(8), 1278; https://doi.org/10.3390/f13081278
Submission received: 7 July 2022 / Revised: 9 August 2022 / Accepted: 10 August 2022 / Published: 12 August 2022
(This article belongs to the Special Issue Forest Biodiversity and Ecosystem Stability)

Abstract

:
The sustainable use and conservation of forest resources must be carried out with a detailed study of the main forest-forming plant species. Coniferous forests form the basis of boreal forest ecosystems and are of great economic importance. Representatives of forest-forming boreal coniferous species are species of the genus Pinus, including Siberian pine (Pinus sibirica Du Tour) and Scots pine (Pinus sylvestris L.), which are valuable and widely used woody plant species. The purpose of this research was to conduct an extended study of genetic diversity, genetic structure, and differentiation of P. sibirica and P. sylvestris populations under the conditions of their habitat in the Middle and Northern Urals. We studied twelve populations of two Pinus species using the inter-simple sequence repeat (ISSR)-based DNA polymorphism detection PCR method. Populations are characterized by relatively high levels of genetic diversity (P. sylvestris: He = 0.163; ne = 1.270; I = 0.249; P. sibirica: He = 0.148; ne = 1.248; I = 0.225). Analysis of the intrapopulation genetic structure reveals that the studied populations are highly differentiated (P. sylvestris: GST = 0.362; P. sibirica: GST = 0.460). The interpopulation component comprised 36% and 46% of the total genetic diversity for P. sylvestris and P. sibirica, respectively. Using various algorithms to determine the spatial genetic structure, it was determined that P. sylvestris populations form two groups according to their location at a certain altitude above sea level. P. sibirica populations form two clusters, with an additional subdivision of the two populations into subclusters identified. The data obtained during the study may be useful for further research as well as for conservation management planning and related forestry practices aimed at preserving the genetic resources of valuable forest plant species.

1. Introduction

The sustainable use and conservation of forest resources need to be focused on the genetic component, as the genetic resources of a population can be considered the entire pool of genetic variability that allows a species to evolve successfully under natural conditions [1]. Reduced sizes of natural populations, due more to adverse anthropogenic influences, lead to the overall impoverishment of the genetic diversity of species [2,3].
Coniferous forests form the basis of boreal ecosystems and are of enormous economic importance. As an important mechanism for regulating water flow and soil conservation, as an essential element in the carbon cycle, and as a means of cleaning the air from pollution, they have an enormous local and global impact on ecosystems [4,5,6]. In addition, coniferous plant components contain biologically active compounds such as terpenoids, steroids, alkaloids, flavonoids, polysaccharide complexes (holocellulose), and others, which are promising raw materials for the pharmaceutical industry [7,8].
One of the forest-forming boreal coniferous genus is the Pinus genus that includes the Siberian pine (Pinus sibirica Du Tour) and Scots pine (Pinus sylvestris L.), which are valuable and widely used tree species. In the territory of Russia, up to 80% of the total resources of economically important coniferous wood are available. Although the forest is a renewable resource, the number of forest logging operations exceeds the number of new forest plantations. At the same time, there is the problem of controlling the legality of logging of economically valuable species. To solve this problem, measures must be developed to detect and control illegal logging, and to identify woody plant species at a population level. Determining the origin of a specimen from natural sources for coniferous tree species requires measures to map these natural populations and characterize their genetic structure and intraspecific and interspecific differentiation [9,10].
Siberian pine is of great ecological, environment-forming, and resource-regulating importance and performs the most important water-protecting, soil-protecting, and climate-regulating functions. In addition, pine forests are of great recreational, sanitary, and health-improving value. The wood, needles, and nuts of Pinus sibirica are widely used in the pharmaceutical, chemical, food, and perfumery industries [11]. The study of genetic diversity in populations is most interesting at the boundary of the distribution range [12]. The Permian region is located at the boundary of the distribution of P. sibirica. In addition, one of the refugia from which P. sibirica originated is located in the Urals [13]. The populations located in the territories of the Ural and Altai-Sayan Mountains are of great interest because it was in these territories that the species range began to form in the post-glacial period [13]. With this connection, the study of genetic diversity and genetic structure of populations located at the northwestern border of the Siberian pine distribution range is very important.
Scots pine (Pinus sylvestris L.) is one of the most common economically important forest-forming plant species, which plays an extremely important role in the structure and functions of forest ecosystems [14]. Scots pine is one of the most valuable forest-forming species in Russia and Western Europe. Pine forests are classified as protective forests that are developed to preserve the habitat-forming, water-protective, protective, sanitary-hygienic, health-improving, and other beneficial functions of forests, as the Scots pine has good protective and soil-strengthening properties. Pinus sylvestris is also widely used in the production of medicines and in the chemical industry [11].
Most population genetic studies of Pinus species have been carried out using isoenzyme analysis [13,15,16,17,18]. These studies show a high level of intraspecific genetic diversity and a low degree of differentiation of Pinus sibirica and Pinus sylvestris populations across the entire distribution range, which is characteristic of most conifer species with extensive continuous ranges and high population sizes [17,19]. Numerous molecular genetic studies of the Pinus genus species show that the genetic structure and intrapopulation diversity of Pinus sp. are dependent on environmental factors and geographic location [17,20]. In this regard, peripheral populations are important sources in phylogeographic and population genetic studies [21,22].
Over the past decades, using various types of molecular genetic markers [23], extensive information has been accumulated on the structure, genetic diversity, and intra- and interspecific population differentiation of a large number of different pine species and hybrids [24,25,26,27,28]. Studies of the non-coding part of the genome, which consists of multiple interspersed genomic repeats, can serve as a particular sign of hidden genetic diversity and, more broadly, as an indicator of the genetic potential and evolutionary changes happening in a specific species. PCR methods for the identification of this hidden genetic variation, such as a system of genome profiling molecular markers, were created based on these sequences of interspersed genomic repeats. The genetic polymorphism of conifers, particularly P. sibirica and P. sylvestris, has been studied using various PCR-based molecular marker systems, such as microsatellites or single sequence repeats (SSRs) [29], inter-simple sequence repeats (ISSRs) [30], and AFLP [31] PCR-based DNA profiling techniques. Such DNA genetic markers, including all PCR variants of the RAPD method [32] such as ISSRs [33,34] and others, are quite efficient enough and inexpensive when determining genetic diversity but have technical problems such as reproducibility. Using high-throughput sequencing technologies would be promising if such markers were developed for Pinus species [16,35]. However, these markers are expensive to develop and need whole-genome sequencing of studied genotypes for each species. Although a lot of studies in the Urals have been carried out using different types of molecular genetic markers, the results obtained are fragmentary and generally insufficient to characterize genetic resources and identify general patterns of the gene pool structure within the Ural part of P. sylvestris and P. sibirica habitats. Therefore, to characterize the genetic diversity of two species of the genus Pinus in the territory of the Urals, additional comprehensive studies involving more unique genotypes are needed. It should be noted that most previous studies were conducted using isoenzyme analysis as well as SSR assays, but studies of Pinus populations using ISSR markers were not sufficient. The study of genetic diversity and the genetic structure of coniferous plant populations based on DNA marker analysis is promising for the development and optimization of methods for assessing the status of gene pools of coniferous plant species, which is an urgent task for the conservation of populations of forest tree species that are productive and resistant to various environmental factors. This work aimed to study in detail the genetic diversity and genetic structure of natural populations of P. sibirica and P. sylvestris under conditions of their natural growth in the Middle and Northern Urals.

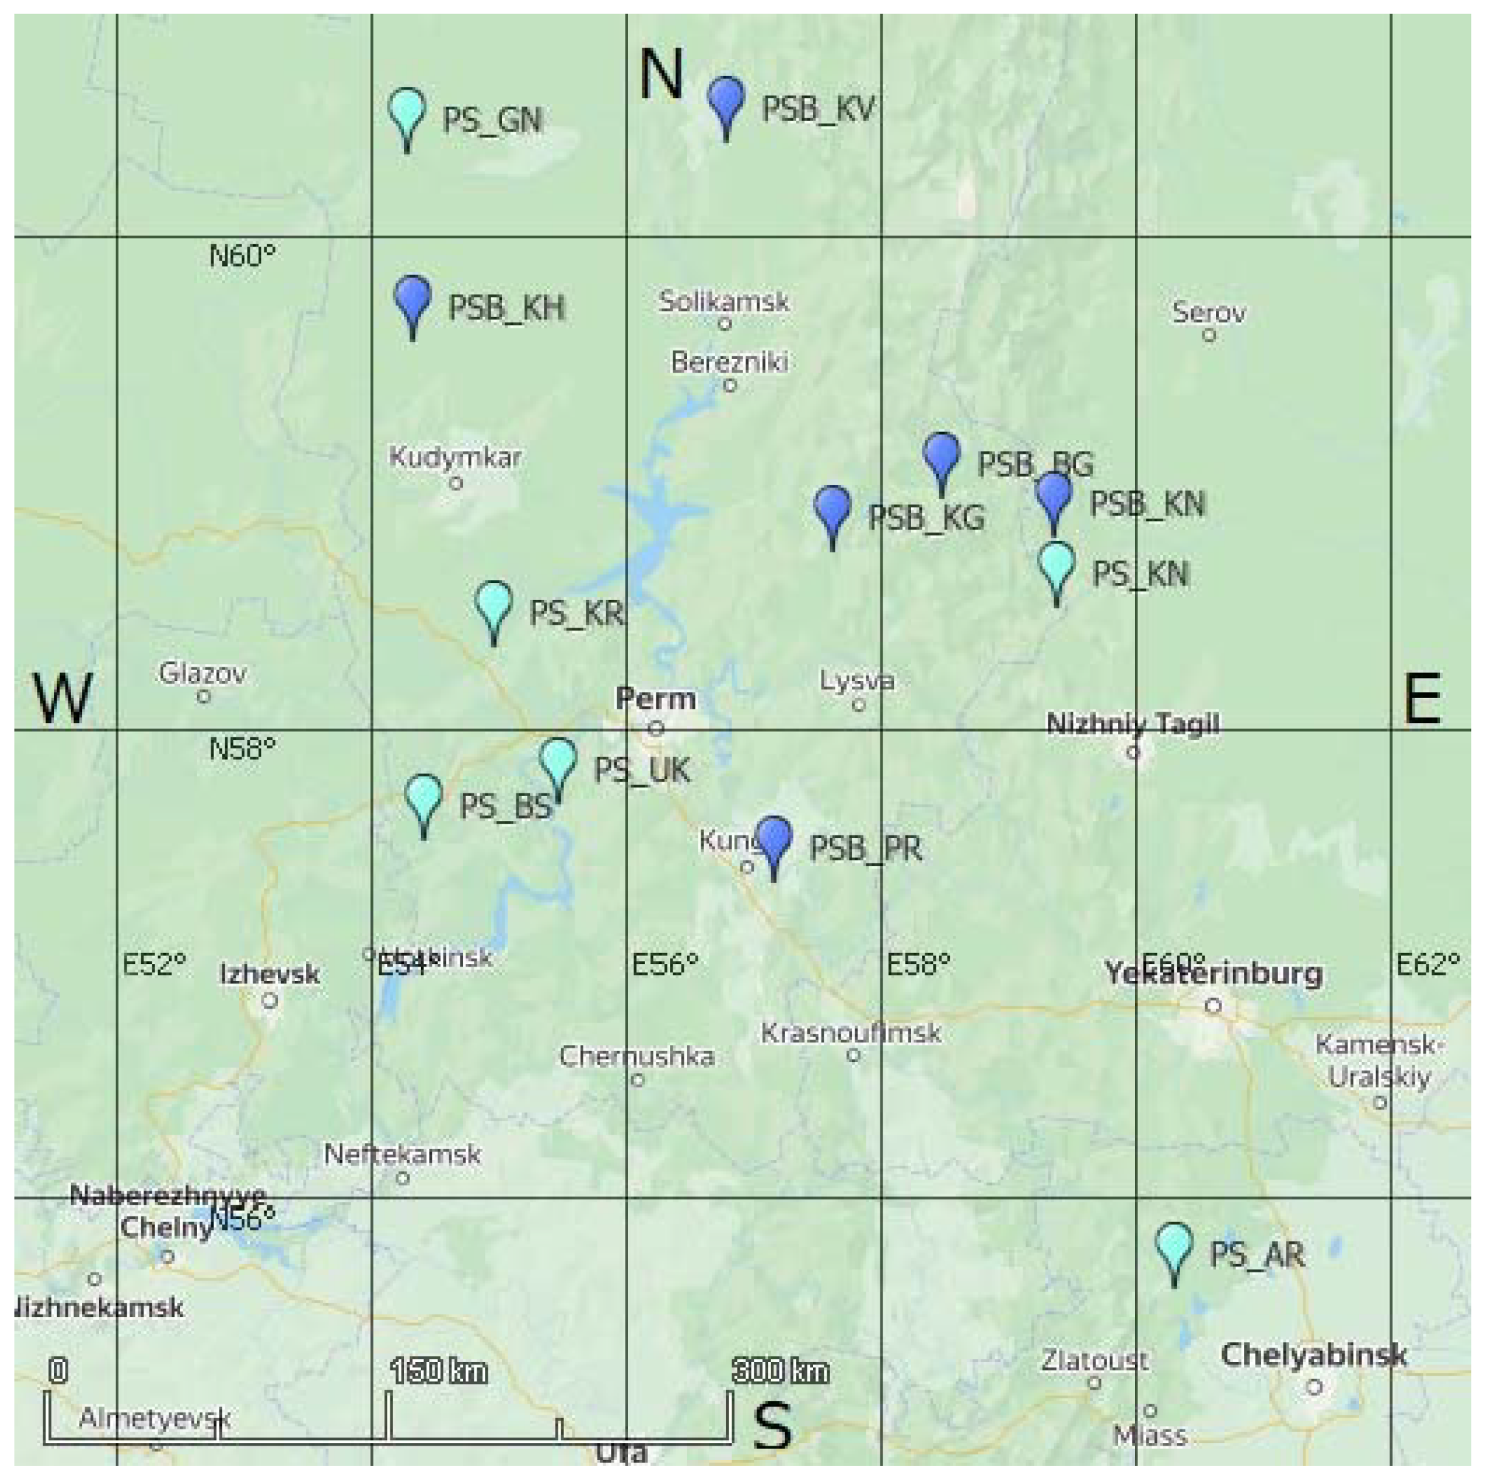
2. Materials and Methods

Six natural populations of Scots pine (Pinus sylvestris L.; Pinaceae) located within the territory of the Urals were studied. The explored populations (Supplemental Materials, Figures S7–S12) of P. sylvestris in Perm Krai are located in Gainy’s (PS_GN), Karagay’s (PS_KG), Perm’s (PS_UK), and Bolshesosnovsky’s (PS_BS) forests, the population from Sverdlovsk Oblast in Verkhoturye’s (PS_KN) forest, and the population from Chelyabinsk province in Vishnyovogorsk’s (PS_AR) forest (Table S1 and Figure 1). In addition, 6 populations of Siberian pine (Pinus sibirica Du Tour, Pinaceae) were studied (Supplemental Materials, Figures S13–S18). The studied populations are located in Perm Krai in Krasnovishersk’s (PSB_KV), Kochyovo’s (PSB_KH), Gornozavodsk’s (PSB_BG), Kishert’s (PSB_PR) and Chusovoy’s (PSB_KG) forests and in Sverdlovsk province, Verkhoturye’s (PSB_KN) forest.
The pine populations for the study were selected based on data from Forest Plans. First of all, we focused on the intensity of logging in the collection area for the further identification of populations to prevent illegal logging. The studied populations were natural and the sampling area for each population was about 0.7 km2. In the study region, on the western macroslope of the Urals, Scots pine does not dominate the forest structure and does not form large metapopulation complexes.
The surveyed populations of P. sibirica are located on the western macroslope of the Ural Mountains, and populations of this species on the eastern macroslope have been previously studied [36]. These populations are attractive due to their proximity to the range boundary of P. sibirica in the Urals and also because they are natural populations, except PSB_KG, which appears to be a man-made plantation. The high interest in these populations is also due to the fact that one of the refugia from which the distribution of Siberian pine originated from was located in the Southern Urals. The populations studied are located within the taiga forest zone of the taiga region. The predominant forest type in the study region is spruce-fir; Siberian pine is not the dominant species. Samples were taken from an area of approximately 0.9 km2.
Plant material was collected from trees located at least 100–150 m apart. Geographic distances between populations ranged from a minimum of 54 km (populations PSB_BG and PSB_KN located in Gornozavodsk’s and Verkhoturye’s forests) to a maximum of 633 km between the populations of PS_GN and PS_AR located in the northern part of Perm Krai and Chelyabinsk provinces. The pairwise geographical distances between all studied populations are presented in Tables S2 and S3.
For the studies, plant tissue samples were collected individually from 25–30 trees in each of the studied populations. The weighed amount of the needles was 20 mg. DNA was isolated according to the procedure for complex biological samples [37]. The NanoDrop 2000 Spectrophotometer (Thermo Fisher Scientific, Waltham, MA, USA) was used to determine the concentration and quality of DNA.
The ISSR method was used to assess the genetic diversity and genetic structure of populations [38]. PCR reactions were performed in a 25 µL reaction mixture. Each reaction mixture contained 50 ng of template DNA, 1 × PCR buffer with 2.5 mM of MgCl2, 1 µM of ISSR primer, 0.25 mM of each dNTP, and 2 U of Taq DNA polymerase (Sileks M, Moscow, Russia). PCR amplification was carried out in a GeneAmp PCR System 9700 Thermal Cycler (Applied Biosystems, Thermo Fisher Scientific Inc., Waltham, MA, USA) under the following conditions: the initial denaturation step at 94 °C for 2 min, followed by 32 amplifications at 94 °C for 20 s, at 52–64 °C (depending on primer) for 30 s, and 72 °C for 60 s, followed by a final extension of 72 °C for 3 min. The annealing temperature varied between 56 °C and 64 °C depending on the Tm of the primer composition (Table 1) [39]. As a negative control, 5 µL of Milli-Q water instead of DNA was added to the reaction mixture to check the purity of the reagents. Previously selected effective ISSR primers for P. sylvestris [40] (Table 1) and P. sibirica were used [38,41,42]. Data were generated and compared in three replicates.
Agarose gels were then checked to identify ISSR profiles in one or both replicates (original gel photo collected and shown in Supplemental Materials, Figures S19–S28). All ISSR primers were tested to assess the genetic diversity of Pinus sp. using PCR amplification for DNA profiling. PCR products were separated by electrophoresis at 70 V for 5 h in 1.5% agarose gel with 1x TBE buffer, stained with ethidium bromide, and photographed in transmitted ultraviolet light using the GelDoc XR (Bio-Rad Laboratories, Inc., Hercules, CA, USA) gel documentation system. To determine the length of DNA fragments, a molecular weight marker (100 bp DNA Ladder (Cat. 07-11-00050); Solis BioDyne, Tartu, Estonia) and the Quantity One program (Bio-Rad Laboratories, Inc.) were used. In total, polymorphism was analyzed for ISSR profiles with 5 primers in 175 trees of P. sylvestris and for 146 P. sibirica, with a total of 1605 individual samples of P. sylvestris.
To quantify the genetic polymorphism and determine the genetic structure of the twelve populations studied, the data were presented in the form of a matrix of binary characters, in which the presence or absence of fragments of the same size in the spectra was considered as a 1 or 0 state, respectively.
Computer processing of the data was performed using the specialized macro GenAlEx for MS Excel to determine the number of alleles (na), effective (ne) number of alleles [43], expected (He) heterozygosity, and Shannon’s information index (I). The following parameters calculated in the POPGENE 1.31 software were used to describe the genetic structure of populations [44]: the expected proportion of heterozygous genotypes in the entire population as a measure of total genetic diversity (HT); the expected proportion of heterozygous genotypes in a subpopulation as a measure of intrapopulation diversity (HS); the share of interpopulation genetic diversity in total diversity or the coefficient of gene differentiation (GST); and AMOVA (analysis of molecular variance) with the calculation of the PhiPT index (population subdivision index) using 1000 rounds of permutations [45]. Genetic distances between populations (DN) were determined using the method of M. Nei [46]. To determine the correlation between pairwise genetic distances (DN and PhiPT) and geographic distances in the general population group, the commonly used Mantel test was used.
Based on the binary trait matrix, a genetic distance matrix was calculated, based on which dendrograms reflecting the degree of similarity between the studied populations and trees were generated by the spectrum using the MEGA X program [47]. In addition, a principal coordinates analysis (PCA), implemented in the GenAlEx 6 [43], was performed to verify the obtained data. In the PAST 4.10 program [48], a detailed dendrogram was constructed for all trees using the neighbor-joining method, and analysis and visualization were performed using the UMAP (uniform manifold approximation and projection) method [49]. The geoclimatic indicators of the studied populations were extracted from the WorldClim bio_30 database [43] (https://biogeo.ucdavis.edu/data/worldclim/v2.1/base/wc2.1_30s_bio.zip, accessed on 31 May 2022) using the raster package [44]. Based on the vectors containing 19 common indicators, a geoclimatic distance matrix was constructed by calculating the Canberra distance using the spatial.distance module of the SciPy package [50]. Correlation analysis between genetic and geoclimatic distance matrices (Mantel test) was performed in GenAlEx 6 [43].
The climate of the Urals is continental. The extension of the mountain ranges in the meridional direction is important in increasing solar radiation from north to south and in raising air temperatures. Winter temperatures on the eastern slope are 1–2 °C lower than on the western slope at the same latitude; this is due to the decreasing influence of relatively warm air masses of Atlantic origin from the east and the increasing influence of the colder masses of Siberia. The continentality of the climate increases from west to east and from north to south. On the western slope, the average January temperature rises from −20, −21 °C in the Polar Urals to −15, −16 °C in the Southern Urals. On the eastern slope, it rises from −22, −23 to −16, −17, respectively. In July in the northernmost parts of the Urals, the temperature is 9–10 °C, whereas in the southernmost parts it is 19–20 °C. The distribution of precipitation is greatly influenced by the relief; there is 150–300 mm more precipitation per year on the western slope than on the eastern slope at the same latitude. The maximum amount of precipitation (up to 1000 mm) is registered in the watershed area of the Subpolar and Northern Urals (the snow cover is highest there, up to 90 cm). The annual amount of precipitation is 650–750 mm along the range and on the western slope of the Southern Urals; on the eastern slope, it decreases from 500–600 mm in the northern areas to 300–400 mm in the southern areas. Precipitation falls mainly in summer.

3. Results

3.1. Genetic Diversity of P. sylvestris

Molecular genetic analysis of six populations of P. sylvestris revealed 85 ISSR polymorphic amplicons (Figure 2). The ISSR primers used detected from 14 to 20 PCR amplicons, and the maximum number of amplicons was amplified with primer CR-215. On average, a single primer showed about 17 PCR bands. PCR amplicon lengths ranged from 200 to 1600 base pairs. Out of 85 polymorphic bands of the used ISSR primers, 9 unique PCR bands (11%) were identified which are unique for a specific population. In the populations of Vishnyovogorsk’s (PS_AR) and Bolshesosnovsky’s (PS_BS) forests, one unique ISSR marker was identified, and four ISSR amplicons were identified for the population of Karagay’s (PS_KG) forest, whereas for the population of Verkhoturye’s (PS_KN) forest, three unique ISSR amplicons were identified. The highest genetic diversity was shown in populations from Gainy’s (PS_GN) forest (I = 0.280; He = 0.185; ne = 1.312) and Vishnyovogorsk’s (PS_AR) forest (I = 0.272; He = 0.180; ne = 1.305). The least diverse among the studied populations is the population from Verkhoturye’s (PS_KN) forest (I = 0.229; He = 0.149; ne = 1.244) (Table 2).

3.2. Genetic Diversity of P. sibirica

Molecular genetic analysis of six populations of P. sibirica revealed 126 ISSR amplicons (Figure 3). The ISSR primers used detected from 21 to 30 PCR amplicons, and the maximum number of amplicons was amplified with ISSR primer X11. On average, a single primer showed about 25 PCR amplicons, and PCR amplicon lengths ranged from 200 to 1600 base pairs. Out of 126 polymorphic amplicons of the used ISSR primers, 15 unique PCR bands (12%) were identified which are unique for a specific population.
The populations of Krasnovishersk’s (PSB_KV), Gornozavodsk’s (PSB_BG), and Chusovoy’s (PSB_KG) forests were identified by one unique marker, in Kochyovo’s (PSB_KH) forest population, four unique markers were identified, and eight ISSR markers were identified for the population of Verkhoturye’s (PSB_KN) forest.
The greatest genetic diversity was shown in the population from Kochyovo’s (PSB_KH) forest (I = 0.298; He = 0.200; ne = 1.346). The least diverse among the studied populations was the population from Krasnovishersk’s (PSB_KV) forest (I = 0.174; He = 0.115; ne = 1.195) (Table 3).

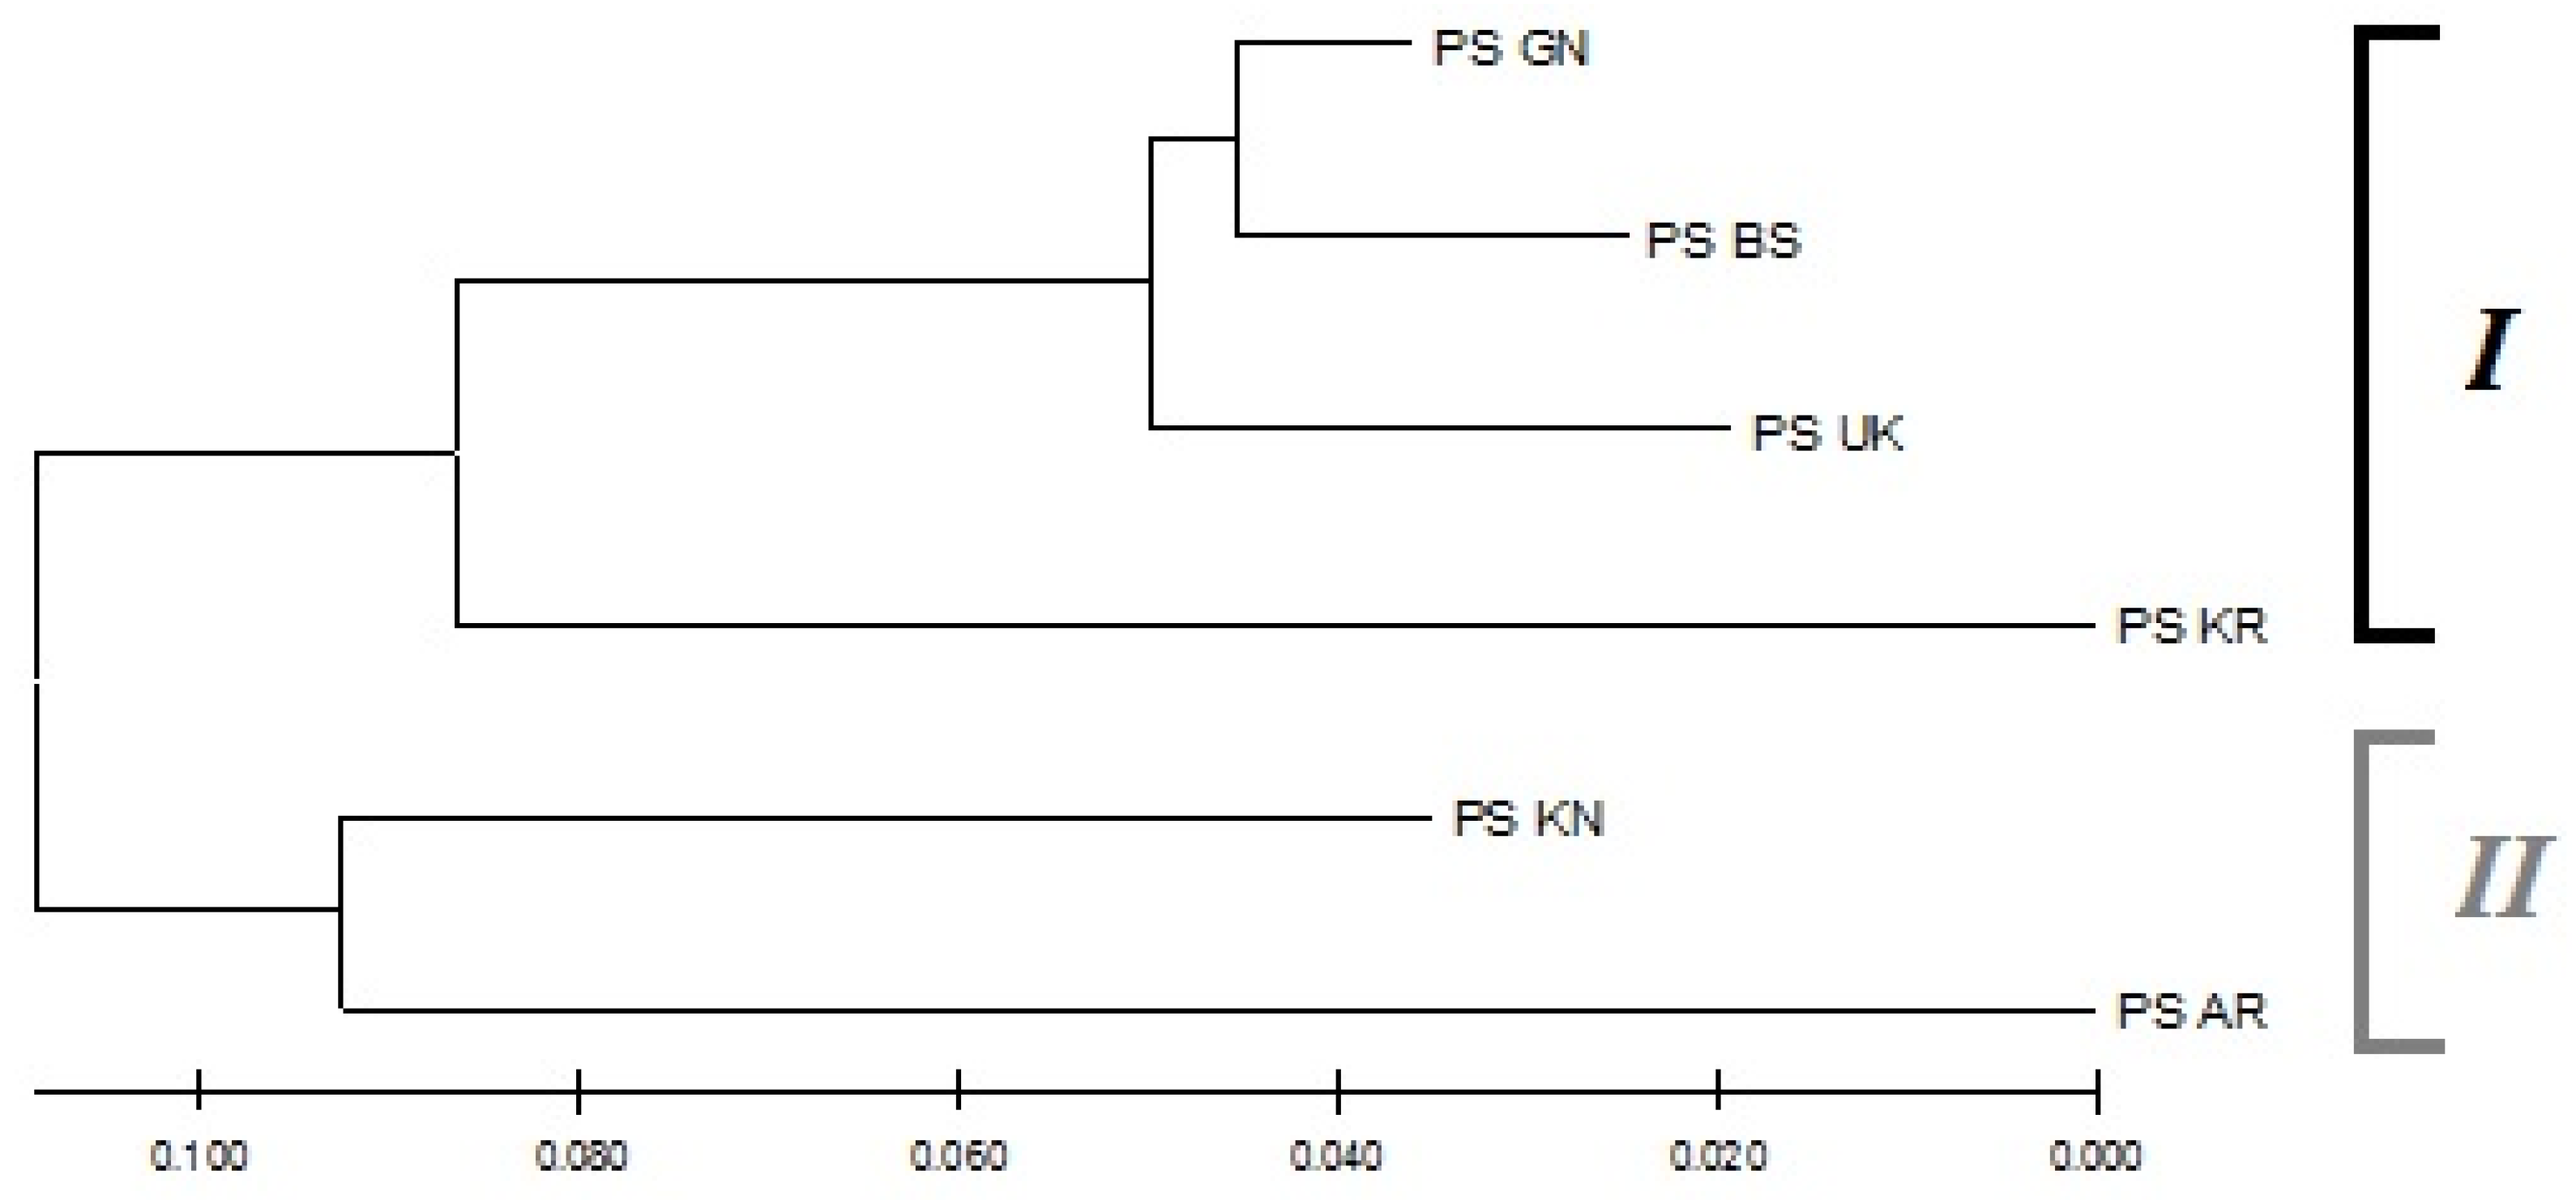
3.3. Population Genetic Structure of P. sylvestris

Analysis of the genetic structure of the studied P. sylvestris populations revealed that the expected proportion of heterozygous genotypes (HT) per total sample was 0.255, whereas the expected proportion of heterozygous genotypes in a subpopulation (HS) was 0.163. The population subdivision coefficient (GST) shows that the interpopulation component accounts for 0.362 of the total genetic diversity.
The values of pairwise PhiPT genetic distances detected by the AMOVA package ranged from 0.137 (PS_GN/Ps_UK) to 0.502 (PS_KN/PS_KR). Differences in genetic distances between populations were statistically significant (Table 4). For the total sample of P. sylvestris, the PhiPT index was 0.406, which approximates GST = 0.362. The analysis of molecular variability (AMOVA) showed that a significant part of the genetic diversity is accounted for by the interpopulation component (41%) (Table 5).
The smallest genetic distance was observed between the populations PS_GN and PS_BS (DN = 0.035), and the largest (DN = 0.0.205) between the populations PS_KR and PS_AR (Table 6). Based on the matrix of pairwise genetic distances (DN), a cluster analysis was performed using the neighbor-joining method, and a dendrogram reflecting the degree of similarity in the ISSR spectra of the populations studied was constructed (Figure 2). On the dendrogram, the studied populations formed two clusters of plain (I) and high-altitude populations (II).
The separation of populations into two clusters is supported by the results of the principal coordinates analysis (PCA), based on the PhiPT index calculated with the AMOVA package. The populations were distributed unevenly during the ordination (Figure S1). Two groups were distinguished: The first included the plain populations PS_GN, PS_UK, PS_BS, and PS_KR. The second cluster was formed by the mountain populations PS_KN and PS_AR.
Therefore, based on the results of analyses using various algorithms for determining the spatial genetic structure, the six studied populations of P. sylvestris were divided into the following two groups: plain (PS_GN, PS_UK, PS_BS, PS_KR) and highland (PS_KN, PS_AR).
During the study of P. sylvestris populations in the Urals, their spatial and genetic structure was checked for consistency with the “isolation-by-distance” model via the Mantel test. Thus, a pairwise comparison of all six studied populations revealed a weak positive correlation (r2 = 0.176) between geographic and genetic distances (DN) (Figure S2).
In addition, a correlation analysis of geoclimatic and genetic distances revealed their weak correlation (r2 = 0.1923, p = 0.05). A significant scatter of points (Figure S3) suggested that the correlation may be strong for certain groups of populations.

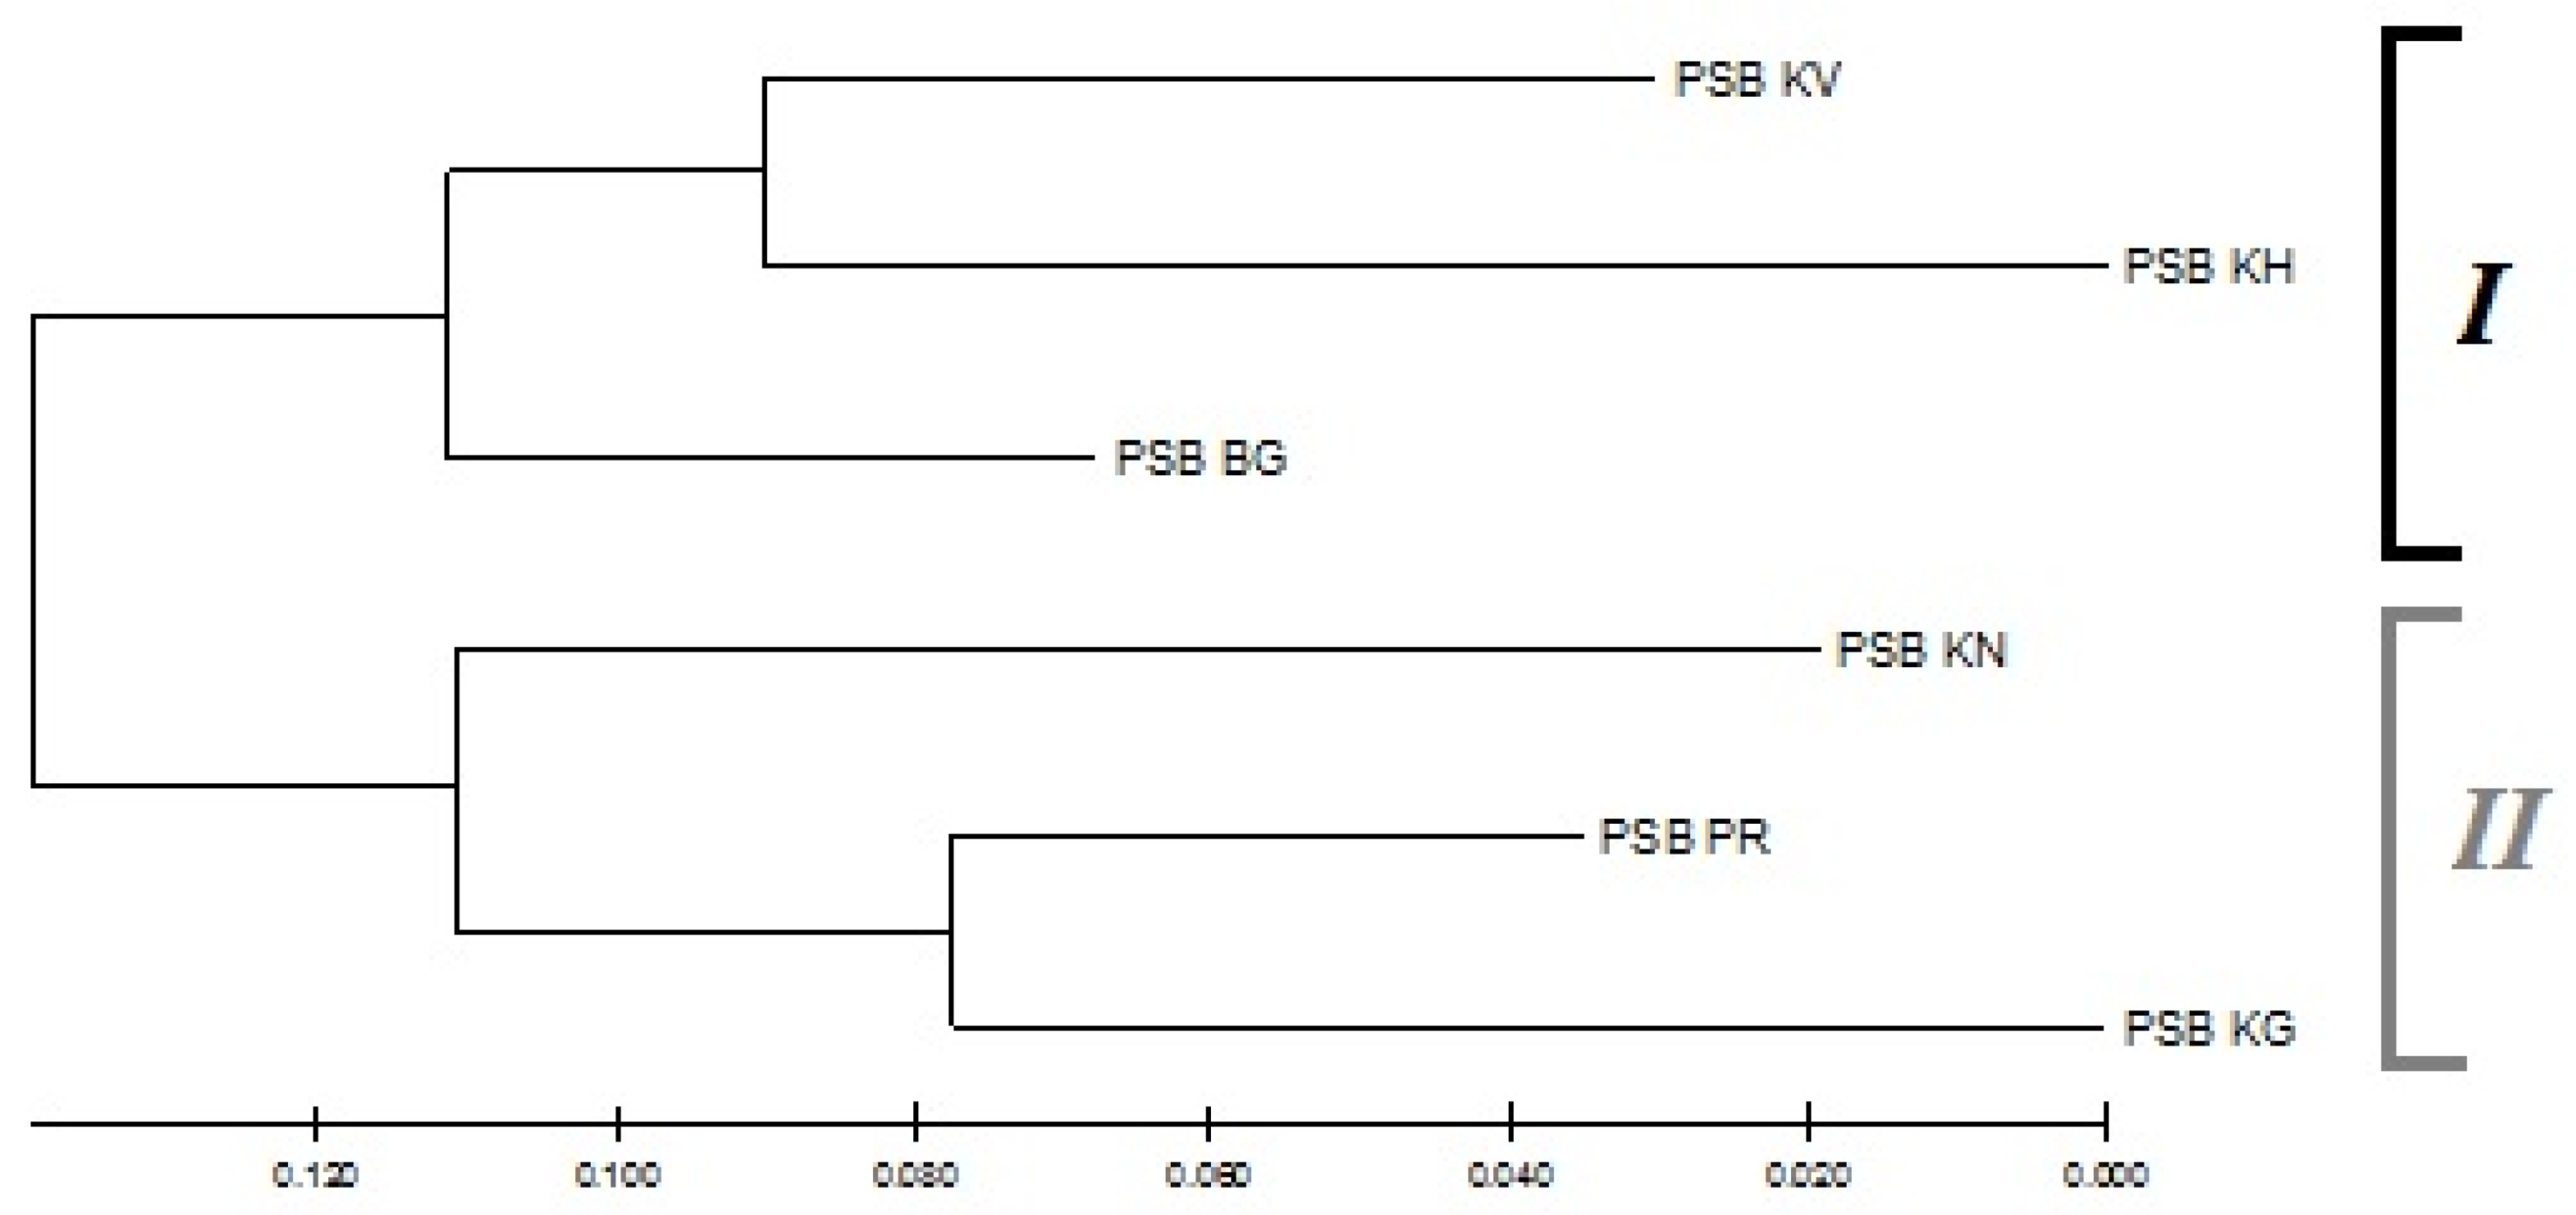
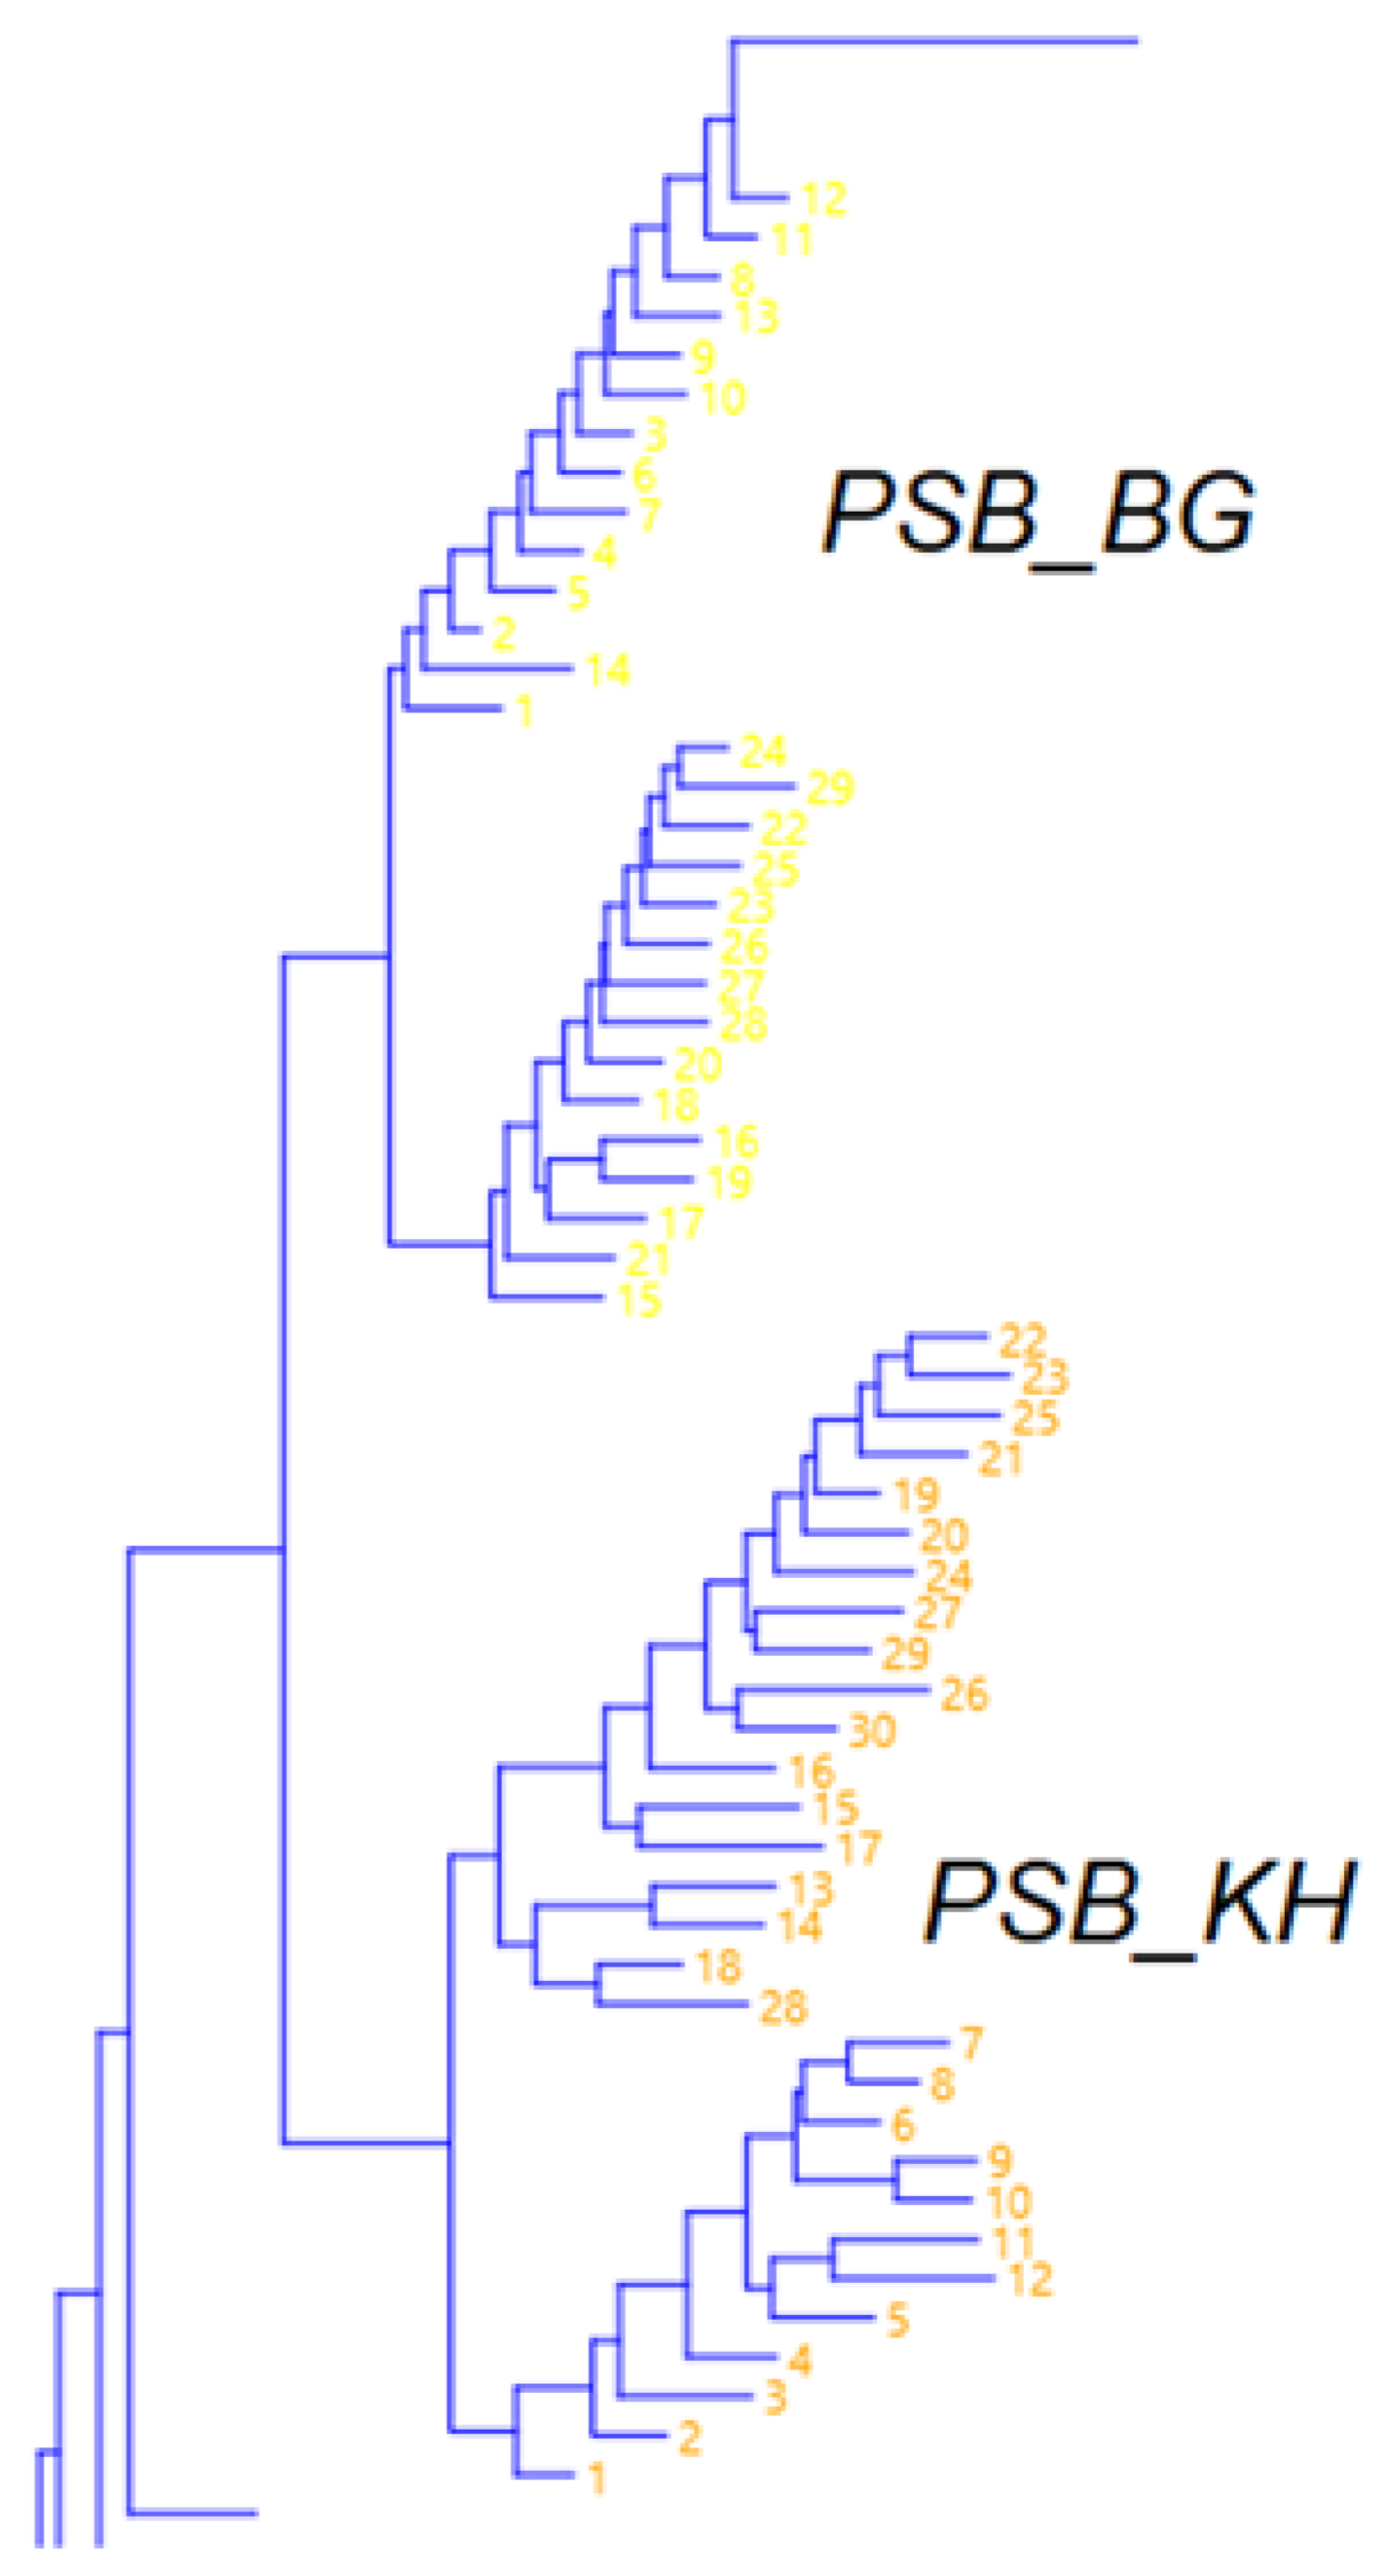
3.4. Population Genetic Structure of P. sibirica

Analysis of the genetic structure of the studied P. sibirica populations revealed that the expected proportion of heterozygous genotypes (HT) per total sample was 0.273, whereas the expected proportion of heterozygous genotypes in a subpopulation (HS) was 0.147. The population subdivision coefficient (GST) shows that the interpopulation component accounts for 0.460 of the total genetic diversity.
The values of pairwise PhiPT genetic distances revealed by AMOVA ranged from 0.397 (PSB_PR/PSB_KN) to 0.629 (PSB_KV/PSB_KG). Differences in genetic distances between populations were statistically significant (Table 7). For the total sample of P. sibirica, the PhiPT index was 0.491, which corresponds to the GST value = 0.460.
In summary, the analysis of molecular variability (AMOVA) showed that genetic diversity is distributed between the intrapopulation and interpopulation components approximately equally at 49% and 51%, respectively (Table 8).
The smallest genetic distance was observed between the populations PSB_KV and PSB_BG (DN = 0.121), and the highest (DN = 0.285) was observed between the populations PSB_KH and PSB_KG (Table 9). Based on the matrix of pairwise genetic distances (DN), cluster analysis was performed and a dendrogram reflecting the degree of similarity according to ISSR profiles of the studied populations was constructed (Figure 3). On the dendrogram, the studied populations formed two clusters. Additionally, using the PAST 4 program, a dendrogram reflecting the degree of similarity in ISSR profiles of the studied samples was constructed. It was found that PSB_BG and PSB_KH populations are subdivided into two subclusters (Figure 4).
The separation of populations into two clusters is supported by the results of the principal coordinates analysis (PCA), based on the PhiPT index calculated with the AMOVA package. The populations were distributed unequally during the ordination (Figure S4). Two groups were distinguished: The first one included the populations PSB_KV, PSB_KH, and PSB_BG. The second cluster was formed by the populations PSB_KN, PSB_KG, and PSB_PR. PAST 4 analysis was performed using the UMAP method, which confirmed the separation of the PSB_BG and PSB_KH populations into two subclusters (Figure S5).
In summary, the results of analyses using different algorithms for determining the spatial genetic structure revealed the subdivision of the six studied populations of P. sibirica into the following two groups: I (PSB_KV, PSB_KH, PSB_BG) and II (PSB_PR, PSB_KG, PSB_KN). Additionally, the PSB_BG and PSB_KH populations are further subdivided into two subclusters.
During the study of P. sibirica populations in the Urals, their spatial and genetic structure was checked for compliance with the “isolation-by-distance” model. Thus, Mantel’s test revealed no correlation (r2 = 0.075) between geographic and genetic (DN) distances in a pairwise comparison of all six populations studied. Similarly, a correlation analysis of climatic and genetic distances (Figure S6) was performed, which revealed their weak inverse correlation (r2 = 0.1257, p = 0.05).

4. Discussion

4.1. Genetic Diversity of P. sylvestris

The resent results based on ISSR profiles for P. sylvestris are in agreement with previous work [30]. As a result, we found that the level of genetic diversity in P. sylvestris populations in the study region was high (He = 0.163; ne = 1.270), which agrees with the previously obtained data by A.I. Vidyakin et al. in the northeast of the Russian Plain (He = 0.136; ne = 1.505) [28]. At the same time, a higher level of heterozygosity was observed in Scots pine populations in the Southern Urals (P95 = 0.823; He = 0.239; ne = 1.385) [51]. A lower level of genetic diversity is reported in Verkhoturye’s (PS_KN) forest population. These results are probably related to the high anthropogenic load due to the development of titanomagnetite ores and iron ore deposits, conducted since 1957.

4.2. Population Genetic Structure of P. sylvestris

The populations studied were divided into two groups according to their location at altitude. Following the analysis of molecular variability (AMOVA), the studied populations of P. sylvestris are significantly differentiated, and about half (41%) of the observed genetic diversity is concentrated within the populations. The obtained data also indicate the existence of several genetically differentiated populations and their groups in P. sylvestris in the study region.
The level of population subdivision is high and significantly higher than that obtained for coniferous plant species by isoenzyme and microsatellite analyses [52,53]. This may be due to the peculiarity of the ISSR primers we used since, in other studies where the same ISSR method is used, subdivision rates are similar to those obtained in this study [28]. The high differentiation of populations may be the result of the fragmentation of the range of Scotch pine in the study region, as well as the result of intensive felling of coniferous trees in the region. Fragmentation of the species range reduces the possibility of gene flow between populations when their gene pools are mixed, causes genetic drift, and increases the frequency of closely related crossbreeding [54]. Possibly, the nature of population differentiation is also related to the distribution history of species from Pleistocene refugia, in particular the South Ural refugium, which has made a dominant contribution to the formation of the P. sylvestris gene pool in the Urals [55]. For example, the populations of Kachkanarskii (PS_KN) and Arakul (PS_AR) are more than 310 km apart but are genetically close (D = 0.147), probably because these populations were dispersed from the South Ural refugium on the migration route. At the same time, there is a weak positive correlation (r2 = 0.176; p = 0.004) between genetic and geographic distances. In addition, the correlation analysis of geoclimatic and genetic distances suggests a weak correlation (r2 = 0.1923, p = 0.05). Most likely, climatic differences affecting the pollen-releasing period of populations contribute to the differentiation.

4.3. Genetic Diversity of P. sibirica

A molecular genetic study of P. sibirica populations revealed 126 polymorphic PCR amplicons, which exceeds the value for P. sylvestris species. Overall, a high level of genetic diversity for P. sibirica populations was revealed, which agrees with the data obtained earlier using various molecular markers. A high level of polymorphism in the P. sibirica populations of the northwestern and southeastern parts of the range, as well as populations of the Altai-Sayan Mountain region which is the focus of relic populations of Siberian pine, was revealed using isoenzyme analysis [13,56]. In addition, high rates of genetic diversity in P. sibirica populations were obtained by molecular genetic analysis using SSR or ISSR approaches [57], which are generally characteristic of most conifer species with extensive continuous ranges and high population numbers [58].
Moreover, it should be pointed out that SSR and ISSR markers for P. sibirica show a higher level of polymorphism compared to isoenzyme-based markers, and their variability also reflects a significant genetic differentiation of populations [13,24]. The findings of this study confirm this trend.
The lowest values of genetic polymorphism were found for the PSB_KV population growing in the vicinity of the Verkh-Yazva settlement. This population of P. sibirica is susceptible to a significant anthropogenic impact caused by periodic logging and high recreational pressure. In addition, the insignificant degree of genetic polymorphism of this population can be explained by its territorial and reproductive isolation from the nearby massifs of Siberian pine separated from them by forests dominated by other tree species, which can impair the exchange of pollen between trees in these dense mixed stands [24].

4.4. Population Genetic Structure of P. sibirica

The study of the genetic structure of P. sibirica populations revealed that they are highly differentiated, with about half of the observed genetic diversity concentrated within populations. According to the ISSR data analysis, it was observed that the studied populations of P. sibirica in Perm Krai possess a greater degree of differentiation (Gst = 0.460) than populations located in the Altai-Sayan Mountain country and the West Siberian Plain (Gst = 0.330). A similar trend was also observed in the analysis of isoenzymes-based markers in populations located in these regions of Siberia [13]. The high subdivision of populations can be caused by the fragmentation of the Siberian pine range at the western limit of the species distribution, which can be associated with global climatic changes and anthropogenic influence.
P. sibirica populations were clustered into two major groups. It was noted that the PSB_BG population was subdivided internally into two subclusters. The subdivision of the population into subclusters correlates with the altitude above sea level. Phylogeny trees included in subcluster 1 grow on the top of the North Baseg Mountain at an altitude of about 900 m above sea level. The second subcluster included trees that are located on the western slope of the mountain, where the altitude is about 520 m above sea level.
The PSB_KH population was also divided into two subclusters. Such a division may be due to the presence of a locality (about 4–6 km), dividing the forest area into two parts. In addition, it should be noted that part of the population, which was included in subcluster 1, grows in conditions of marshland; therefore, it can be assumed that a high contribution to the differentiation and polymorphism of populations is made by differences in habitat conditions, and in particular by differences in the water and mineral regime. A similar pattern was also observed in studies of genetic structure and differentiation of the bog and dryland populations of P. sibirica [24].
No correlation between genetic and geographic distances in P. sibirica populations was found, as well as no relationship between differentiation and climatic differences in habitats. This may be due to the fragmented range of Siberian pine at the western limit of the species distribution. Additionally, in some populations of P. sibirica there is a strong intrapopulation differentiation, expressed by the division of the two populations into subclusters. The study of the phylogeographic structure of populations of various species allows us to conclude that their migration history makes an “imprint” on the genetic structure of populations [36]. The study of the genetic structure of populations using high polymorphic ISSR markers allows us to hypothesize on the past migration history of Siberian pine.
However, to suggest these hypotheses, it is required to study populations across the entire range of P. sibirica species. In this study, only six populations located in the Urals were studied; therefore, this survey contributes only fractionally to the overall knowledge of the genetics of the studied species. Previously, populations of Siberian pine in the Urals were not studied using ISSR. However, the populations located in the Ural Mountain region are of particular interest because the formation of the range of this species originated from these areas in the post-glacial period. The migration of P. sibirica northward and eastward through the West Siberian Plain along the southern watershed of the Ob River was previously suggested [36]. This study shows that, despite the location of populations on the margin of the habitat, the populations are characterized by high genetic diversity in comparison with populations located in the West Siberian Plain and the Southeastern Siberian Plateau. This finding indirectly supports the view that the populations located in the Urals are ancestral.

5. Conclusions

Analysis of the genetic diversity of the two species of the genus Pinus (P. sylvestris and P. sibirica) showed no significant difference between the level of diversity of their populations under the conditions of their habitat in the Middle and Northern Urals. In the P. sylvestris population, there is a higher level of expected heterozygosity, whereas P. sibirica has a higher number of identified DNA fragments. In both species, there is a significant degree of interpopulation differentiation, but the Siberian pine population is more differentiated than the Scots pine population. The data obtained over the course of the study can be used for molecular genetic identification of populations, in the search for biologically active substances by taking into account the differentiation of populations of two species of the genus Pinus in the study region, and for appropriate forest management methods aimed at conserving genetic resources.

Supplementary Materials

The following supporting information can be downloaded at: https://www.mdpi.com/article/10.3390/f13081278/s1. Table S1. The studied natural populations of P. sylvestris and P. sibirica used in ISSR analysis. Table S2. Pairwise geographic distances (km) between the studied populations of P. sylvestris. Table S3. Pairwise geographic distances (km) between the studied populations of P. sibirica. Figure S1. Ordination of the studied populations of P. sylvestris using PCA, obtained on the basis of PhiPT matrix of genetic distances. Figure S2. Graph of dependence of genetic (DN) and geographical distances of P. sylvestris populations. Figure S3. Mantel test for the WorldClim data and genetic distance of P. sylvestris. Figure S4. Ordination of the studied populations of P. sylvestris using PCA, obtained on the basis of PhiPT matrix of genetic distances. Figure S5. Distribution of individuals in the studied Pinus sibirica Du Tour populations using UMAP. Figure S6. Mantel test for the WorldClim data and genetics distance of P. sibirica. Figure S7. Pinus sylvestris L., Perm Krai, Gainy’s forest population. Figure S8. Pinus sylvestris L., Perm Krai, Karagay’s forest population. Figure S9. Pinus sylvestris L., Perm Krai, Perm’s Forest population. Figure S10. Pinus sylvestris L., Perm Krai, Bolshesosnovsky’s forest population. Figure S11. Pinus sylvestris L., Sverdlovsk Oblast, Verkhoturye’s forest population. Figure S12. Pinus sylvestris L., Chelyabinsk Oblast, Vishnyovogorsk’s forest population. Figure S13. Pinus sibirica Du Tour, Perm Krai, Krasnovishersk’s forest population. Figure S14. Pinus sibirica Du Tour, Perm Krai, Kochyovo’s forest population. Figure S15. Pinus sibirica Du Tour, Perm Krai, Gornozavodsk’s forest population. Figure S16. Pinus sibirica Du Tour, Perm Krai, Kishert’s forest population. Figure S17. Pinus sibirica Du Tour, Perm Krai, Chusovoy’s forest population. Figure S18. Pinus sibirica Du Tour, Sverdlovsk Oblast, Verkhoturye’s forest population. Figure S19. The band profiles with ISSR primer X11 ((AGC)6G) for the samples of P. sibirica from the population of Gornozavodsk’s forest (PSB_BG). Figure S20. The band profiles with ISSR primer ISSR-9 ((ACG)7G) for the samples of P. sibirica from the population of Kochyovo’s forest (PSB_KH). Figure S21. The band profiles with ISSR primer M1 ((AC)8CG) for the samples of P. sibirica from the population of Gornozavodsk’s forest (PSB_BG). Figure S22. The band profiles with ISSR primer M1 ((AC)8CG) for the samples of P. sibirica from the population of Kochyovo’s forest (PSB_KH). Figure S23. The band profiles with ISSR primer X11 ((AGC)6G) for the samples of P. sibirica from the population of Krasnovishersk’s forest (PSB_KV). Figure S24. The band profiles with ISSR primer ISSR-1 ((AC)8T)) for the samples of P. sylvestris from the population of Perm’s Forest (PS_UK). Figure S25. The band profiles with ISSR primer ISSR-1 ((AC)8T) for the samples of P. sylvestris from the population of Gainy’s forest (PS_GN). Figure S26. The band profiles with ISSR primer X10 ((AGC)6C) for the samples of P. sylvestris from the population of Karagay’s forest (PS_KG). Figure S27. The band profiles with ISSR primer ISSR-1 ((AC)8T) for the samples of P. sylvestris from the population of Verkhoturye’s forest (PS_KN). Figure S28. The band profiles with ISSR primer X10 ((AGC)6C) for the samples of P. sylvestris from the population of Vishnyovogorsk’s forest (PS_AR).

Author Contributions

Data curation, S.B. and N.C.; formal analysis and investigation, N.C., M.D., Y.N., A.Z. and N.P.; methodology, R.K.; resources, S.B.; supervision, S.B. and R.K.; validation, S.B. and N.C.; statistical analysis, N.C., A.Z. and Y.N.; writing—original draft, S.B., R.K. and Y.N.; writing—review and editing, S.B. and R.K. All authors have read and agreed to the published version of the manuscript.

Funding

This study was funded within the framework of state assignment No. FSNF-2020-0008 of the Federal State Autonomous Educational Institution for Higher Education “Perm State National Research University” in science and by the Government of Perm Krai, research project No. C-26/776 dated 31 March 2022. Open access funding was provided by the University of Helsinki (Finland), including Helsinki University Library, via R.K. All funders provided financial support for the research but did not have any additional role in the study design, data collection and analysis, decision to publish, or preparation of the manuscript.

Data Availability Statement

Data presented in this article are available at request from the corresponding author.

Conflicts of Interest

The authors declare no conflict of interest.

References

  1. FAO. The Global Forest Resources Assessment 2020 (Fra 2020); FAO: Rome, Italy, 2020. [Google Scholar]
  2. Du, Z.; Yu, L.; Yang, J.; Xu, Y.; Chen, B.; Peng, S.; Zhang, T.; Fu, H.; Harris, N.; Gong, P. A global map of planting years of plantations. Sci. Data 2022, 9, 141. [Google Scholar] [CrossRef] [PubMed]
  3. Almeida-Rocha, J.M.; Soares, L.; Andrade, E.R.; Gaiotto, F.A.; Cazetta, E. The impact of anthropogenic disturbances on the genetic diversity of terrestrial species: A global meta-analysis. Mol. Ecol. 2020, 29, 4812–4822. [Google Scholar] [CrossRef] [PubMed]
  4. Hogberg, P.; Nordgren, A.; Buchmann, N.; Taylor, A.F.; Ekblad, A.; Hogberg, M.N.; Nyberg, G.; Ottosson-Lofvenius, M.; Read, D.J. Large-scale forest girdling shows that current photosynthesis drives soil respiration. Nature 2001, 411, 789–792. [Google Scholar] [CrossRef] [PubMed]
  5. Lindén, A.; Heinonsalo, J.; Buchmann, N.; Oinonen, M.; Sonninen, E.; Hilasvuori, E.; Pumpanen, J. Contrasting effects of increased carbon input on boreal som decomposition with and without presence of living root system of Pinus sylvestris L. Plant Soil 2013, 377, 145–158. [Google Scholar] [CrossRef]
  6. Pan, Y.; Birdsey, R.A.; Fang, J.; Houghton, R.; Kauppi, P.E.; Kurz, W.A.; Phillips, O.L.; Shvidenko, A.; Lewis, S.L.; Canadell, J.G.; et al. A large and persistent carbon sink in the world’s forests. Science 2011, 333, 988–993. [Google Scholar] [CrossRef]
  7. Liu, X.; Chen, W.; Liu, Q.; Dai, J. Abietic acid suppresses non-small-cell lung cancer cell growth via blocking ikkbeta/nf-kappab signaling. OncoTargets Ther. 2019, 12, 4825–4837. [Google Scholar] [CrossRef]
  8. Dering, M.; Kosiński, P.; Wyka, T.P.; Pers-Kamczyc, E.; Boratyński, A.; Boratyńska, K.; Reich, P.B.; Romo, A.; Zadworny, M.; Żytkowiak, R.; et al. Tertiary remnants and holocene colonizers: Genetic structure and phylogeography of scots pine reveal higher genetic diversity in young boreal than in relict mediterranean populations and a dual colonization of fennoscandia. Divers. Distrib. 2017, 23, 540–555. [Google Scholar] [CrossRef]
  9. Ianbaev, R.; Boronnikova, S.; Yanbaev, Y.; Gainanov, S.; Kulagin, A. Population genetic diversity in quercus robur and ulmus laevis in southern urals (Russia): A comparatively study of adults and progeny in localities with contrast forest cover. Cent. Eur. For. J. 2022, 68, 101–108. [Google Scholar] [CrossRef]
  10. Makeeva, V.M.; Smurov, A.V.; Politov, D.V.; Belokon, M.M.; Belokon, Y.S.; Suslova, E.G. Comparative assessment of the gene pool and the viability of forest plantations from moscow and natural populations from the moscow region by example of norway spruce (Picea abies (L.) karst.). Russ. J. Genet. 2018, 54, 1015–1025. [Google Scholar] [CrossRef]
  11. Ferreira-Santos, P.; Zanuso, E.; Genisheva, Z.; Rocha, C.M.R.; Teixeira, J.A. Green and sustainable valorization of bioactive phenolic compounds from pinus by-products. Molecules 2020, 25, 2931. [Google Scholar] [CrossRef]
  12. Sannikov, S.N.; Petrova, I.V. Phylogenogeography and genotaxonomy of Pinus sylvestris L. Populations. Russ. J. Ecol. 2012, 43, 273–280. [Google Scholar] [CrossRef]
  13. Petrova, E.A.; Belokon, Y.S. Genetic polymorphism in siberian stone pine (Pinus sibirica Du Tour) populations from ural and altai-sayan mountains. Probl. Bot. South. Sib. Mong. 2020, 19, 081–086. [Google Scholar] [CrossRef]
  14. Milyutin, L.I. Study of siberian forest genetic resources. Sib. Lesn. Zurnal 2016, 3, 3–9. [Google Scholar] [CrossRef]
  15. Milyutin, L.I.; Muratova, E.N.; Larionova, A.Y. Development of forest genetics in russia. Sib. Lesn. Zurnal 2018, 1, 3–15. [Google Scholar] [CrossRef]
  16. Szmidt, A.E.; Wang, X.-R.; Lu, M.-Z. Empirical assessment of allozyme and rapd variation in Pinus sylvestris (L.) using haploid tissue analysis. Heredity 1996, 76, 412–420. [Google Scholar] [CrossRef]
  17. Shigapov, Z.K.; Putenikhin, K.V.; Shigapova, A.I.; Urazbakhtina, K.A.; Putenikhin, V.P. Genetic diversity of siberian stone pine under introduction in the south urals and bashkir cis-urals. Sib. Lesn. Zurnal 2016, 5, 137–146. [Google Scholar] [CrossRef]
  18. Tikhonova, I.V.; Ekart, A.K.; Zatsepina, K.G.; Kravchenko, A.N. Variability of allozyme locuss and inbreeding level in the age groups of southern-taiga and forest-steppe pine populations of the central siberia. Sib. Lesn. Zurnal 2019, 6, 70–80. [Google Scholar] [CrossRef]
  19. Semerikov, V.L.; Semerikova, S.A.; Dymshakova, O.S.; Zatsepina, K.G.; Tarakanov, V.V.; Tikhonova, I.V.; Ekart, A.K.; Vidyakin, A.I.; Jamiyansuren, S.; Rogovtsev, R.V.; et al. Microsatellite loci polymorphism of chloroplast DNA of scots pine (Pinus sylvestris L.) in asia and eastern europe. Russ. J. Genet. 2014, 50, 577–585. [Google Scholar] [CrossRef]
  20. Parfionava, N.S.; Paliavoi, S.A.; Spivak, A.A.; Hrebianchuk, A.E.; Hoh, A.N.; Kotava, S.A. Research of polymorphism of microsatellite markers of scots pine for the purposes of forensic DNA analysis. Exp. Biol. Biotechnol. 2022, 1, 90–98. [Google Scholar] [CrossRef]
  21. Tóth, E.G.; Vendramin, G.G.; Bagnoli, F.; Cseke, K.; Höhn, M. High genetic diversity and distinct origin of recently fragmented scots pine (Pinus sylvestris L.) populations along the carpathians and the pannonian basin. Tree Genet. Genomes 2017, 13, 47. [Google Scholar] [CrossRef]
  22. Tóth, E.G.; Köbölkuti, Z.A.; Pedryc, A.; Höhn, M. Evolutionary history and phylogeography of scots pine (Pinus sylvestris L.) in europe based on molecular markers. J. For. Res. 2017, 28, 637–651. [Google Scholar] [CrossRef]
  23. Kurt, W.; Hilde, N.; Markus, P.; Kirsten, W.; Günter, K. DNA Fingerprinting in Plants: Principles, Methods, and Applications, 2nd ed.; CRC Press: Boca Raton, FL, USA, 2005; p. 472. [Google Scholar] [CrossRef]
  24. Oreshkova, N.V.; Sedel’nikova, T.S.; Pimenov, A.V.; Efremov, S.P. Analysis of genetic structure and differentiation of the bog and dry land populations of pinus sibirica du tour based on nuclear microsatellite loci. Russ. J. Genet. 2014, 50, 934–941. [Google Scholar] [CrossRef]
  25. Rubio-Moraga, A.; Candel-Perez, D.; Lucas-Borja, M.E.; Tiscar, P.A.; Vinegla, B.; Linares, J.C.; Gomez-Gomez, L.; Ahrazem, O. Genetic diversity of pinus nigra arn. Populations in southern spain and northern morocco revealed by inter-simple sequence repeat profiles. Int. J. Mol. Sci. 2012, 13, 5645–5658. [Google Scholar] [CrossRef]
  26. Labra, M.; Grassi, F.; Sgorbati, S.; Ferrari, C. Distribution of genetic variability in southern populations of scots pine (Pinus sylvestris L.) from the alps to the apennines. Flora Morphol. Distrib. Funct. Ecol. Plants 2006, 201, 468–476. [Google Scholar] [CrossRef]
  27. Vasilyeva, G.; Semerikov, V. Application of amplified fragment length polymorphisms markers to study the hybridization between pinus sibirica and p. Pumila. Ann. For. Res. 2014, 57, 175–180. [Google Scholar] [CrossRef]
  28. Vidyakin, A.I.; Boronnikova, S.V.; Nechayeva, Y.S.; Pryshnivskaya, Y.V.; Boboshina, I.V. Genetic variation, population structure, and differentiation in scots pine (Pinus sylvestris L.) from the northeast of the russian plain as inferred from the molecular genetic analysis data. Russ. J. Genet. 2015, 51, 1213–1220. [Google Scholar] [CrossRef]
  29. Chertov, N.; Vasilyeva, Y.; Zhulanov, A.; Nechaeva, Y.; Boronnikova, S.; Kalendar, R. Genetic structure and geographical differentiation of larix sibirica ledeb. In the urals. Forests 2021, 12, 1401. [Google Scholar] [CrossRef]
  30. Vasilyeva, Y.; Chertov, N.; Nechaeva, Y.; Sboeva, Y.; Pystogova, N.; Boronnikova, S.; Kalendar, R. Genetic structure, differentiation and originality of Pinus sylvestris L. Populations in the east of the east european plain. Forests 2021, 12, 999. [Google Scholar] [CrossRef]
  31. Vos, P.; Hogers, R.; Bleeker, M.; Reijans, M.; van de Lee, T.; Hornes, M.; Frijters, A.; Pot, J.; Peleman, J.; Kuiper, M.; et al. Aflp: A new technique for DNA fingerprinting. Nucleic Acids Res. 1995, 23, 4407–4414. [Google Scholar] [CrossRef]
  32. Williams, J.G.; Kubelik, A.R.; Livak, K.J.; Rafalski, J.A.; Tingey, S.V. DNA polymorphisms amplified by arbitrary primers are useful as genetic markers. Nucleic Acids Res. 1990, 18, 6531–6535. [Google Scholar] [CrossRef]
  33. Zietkiewicz, E.; Rafalski, A.; Labuda, D. Genome fingerprinting by simple sequence repeat (ssr)-anchored polymerase chain reaction amplification. Genomics 1994, 20, 176–183. [Google Scholar] [CrossRef] [PubMed]
  34. Sivolap Iu, M.; Kalendar, R.N.; Chebotar, S.V. The genetic polymorphism of cereals demonstrated by pcr with random primers. TSitologiia I Genet. 1994, 28, 54–61. [Google Scholar]
  35. Voronova, A.; Rendon-Anaya, M.; Ingvarsson, P.; Kalendar, R.; Rungis, D. Comparative study of pine reference genomes reveals transposable element interconnected gene networks. Genes 2020, 11, 1216. [Google Scholar] [CrossRef] [PubMed]
  36. Shuvaev, D.N.; Ibe, A.A. Genetic structure and postglacial recolonization of pinus sibirica du tour in the west siberian plain, inferred from nuclear microsatellite markers. Silvae Genet. 2021, 70, 99–107. [Google Scholar] [CrossRef]
  37. Kalendar, R.; Boronnikova, S.; Seppanen, M. Isolation and purification of DNA from complicated biological samples. Methods Mol. Biol. 2021, 2222, 57–67. [Google Scholar] [CrossRef]
  38. Kalendar, R.; Schulman, A.H. Irap and remap for retrotransposon-based genotyping and fingerprinting. Nat. Protoc. 2006, 1, 2478–2484. [Google Scholar] [CrossRef]
  39. Kalendar, R. A guide to using fastpcr software for pcr, in silico pcr, and oligonucleotide analysis. Methods Mol. Biol. 2022, 2392, 223–243. [Google Scholar] [CrossRef]
  40. Sboeva, Y.; Vasil’eva, Y.; Chertov, N.; Pystogova, N.; Boronnikova, S.; Kalendar, R.; Martynenko, N. Molecular genetic identification of scots pine and siberian larch populations in perm krai based on polymorphism of issr-pcr markers. Sib. Lesn. Zurnal 2020, 4, 35–44. [Google Scholar] [CrossRef]
  41. Nechaeva, Y.; Pystogova, N.; Chertov, N.; Boronnikova, S. Molecular genetic analysis of Pinus sylvestris L. And pinus sibirica du tour populations in perm krai based on polymorphism issr-pcr markers. Bull. Sci. Pract. 2021, 7, 12–21. [Google Scholar] [CrossRef]
  42. Kalendar, R.; Schulman, A.H. Transposon-based tagging: Irap, remap, and ipbs. Methods Mol. Biol. 2014, 1115, 233–255. [Google Scholar] [CrossRef]
  43. Peakall, R.O.D.; Smouse, P.E. Genalex 6: Genetic analysis in excel. Population genetic software for teaching and research. Mol. Ecol. Notes 2006, 6, 288–295. [Google Scholar] [CrossRef]
  44. Yeh, F.C.; Yang, R.C.; Boyle, T.B.J.; Ye, Z.H.; Mao, J.X. Popgene, the User Friendly Shareware for Population Genetic Analysis; University of Alberta: Edmonton, AB, Canada, 1997; Volume 10. [Google Scholar]
  45. Nei, M.; Li, W.H. Mathematical model for studying genetic variation in terms of restriction endonucleases. Proc. Natl. Acad. Sci. USA 1979, 76, 5269–5273. [Google Scholar] [CrossRef] [PubMed]
  46. Nei, M. Molecular Evolutionary Genetics; Columbia University Press: New York, NY, USA, 1987. [Google Scholar] [CrossRef]
  47. Kumar, S.; Stecher, G.; Li, M.; Knyaz, C.; Tamura, K. Mega x: Molecular evolutionary genetics analysis across computing platforms. Mol. Biol. Evol. 2018, 35, 1547–1549. [Google Scholar] [CrossRef] [PubMed]
  48. Hammer, Ø.; Harper, D.A.T.; Ryan, P.D. Past: Paleontological statistics software package for education and data analysis. Palaeontol. Electron. 2001, 4, 9. [Google Scholar]
  49. McInnes, L.; Healy, J.; Saul, N.; Großberger, L. Umap: Uniform manifold approximation and projection. J. Open Source Softw. 2018, 3, 861. [Google Scholar] [CrossRef]
  50. Virtanen, P.; Gommers, R.; Oliphant, T.E.; Haberland, M.; Reddy, T.; Cournapeau, D.; Burovski, E.; Peterson, P.; Weckesser, W.; Bright, J.; et al. Scipy 1.0: Fundamental algorithms for scientific computing in python. Nat. Methods 2020, 17, 261–272. [Google Scholar] [CrossRef]
  51. Khanova, E.; Konovalov, V.; Timeryanov, A.; Isyanyulova, R.; Rafikova, D. Genetic and selection assessment of the scots pine (Pinus sylvestris L.) in forest seed orchards. Wood Res. 2020, 65, 283–292. [Google Scholar] [CrossRef]
  52. Yanbaev, Y.; Sultanova, R.; Blonskaya, L.; Bakhtina, S.; Tagirova, A.; Tagirov, V.; Kulagin, A. Gene pool of scots pine (Pinus sylvestris L.) under reforestation in extreme environment. Wood Res. 2020, 65, 459–470. [Google Scholar] [CrossRef]
  53. Șofletea, N.; Mihai, G.; Ciocîrlan, E.; Curtu, A.L. Genetic diversity and spatial genetic structure in isolated scots pine (Pinus sylvestris L.) populations native to eastern and southern carpathians. Forests 2020, 11, 1047. [Google Scholar] [CrossRef]
  54. Kremer, A.; Hipp, A.L. Oaks: An evolutionary success story. New Phytol. 2020, 226, 987–1011. [Google Scholar] [CrossRef]
  55. Sannikov, S.N.; Petrova, I.V.; Egorov, E.V.; Sannikova, N.S. A system of pleistocene refugia for Pinus sylvestris L. In the southern marginal part of the species range. Russ. J. Ecol. 2014, 45, 167–173. [Google Scholar] [CrossRef]
  56. Petrova, Y.A.; Velisevich, S.N.; Belokon, M.M.; Belokon, Y.S.; Politov, D.V.; Goroshkevich, S.N. Genetic diversity and differentiation of siberian stone pine populations at the southern edge in lowland part of west siberia. Ecol. Genet. 2014, 12, 48–61. [Google Scholar] [CrossRef]
  57. Yang, C.; Wei, L.; Jiang, J.; Liu, G.; Zhao, G. Analysis of genetic diversity for nineteen populations of pinus sibirica du tour with technique of issr. J. Northeast. For. Univ. 2005, 33, 1–3. [Google Scholar]
  58. Hamrick, J.L.; Godt, M.J.W.; Sherman-Broyles, S.L. Factors Influencing Levels of Genetic Diversity in Woody Plant Species; Springer: Dordrecht, The Netherlands, 1992; pp. 95–124. [Google Scholar] [CrossRef]
Figure 1. Schematic map of the location of the studied populations of P. sylvestris (cyan marker): PS_AR—Vishnyovogorsk; PS_KN—Verkhoturye; PS_GN—Gainy; PS_KG—Karagay; PS_UK—Perm; PS_BS—Bolshesosnovsky. P. sibirica (blue marker): PSB_KV—Krasnovishersk; PSB_KH—Kochyovo; PSB_KG—Chusovoy; PSB_BG—Gornozavodsk; PSB_KN—Verkhoturye; PSB_PR—Kishert.
Forests 13 01278 g001
Figure 2. Dendrogram of genetic similarity of six studied populations of P. sylvestris, built based on polymorphism of ISSR profiles by neighbor-joining method (I, II—cluster numbers).
Forests 13 01278 g002
Figure 3. Dendrogram of genetic similarity of six studied populations of P. sibirica, built based on polymorphism of ISSR profiles by neighbor-joining method (I, II—cluster numbers).
Forests 13 01278 g003
Figure 4. Dendrogram reflects the degree of similarity in ISSR profiles of the two studied samples of P. sibirica. The numbers are corresponded to the individual trees.
Forests 13 01278 g004
Table 1. The information of ISSR primers used to assess the genetic diversity of Pinus sp.
Primer IDSequence (5′–3′)Tm (°C) Ta (°C) *Total BandsPIC *
ISSR-1(AC)8TACACACACACACACACT59.056150.315
CR-212(CT)8TGCTCTCTCTCTCTCTCTTG55.156140.316
CR-215(CA)6GTCACACACACACAGT52.056240.331
M27(GA)8CGAGAGAGAGAGAGAGAC54.352170.251
X10(AGC)6CAGCAGCAGCAGCAGCAGCC72.564190.300
X11(AGC)6GAGCAGCAGCAGCAGCAGCG72.564300.309
CR-217(GT)6GGGTGTGTGTGTGTGG53.852210.331
ISSR-9(ACG)7GACGACGACGACGACGACGACGG73.764290.305
M1(AC)8CGACACACACACACACACCG63.660220.369
* Ta—optimal annealing temperature; PIC—Polymorphism information content.
Table 2. Genetic diversity of the studied populations of P. sylvestris.
PopulationsHeneIR
PS_GN0.1851.3120.2800
(0.021)(0.040)(0.030)
PS_KN0.1491.2440.2293
(0.020)(0.036)(0.029)
PS_KG0.1631.2690.2484
(0.020)(0.037)(0.030)
PS_BS0.1521.2440.2351
(0.019)(0.034)(0.028)
PS_UK0.1501.2460.2310
(0.020)(0.035)(0.029)
PS_AR0.1801.3050.2721
(0.021)(0.039)(0.031)
Total0.1631.2700.2499
(0.008)(0.015)(0.012)
He—expected heterozygosity; ne—effective number of alleles per locus; I—Shannon’s information index. All of the above parameters have standard deviations given in brackets. R—number of unique fragments.
Table 3. Genetic diversity of the studied populations of P. sibirica.
PopulationsHeneIR
PSB_KV0.1151.1950.1741
(0.016)(0.029)(0.023)
PSB_KH0.2001.3460.2984
(0.018)(0.034)(0.026)
PSB_BG0.1591.2730.2381
(0.018)(0.032)(0.025)
PSB_PR0.1271.2140.1920
(0.016)(0.030)(0.024)
PSB_KG0.1251.2210.1861
(0.017)(0.032)(0.025)
PSB_KN0.1601.2380.2628
(0.014)(0.025)(0.021)
Total0.1481.2480.22515
(0.007)(0.013)(0.010)
He—expected heterozygosity; ne—effective number of alleles per locus; I—Shannon’s information index. All of the above parameters have standard deviations in standard deviations given in brackets. R—number of unique fragments.
Table 4. Paired PhiPT genetic distances between the studied populations of P. sylvestris by AMOVA.
PS_GNPS_KNPS_KRPS_BSPS_UK
0.402-0.0010.0010.001PS_KN
0.4050.502-0.0010.001PS_KR
0.1370.4330.425-0.001PS_BS
0.2330.4490.4770.242-PS_UK
0.4280.3700.4620.4640.461PS_AR
PhiPT index values are shown below the diagonal.
Table 5. Assessment of genetic intra- and interpopulation variability in P. sylvestris populations by AMOVA.
Subdivision IndexdfSSMSVariance%p
Between populations5873,646174,729571041%<0.001
Within populations1691,410,8228348834859%<0.001
df—degrees of freedom, SS—the sum of squares, MS—standard deviation, %—the percentage of total genetic diversity, p—significance level when using 1000 rounds of permutation.
Table 6. Pairwise genetic distances (DN) between the populations studied of P. sylvestris.
PS_GNPS_KNPS_KRPS_BSPS_UK
0.147 PS_KN
0.1360.201 PS_KR
0.0350.1480.136 PS_BS
0.0400.1510.1610.060 PS_UK
0.1940.1470.2050.1950.199PS_AR
PS_GN, PS_KN, PS_KR, PS_BS, PS_UK, PS_AR—population designations.
Table 7. Paired PhiPT genetic distances between the studied populations of P. sibirica by AMOVA.
PSB_KVPSB_KHPSB_BGPSB_PRPSB_KG
0.424-0.0010.0010.001PSB_KH
0.4240.437-0.0010.001PSB_BG
0.5660.5170.515-0.001PSB_PR
0.6290.5650.5420.424-PSB_KG
0.4930.4860.4770.3970.446PSB_KN
PhiPT index values are shown below the diagonal.
Table 8. Assessment of genetic intra- and interpopulation variability in P. sibirica populations by AMOVA.
Subdivision IndexdfSSMSVariance%p
Between populations51,389,452277,89011,07849%<0.001
Within populations1401,598,37011,41711,41751%<0.001
df—degrees of freedom, SS—the sum of squares, MS—standard deviation, %—the percentage of total genetic diversity, p—significance level when using 1000 rounds of permutation.
Table 9. Pairwise genetic distances (DN) between the populations studied of Pinus sibirica De Tour.
PSB_KVPSB_KHPSB_BGPSB_PRPSB_KG
0.145 PSB_KH
0.1210.160 PSB_BG
0.2140.2200.198 PSB_PR
0.2710.2850.1920.125 PSB_KG
0.2270.2560.1920.1670.195PSB_KN
PSB_KV, PSB_KH, PSB_BG, PSB_PR, PSB_KG, PSB_KN—population designations.
Publisher’s Note: MDPI stays neutral with regard to jurisdictional claims in published maps and institutional affiliations.

