Article

Functional Diversity and Its Influencing Factors in a Subtropical Forest Community in China

1
College of Life and Environmental Science, Guilin University of Electronic Technology, Guilin 541004, China
2
Key Laboratory of Ecology of Rare and Endangered Species and Environmental Protection (Guangxi Normal University), Ministry of Education, Guilin 541004, China
3
Key Laboratory of Vegetation Restoration and Management of South China Botanical Garden of Degraded Ecosystems, Chinese Academy of Sciences, Guangzhou 510650, China
4
Center of Plant Ecology, Core Botanical Gardens, Chinese Academy of Sciences, Guangzhou 510650, China
*
Author to whom correspondence should be addressed.
Forests 2022, 13(7), 966; https://doi.org/10.3390/f13070966
Submission received: 21 April 2022 / Revised: 12 June 2022 / Accepted: 13 June 2022 / Published: 21 June 2022
(This article belongs to the Special Issue Long-Term Monitoring of Forest Biodiversity and Dynamics in China)

Abstract

:
Functional diversity is considered a key link between ecosystem functions and biodiversity, and forms the basis for making community diversity conservation strategies. Here, we chose a subtropical forest community in China as the research object, which is unique in that other regions of the world at the same latitude have almost no vegetation cover. We measured 17 functional traits of 100 plant species and calculated seven different functional diversity indices, based on functional richness, evenness, and divergence. We found that most functional diversity and species diversity indices significantly differed with plant habit. There was a significant positive correlation among functional richness indices. However, functional divergence indices, multidimensional functional divergence (FDiv), and Rao’s quadratic entropy index (RaoQ) were significantly negatively correlated, and RaoQ and functional divergence indices (FDis) were uncorrelated. The correlations between three types (richness, evenness, and divergence) of functional diversity indices and three species diversity indices were different. Lineage regression results generally showed that three functional richness indices (Average distance of functional traits (MFAD), Functional volume (FRic) and Posteriori functional group richness (FGR)) were increased with three species diversity indices (species richness (S), Shannon-Wiener index (H) and Pielou index (E)). The functional evenness index (FEve) decreased with species richness (S), Shannon-Wiener index (H) and increased with species evenness (Pielou index (E)), but the change trends were small. All three types of functional diversity indices declined with altitude, although altitude had a weak influence on them. Other environmental factors affected the functional diversity of the community. Here, soil total phosphorus (TP) was the most critical environmental factor and the convex had the least effect on functional diversity in our subtropical forest community. These results will contribute to our understanding of functional diversity in subtropical forests, and provide a basis for biodiversity conservation in this region.

1. Introduction

The mechanisms underlying the maintenance of species diversity in forest communities has long been a hotspot of community ecology research. However, early research on community biodiversity mainly focused on species diversity. In recent years, functional diversity, the range and distribution of species’ character values in a community or ecosystem [1], has been increasingly considered a key aspect of biodiversity [2,3,4]. Over the past 30 years, the development of functional ecology has resulted in more ecological research focusing on functional traits and functional diversity, and specifically the relationship between functional diversity of plant communities and ecosystem functions [1,5,6]. Compared with species diversity, which reflects the relationships between organisms, the environment, and species richness, functional diversity takes into account the complimentary and redundancy of co-existing species, functional diversity connects organisms and ecosystems [7], and describes ecosystem functions with multiple traits [1] to better explain and predict ecological phenomena.
Functional diversity is the result of species’ diversity and plant functional traits, which represents the functional stability of plant community and ecosystem, and is the functional decision of plant community to adapt to the climate, nutrition and other living environmental factors. However, a precise definition of functional diversity, and hence a framework for its quantification, have proved elusive [8]. Numerous measures of the functional diversity of communities have been proposed based on plant traits such as Leaf chlorophyll concentration (Chl), Leaf area (LA) and other traits [4,9,10,11,12,13]. Podani emphasized the necessity of the methodological standardization of functional diversity measures [14]. According to the composition of species diversity, Mason divided functional diversity into functional richness (mainly measures the actual niche space occupied by species), functional uniformity/evenness (refers to the degree to which the functional characteristics of species are evenly distributed in the ecological space of the community), and functional divergence (describes the maximum dispersion of functional characteristics of species in community multi-dimensional feature space) [8]. The relationships between species diversity and functional diversity metrics have been key in identifying ecological processes and functions, and the combined use of both species and functional diversity is considered to be the best practice for studying the mechanisms of community coexistence and diversity conservation strategies [15,16].
It has also been suggested that functional diversity metrics may be used to predict the impact of functionally unique species on ecosystems, and thus represent a link between functional diversity and ecosystem processes [6]. A key feature of functional diversity research is the study of the functional distances between species within a community or an ecosystem, which are affected by species richness and diversity. Previous research has indicated that functional diversity increases with species diversity [8], while some have posited that functional divergence decreases gradually with the increase in species diversity [12]. With the increase in the functional evenness index and functional richness index, the species diversity of plant communities in sandy land increases in the form of power function, and there is no significant correlation between species diversity and functional divergence [17]. The study of different types of community is helpful to reveal the relationship between species diversity and functional diversity of community, which is of positive significance for specific forest community diversity conservation.
Functional diversity indices capture the distribution of trait values within communities, and can demonstrate systematic variation along environmental gradients [18], and also have a difference among plant habits. Three orthogonal components (richness, evenness, and divergence) can be indicative of the intensity of environmental assembly filters [19] and the measure ecosystem functionality [20]. Altitude also plays an important role in species distribution [21], and therefore it can affect species composition. For example, a recent study that found functional richness of a community decreased with elevation [22]. In addition, functional traits, especially leaf functional traits, usually have a variation due to the influences of environmental factors and soil nutrients at different altitudes [23,24]. Therefore, it is necessary to further study and discus how altitude and other environmental factors affect community functional diversity. It can provide insight into these relationships to study subtropical forest communities with long histories of species diversity monitoring and rich functional traits.
Here, we analyze the functional diversity and its influencing factors including the relationships between functional and species diversity through forest communities in the Dinghu Mountain Nature Reserve in China. The nature reserve has a large area of intact subtropical zonal primeval forest rarely protected at the same latitude. We selected seven commonly used functional diversity indices to characterize the functional richness, evenness, and divergence of communities, for investigating the relationship between functional and species diversity, and specifically how it varies with altitude. We aimed to: (1) measure differences in functional diversity between different plant habits, (2) explore the relationships between functional diversity indices in this subtropical forest community, (3) fit the internal relationship between functional diversity and species diversity, (4) assess elevation and other environmental factors’ variation in functional diversity indices. Our research presents the measurements of the relationships between functional and species diversity, plant habit, and environmental factors in a lower subtropical forest in China. It can help in formulating conservation measures for it. This study can help us understand the state of functional diversity of zonal forests in the south Subtropical region, and understand the effects of biological (species diversity) and abiotic (environmental factors) on functional diversity of forest communities in this region. It could serve as a model for such research in forests in other regions of the world.

2. Materials and Methods

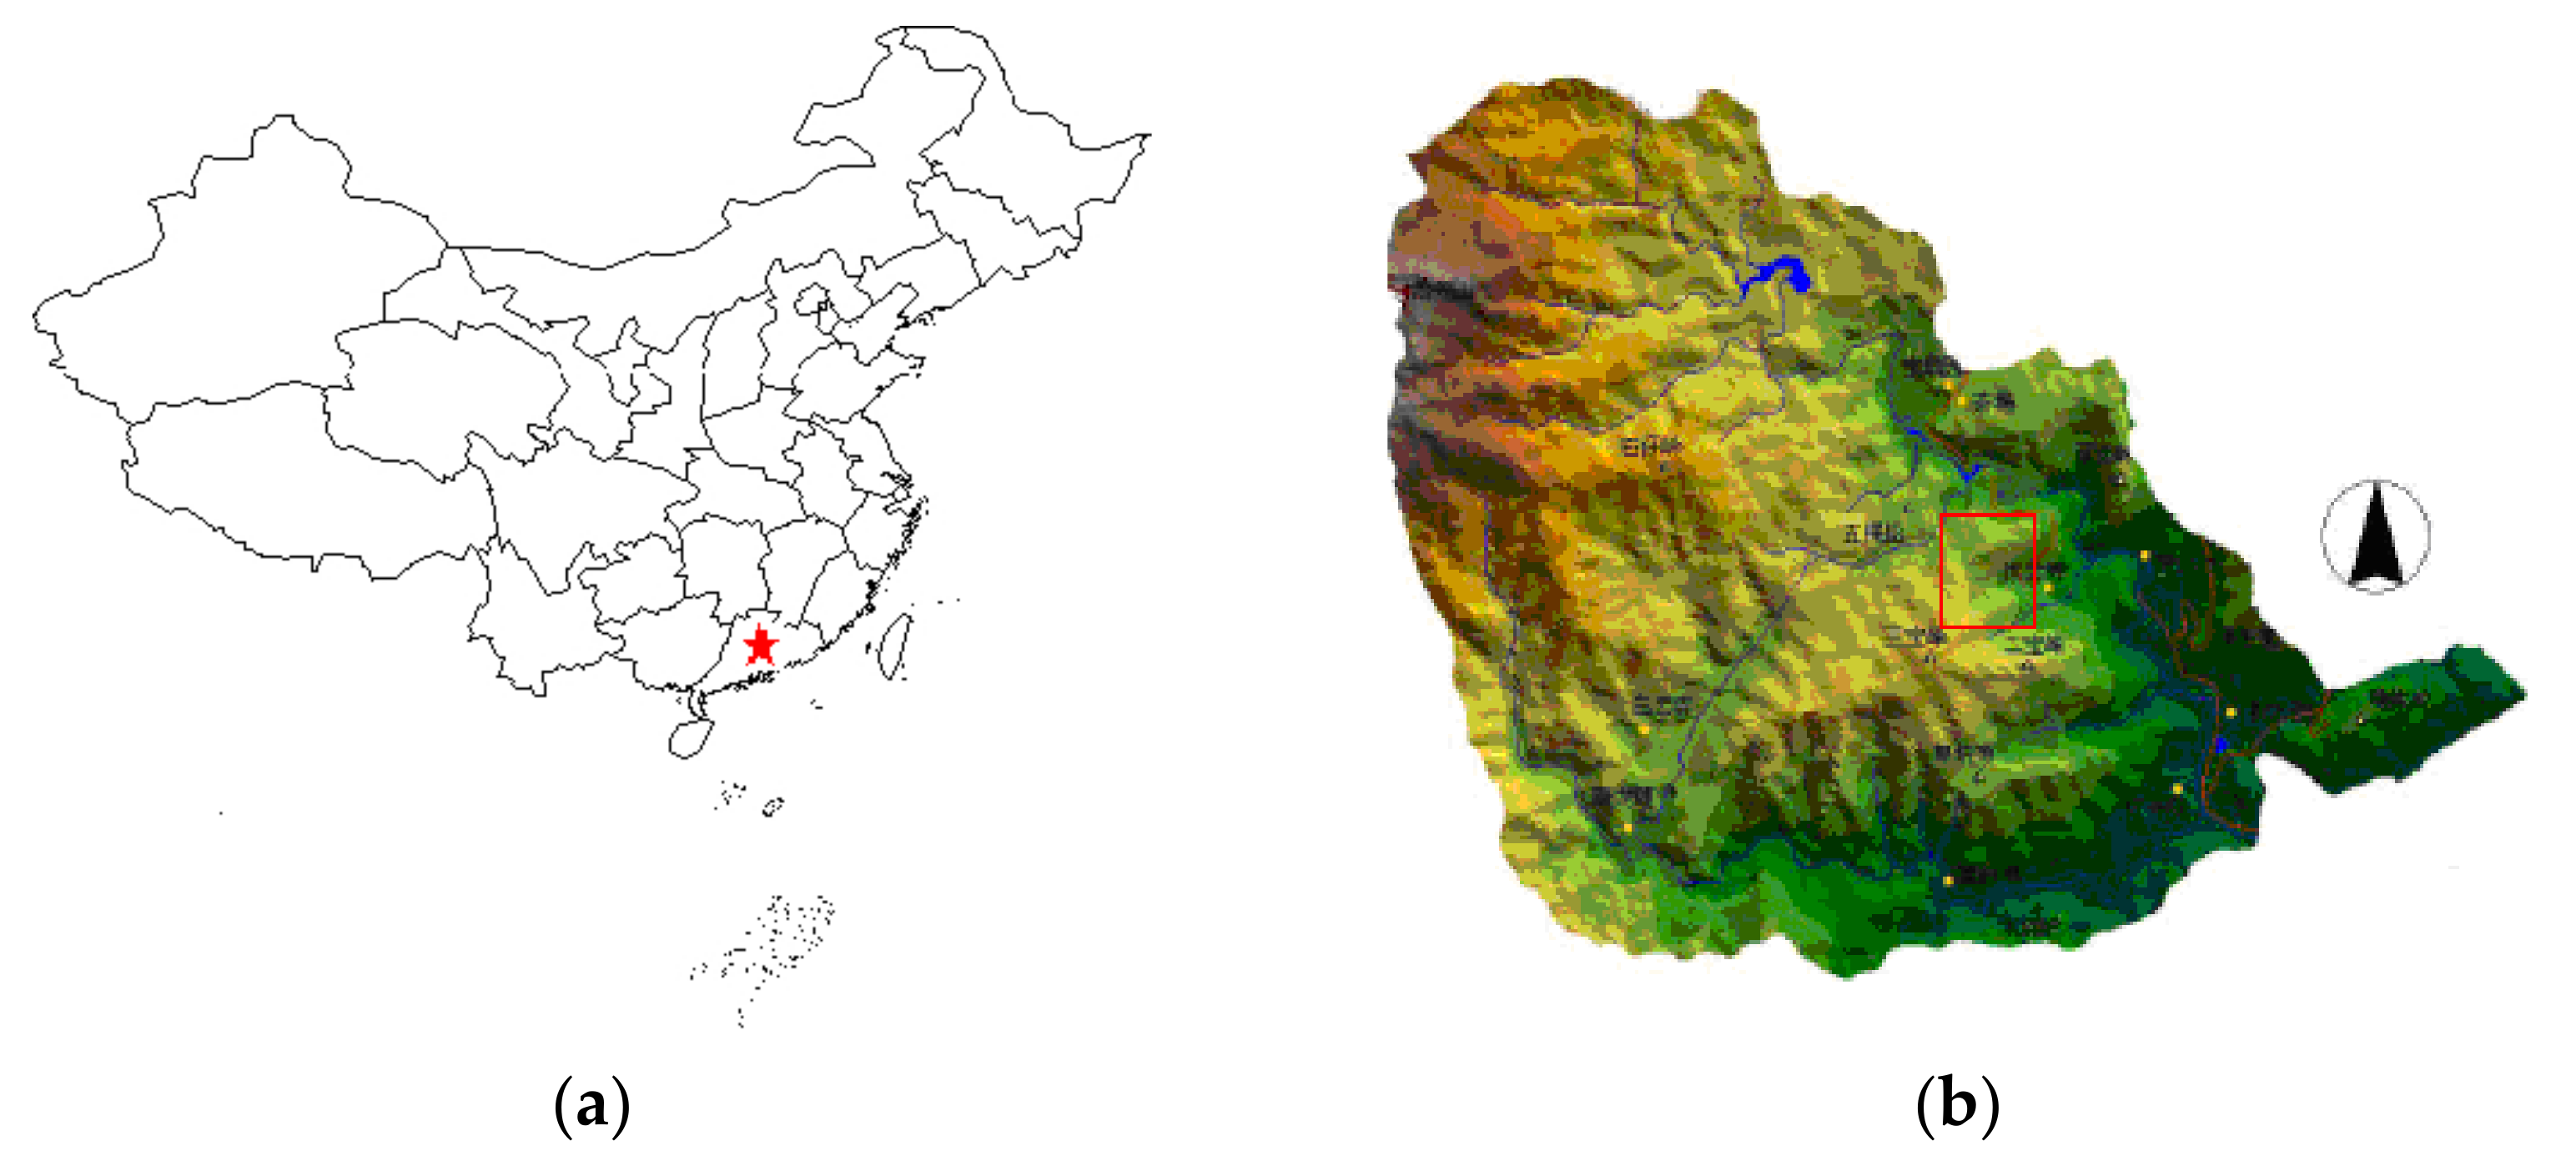
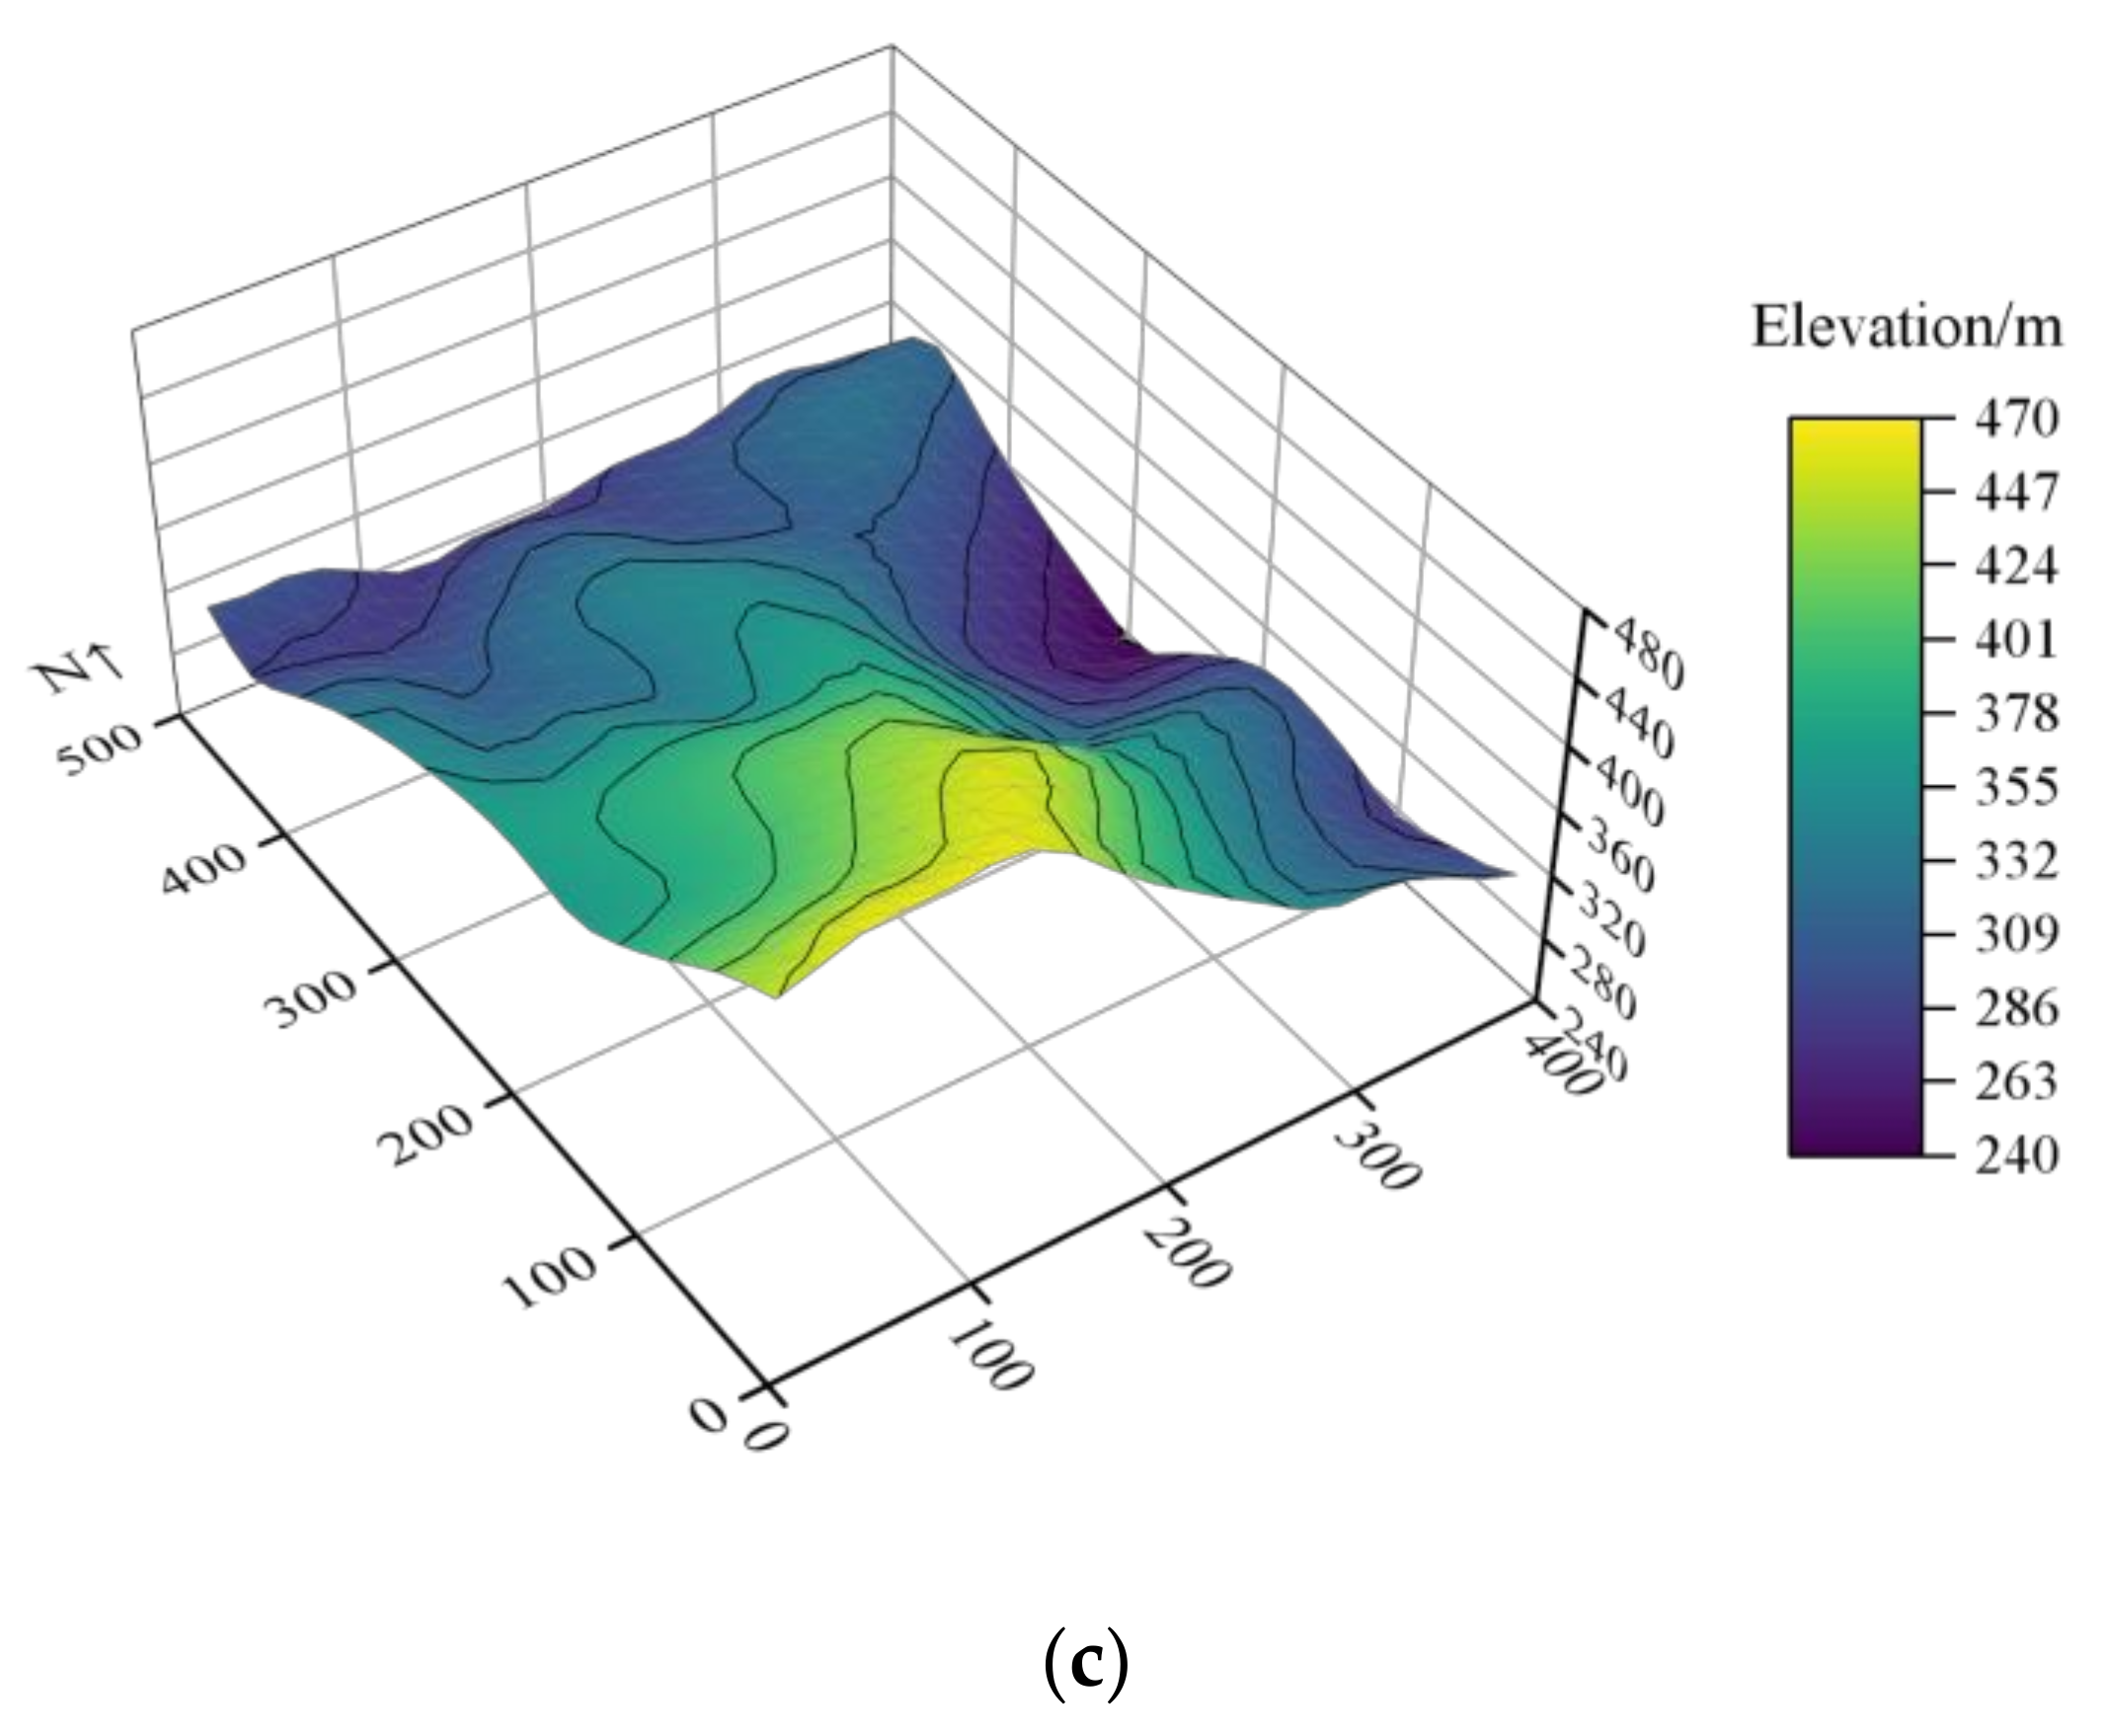
2.1. Study Area and Data

The data used in this study were collected in the Dinghu Mountain Nature Reserve (112°30′39″–112°33′41″ E, 23°09′21″–23°11′30″ N) in Guangdong Province in southern China. The Dinghu Mountain Nature Reserve has a south subtropical monsoon climate with a mean annual temperature of 20.9 °C. Annual mean precipitation is 1929 mm, with most of the precipitation occurring between April and September. Annual evaporation is 1115 mm and relative humidity averages 82%. Here, the zonal forest is a low-subtropical evergreen broad-leaved forest in its natural state because it has been protected by the local famous Qingyun Temple for 400 years [25]. A permanent 20 ha (400 × 500 m) plot called the Dinghushan (DHS) Plot was established using standard methods following the standard field protocol of the forest dynamic plots of the Center of Tropical Forest Science (CTFS) with each 20 × 20 m as the basic unit [26], and was re-censused every five years, where all stems ≥1 cm DBH (diameter at breast height) were surveyed, mapped and tagged. The plot was characterized as having rough terrain with a steep hillside in the southeast corner (Figure 1). Topography varied between ridges and valleys with elevation ranging from 240–470 m [27].

2.2. Functional Traits

We focused on 100 woody species (Table S1) that accounted for 96.3% of the total number of individuals in the DHS plot. For each species, three to five individuals with diameter at breast height (DBH) comparable to the mean DBH value of that species (the data was obtained through census data in 2015) were sampled for thirteen representative traits (Table 1). 20 fully expanded sun-exposed leaves of three to five individuals per species were selected.
All functional traits were determined in 2015 as described in previous studies [16]. Specific leaf area (SLA, cm2 g−1), Leaf-specific conductivity (Kl, kg m−1 s−1 MPa−1), Sapwood-specific conductivity (Ks, kg m−1 s−1 MPa−1), Petiole density (Pd, g cm−2), Stomatal conductance per unit mass (Gs, mmol g−1 s−1), Photosynthetic nitrogenuse efficiency (PNUE, μmol mol−1 s−1), Photosynthetic phosphorus use efficiency(PPUE, μmol mol−1 s−1), Petiole dry matter content (Pdm, mg kg−1), Leaf chlorophyll concentration (Chl, g m−2), Leaf area (LA, cm2) and Petiole length (Pl, cm) were measured by fresh leaves. Chl was evaluated as the average of three points on each leaf by a portable chlorophyll meter (SPAD 502, Plus Chlorophyll Meter, Konica Minolta, Ramsey, MI, USA) based on a significant positive relationship with total chlorophyll. LA, Pl, and Pd were determined using a scanner (CanoScan LiDE 700F) and analyzed with image processing software (Image J, version 1.43 u, National Institute of Mental Health, Bethesda, MD, USA).
Leaves were then dried at 80 °C for 72 h and weighed to determine leaf and petiole dry weight. Individual leaf size and petiole density were calculated from the leaf scans using Image J. Pdm was expressed as the ratio of petiole dry mass to petiole fresh mass. Over-dried leaves were then ground to a fine powder to measure phosphorus concentration per leaf unit mass (Pmass, g g1), nitrogen concentration per leaf unit mass (Nmass, g g1). Nmass was determined by Kjeldahl analysis, and Pmass was measured using atomic absorption spectrophotometry. Sapwood density (WD, g cm−3) were measured by dry branches (dried at 80 °C for 72 h). Blade shape, plant habit and seed dispersal mode were obtained from field and seed survey data to characterize the ecological adaptability of species.

2.3. Environmental Factors

The altitude of the four corners of each 20 × 20 m quadrat was measured using an electronic station, and the altitude of each quadrat was calculated as the average altitude of its four corners. The terrain convexity of each quadrat was calculated as the altitude of the focal quadrat minus the average altitude of the eight quadrats around the focal quadrat. The convexity of each edge quadrat was calculated as the altitude of the center point minus the mean altitude of its four corners [28]. High convexity may indicate a hilltop, while low convexity may indicate bottomlands or a local hollow [29]. Here, aspect in the 20 × 20 m quadrats was obtained with ARCGIS 8.0 software. The range of aspect is from 0° to 360°, of which 0–45°, 45–135°, 135–225°, 225–315°and 315–360°, respectively, represent north (0–45°, 315–360°), east, south and west directions [27].
We measured soil properties in a 30 m grid of points in the DHS plot. Two additional sample points at 2, 5, or 15 m in a random compass direction from the grid were added, and a total of 710 samples were collected [29]. At each point, 500 g topsoil samples (0–10 cm) were collected and were analyzed for soil properties: total and available N, P, K (mg g−1), organic matter (mg g−1), water content (%), and pH (Table 2). Soil properties of each 20 × 20 m quadrat were calculated using ordinary Kriging methods. All soil properties were determined as described in previous studies [30].

2.4. Functional and Biodiversity Indices

2.4.1. Functional Diversity Indices

In order to avoid the representation error of a single index, in this study seven functional diversity indices from three categories were selected to represent the following: functional richness (average distance of functional traits (MFAD), functional volume (FRic), and posteriori functional group richness (FGR)), functional evenness (FEve) and functional divergence (functional divergence index (FDis), multidimensional functional divergence (FDiv), and Rao’s quadratic entropy index (RaoQ)), respectively. The indices were calculated using all traits in Table 1.
(1)
Average distance of functional traits (MFAD): MFAD is average of the Euclidean distances between species pairs in the trait space [31]. In order to avoid the known correlation between distance of functional traits and species richness, we used the average distance of functional traits (MFAD) to characterize the multidimensional functional richness [31]:
M F A D = i , j Δ d i j N
where dij is the functional feature distance between species, and N is the number of species.
(2)
Functional volume (FRic): FRic was defined as the volume of trait space occupied by species in the community [31].The functional volume was calculated using the minimum convex polygon in character space such that all of the points of the respective species are within its range or on its edges [31].
(3)
Posteriori functional group richness (FGR): FGRi was the number of functional groups contained in sample i [7]. FGRi was calculated by the R package “FD” [32].
(4)
Functional evenness index (FEve): FEve describes the evenness of abundance distribution in a functional trait space [31]. FEve was calculated by taking the distance between all species pairs and generating a minimum spanning tree weighted by relative abundance, which connected all species in multi-dimensional character space. This index measures both the uniformity of the minimum spanning branch length and the uniformity of species abundance. The calculation formula is below [31]:
E W 1 = d i s t i , j W i + W j
P E W 1 = E W 1 i = 1 S 1 E W 1
F E v e = i = 1 S 1 min P E W 1 , 1 S 1 1 S 1 1 1 S 1
where EW1 is the weighted evenness, PEW1 is the partial weighted evenness. dist(i,j) is the Euclidean distance between species i and species j, and Wi is the relative abundance of species i, S is the number of species.
(5)
Multidimensional functional divergence (FDiv): FDiv relates to how abundance is distributed within the volume of functional trait space occupied by species, FDiv was calculated according to [31]:
F D i v = δ d + d G ¯ δ d + d G ¯
δ d = i = 1 S P i × d G i d G ¯
where the Euclidean distance d G i is obtained by calculating the square and square root of the distance between each species character value and the center of gravity of the convex polygon, d G ¯ is the mean value of the Euclidean distance of each species, δ d is the absolute value of the distance when calculating δ d , and P i is the relative abundance of species i.
(6)
Functional divergence index (FDis): FDis indicates the average weighted distance between each species and the center of gravity in multidimensional character space, where the center of gravity is the center of gravity of all species. It was calculated by this formula [32]:
F d i s = a j z j a j
where a j is the abundance of species j and z j is the distance between species j and the weighted center of gravity.
(7)
Rao’s quadratic entropy index (RaoQ): RaoQ is a multidimensional functional dispersion used to measure diversity and difference within and between populations [33]. Calculation of RaoQ involved first obtaining the matrix of species eigenvalues and, second, calculating the relative abundance of species in different plots [33]:
d i j = u i j n
R a o Q = i = 1 S 1 j = i + 1 S d i j p i p i
where, d i j is the distance between species i and j, p i is the abundance of species i, n is the total number of traits, and uij is the number of traits with different traits values of species i and j.

2.4.2. Species Diversity Indices

We selected three species diversity indices, the species richness index (S), Shannon-Wiener index (H) and Pielou index (E). Species richness index S refers to the number of species in the community, and the Shannon-Wiener diversity index H is a comprehensive index of species richness, Pielou index is an index of evenness:
H = i = 1 s p i ln p i
E = i = 1 s p i ln p i / ln S
where, pi is the relative abundance of each species i, and S is the total number of species in the target sample plot.

2.5. Statistical Analyses

The 100 species were binned into three plant habits based on height (Table S1): trees (height > 10 m), small arbors (height 3–10 m), and shrubs (height less than 3 m). We used all traits to calculate the seven functional diversity indices above, community survey data were used to calculate species diversity indices, and Tukey multiple comparison tests were used to assess group differences. Pearson correlation analyses between functional diversity indices were carried out to test whether there were correlations between functional indices across all 500 20 × 20 quadrats.
We assessed the relationship between functional diversity, species diversity (S and H), and elevation. The functional diversity indices in all 20 × 20 quadrats were used for regression analyses of richness indices S and H, and the determination coefficient, linear equation, and regression significance p-values were calculated. The elevations of 500 southwest corner points in the DHS large sample plot were also used in linear regression analyses with the seven functional diversity indices.
We also assessed the relationship between environmental factors and functional diversity indices to find out which environmental factors are the key factors affecting functional diversity. The environmental factors used for Redundancy analysis (RDA) were detailed in Table 2.
The R v3.6 software (R Core Team, www.R-project.org, accessed on 29 February 2020) and R package “FD” [32] was used for all above calculations and statistical tests.

3. Results

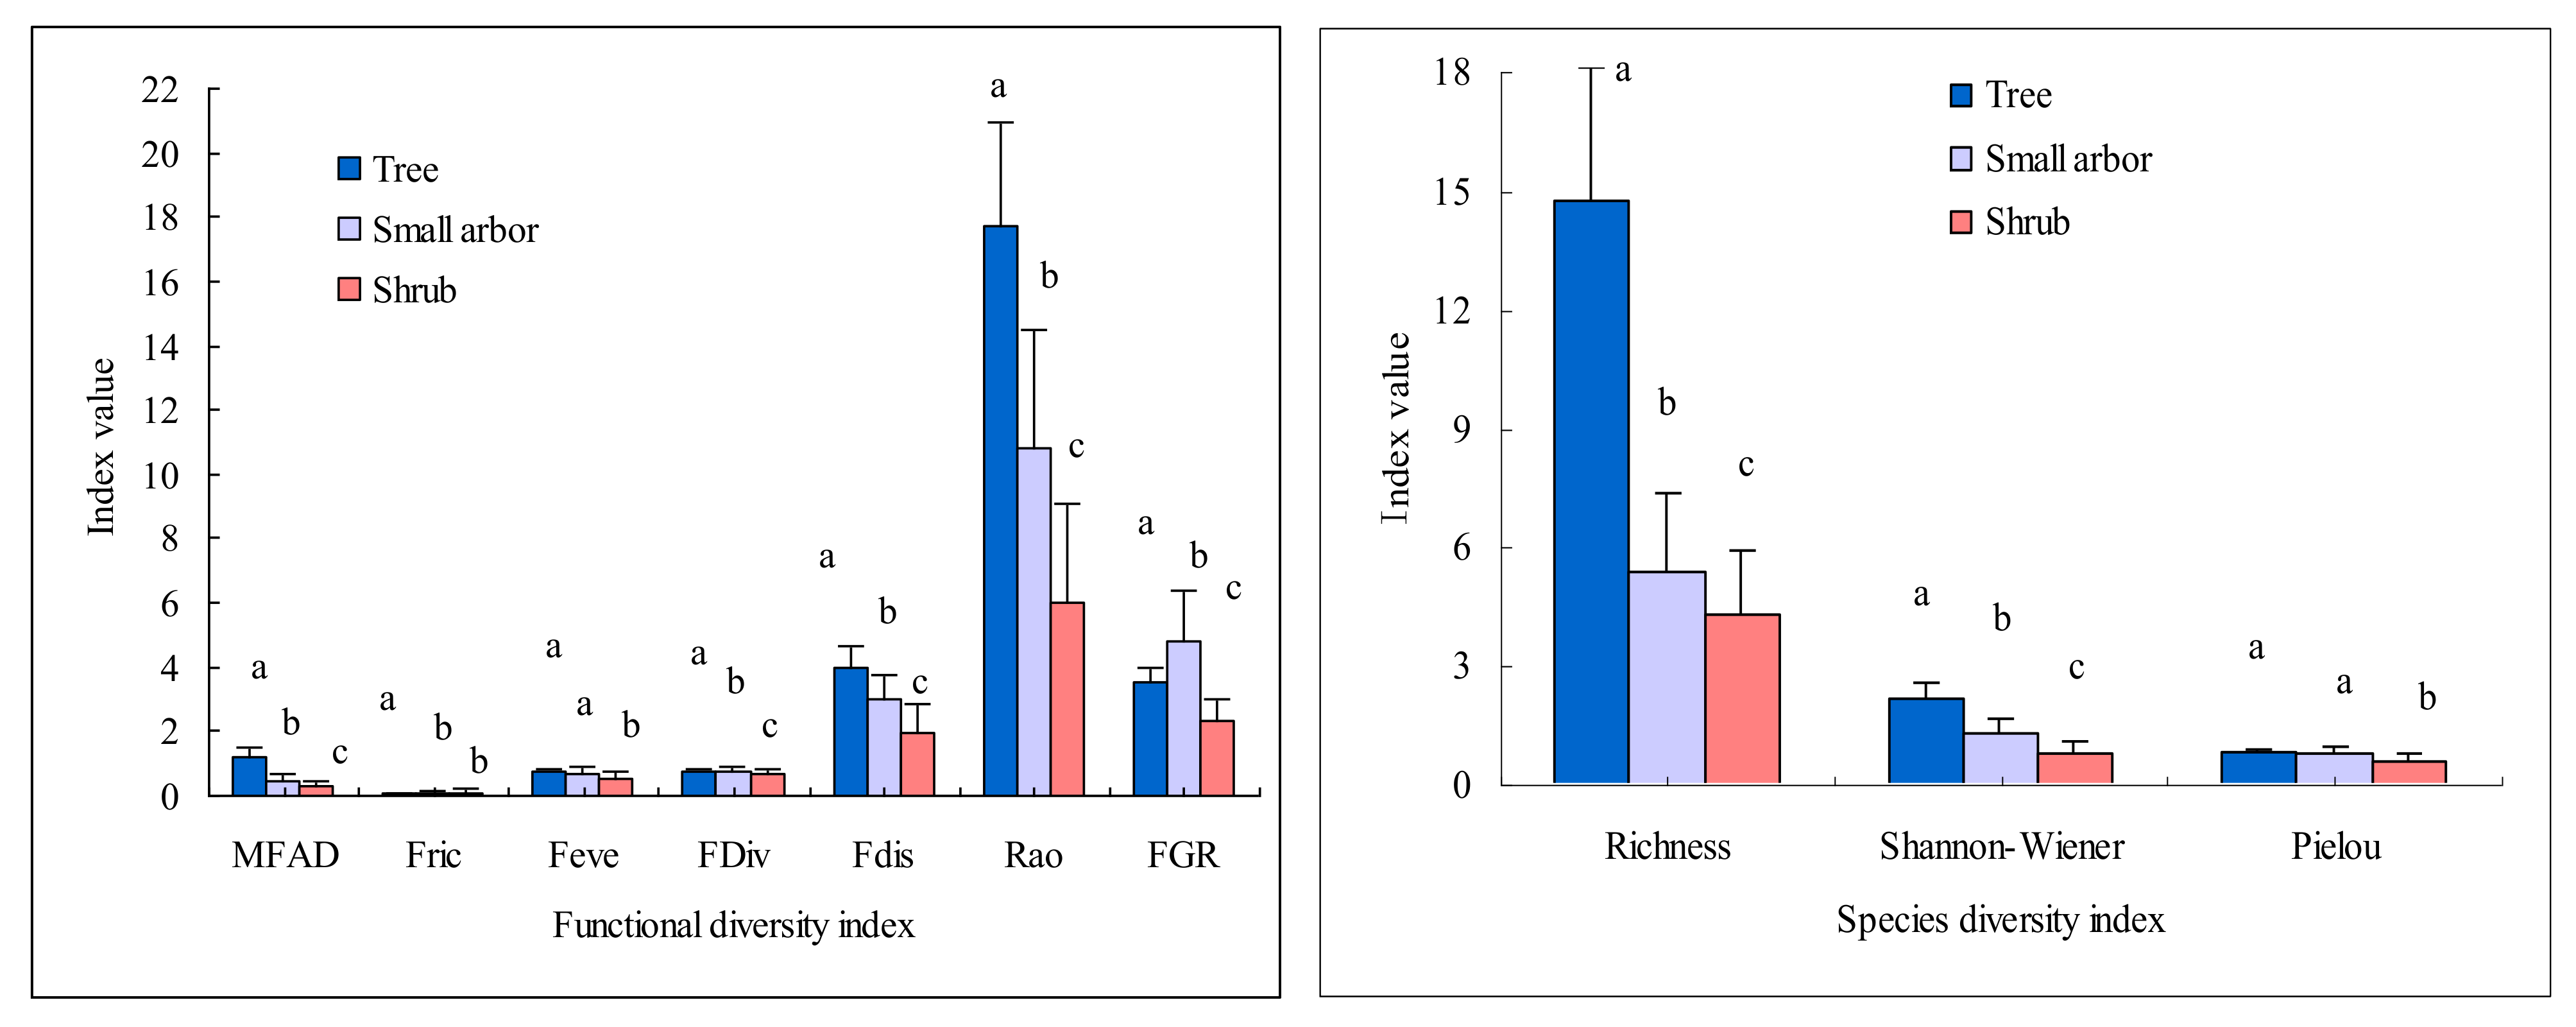
3.1. Functional Diversity and Species Diversity of Different Plant Habits

The 100 species were binned into 54 trees, 27 small arbors, and 19 shrubs, and most functional diversity indices were significantly different between habits (Figure 2). The results from the Tukey multiple comparison test showed that the functional richness indices MFAD and FGR were significantly different among the three habits, however FRic was no significant difference between small arbors and shrubs. The functional evenness index (FEve) showed no significant difference between trees and small arbors, but there was a significant difference between trees and shrubs, and also between small arbors and shrubs. The functional divergence indices FDis and RaoQ were significantly different among the three habits.
Species richness (S) and Shannon-Wiener species diversity index (H) were significantly different between habits, however the species evenness Pielou index (E) showed no significant difference between trees and small arbors, but there was a significant difference between trees and shrubs, and also between small arbors and shrubs.

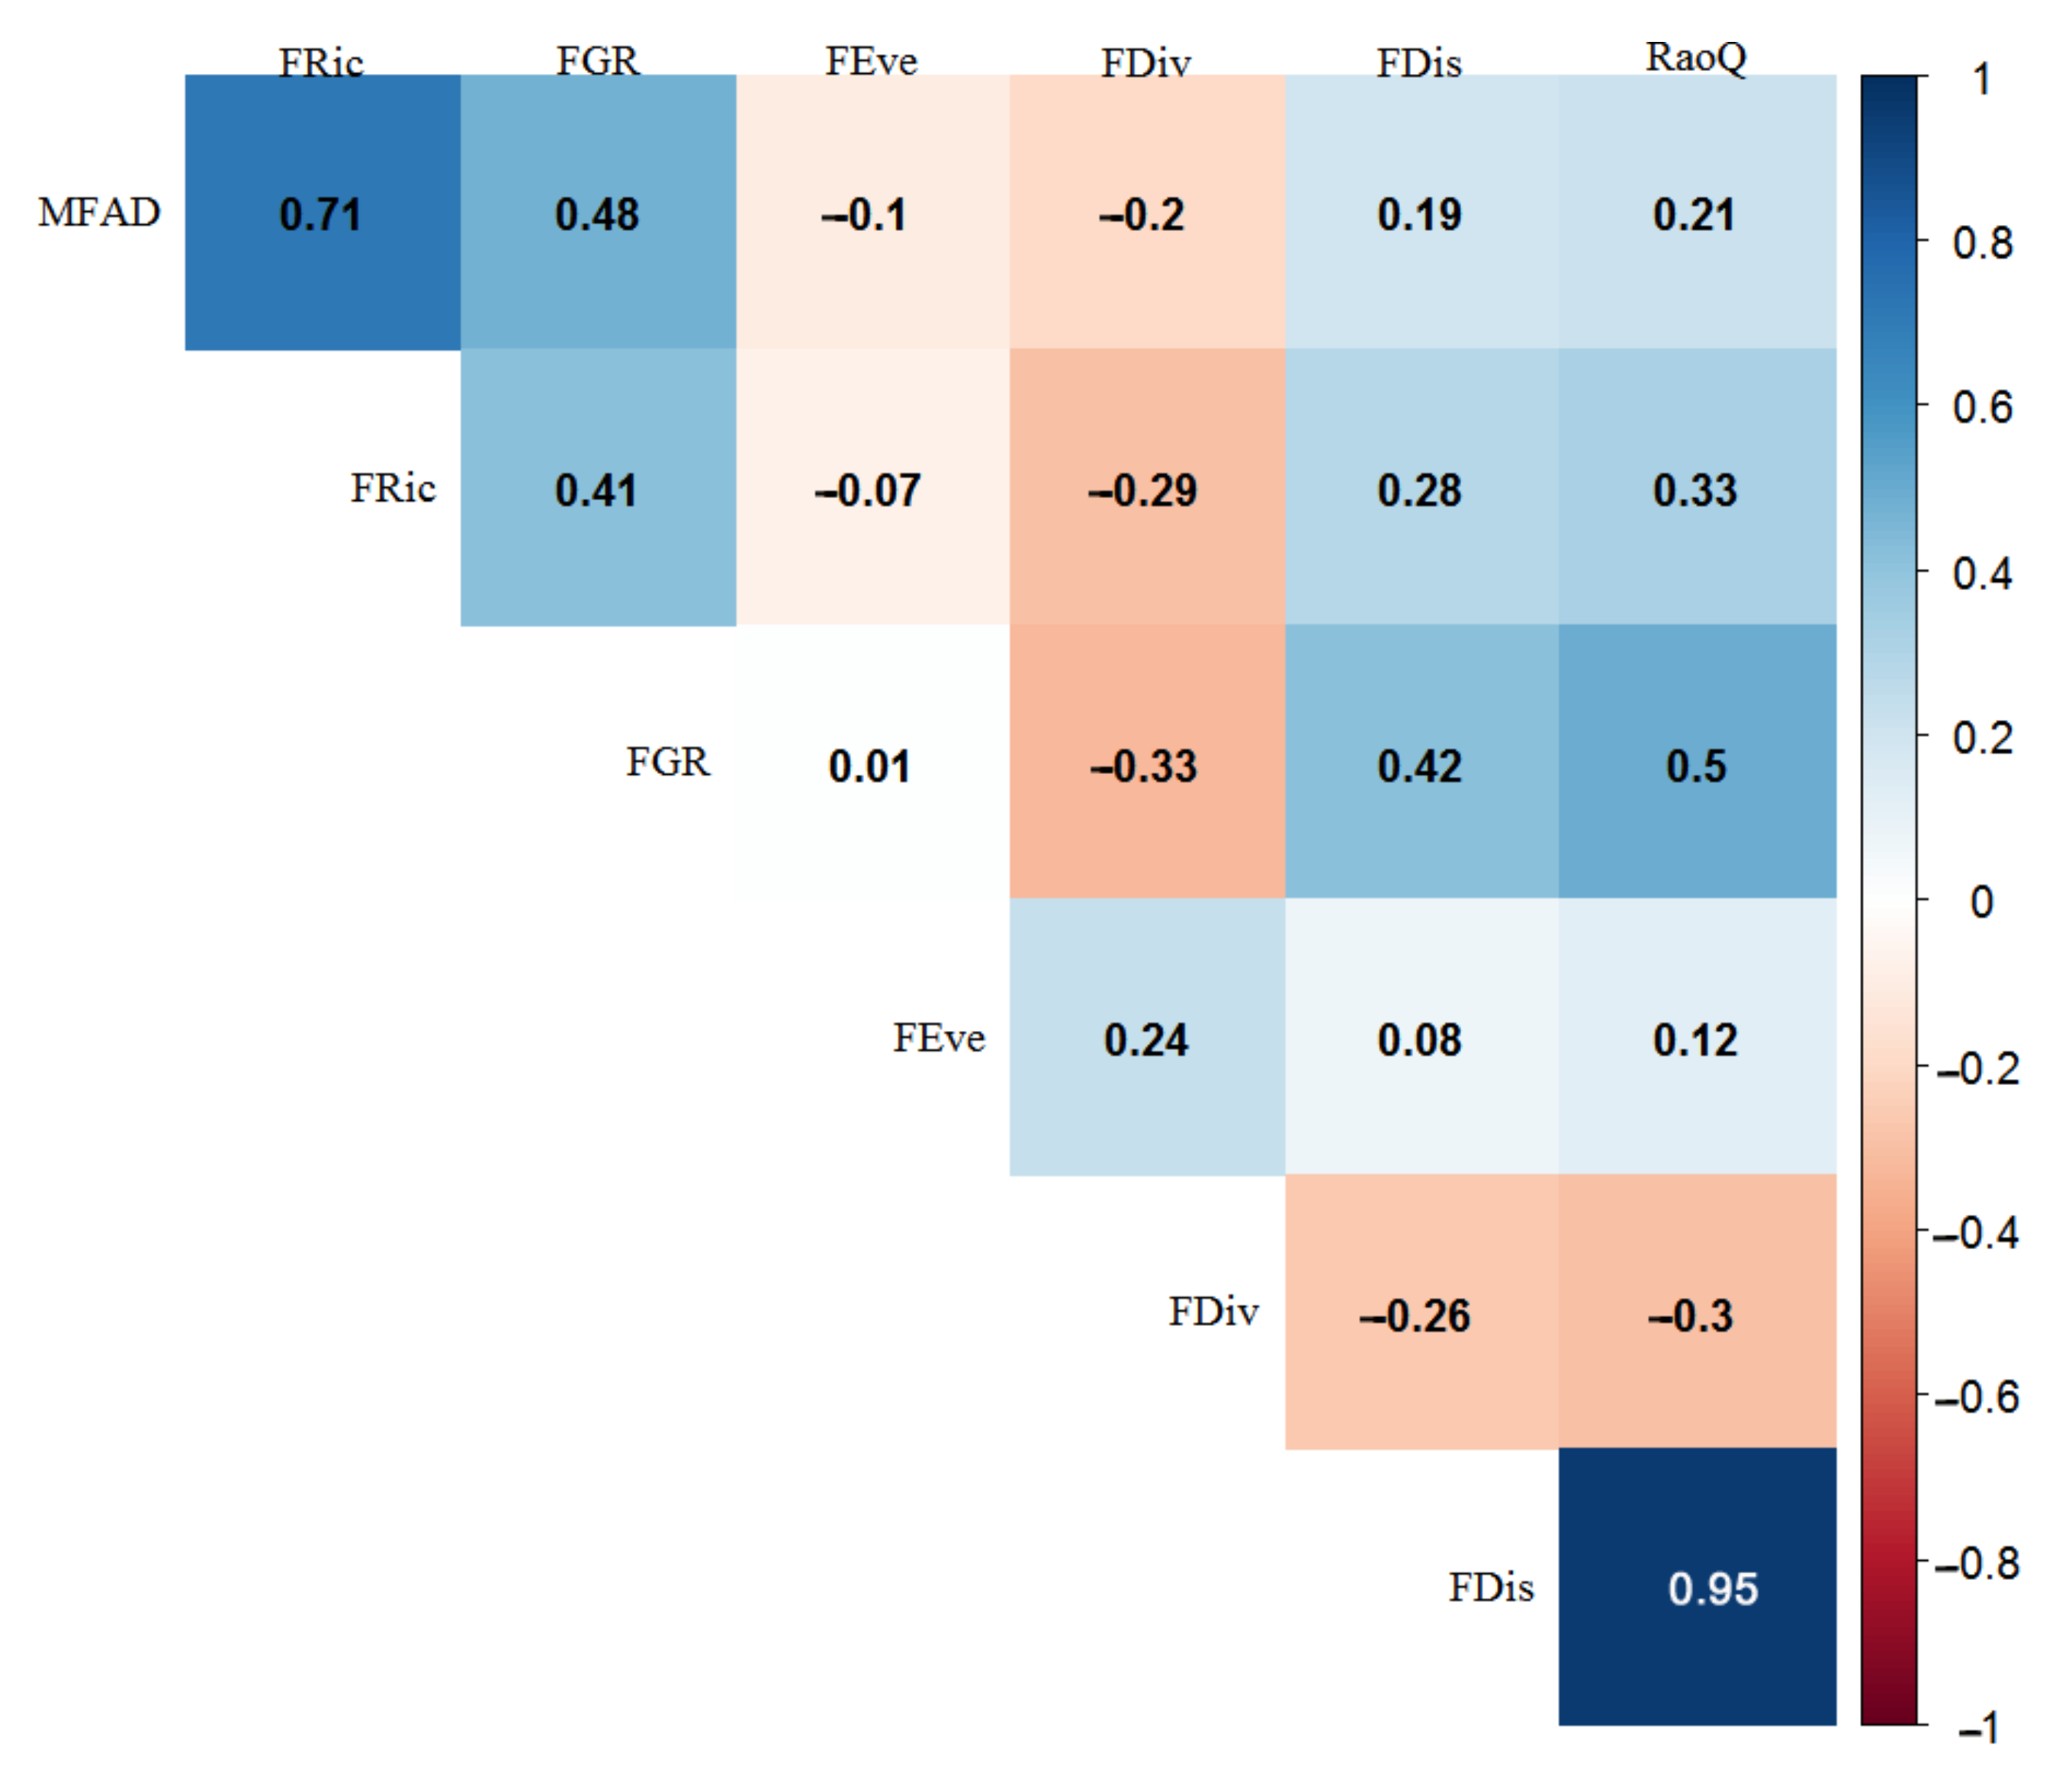
3.2. Correlation Analysis between Functional Indices

Pearson correlation analyses between functional diversity indices showed there were significant correlations among functional diversity indices, and most of the significant correlations were positive in the Dinghushan evergreen broad-leaved forest (Figure 3), with the exception of no significant correlation between FEve and FRic, FDis and FGR. There was a significant positive correlation between the indices (MFAD, FRic and FGR) representing functional richness. However, indices representing functional divergence were significantly negatively correlated (FDiv and RaoQ) or uncorrelated (RaoQ and FDis). The multidimensional functional evenness index (FEve) was negatively correlated with MFAD. The multidimensional functional divergence index (Fdiv) was significantly positively correlated with the multidimensional functional evenness index (FEve), but negatively correlated with other indices.

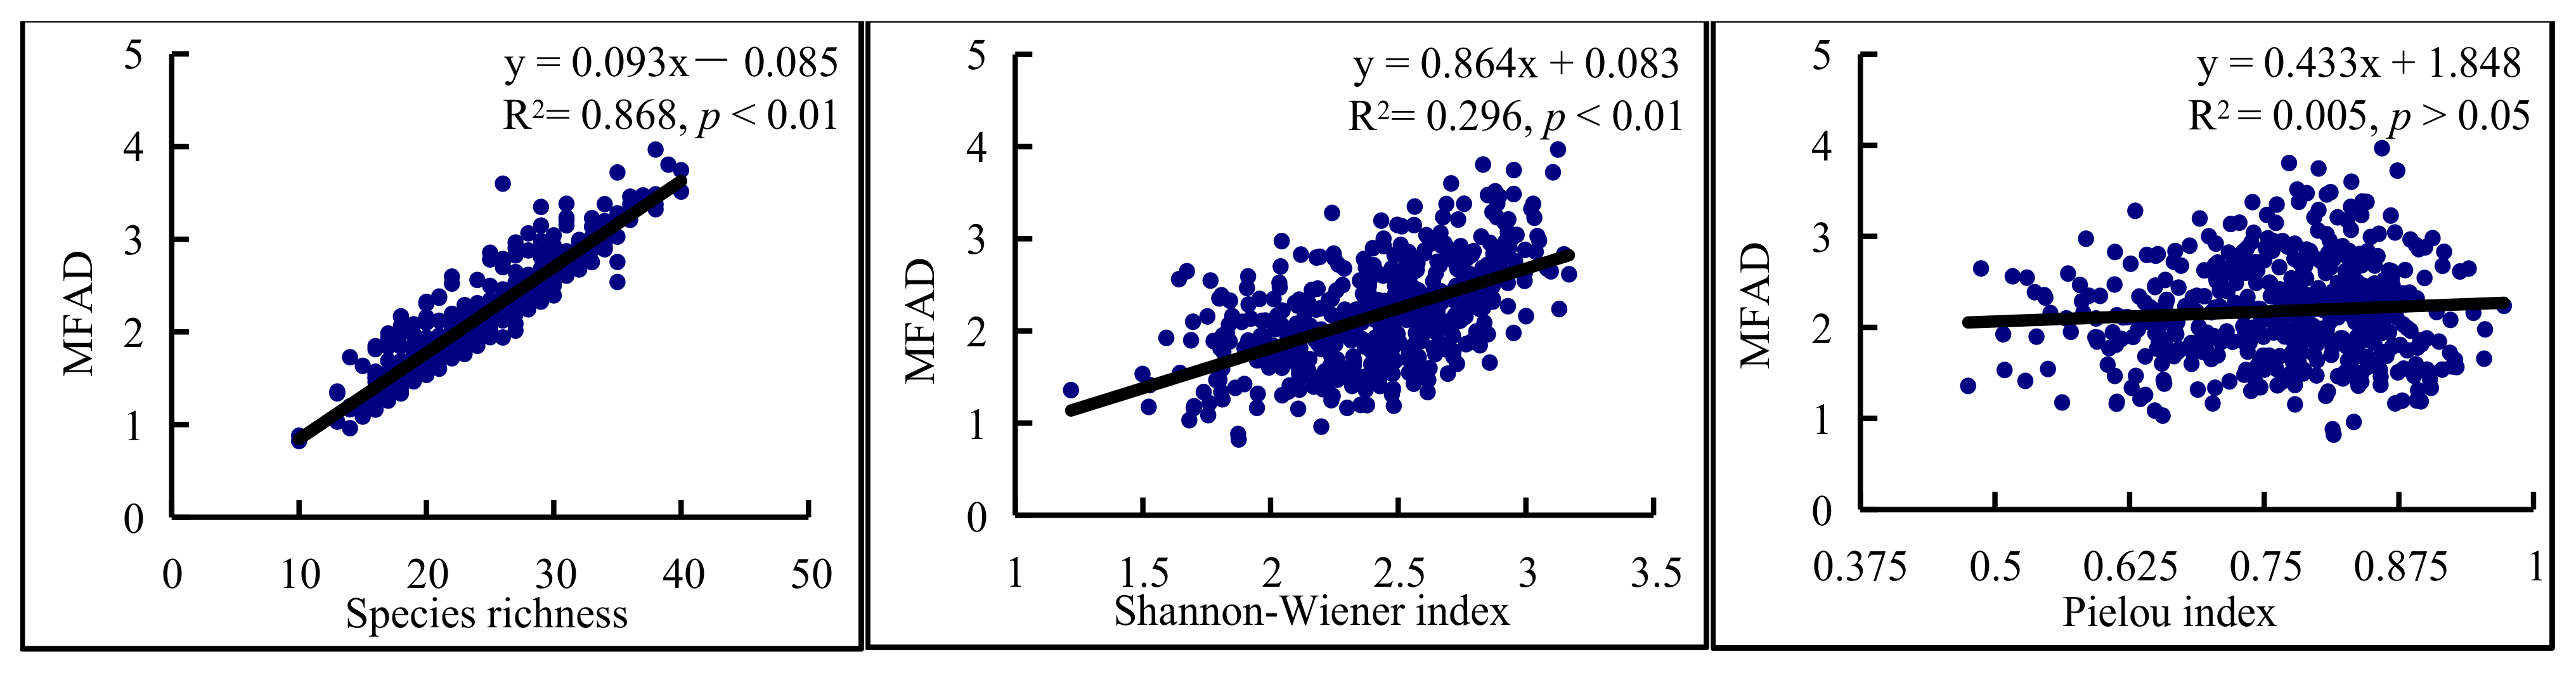
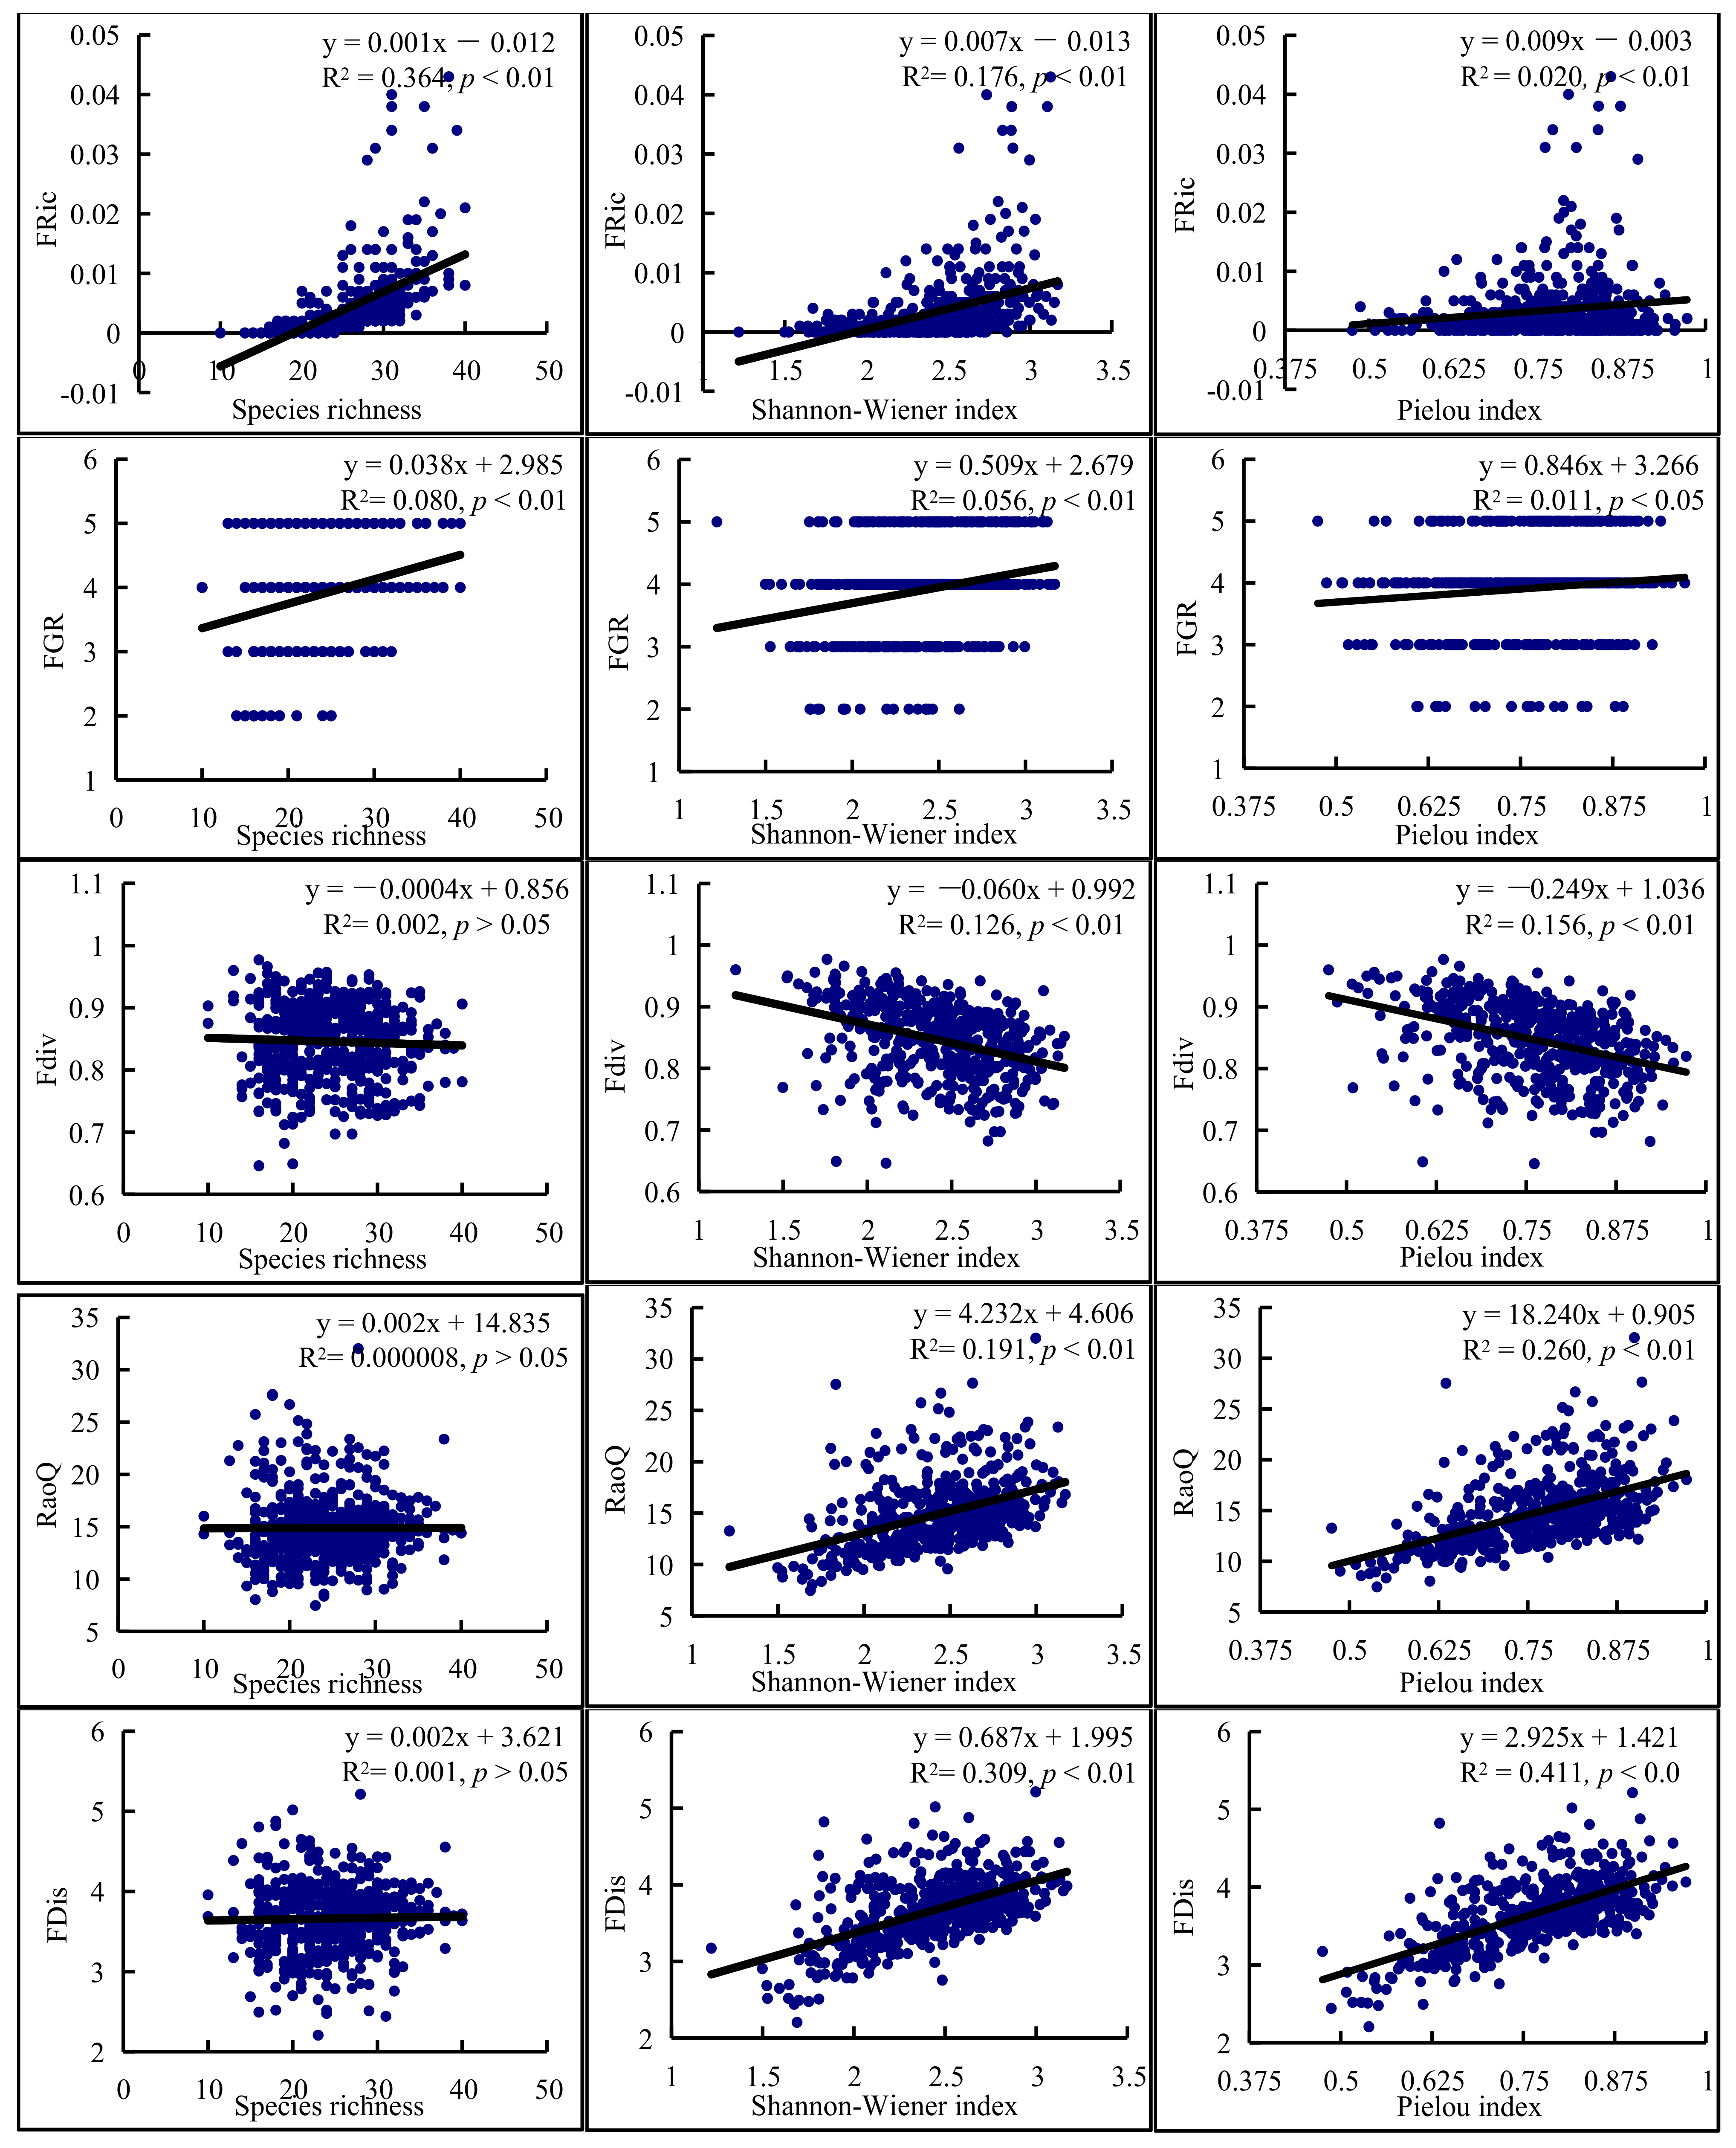
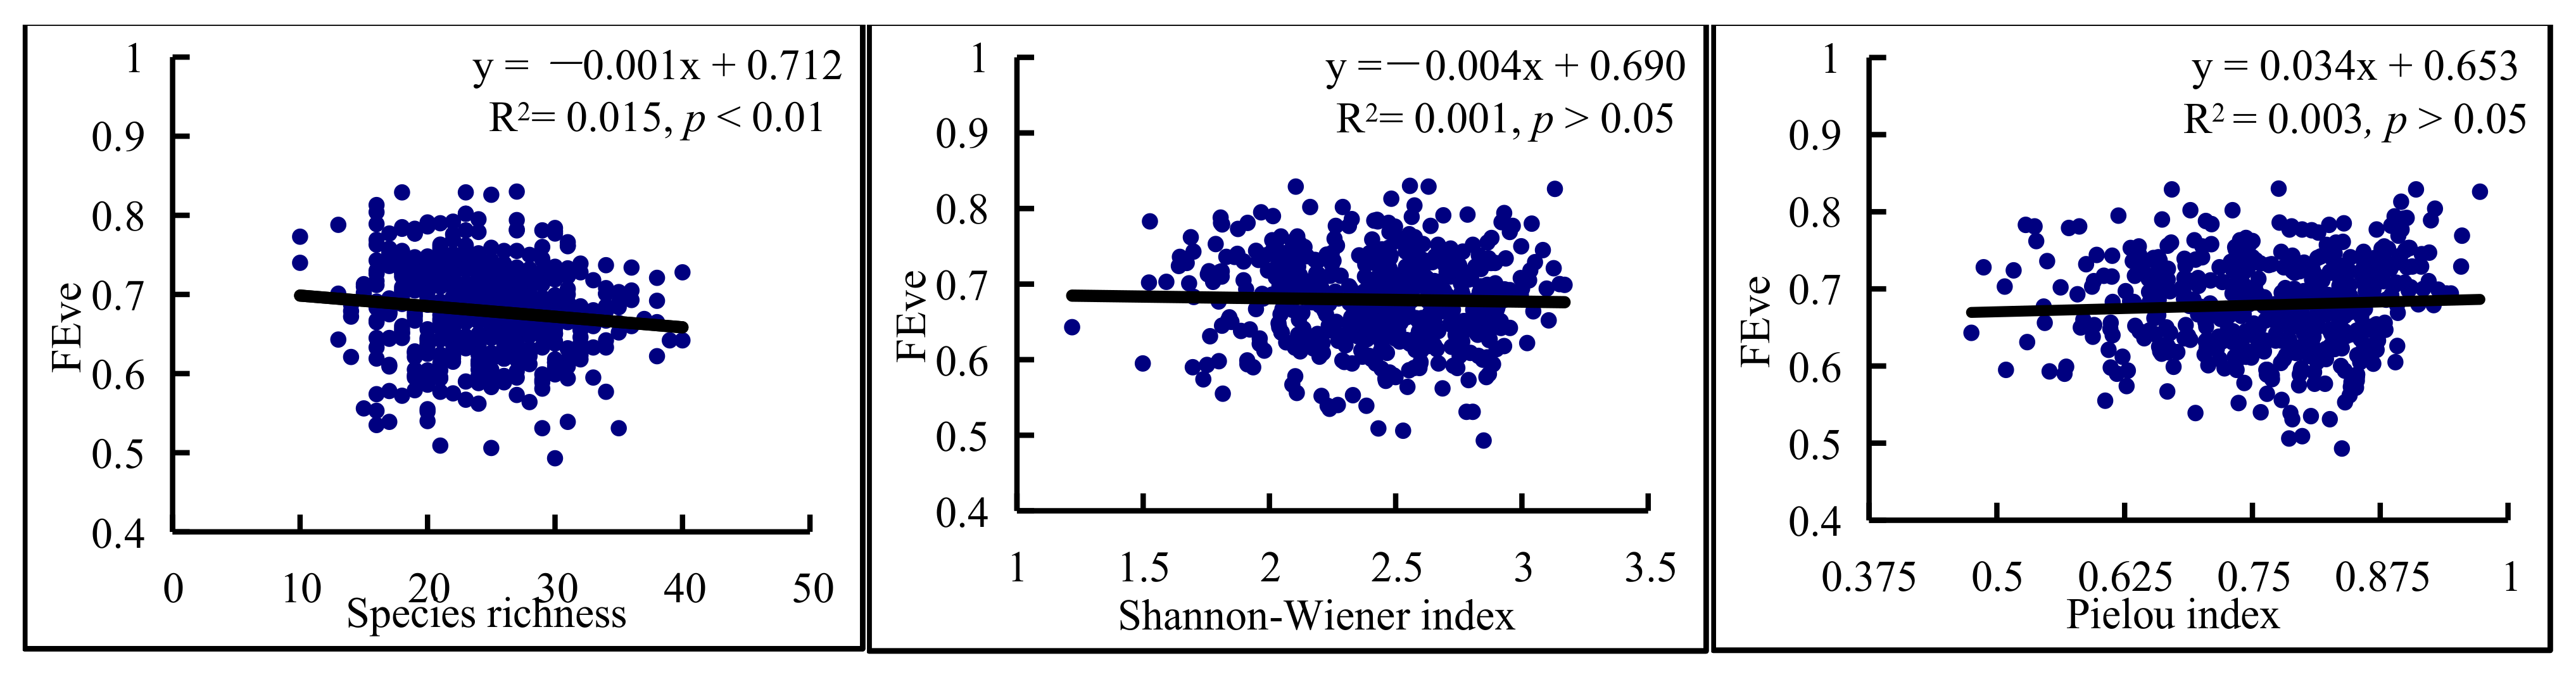
3.3. Relationships between Functional and Species Diversity

The correlations between three types (richness, evenness, and divergence) of functional diversity indices and three species diversity indices were different (Figure 4). Lineage regression results generally showed that functional richness (MFAD, FRic and FGR) increased with species richness (S), species diversity (Shannon-Wiener index (H)) and species evenness (Pielou index (E)) (Figure 4). According to R2, the three functional richness indices had the highest positive correlation with species richness, especially the positive correlation fitting R2 between MFAD and species richness (S) reached 0.868. The three functional richness indices had little positive correlation with Shannon-Wiener index (H) and even less positive correlation with Pielou index (E), and even MFAD had no significant positive correlation with species richness (p > 0.05).
Correlation coefficients showed that the functional divergence index FDiv decreased with species richness (S), species diversity (Shannon-Wiener index (H)) and species evenness (Pielou index (E)), but R2 showed a small decrease (Figure 3). FDis and RaoQ increased with S, Shannon-Wiener index (H), and Pielou index (E), and R2 showed a greater trend of increasing with species evenness (Pielou index (E)) than species diversity (Shannon-Wiener index (H)), and greater than species richness (S). FDis and RaoQ even had no significant positive correlation with species richness (S). The functional evenness index (FEve) decreased with species richness (S), species diversity (Shannon-Wiener index (H)), and increased with species evenness (Pielou index (E)), but the change trend was small.

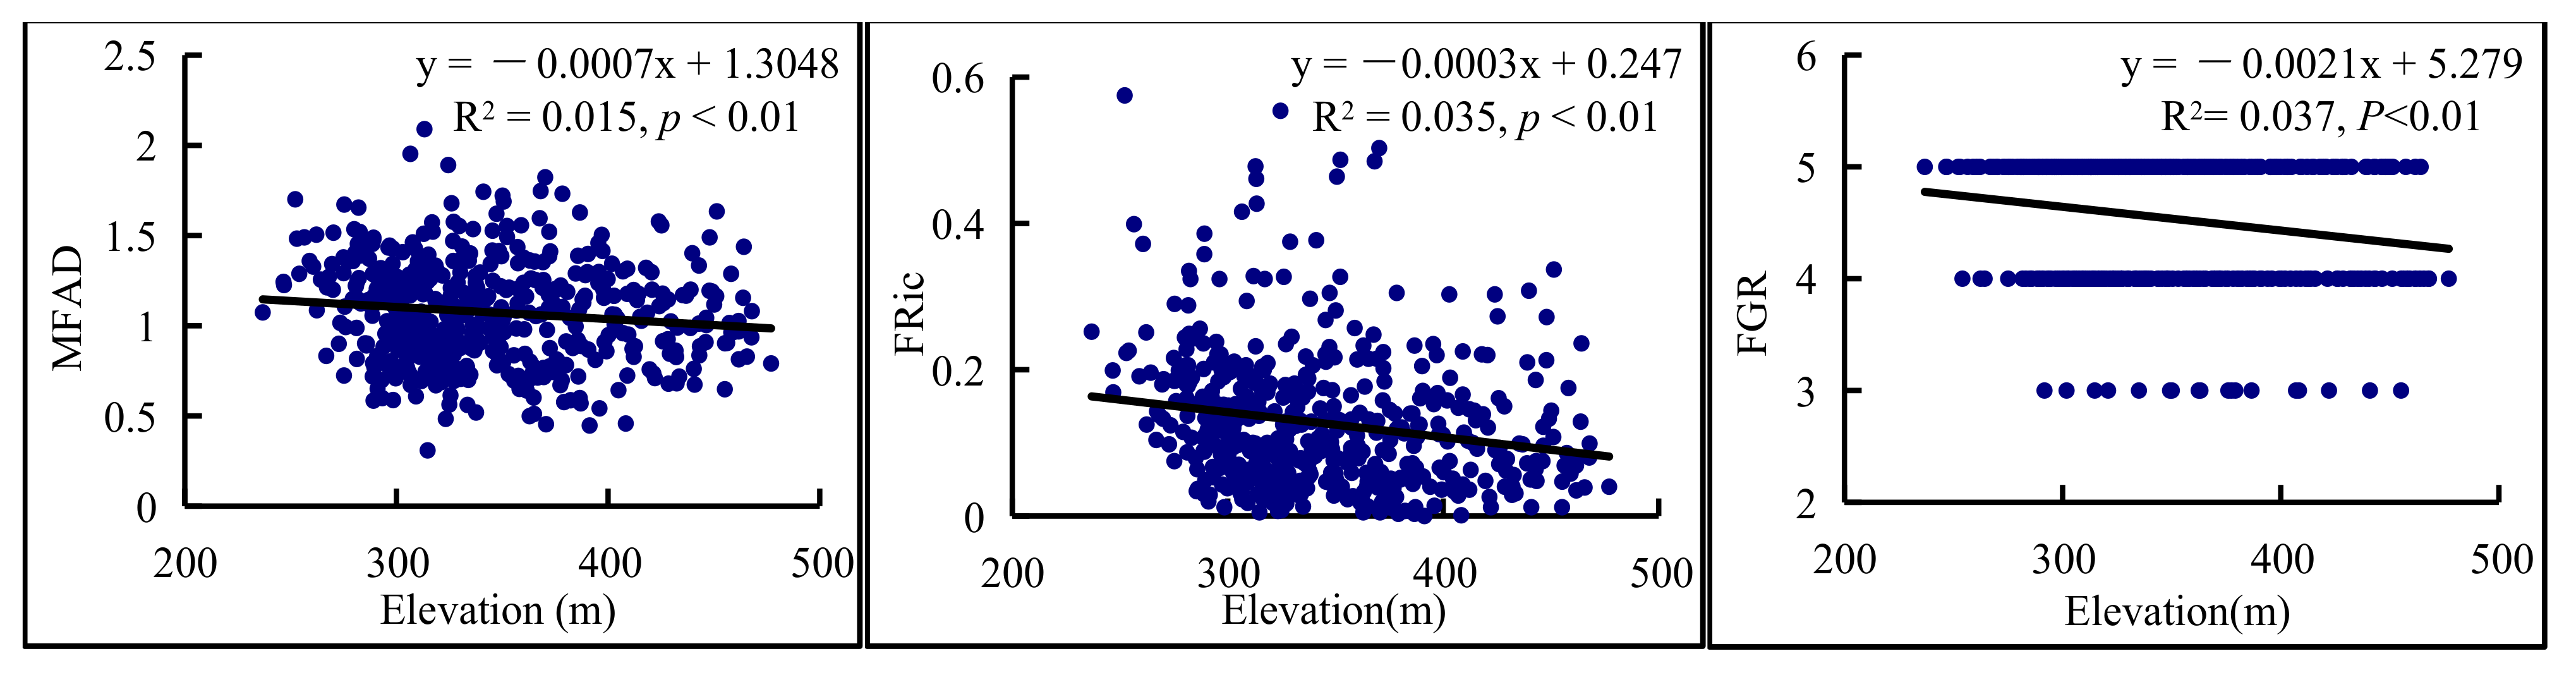
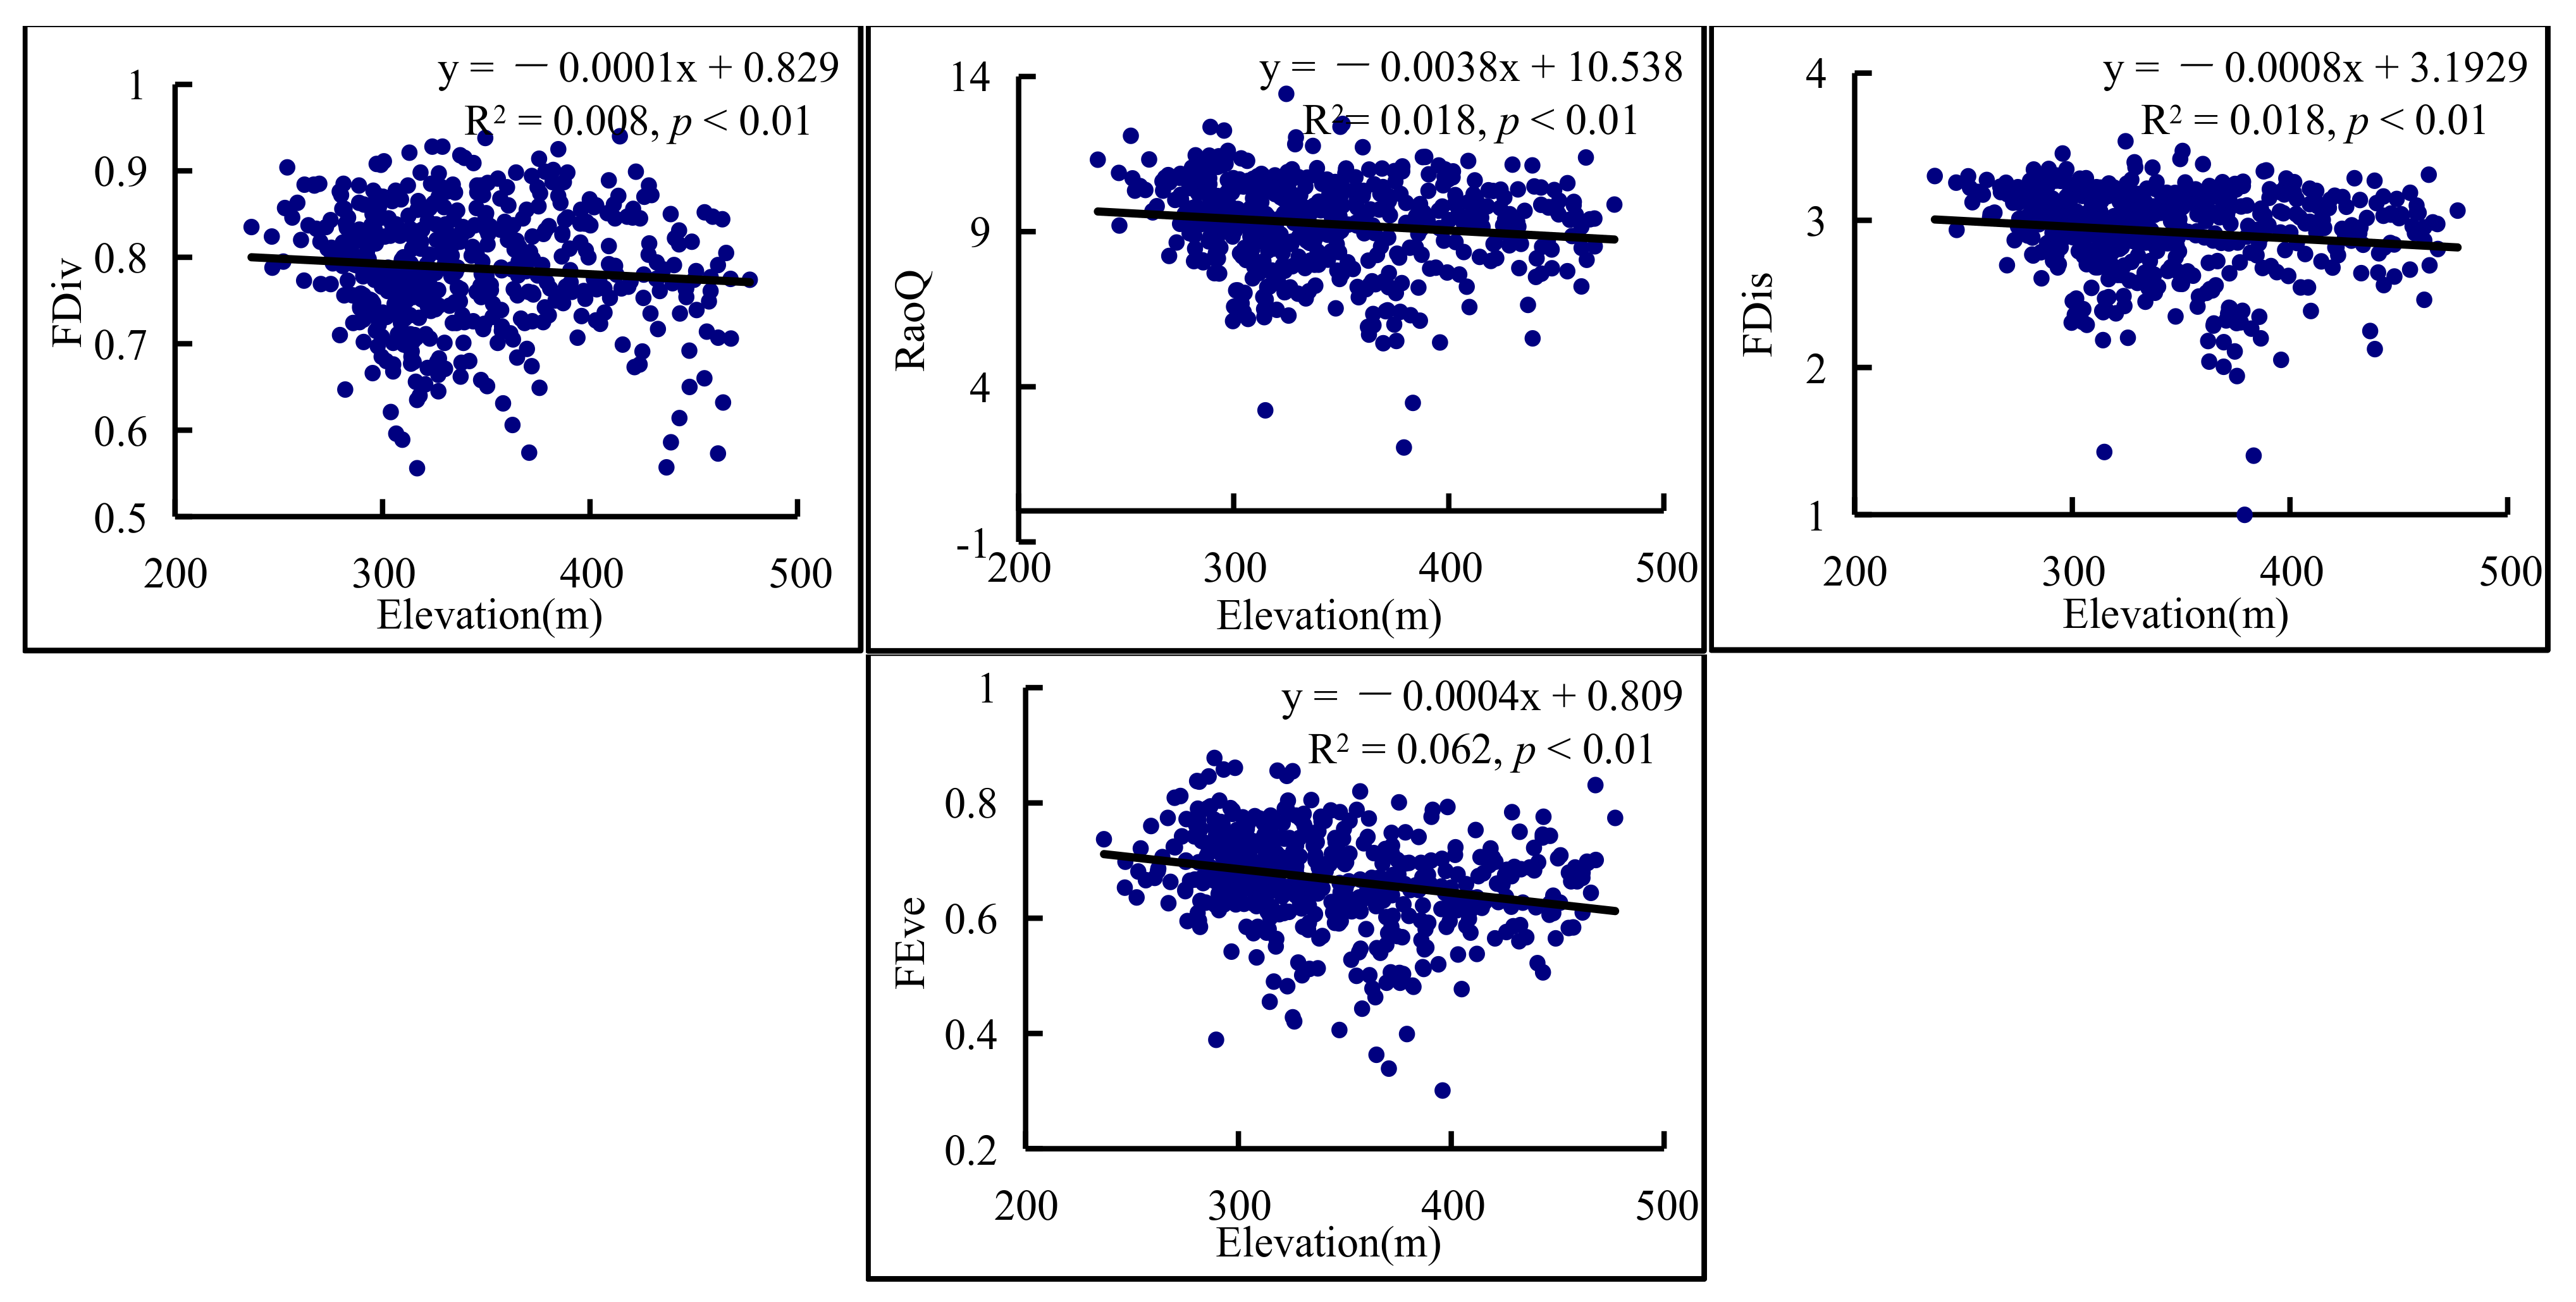
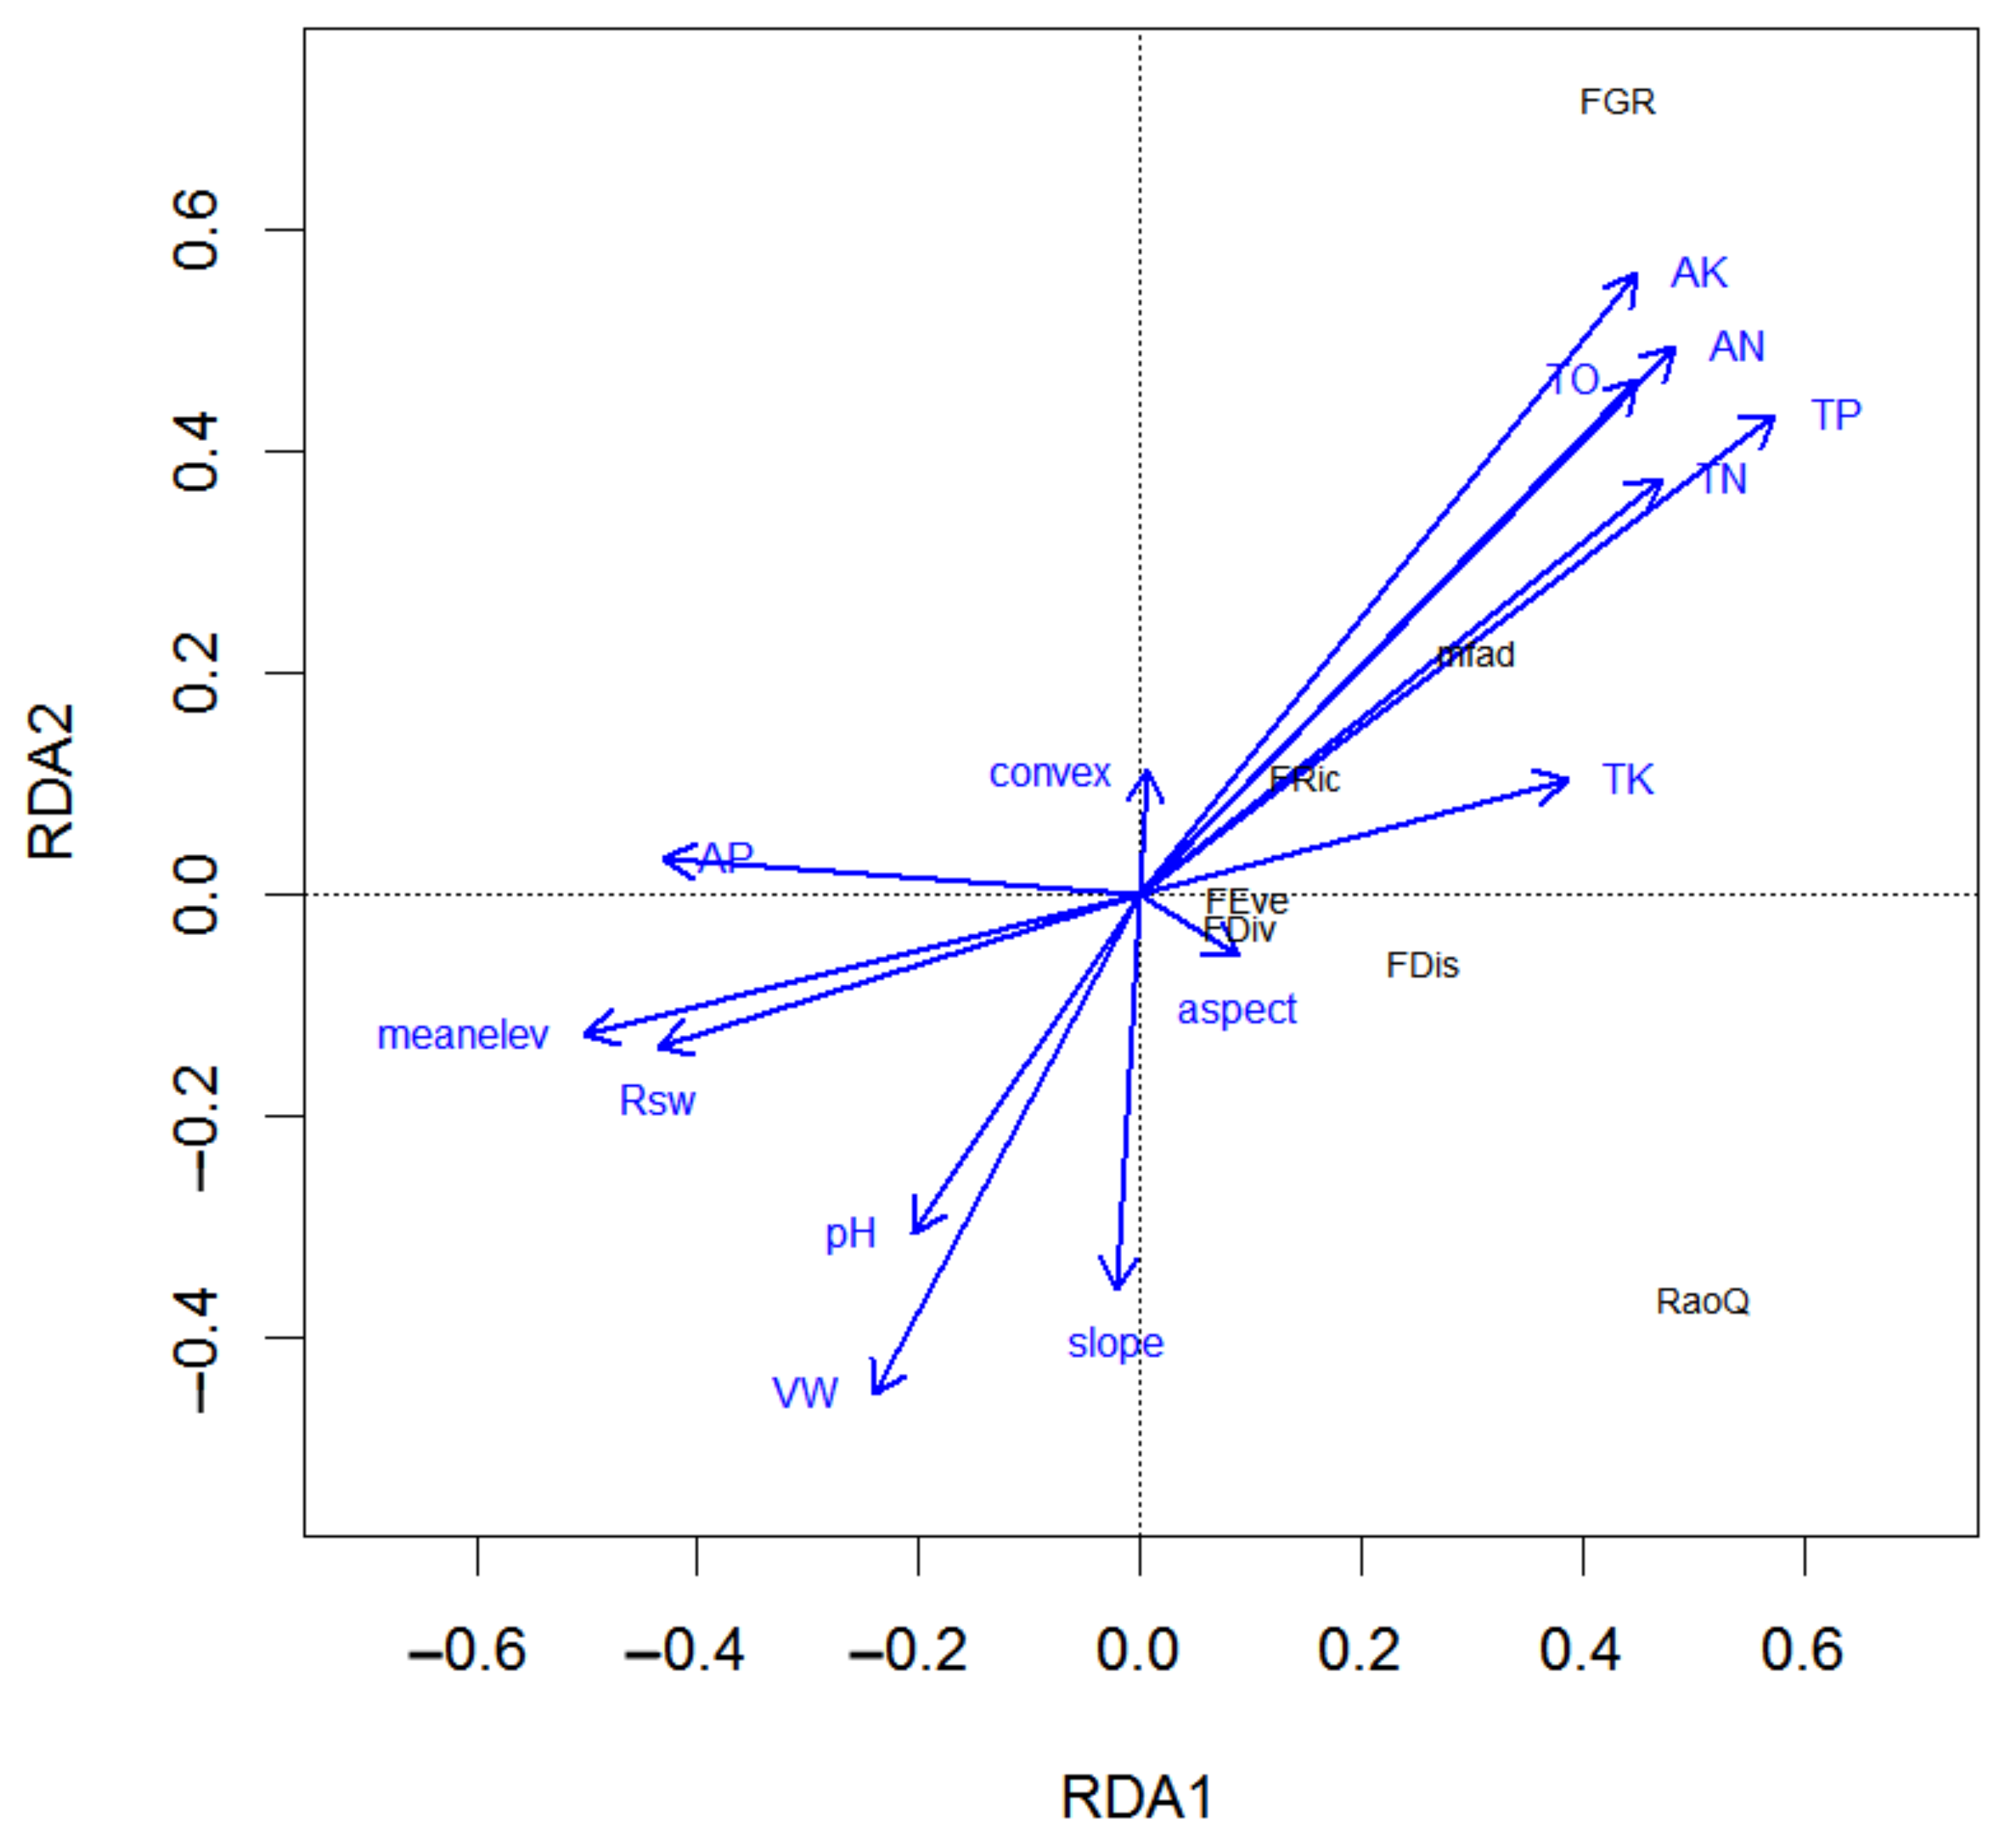
3.4. Environmental Factors Variation in Functional Diversity Indices

Fitting function diversity indices to elevation changes showed that all seven functional indices were negatively correlated with altitude, albeit with low explanatory power (Figure 5), so here altitude had weak influence on them. The exponential indices showed less steep declines in functional diversity compared to linear indices. By comparing the slope coefficients of the seven indices, it was found that RaoQ decreased faster with altitude than other indices.
RDA analysis on the relationship between environmental factors and functional diversity indices showed that the effect of environmental factors on functional diversity was different (Figure 6). TP was furthest from the origin and was the most critical environmental factor affecting functional diversity, followed by AN, then followed AK > TO > TN > VW > Mean elevation > AP > TK > Rsw > pH > slope > aspect, and the convex had the least effect on functional diversity.
Environmental factors had different effects on functional diversity. FRic, MFAD and FGR were positively correlated with TP, AN, AK, TO and TN. There were high negative correlations with AP, mean elevation, Rsw, pH and VW. The three functional divergence indices were greatly affected by slope, while the functional evenness index (FEve) was least affected by various environmental factors.

4. Discussions

4.1. Differences in Functional Diversity between Plant Habits

We observed differences in functional and species diversity among plant habits due to the trees, small arbors, and shrubs adopting different Distribution strategies to complement each other in the vertical space of the community. Plants’ traits reflect their evolutionary histories, which include adaptation to their environments. Some studies have suggested that functional traits such as those measured in this study respond more rapidly to abiotic factors (such as soil properties) on a small spatial scale [34]. A recent study of desert plants in Aibi Lake showed that trait values among difference plant habits tended to converge with decreased soil water and salt [35]. Most of the functional diversity indices were significantly different between different habits in our subtropical forest, which indicated that the functional diversity significantly varied from different spatial layers of the community. The difference in functional evenness indices (FEve) between small trees and shrubs was not significant, but the functional divergence indices FDis and RaoQ were significantly different among the three habits, which further indicated that the distribution of functional traits was uneven.

4.2. Relationships between Functional and Species Diversity

Species diversity and functional diversity are the important basis of ecosystem function, so the study of their relationship has received widespread attention [36]. In the habitat heterogeneous community with high species diversity, the probability of functional differences among species is also higher, and the functional diversity is higher. In the meantime, high functional diversity promotes species to improve resource utilization efficiency, enhance interspecific competition, and weaken niche overlap, all of which affect community species diversity [8]. Because the difference in functional diversity is largely caused by species differences, theoretically the three types of functional diversity (functional richness, functional evenness and functional divergence) of community should increase with the increase in species diversity. There are studies that support this theory with practice, for example communities with high species diversity are more likely to have high functional diversity [37]. The correlation between species diversity and functional diversity index of alpine grassland plants showed that species richness was highly correlated with functional richness, while species evenness index (Pielou index (E)) was highly correlated with functional evenness index (functional evenness index (FEve)) [38].
Since functional richness can measure the area or volume of trait space occupied by existing species in a community, it is always positively correlated with species richness [39]. When functional traits of species are randomly distributed in a community, the more species there are, the more trait space they occupy [37], so functional richness increases with the increase in species diversity [40]. Three different functional richness indices (MFAD, FRic, and FGR) in our subtropical evergreen broad-leaved forest were also observed to increase in the same direction with species diversity (Figure 2). Therefore, the relationship between functional diversity and species diversity in the Dinghushan evergreen broad-leaved forest community is consistent with the theoretical hypothesis mentioned above.
Chen et al. found in the study of alpine meadow ecosystems that species evenness was the main factor leading to the change in functional diversity and the positive correlation between species diversity and functional diversity [39]. In our subtropical forest, functional evenness measures whether the mean value of species traits is regularly distributed in the occupied trait space. High functional uniformity/evenness means that resources are fully and evenly utilized, and all resources are used and utilized to a similar degree. If the function uniformity is low, it indicates that resources are not fully used, and different resources are not used evenly. The relationship between functional evenness and species diversity has not been discussed uniformly due to the differences in community types and the coverage of functional traits concerned by various studies. For example, some studies have found a significant positive correlation between the diversity index and the functional evenness index, but some studies have found that the functional evenness index has no significant correlation with the species diversity index [40]. The functional evenness index (FEve) was observed to decrease with species richness (S), species diversity (Shannon-Wiener index (H)), and to increase with species evenness (Pielou index (E)), but the change trend was small in the south Subtropical forest community.
Functional divergence describes the degree of difference in cluster location in the functional and trait space of species [8]. These indices can be used as a measure of the degree of diversity and even competition of community resources [31]. This kind of index is used to calculate the distance between species through the relative abundance of species, aiming to measure the distance between species clusters in the trait space, so it is not affected by species richness. Therefore, three functional divergence indices (FDiv, FDis and RaoQ) were not significantly correlated with species richness (S) in the Dinghushan evergreen broad-leaved forest (Figure 2).

4.3. Functional Diversity Was Influenced by Environmental Effects

Environmental factors such as topography or soil affect the spatial distribution of plant functional traits and thus affect plant functional diversity [41,42]. At a small scale, elevation and convexity were the two most important topographic factors affecting plant functional traits in the subtropical evergreen broad-leaved forest, while soil water content and total nitrogen content were the most important soil factors affecting plant functional traits [42]. Altitudinal gradient is essentially an environmental gradient, and species diversity changes regularly with altitude, and its related functional diversity is also affected by altitude gradient. Because the distribution of functional traits will change with altitude, the functional diversity of community will change as a result [43]. By detecting the relationship between functional diversity index and altitude, we can reveal the effect of altitude on community functional diversity [44]. In the Dinghushan (DHS) plot, species diversity varies with elevation, and here the functional richness, evenness, and divergence indices declined with altitude, although altitude had weak influence on them.
In addition, we found other environmental factors besides altitude also affected the functional diversity of populations in the DHS evergreen broad-leaved forest. N, P and K are essential nutrients for plant growth, and the contents and forms of nutrient elements in soil also significantly affect plant functional traits. Phosphorus is a major limiting factor in many forested areas of the world because a severe lack of phosphorus in soil affects certain processes of photosynthesis [41,42]. Soil total phosphorus (TP) content in tropical and subtropical regions of China is lower than that in other regions [42]. In our research in the DHS evergreen broad-leaved forest, total phosphorus (TP) was the most critical environmental factor affecting functional diversity, followed by available nitrogen (AN), then followed by available potassium (AK), organic matter (TO), total nitrogen (TN) and Volume weight of soil (VW). Mean elevation had less influence on functional diversity than the above factors, and the convex had the least effect on functional diversity in our subtropical forest community. The functional richness was mainly affected by soil nutrients and properties [41,42]. In our subtropical forest, TP, AN, AK, TO and TN promoted the functional richness, while AP, Rsw (soil moisture content), pH and VW inhibited it. The three functional divergence indices were greatly affected by slope, while the functional evenness index (FEve) was least affected by various environmental factors.

5. Conclusions

Taken together, our results provide the first measurements of the relationships between functional and species diversity, plant habits, elevation, and other environmental factors such as topography and soil in a lower subtropical forest. We confirmed that three types of functional diversity (functional richness, functional evenness and functional divergence) represented independent components of functional diversity. We found that most functional diversity and species diversity indices significantly differed with plant habit. There was a significant positive correlation among functional richness indices. However, functional divergence indices FDiv and RaoQ were significantly negatively correlated, and RaoQ and FDis were uncorrelated. The correlations between three types (richness, evenness, and divergence) of functional diversity indices and the three species diversity indices were different. Three functional richness indices (MFAD, FRic and FGR) were increased with three species diversity indices (species richness (S), Shannon-Wiener index (H) and Pielou index (E)). The functional evenness index (FEve) decreased with species richness (S), Shannon-Wiener index (H) and increased with species evenness (Pielou index (E)), but the change trend was small. All three of the types of functional diversity indices declined with altitude, although altitude had a weak influence on them. Here, soil total phosphorus (TP) was the most critical environmental factor and the convex had the least effect on functional diversity in our subtropical forest community. These results will contribute to our understanding of functional diversity in subtropical forests, and provide a basis for biodiversity conservation in this region.

Supplementary Materials

The following are available online at https://www.mdpi.com/article/10.3390/f13070966/s1. Table S1: The list of 100 species with their families and three types of plant habit.

Author Contributions

S.W., W.Y. and J.L. designed the study, S.W. and L.L. performed analyses, Z.W. drew some plots, L.L. and S.W. wrote the first draft of the manuscript. All authors have read and agreed to the published version of the manuscript.

Funding

This study was funded by Guangxi Natural Science Foundation Program (2020GXNSFAA159108, 2022GXNSFAA035583), the National Natural Science Foundation of China (32060305), Foundation of Key Laboratory of Ecology of Rare and Endangered Species and Environmental Protection (Guangxi Normal University), Ministry of Education, China (ERESEP2021Z06) and Chinese Forest Biodiversity Monitoring Network.

Data Availability Statement

The datasets generated during the current study are available from the corresponding author on reasonable request.

Acknowledgments

We appreciate Zhongliang Huang and Honglin Cao for the help of collecting community data, we thank Ronghua Li and Qing Ye for their support and help in measuring functional traits. We would like to thank Ian Gilman at Yale University for his assistance with English language and grammatical editing, also thank the help from Yanjun Du. We also thank numerous individuals who contributed to the field survey of the DHS plot. This plot is part of the Center for Tropical Forest Science, a global network of large-scale demographic tree plots. We would like to thank all of the reviewers and editors for their hard work and dedication.

Conflicts of Interest

The authors declare no conflict of interest.

References

  1. Schleuter, D.; Daufresne, M.; Massol, F.; Argillier, C. A user’s guide to functional diversity indices. Ecol. Monogr. 2010, 80, 469–484. [Google Scholar] [CrossRef] [Green Version]
  2. Mouchet, M.; Guilhaumon, F.; Villeger, S.; Mason, N.W.H.; Tomasini, J.A.; Mouillot, D. Towards a consensus for calculating dendrogram-based functional diversity indices. Oikos 2008, 117, 794–800. [Google Scholar] [CrossRef]
  3. Petchey, O.; Gaston, K. Dendrograms and measuring functional diversity. Oikos 2007, 116, 1422–1426. [Google Scholar] [CrossRef]
  4. Pimiento, C.; Leprieur, F.; Silvestro, D.; Lefcheck, J.S.; Albouy, C.; Rasher, D.B.; Davis, M.; Svenning, J.C.; Griffin, J.N. Functional diversity of marine megafauna in the Anthropocene. Sci. Adv. 2020, 6, eaay7650. [Google Scholar] [CrossRef] [Green Version]
  5. Tilman, D.; Knops, J.; Wedin, D.; Reich, P.; Ritchie, M.; Siemann, E. The influence of functional diversity and composition on ecosystem processes. Science 1997, 277, 1300–1302. [Google Scholar] [CrossRef] [Green Version]
  6. Kuebbing, S.E.; Maynard, D.S.; Bradford, M.A. Linking functional diversity and ecosystem processes: A framework for using functional diversity metrics to predict the ecosystem impact of functionally unique species. J. Ecol. 2018, 106, 687–698. [Google Scholar] [CrossRef]
  7. Petchey, O.L.; Gaston, K.J. Functional diversity: Back to basics and looking forward. Ecol. Lett. 2006, 9, 741–758. [Google Scholar] [CrossRef]
  8. Mason, N.W.H.; Mouillot, D.; Lee, W.G.; Wilson, J.B. Functional richness, functional evenness and functional divergence: The primary components of functional diversity. Oikos 2005, 111, 112–118. [Google Scholar] [CrossRef]
  9. Walker, B.; Kinzig, A.; Langridge, J. Plant Attribute Diversity, Resilience, and Ecosystem Function: The Nature and Significance of Dominant and Minor Species. Ecosystems 1999, 2, 95–113. [Google Scholar] [CrossRef]
  10. Petchey, O.L.; Gaston, K.J. Extinction and the loss of functional diversity. Proc. R. Soc. B Biol. Sci. 2002, 269, 1721–1727. [Google Scholar] [CrossRef] [Green Version]
  11. Mason, N.W.H.; MacGillivray, K.; Steel, J.B.; Wilson, J.B. An index of functional diversity. J. Veg. Sci. 2003, 14, 571–578. [Google Scholar] [CrossRef]
  12. Ricotta, C. A note on functional diversity measures. Basic Appl. Ecol. 2005, 6, 479–486. [Google Scholar] [CrossRef]
  13. Mouillot, D.; Mason, W.H.N.; Dumay, O.; Wilson, J.B. Functional regularity: A neglected aspect of functional diversity. Oecologia 2005, 142, 353–359. [Google Scholar] [CrossRef] [PubMed]
  14. Podani, J.; Schmera, D. On dendrogram-based measures of functional diversity. Oikos 2006, 115, 179–185. [Google Scholar] [CrossRef] [Green Version]
  15. Garnier, E.; Navas, M.L.; Grigulis, K. Plant Functional Diversity: Organism Traits, Community Structure, and Ecosystem Properties; Oxford University Press: Oxford, UK, 2016. [Google Scholar]
  16. Zhang, H.; Chen, H.Y.H.; Lian, J.Y.; John, R.; Li, R.H.; Liu, H.; Ye, W.H.; Berninger, F.; Ye, Q. Using functional trait diversity patterns to disentangle the scale-dependent ecological processes in a subtropical forest. Funct. Ecol. 2018, 32, 1379–1389. [Google Scholar] [CrossRef]
  17. Yang, X.X.; Li, M.Q.; He, X.D. Effects of Functional Diversity on Species Diversity of Plant Communities in Sandy Land. Acta Sci. Nat. Univ. Nankaiensis 2020, 53, 75–80. [Google Scholar]
  18. Funk, J.L.; Larson, J.E.; Ames, G.M.; Butterfield, B.J.; Cavender-Bares, J.; Firn, J.; Laughlin, D.C.; Sutton-Grier, A.E.; Williams, L.; Wright, J. Revisiting the Holy Grail: Using plant functional traits to understand ecological processes. Biol. Rev. 2017, 92, 1156–1173. [Google Scholar] [CrossRef]
  19. Cornwell, W.K.; Schwilk, D.W.; Ackerly, D.D. A trait-based test for habitat filtering: Convex hull volume. Ecology 2006, 87, 1465–1471. [Google Scholar] [CrossRef]
  20. Butterfield, B.J.; Callaway, R.M. A functional comparative approach to facilitation and its context dependence. Funct. Ecol. 2013, 27, 907–917. [Google Scholar] [CrossRef]
  21. Shi, P.; Preisler, H.K.; Quinn, B.K.; Zhao, J.; Huang, W.; Röll, A.; Cheng, X.; Li, H.; Hölscher, D. Precipitation is the most crucial factor determining the distribution of moso bamboo in Mainland China. Global Ecology and Conservation. Glob. Ecol. Conserv. 2020, 22, e00924. [Google Scholar] [CrossRef]
  22. Duran, S.M.; Martin, R.E.; Diaz, S.; Maitner, B.S.; Malhi, Y.; Salinas, N.; Shenkin, A.; Silman, M.R.; Wieczynski, D.J.; Asner, G.P.; et al. Informing trait-based ecology by assessing remotely sensed functional diversity across a broad tropical temperature gradient. Sci. Adv. 2019, 5, eaaw8114. [Google Scholar] [CrossRef] [Green Version]
  23. Schrader, J.; Shi, P.J.; Royer, D.L.; Peppe, D.J.; Gallagher, R.V.; Li, Y.R.; Wang, R.; Wright, I.J. Leaf size estimation based on leaf length, width and shape. Ann. Bot. 2021, 128, 395–406. [Google Scholar] [CrossRef]
  24. Yu, X.; Shi, P.; Schrader, J.; Niklas, K.J. Nondestructive estimation of leaf area for 15 species of vines with different leaf shapes. Am. J. Bot. 2020, 107, 1481–1490. [Google Scholar] [CrossRef]
  25. Lin, G.; Stralberg, D.; Gong, G.; Huang, Z. Separating the Effects of Environment and Space on Tree Species Distribution: From Population to Community. PLoS ONE 2013, 8, e56171. [Google Scholar] [CrossRef] [Green Version]
  26. Condit, R.; Engelbrecht, B.M.J.; Pino, D.; Pérez, R.; Turner, B.L. Species distributions in response to individual soil nutrients and seasonal drought across a community of tropical trees. Proc. Natl. Acad. Sci. USA 2013, 110, 5064–5068. [Google Scholar] [CrossRef] [Green Version]
  27. Wang, Z.; Ye, W.; Cao, H.; Huang, Z.; Lian, J.; Li, L.; Wei, S.; Sun, I.-F. Species-topography association in a species-rich subtropical forest of China. Basic Appl. Ecol. 2009, 10, 648–655. [Google Scholar] [CrossRef]
  28. Legendre, P.; Mi, X.; Ren, H.; Ma, K.; Yu, M.; Sun, I.F.; He, F. Partitioning beta diversity in a subtropical broad-leaved forest of China. Ecology 2009, 90, 663–674. [Google Scholar] [CrossRef] [Green Version]
  29. Shen, Y.; Santiago, L.S.; Shen, H.; Ma, L.; Lian, J.Y.; Cao, H.L.; Lu, H.P.; Ye, W.H. Determinants of change in subtropical tree diameter growth with ontogenetic stage. Oecologia 2014, 175, 1315–1324. [Google Scholar] [CrossRef] [Green Version]
  30. Shen, Y.; Yu, S.X.; Lian, J.Y.; Shen, H.; Cao, H.L.; Lu, H.P.; Ye, W.H. Tree aboveground carbon storage correlates with environmental gradients and functional diversity in a tropical forest. Sci. Rep. 2016, 6, 25304. [Google Scholar] [CrossRef] [Green Version]
  31. Villéger, S.; Mason, N.W.H.; Mouillot, D. New multidimensional functional diversity indices for a multifaceted framework in functional ecology. Ecology 2008, 89, 2290–2301. [Google Scholar] [CrossRef] [Green Version]
  32. Laliberté, E.; Legendre, P. A distance-based framework for measuring functional diversity from multiple traits. Ecology 2010, 91, 299–305. [Google Scholar] [CrossRef] [PubMed]
  33. Botta-Dukát, Z. Rao’s quadratic entropy as a measure of functional diversity based on multiple traits. J. Veg. Sci. 2005, 16, 533–540. [Google Scholar] [CrossRef]
  34. Lajoie, G.; Vellend, M. Understanding context dependence in the contribution of intraspecific variation to community trait–environment matching. Ecology 2016, 96, 2912–2922. [Google Scholar] [CrossRef] [PubMed] [Green Version]
  35. Zhang, X.; Li, Y.; He, X.M.; Yang, X.D.; Lü, G.H. Responses of plant functional trait and diversity to soil water and salinity changes in desert ecosystem. Acta Ecol. Sin. 2019, 39, 1541–1550. [Google Scholar]
  36. Hooper, D.U.; Buchmann, N.; Degrange, V.; Díaz, S.M.; Spehn, E.M. Species diversity, functional diversity and ecosystem functioning. In Biodiversity and Ecosystem Functioning: Synthesis and Perspectives; Loreau, M., Naeem, S., Inchausti, P., Eds.; Oxford University Press: Oxford, UK, 2002; pp. 195–208. [Google Scholar]
  37. Xue, Q.N.; Yan, M.; Bi, R.C. Functional Diversity Research of Tree and Shrub Layers in Forest Communities of the Wulu Mountains Nature Reserve in Shanxi, China. Acta Ecol. Sin. 2015, 35, 7023–7032. [Google Scholar]
  38. Dong, S.K.; Tang, L.; Zhang, X.F.; Liu, S.L.; Liu, Q.R.; Su, X.K.; Zhang, Y.; Wu, X.Y.; Zhao, Z.; Li, Y.; et al. Relationship between plant species diversity and functional diversity in alpine grasslands. Acta Ecol. Sin. 2017, 37, 1472–1483. [Google Scholar]
  39. Chen, C.; Zhu, Z.H.; Li, Y.N.; Yao, T.H.; Pan, S.Y.; Wei, X.H.; Kong, B.B.; Du, J.L. Effects of interspecific trait dissimilarity and species evenness on the relationship between species diversity and functional diversity in an alpine meadow. Acta Ecol. Sin. 2016, 36, 661–674. [Google Scholar]
  40. Liu, M.X.; Nan, X.N.; Zhang, G.J. Relationship between species diversity and functional diversity of plant communities on different slopes in alpine meadow. Acta Ecol. Sin. 2021, 41, 5398–5407. [Google Scholar]
  41. Wu, C.C.; Tsui, C.C.; Hseih, C.F.; Asio, V.B.; Chen, Z.S. Mineral nutrient status of tree species in relation to environmental factors in the subtropical rain forest of Taiwan. For. Ecol. Manag. 2007, 239, 81–91. [Google Scholar] [CrossRef]
  42. Ding, J.; Wu, Q.; Yan, H.; Zhang, S. Effects of topographic variations and soil characteristics on plant functional traits in a subtropical evergreen broad-leaved forest. Biodivers. Sci. 2011, 19, 158–167. [Google Scholar]
  43. Zhou, G.X.; Huang, L.X.; Zang, X.W.; Wei, X.; Ye, W.H.; Shen, H. Effects of Habitat Heterogeneity on Community Functional Diversity of Dinghu Mountain Evergreen Broad-leaved Forest. Guihaia 2016, 36, 127–136. [Google Scholar]
  44. Qin, H.; Zhang, Y.B.; Dong, G.; Zhang, F. Altitudinal patterns of taxonomic, phylogenetic and functional diversity of forest communities in Mount Guandi, Shanxi, China. Chin. J. Plant Ecol. 2019, 43, 762–773. [Google Scholar]
Figure 1. Location of the Dinghushan plot in Dinghu Mountain Nature Reserve, South China. (a) China, (b) Dinghu Mountain, (c) Dinghushan plot.
Forests 13 00966 g001aForests 13 00966 g001b
Figure 2. Functional diversity indices of different plant habits. Letters (a–c) above bars indicate significantly different groups within each diversity index.
Forests 13 00966 g002
Figure 3. Correlation between functional diversity indexes.
Forests 13 00966 g003
Figure 4. The relationships between the functional and species diversity indices.
Forests 13 00966 g004aForests 13 00966 g004bForests 13 00966 g004c
Figure 5. Relationships between elevation and functional diversity indices.
Forests 13 00966 g005aForests 13 00966 g005b
Figure 6. RDA analysis on the relationship between environmental factors and functional diversity indices.
Forests 13 00966 g006
Table 1. Trait description and performance.
Column HeaderDescriptionPerformance
NmassLeaf nitrogen content per unit mass (g g−1)Nitrogen economy of leaves
PmassLeaf phosphorus content per unit mass (g g−1)Phosphorus economy of leaves
SLASpecific leaf area (cm2 g−1)Carbon economy of leaves
GsStomatal conductance per unit mass (mmol g−1 s−1)Light capture strategy
LALeaf area(cm2)Light capture strategy
PlPetiole length (cm)Light capture strategy
ChlLeaf chlorophyll concentration (g m−2)Light capture strategy
PNUEPhotosynthetic nitrogenuse efficiency (μmol mol−1 s−1)Light capture strategy
PPUEPhotosynthetic phosphorus use efficiency (μmol mol−1 s−1)Light capture strategy
PdmPetiole dry matter (mg kg−1)Light capture strategy
WDSapwood density (g cm−3)Hydraulic conductivity
KlLeaf-specific conductivity (kg m−1 s−1 MPa−1)Hydraulic conductivity
KsSapwood-specific conductivity (kg m−1 s−1 MPa−1)Hydraulic conductivity
PdPetiole density (g cm−2)Hydraulic conductivity
LSLeaf shape: oval, long elliptic, lanceolate, palmate leafEcological adaptability
Plant habitThree forms: large tree, small tree, and shrubEcological adaptability
Seed Dispersal ModeThree modes: dispersal by animals, dispersal by wind, and dispersal both by animals and windEcological adaptability
Table 2. Environmental factors that were collected for 20 × 20 m quadrats in the DHS plot.
NO.AbbreviationDescription
1AKRapidly available potassium
2ANSoil available nitrogen
3APSoil available phosphorus
4TOSoil organic matter
5TPSoil total phosphorus
6TKSoil total potassium
7TNSoil total nitrogen
8VWVolume weight of soil
9RSWSoil moisture content
10pHSoil pH
11AspectAspect
12MeanelevAverage elevation
13ConvexConvex
14SlopeSlope
Publisher’s Note: MDPI stays neutral with regard to jurisdictional claims in published maps and institutional affiliations.

