
Soil Moisture and Black Truffle Production Variability in the Iberian Peninsula

 , , , , and
Abstract
:1. Introduction
2. Materials and Methods
2.1. Study Area and Black Truffle Production Dataset
2.2. Soil Moisture and Precipitation Databases
2.3. Statistical Analysis
3. Results and Discussion
4. Conclusions
Author Contributions
Funding
Institutional Review Board Statement
Informed Consent Statement
Data Availability Statement
Conflicts of Interest
References
- Reyna, S.; García-Barreda, S. Black truffle cultivation: A global reality. For. Syst. 2014, 23, 317–328. [Google Scholar] [CrossRef]
- Hall, I.R.; Brown, G.T.; Zambonelli, A. Taming the Truffle; Timber Press: Portland, OR, USA, 2007. [Google Scholar]
- García-Barreda, S.; Forcadell, R.; Sánchez, S.; Martín-Santafé, M.; Marco, P.; Camarero, J.J.; Reyna, S. Black truffle harvesting in Spanish forests: Trends, current policies and practices, and implications on its sustainability. Environ. Manag. 2018, 61, 535–544. [Google Scholar] [CrossRef] [PubMed]
- García-Barreda, S.; Reyna, S.; Pérez-Badía, R.; Rodríguez-Barreal, J.A.; Domínguez-Núñez, J.A. Ecología de la Trufa y Las Áreas Truferas. In Truficultura: Fundamentos y Técnicas; Reyna, S., Ed.; Mundi-Prensa: Madrid, Spain, 2007; pp. 153–208. [Google Scholar]
- Büntgen, U.; Egli, S.; Camarero, J.J.; Fischer, E.M.; Stobbe, U.; Kauserud, H.; Tegel, W.; Sproll, L.; Stenseth, N.C. Drought-induced decline in Mediterranean truffle harvest. Nat. Clim. Chang. 2012, 2, 827–829. [Google Scholar] [CrossRef]
- Le Tacon, F.; Marçais, B.; Courvoisier, M.; Murat, C.; Montpied, P.; Becker, M. Climatic variations explain annual fluctuations in French Périgord black truffle whole sale markets but do not explain the decrease in black truffle production over the last 48 years. Mycorrhiza 2014, 24, 115–125. [Google Scholar] [CrossRef] [PubMed]
- Pacioni, G.; Leonardi, M.; Di Carlo, P.; Ranalli, D.; Zinni, A.; De Laurentiis, G. Instrumental monitoring of the birth and development of truffles in a Tuber melanosporum orchard. Mycorrhiza 2014, 24, 65–72. [Google Scholar] [CrossRef] [PubMed]
- García-Barreda, S.; Camarero, J.J.; Vicente-Serrano, S.M.; Serrano-Notivoli, R. Variability and trends of black truffle production in Spain (1970–2017): Linkages to climate, host growth, and human factors. Agric. For. Meteorol. 2020, 287, 107951. [Google Scholar] [CrossRef]
- Le Tacon, F.; Zeller, B.; Plain, C.; Hossann, C.; Bréchet, C.; Robin, C. Carbon transfer from the host to Tuber melanosporum mycorrhizas and ascocarps followed using a 13C pulse-labeling technique. PLoS ONE 2013, 8, e64626. [Google Scholar] [CrossRef] [Green Version]
- García-Barreda, S.; Camarero, J.J. Tree ring and water deficit indices as indicators of drought impact on black truffle production in Spain. For. Ecol. Manag. 2020, 475, 118438. [Google Scholar] [CrossRef]
- Kauserud, H.; Heegaard, E.; Büntgen, U.; Halvorsen, R.; Egli, S.; Senn-Irlet, B.; Krisai-Greilhuber, I.; Dämon, W.; Sparks, T.; Nordén, J.; et al. Warming-induced shift in European mushroomfruiting phenology. Proc. Natl. Acad. Sci. USA 2012, 109, 14488–14493. [Google Scholar] [CrossRef] [Green Version]
- Vicente-Serrano, S.M.; Tomas-Burguera, M.; Beguería, S.; Reig, F.; Latorre, B.; Peña-Gallardo, M.; Luna, M.Y.; Morata, A.; González-Hidalgo, J.C. A high resolution dataset of drought indices for Spain. Data 2017, 2, 22. [Google Scholar] [CrossRef] [Green Version]
- Pradel, L. Manuel de Trufficulture: Guide Pratique; PLB Editeur: Paris, France, 1914. [Google Scholar]
- Le Tacon, F.; Delmas, J.; Gleyze, R.; Bouchard, D. Influence du régime hydrique du sol et de la fertilisation sur la fructification de la truffe noire du Perigord (Tuber melanosporum Vitt.) dans le Sud-Est de la France. Acta Oecol. Oec. Appl. 1982, 3, 291–306. [Google Scholar]
- Seneviratne, S.I.; Corti, T.; Davin, E.L.; Hirschi, M.; Jaeger, E.B.; Lehner, I.; Orlowsky, B.; Teuling, A.J. Investigating soil moisture–climate interactions in a changing climate: A review. Earth-Sci. Rev. 2010, 99, 125–161. [Google Scholar] [CrossRef]
- Martínez-Fernández, J.; González-Zamora, A.; Sánchez, N.; Gumuzzio, A. A soil water based index as a suitable agricultural drought indicator. J. Hydrol. 2015, 522, 265–273. [Google Scholar] [CrossRef]
- Liu, Y.; Liu, Y.; Wang, W. Inter-comparison of satellite-retrieved and global land data assimilation system-simulated soil moisture datasets for global drought analysis. Remote Sens. Environ. 2019, 220, 1–18. [Google Scholar] [CrossRef]
- Berthet, L.; Andréassian, V.; Perrin, C.; Javelle, P. How crucial is it to account for the antecedent moisture conditions in flood forecasting? Comparison of event-based and continuous approaches on 178 catchments. Hydrol. Earth Syst. Sci. 2009, 13, 819–831. [Google Scholar] [CrossRef] [Green Version]
- Brocca, L.; Melone, F.; Moramarco, T. Distributed rainfall-runoff modelling for flood frequency estimation and flood forecasting. Hydrol. Process. 2011, 25, 2801–2813. [Google Scholar] [CrossRef]
- Champagne, C.; White, J.; Berg, A.; Belair, S.; Carrera, M. Impact of soil moisture data characteristics on the sensitivity to crop yields under drought and excess moisture conditions. Remote Sens. 2019, 11, 372. [Google Scholar] [CrossRef] [Green Version]
- Martínez-Fernández, J.; Almendra-Martín, L.; de Luis, M.; González-Zamora, A.; Herrero-Jiménez, C.M. Tracking tree growth through satellite soil moisture monitoring: A case study of Pinus halepensis in Spain. Remote Sens. Environ. 2019, 235, 111422. [Google Scholar] [CrossRef]
- González-Zamora, Á.; Almendra-Martín, L.; de Luis, M.; Martínez-Fernández, J. Influence of soil moisture vs. climatic factors in Pinus halepensis growth variability in Spain: A study with remote sensing and modeled data. Remote Sens. 2021, 13, 757. [Google Scholar] [CrossRef]
- Brocca, L.; Ciabatta, L.; Massari, C.; Camici, S.; Tarpanelli, A. Soil moisture for hydrological applications: Open questions and new opportunities. Water 2017, 9, 140. [Google Scholar] [CrossRef]
- Dorigo, W.; Himmelbauer, I.; Aberer, D.; Schremmer, L.; Petrakovic, I.; Zappa, L.; Preimesberger, W.; Xaver, A.; Annor, F.; Ardö, J.; et al. The International Soil Moisture Network: Serving Earth system science for over a decade. Hydrol. Earth Syst. Sci. Discuss. 2021, 25, 5749–5804. [Google Scholar] [CrossRef]
- GCOS. Implementation Plan for the Global Observing System for Climate (GCOS) in Support of the United Nations Framework Convention on Climate Change (UNFCCC); World Meteorological Organization: Geneva, Switzerland, 2010. [Google Scholar]
- Kerr, Y.H.; Waldteufel, P.; Wigneron, J.-P.; Delwart, S.; Cabot, F.; Boutin, J.; Escorihuela, M.J.; Font, J.; Reul, N.; Gruhier, C.; et al. The SMOS mission: New tool for monitoring key elements of the global water cycle. Proc. IEEE 2010, 98, 666–687. [Google Scholar] [CrossRef] [Green Version]
- Entekhabi, D.; Yueh, S.; O’Neill, P.; Kellogg, K. SMAP Handbook—Soil Moisture Active Passive: Mapping Soil Moisture and Freeze/Thaw from Space; JPL 400; JPL Publication: Pasadena, CA, USA, 2014. [Google Scholar]
- Gruber, A.; Scanlon, T.; van der Schalie, R.; Wagner, W.; Dorigo, W. Evolution of the ESA CCI Soil Moisture climate data records and their underlying merging methodology. Earth Syst. Sci. Data 2019, 11, 717–739. [Google Scholar] [CrossRef] [Green Version]
- García-Barreda, S.; Sánchez, S.; Marco, P.; Serrano-Notivoli, R. Agro-climatic zoning of Spanish forests naturally producing black truffle. Agric. For. Meteorol. 2019, 269, 231–238. [Google Scholar] [CrossRef]
- Serrano-Notivoli, R.; Beguería, S.; Saz, M.Á.; Longares, L.A.; de Luis, M. SPREAD: A high-resolution daily gridded precipitation dataset for Spain—An extreme events frequency and intensity overview. Earth Syst. Sci. Data 2017, 9, 721–738. [Google Scholar] [CrossRef] [Green Version]
- Serrano-Notivoli, R.; Beguería, S.; de Luis, M. STEAD: A high-resolution daily gridded temperature dataset for Spain. Earth Syst. Sci. Data 2019, 11, 1171–1188. [Google Scholar] [CrossRef] [Green Version]
- Batjes, N.H.; Ribeiro, E.; van Oostrum, A. Standardised soil profile data to support global mapping and modelling (WoSIS snapshot 2019). Earth Syst. Sci. Data 2020, 12, 299–320. [Google Scholar] [CrossRef] [Green Version]
- De Luis, M.; Brunetti, M.; Gonzalez-Hidalgo, J.C.; Longares, L.A.; Martin-Vide, J. Changes in seasonal precipitation in the Iberian Peninsula during 1946–2005. Glob. Planet. Chang. 2010, 74, 27–33. [Google Scholar] [CrossRef]
- Wood, S.N. Fast stable restricted maximum likelihood and marginal likelihood estimation of semiparametric generalized linear models. J. R. Stat. Soc. 2011, 73, 3–36. [Google Scholar] [CrossRef] [Green Version]
- Thielen, J.; Bartholmes, J.; Ramos, M.H.; de Roo, A. The European Flood Alert System-Part 1: Concept and development. Hydrol. Earth Syst. Sci. 2009, 13, 125–140. [Google Scholar] [CrossRef] [Green Version]
- De Roo, A.P.J.; Wesseling, C.G.; Van Deursen, W.P.A. Physically based river basin modelling within a GIS: The LISFLOOD model. Hydrol. Process. 2000, 14, 1981–1992. [Google Scholar] [CrossRef]
- Smith, P.J.; Pappenberger, F.; Wetterhall, F.; Del Pozo, J.T.; Krzeminski, B.; Salamon, P.; Muraro, D.; Kalas, M.; Baugh, C. On the Operational Implementation of the European Flood Awareness System (EFAS); Flood forecasting, 313–348; Academic Press: Cambridge, MA, USA, 2016. [Google Scholar]
- Laguardia, G.; Niemeyer, S. On the comparison between the LISFLOOD modelled and the ERS/SCAT derived soil moisture estimates. Hydrol. Earth Syst. Sci. 2008, 12, 1339–1351. [Google Scholar] [CrossRef] [Green Version]
- Almendra-Martín, L.; Martínez-Fernández, J.; González-Zamora, Á.; Benito-Verdugo, P.; Herrero-Jiménez, C.M. Agricultural drought trends on the Iberian Peninsula: An analysis using modeled and reanalysis soil moisture products. Atmosphere 2021, 12, 236. [Google Scholar] [CrossRef]
- Balsamo, G.; Albergel, C.; Beljaars, A.; Boussetta, S.; Brun, E.; Cloke, H.; Dee, D.; Dutra, E.; Muñoz-Sabater, J.; Pappenberger, F.; et al. ERA-Interim/Land: A global land surface reanalysis data set. Hydrol. Earth Syst. Sci. 2015, 19, 389–407. [Google Scholar] [CrossRef] [Green Version]
- Colliander, A.; Reichle, R.H.; Crow, W.T.; Cosh, M.H.; Chen, F.; Chan, S.; Das, N.; Bindlish, R.; Chaubell, M.J.; Kim, S.B.; et al. Validation of Soil Moisture Data Products from the NASA SMAP Mission. IEEE J. Sel. Top. Appl. Earth Obs. Remote Sens. 2022, 15, 364–392. [Google Scholar] [CrossRef]
- González-Zamora, A.; Sánchez, N.; Pablos, M.; Martínez-Fernández, J. CCI soil moisture assessment with SMOS soil moisture and in situ data under different environmental conditions and spatial scales in Spain. Remote Sens. Environ. 2019, 225, 469–482. [Google Scholar] [CrossRef]
- Portal, G.; Jagdhuber, T.; Vall-llossera, M.; Camps, A.; Pablos, P.; Entekhabi, D.; Piles, M. Assessment of Multi-Scale SMOS and SMAP Soil Moisture Products across the Iberian Peninsula. Remote Sens. 2020, 12, 570. [Google Scholar] [CrossRef] [Green Version]
- Martínez del Castillo, E.; Tejedor, E.; Serrano-Notivoli, R.; Novak, K.; Saz, M.A.; Longares, L.A.; de Luis, M. Contrasting patterns of tree growth of mediterranean pine species in the Iberian Peninsula. Forests 2018, 9, 416. [Google Scholar] [CrossRef] [Green Version]
- Baragatti, M.; Grollemund, P.M.; Montpied, P.; Dupouey, J.-L.; Gravier, J.; Murat, C.; Le Tacon, F. Influence of annual climatic variations, climate changes, and sociological factors on the production of the Périgord black truffle (Tuber melanosporum Vittad.) from 1903–1904 to 1988–1989 in the Vaucluse (France). Mycorrhiza 2019, 29, 113–125. [Google Scholar] [CrossRef]
- Büntgen, U.; Oliach, D.; Martínez-Peña, F.; Latorre, J.; Egli, S.; Krusic, P.J. Black truffle winter production depends on Mediterranean summer precipitation. Environ. Res. Lett. 2019, 14, 074004. [Google Scholar] [CrossRef] [Green Version]
- Ricard, J.M.; Bergougnoux, F.; Chevalier, G.; Olivier, J.M.; Pargney, J.C.; Sourzat, P. La Truffe Guide Pratique de Trufficulture; Ctifl: Paris, France, 2003. [Google Scholar]
- Molinier, V.; Bouffaud, M.L.; Castel, T.; Mounier, A.; Colombet, A.; Recorbet, G.; Frochot, H.; Wipf, D. Monitoring the fate of a 30-year-old truffle orchard in Burgundy: From Tuber melanosporum to Tuber aestivum. Agrofor. Syst. 2013, 87, 1439–1449. [Google Scholar] [CrossRef]
- Boé, J. Modulation of soil moisture–precipitation interactions over France by large scale circulation. Clim. Dyn. 2013, 40, 875–892. [Google Scholar] [CrossRef]
- Llorens, P.; Domingo, F. Rainfall partitioning by vegetation under Mediterranean conditions. A review of studies in Europe. J. Hydrol. 2007, 335, 37–54. [Google Scholar] [CrossRef]
- Belmonte-Serrato, F.; Romero-Díaz, M.A. Interceptación de la Lluvia por la Vegetación en España; Fundación Instituto Euromeditarráneo del Agua: Murcia, Spain, 2013; 382p. [Google Scholar]
- Dolman, A.J. Summer and winter rainfall interception in an oak forest. Predictions with an analytical and a numerical simulation model. J. Hydrol. 1987, 90, 1–9. [Google Scholar] [CrossRef]
- Mankin, J.S.; Seager, R.; Smerdon, J.E.; Cook, B.I.; Williams, A.P. Mid-latitude freshwater availability reduced by projected vegetation responses to climate change. Nat. Geosci. 2019, 12, 983–988. [Google Scholar] [CrossRef]
- Frey, S.J.K.; Hadley, A.S.; Johnson, S.L.; Schulze, M.; Jones, J.A.; Betts, M.G. Spatial models reveal the microclimatic buffering capacity of old-growth forests. Sci. Adv. 2016, 2, e1501392. [Google Scholar] [CrossRef] [Green Version]
- Hernández-Rodríguez, M.; de-Miguel, S.; Pukkala, T.; Oria-de-Rueda, J.A.; Martín-Pinto, P. Climate-sensitive models for mushroom yields and diversity in Cistus ladanifer scrublands. Agric. For. Meteorol. 2015, 213, 173–182. [Google Scholar] [CrossRef]
- De-Miguel, S.; Bonet, J.A.; Pukkala, T.; Martínez de Aragón, J. Impact of forest management intensity on landscape-level mushroom productivity: A regional model-based scenario analysis. For. Ecol. Manag. 2014, 330, 218–227. [Google Scholar] [CrossRef]
- Bauer-Marschallinger, B.; Freeman, V.; Cao, S.; Paulik, C.; Schaufler, S.; Stachl, T.; Modanesi, S.; Massari, C.; Ciabatta, L.; Brocca, L.; et al. Toward global soil moisture monitoring with Sentinel-1: Harnessing assets and overcoming obstacles. IEEE Trans. Geosci. Remote Sens. 2019, 57, 520–539. [Google Scholar] [CrossRef]
- Liu, Y.; Qian, J.; Yue, H. Combined Sentinel-1A with Sentinel-2A to Estimate Soil Moisture in Farmland. IEEE J. Sel. Top. Appl. Earth Obs. Remote Sens. 2021, 14, 1292–1310. [Google Scholar] [CrossRef]


| Tmax (°C) | Tmin (°C) | Rainfall (mm) | Clay (%) | Sand (%) | Silt (%) | OM (%) | |
|---|---|---|---|---|---|---|---|
| Mean | 16.6 | 5.6 | 773 | 23.73 | 35.85 | 40.42 | 2.41 |
| Betic Range | 18.2 | 6.1 | 909 | 19.55 | 42.12 | 38.33 | 2.46 |
| Pyrenees | 16.8 | 5.6 | 992 | 26.70 | 32.12 | 41.17 | 3.12 |
| North IR. | 16.1 | 4.6 | 702 | 24.81 | 37.08 | 38.11 | 2.06 |
| Central IR. | 16.2 | 4.4 | 773 | 20.94 | 37.28 | 41.78 | 2.27 |
| South IR. | 16.8 | 6.2 | 675 | 23.43 | 36.45 | 40.12 | 2.21 |
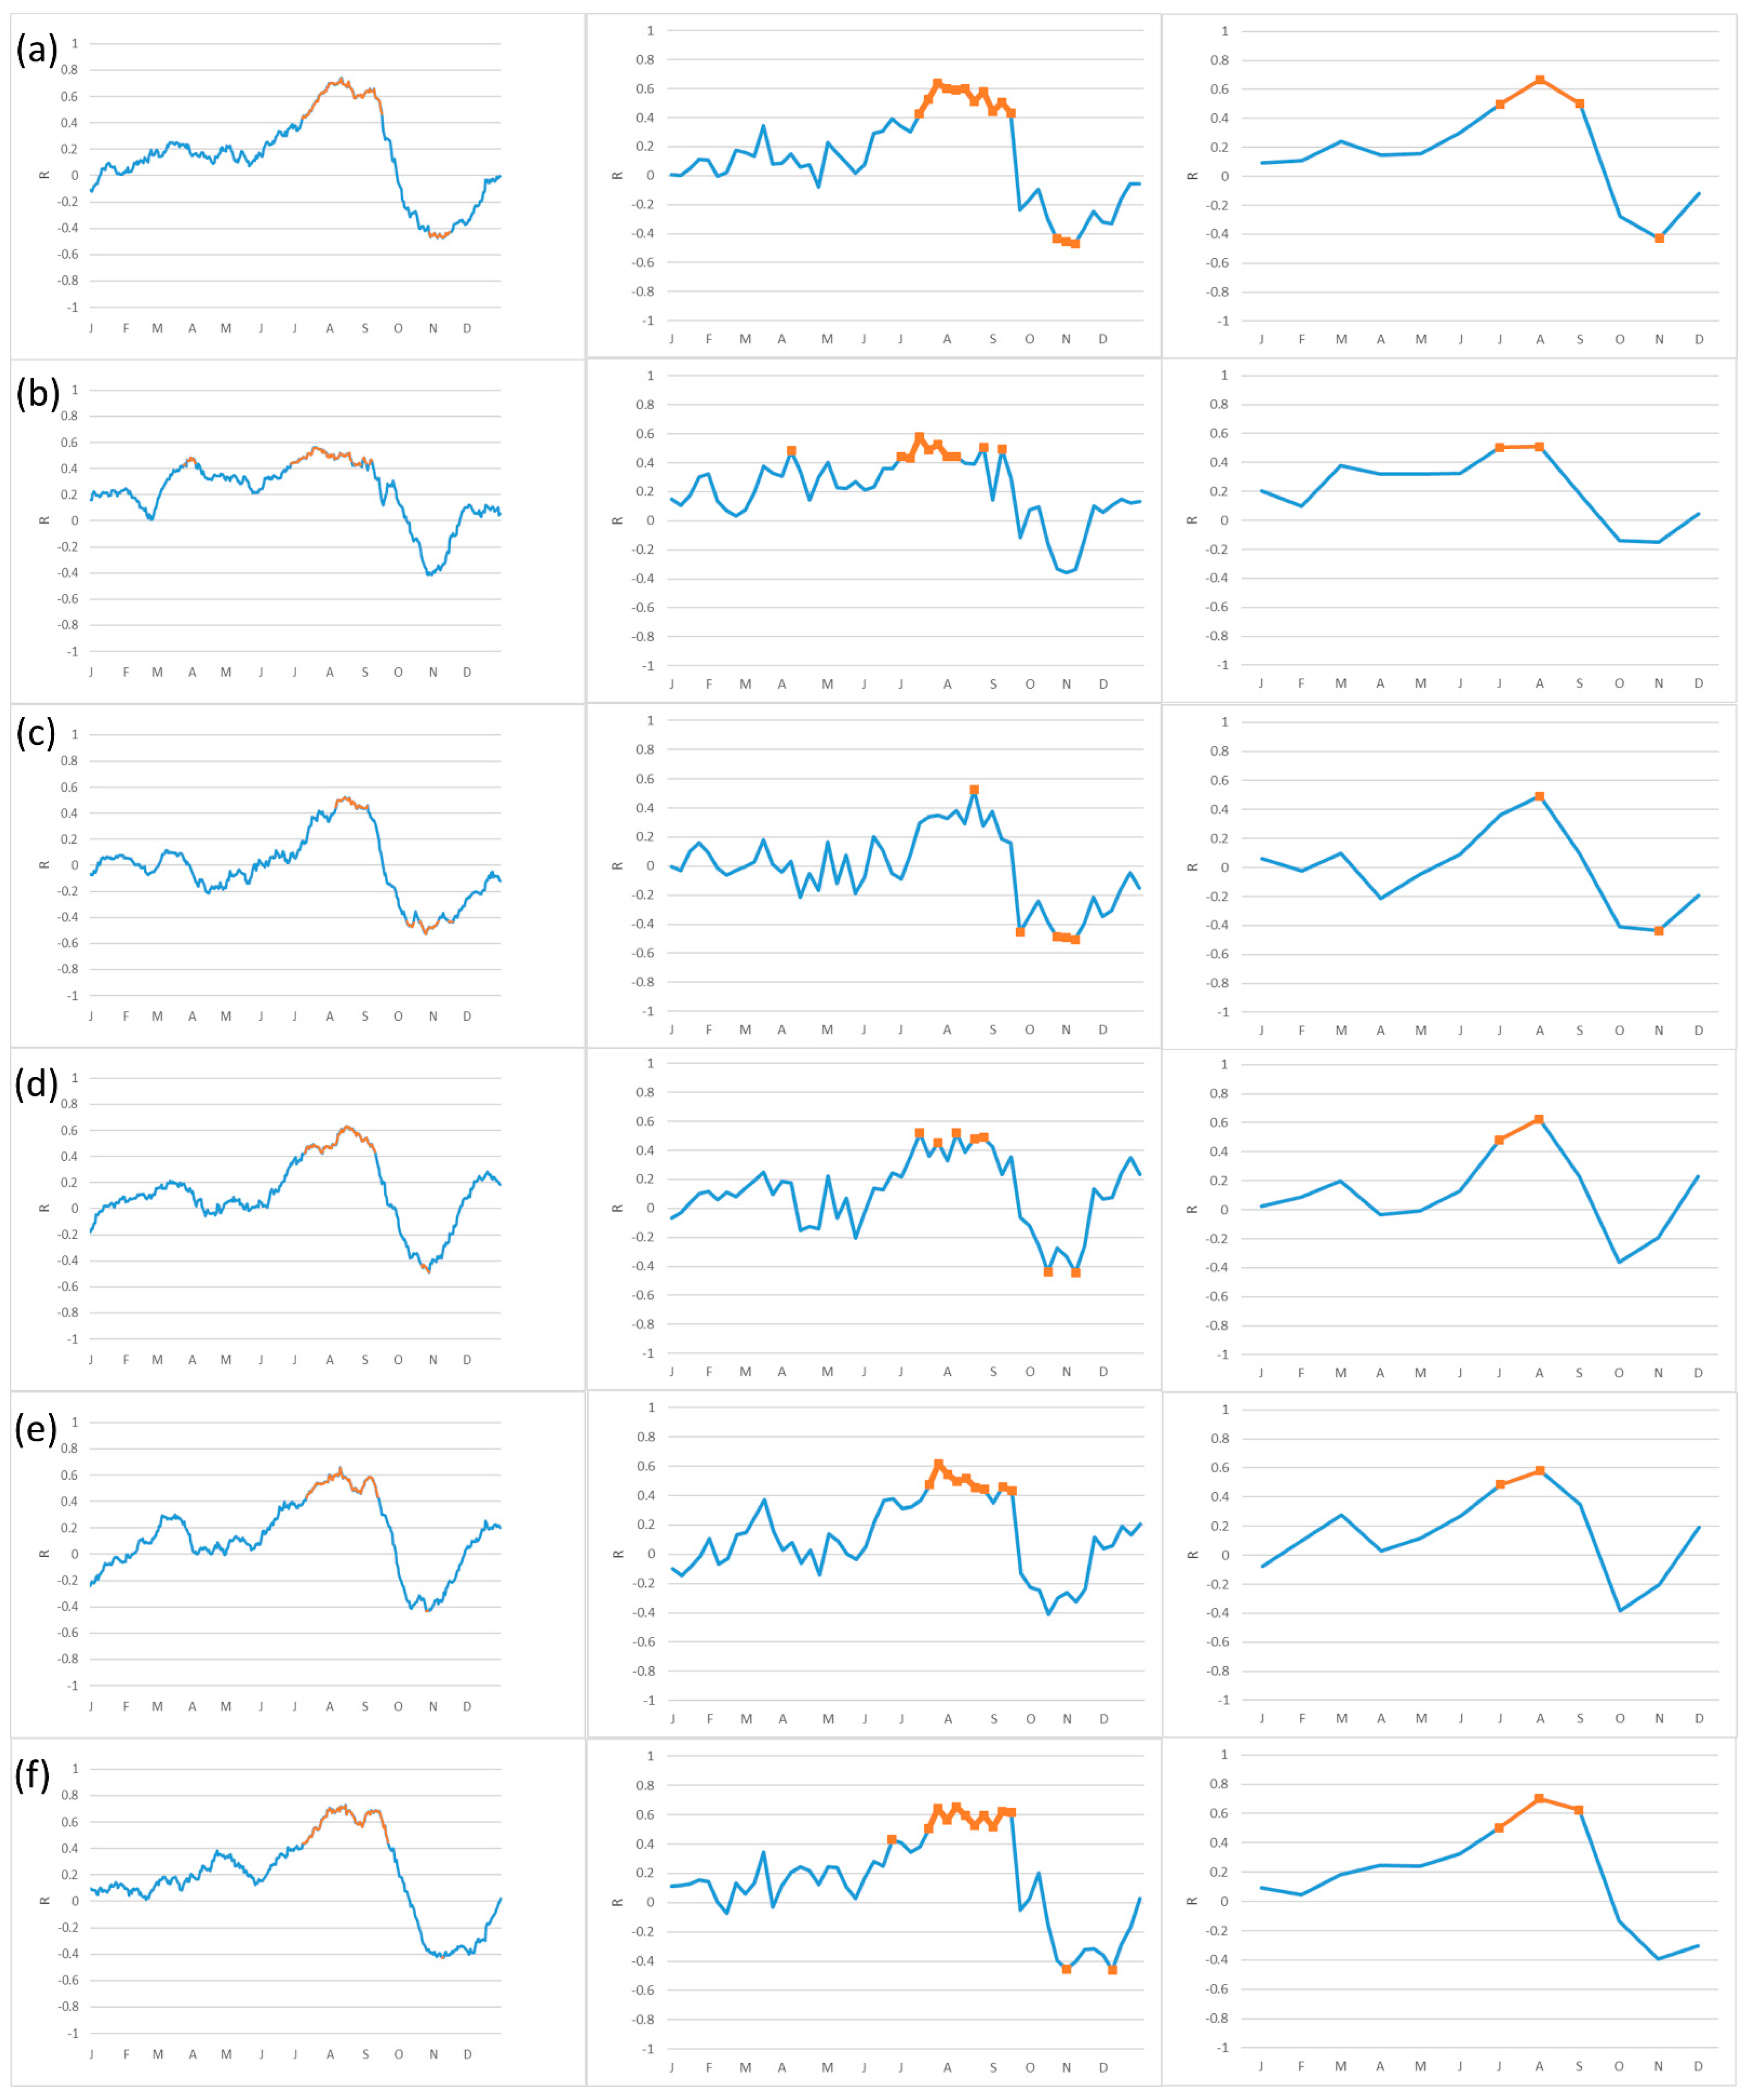
| Approach | Daily | Weekly | Monthly | |
|---|---|---|---|---|
| samples-average | Rmax | 0.74 | 0.60 | 0.66 |
| Time * | 12-August | 33 (August) | August | |
| sample-by-sample | Rmax(med) | 0.55 | 0.51 | 0.52 |
| % | 74.3 | 70.3 | 81.7 | |
| Time * | 1-August | 32 (August) | August |
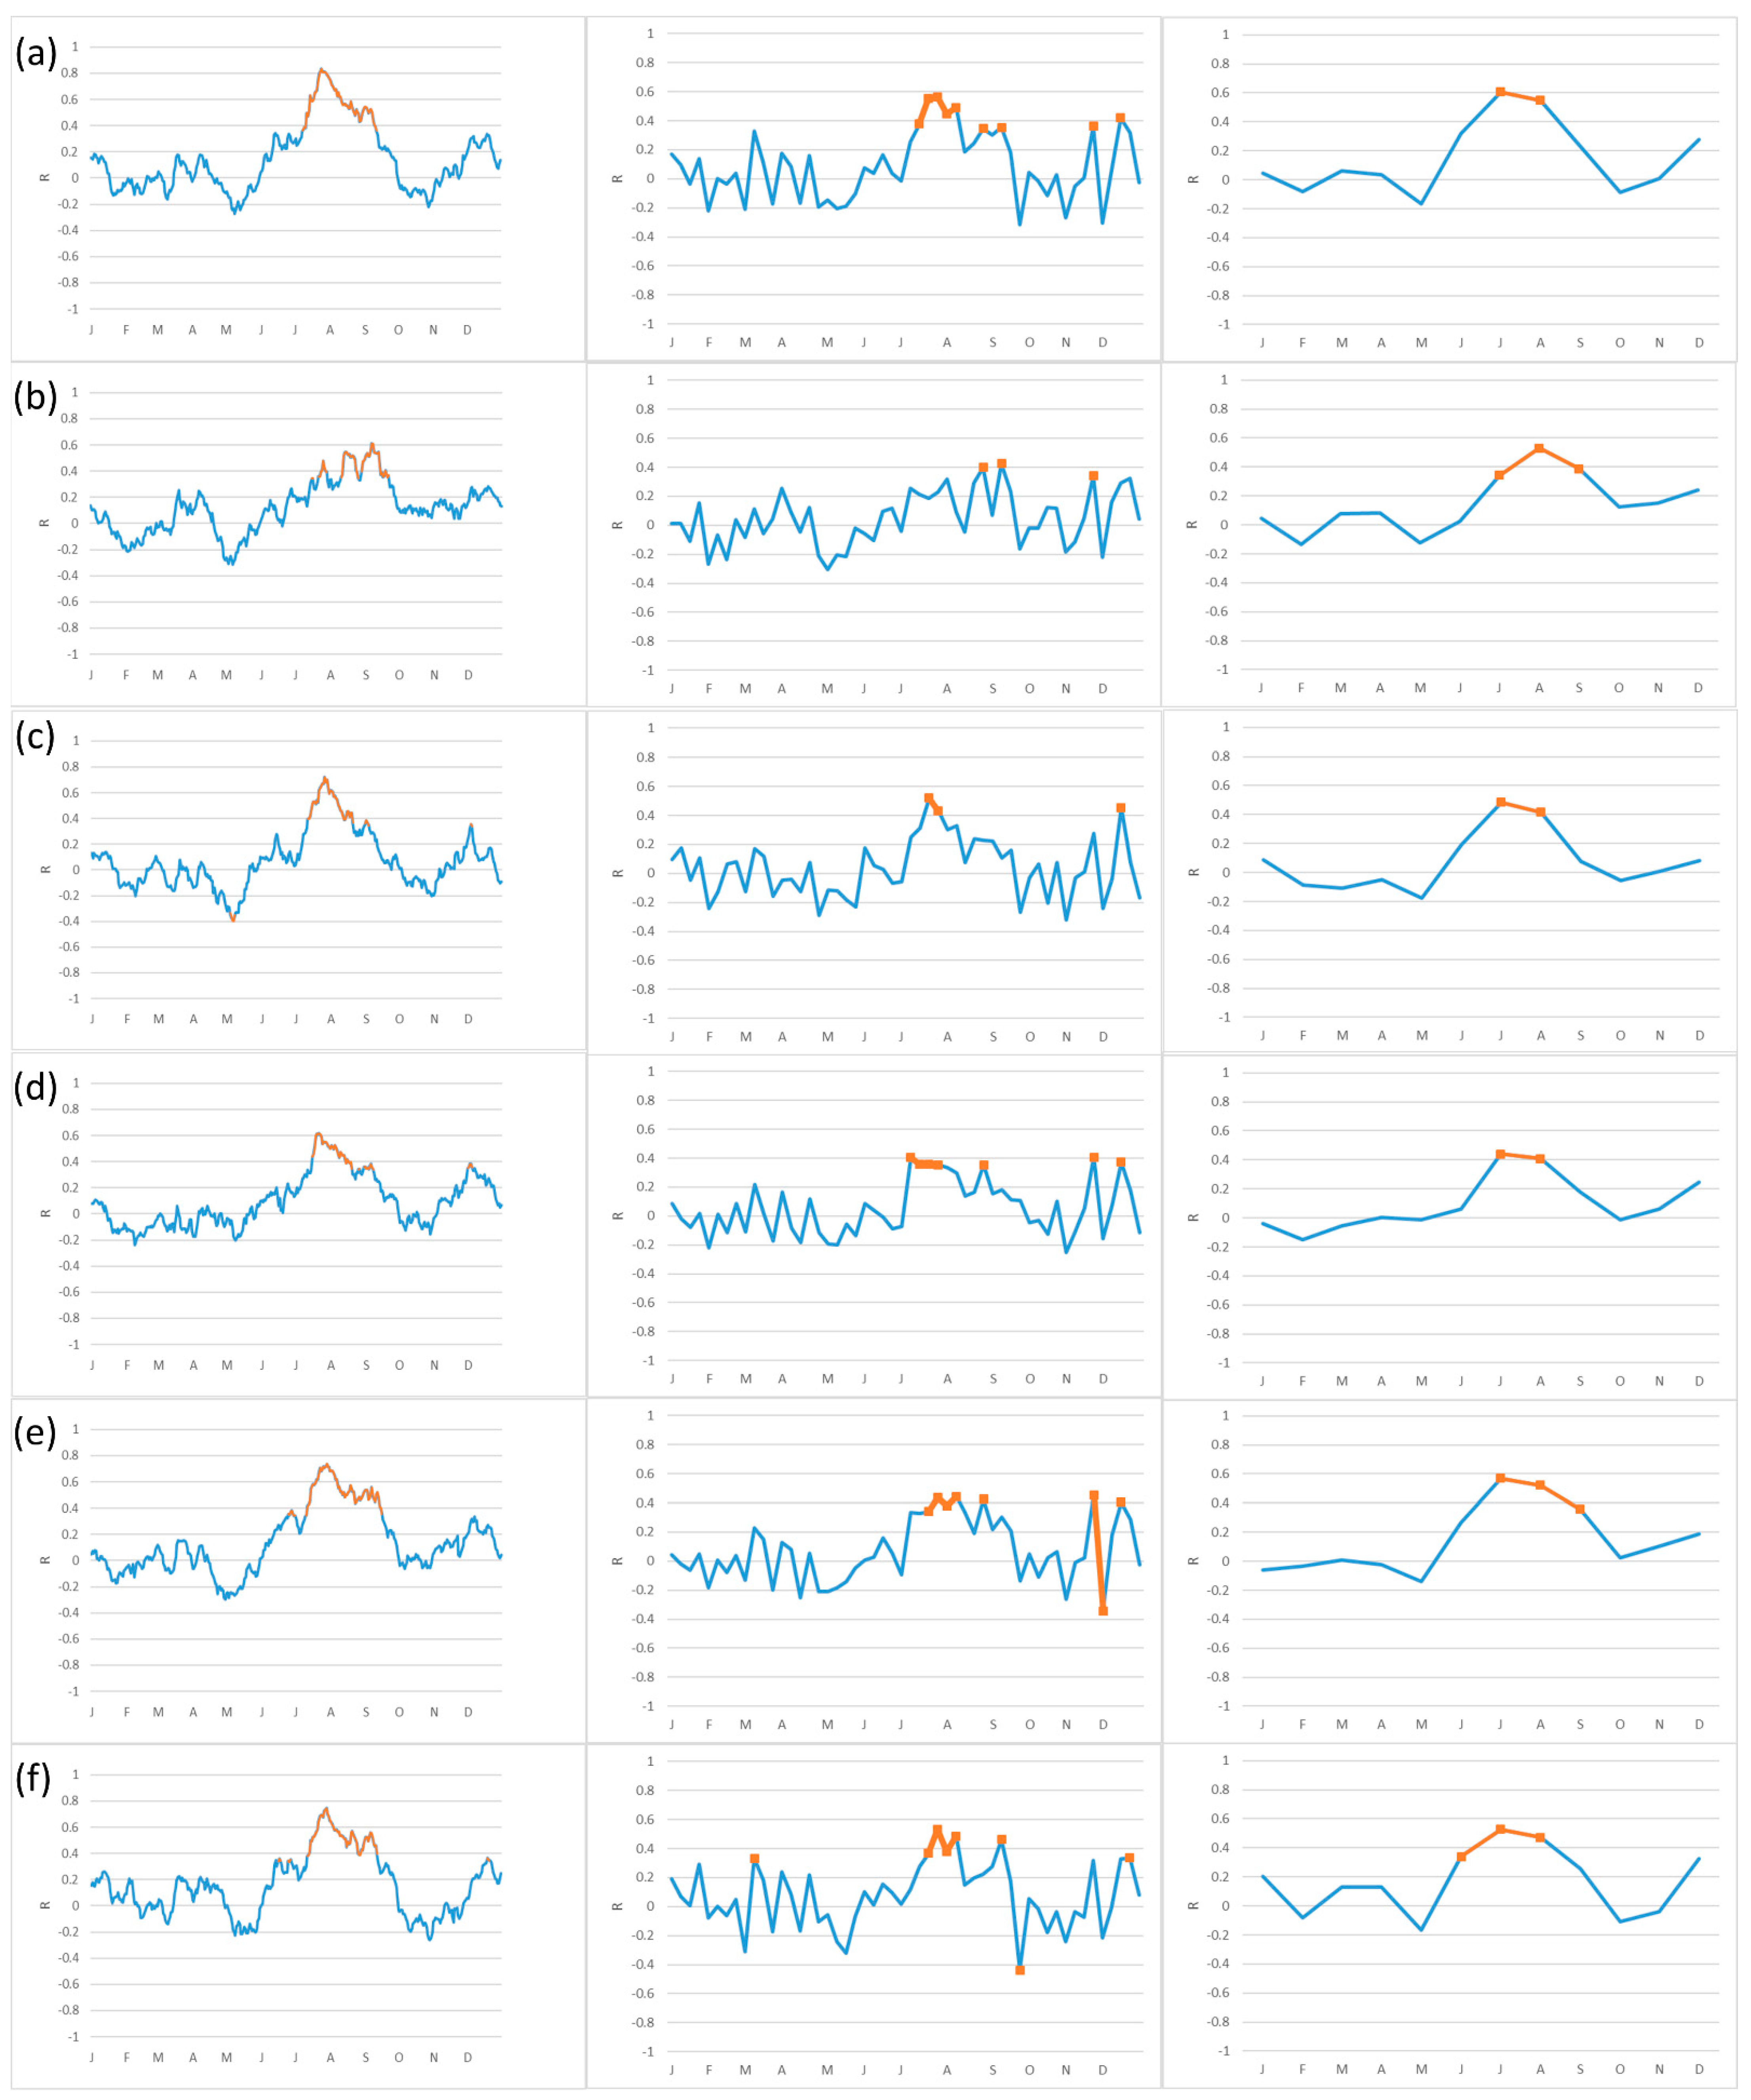
| Approach | Daily | Weekly | Monthly | |
|---|---|---|---|---|
| samples-average | Rmax | 0.83 | 0.56 | 0.60 |
| Time * | 25-July | 30 (July) | July | |
| sample-by-sample | Rmax(med) | 0.53 | 0.36 | 0.39 |
| % | 91.4 | 61.7 | 78.9 | |
| Time * | 29-July | 30 (July) | July |
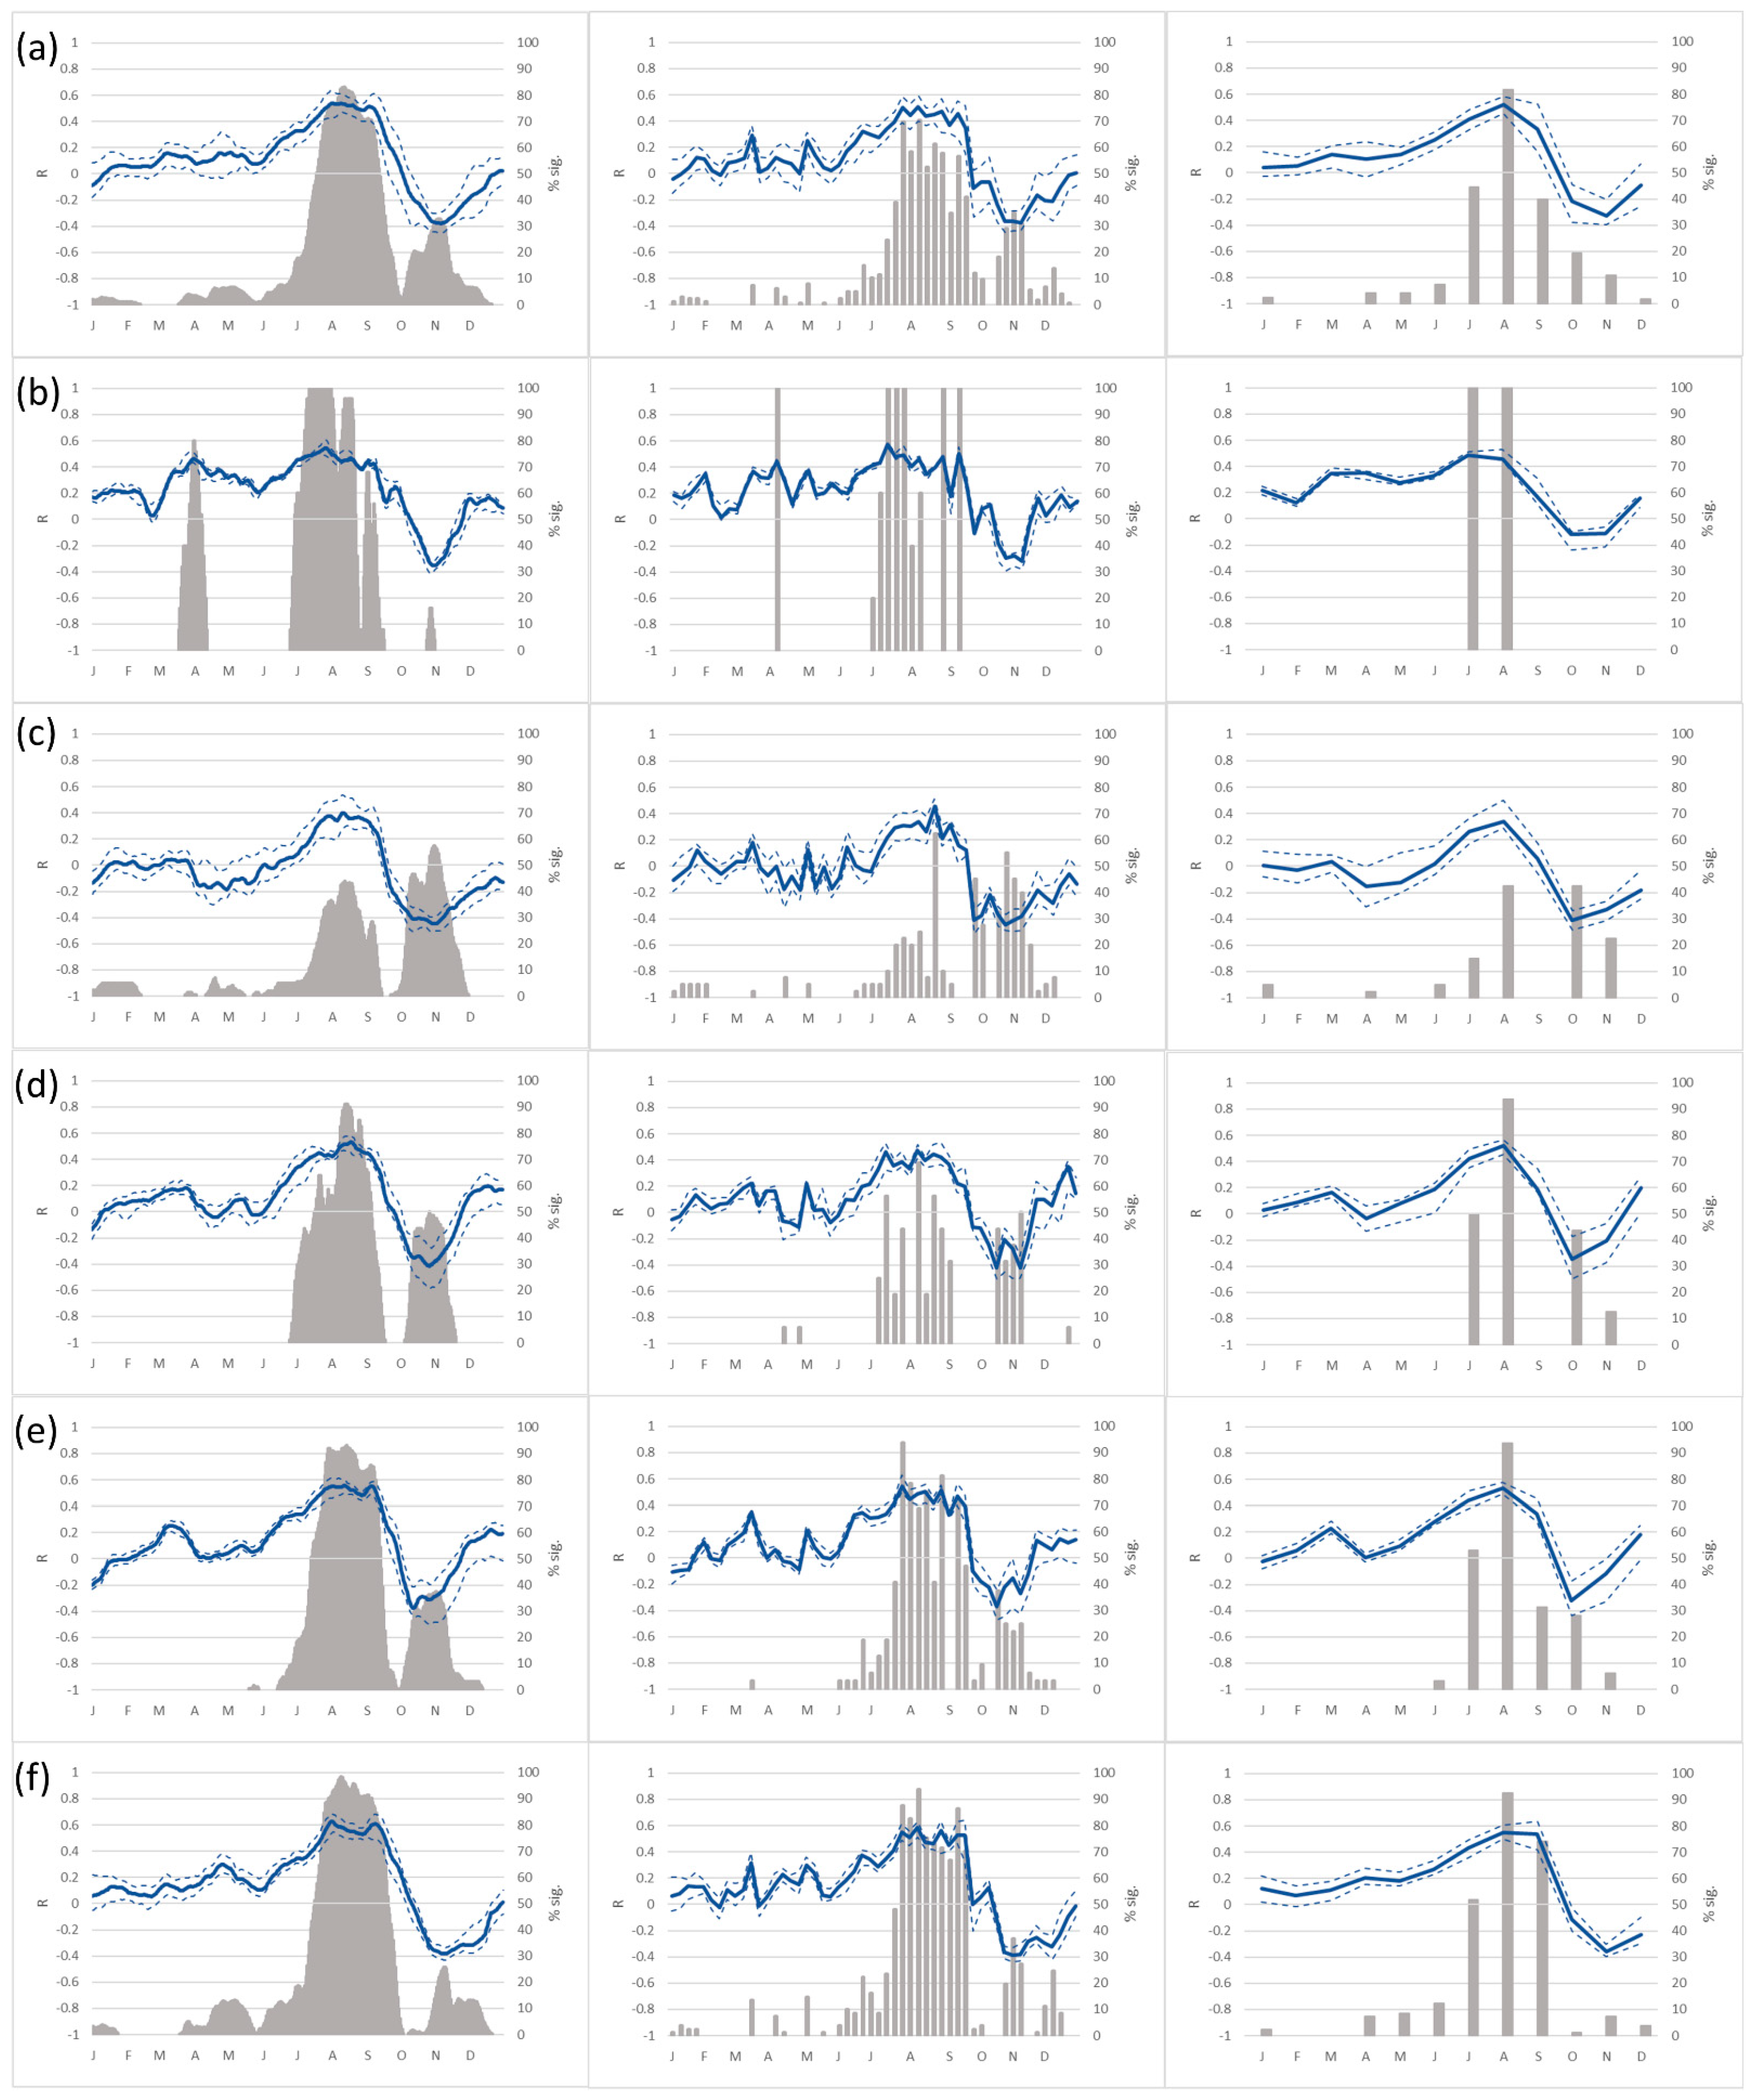
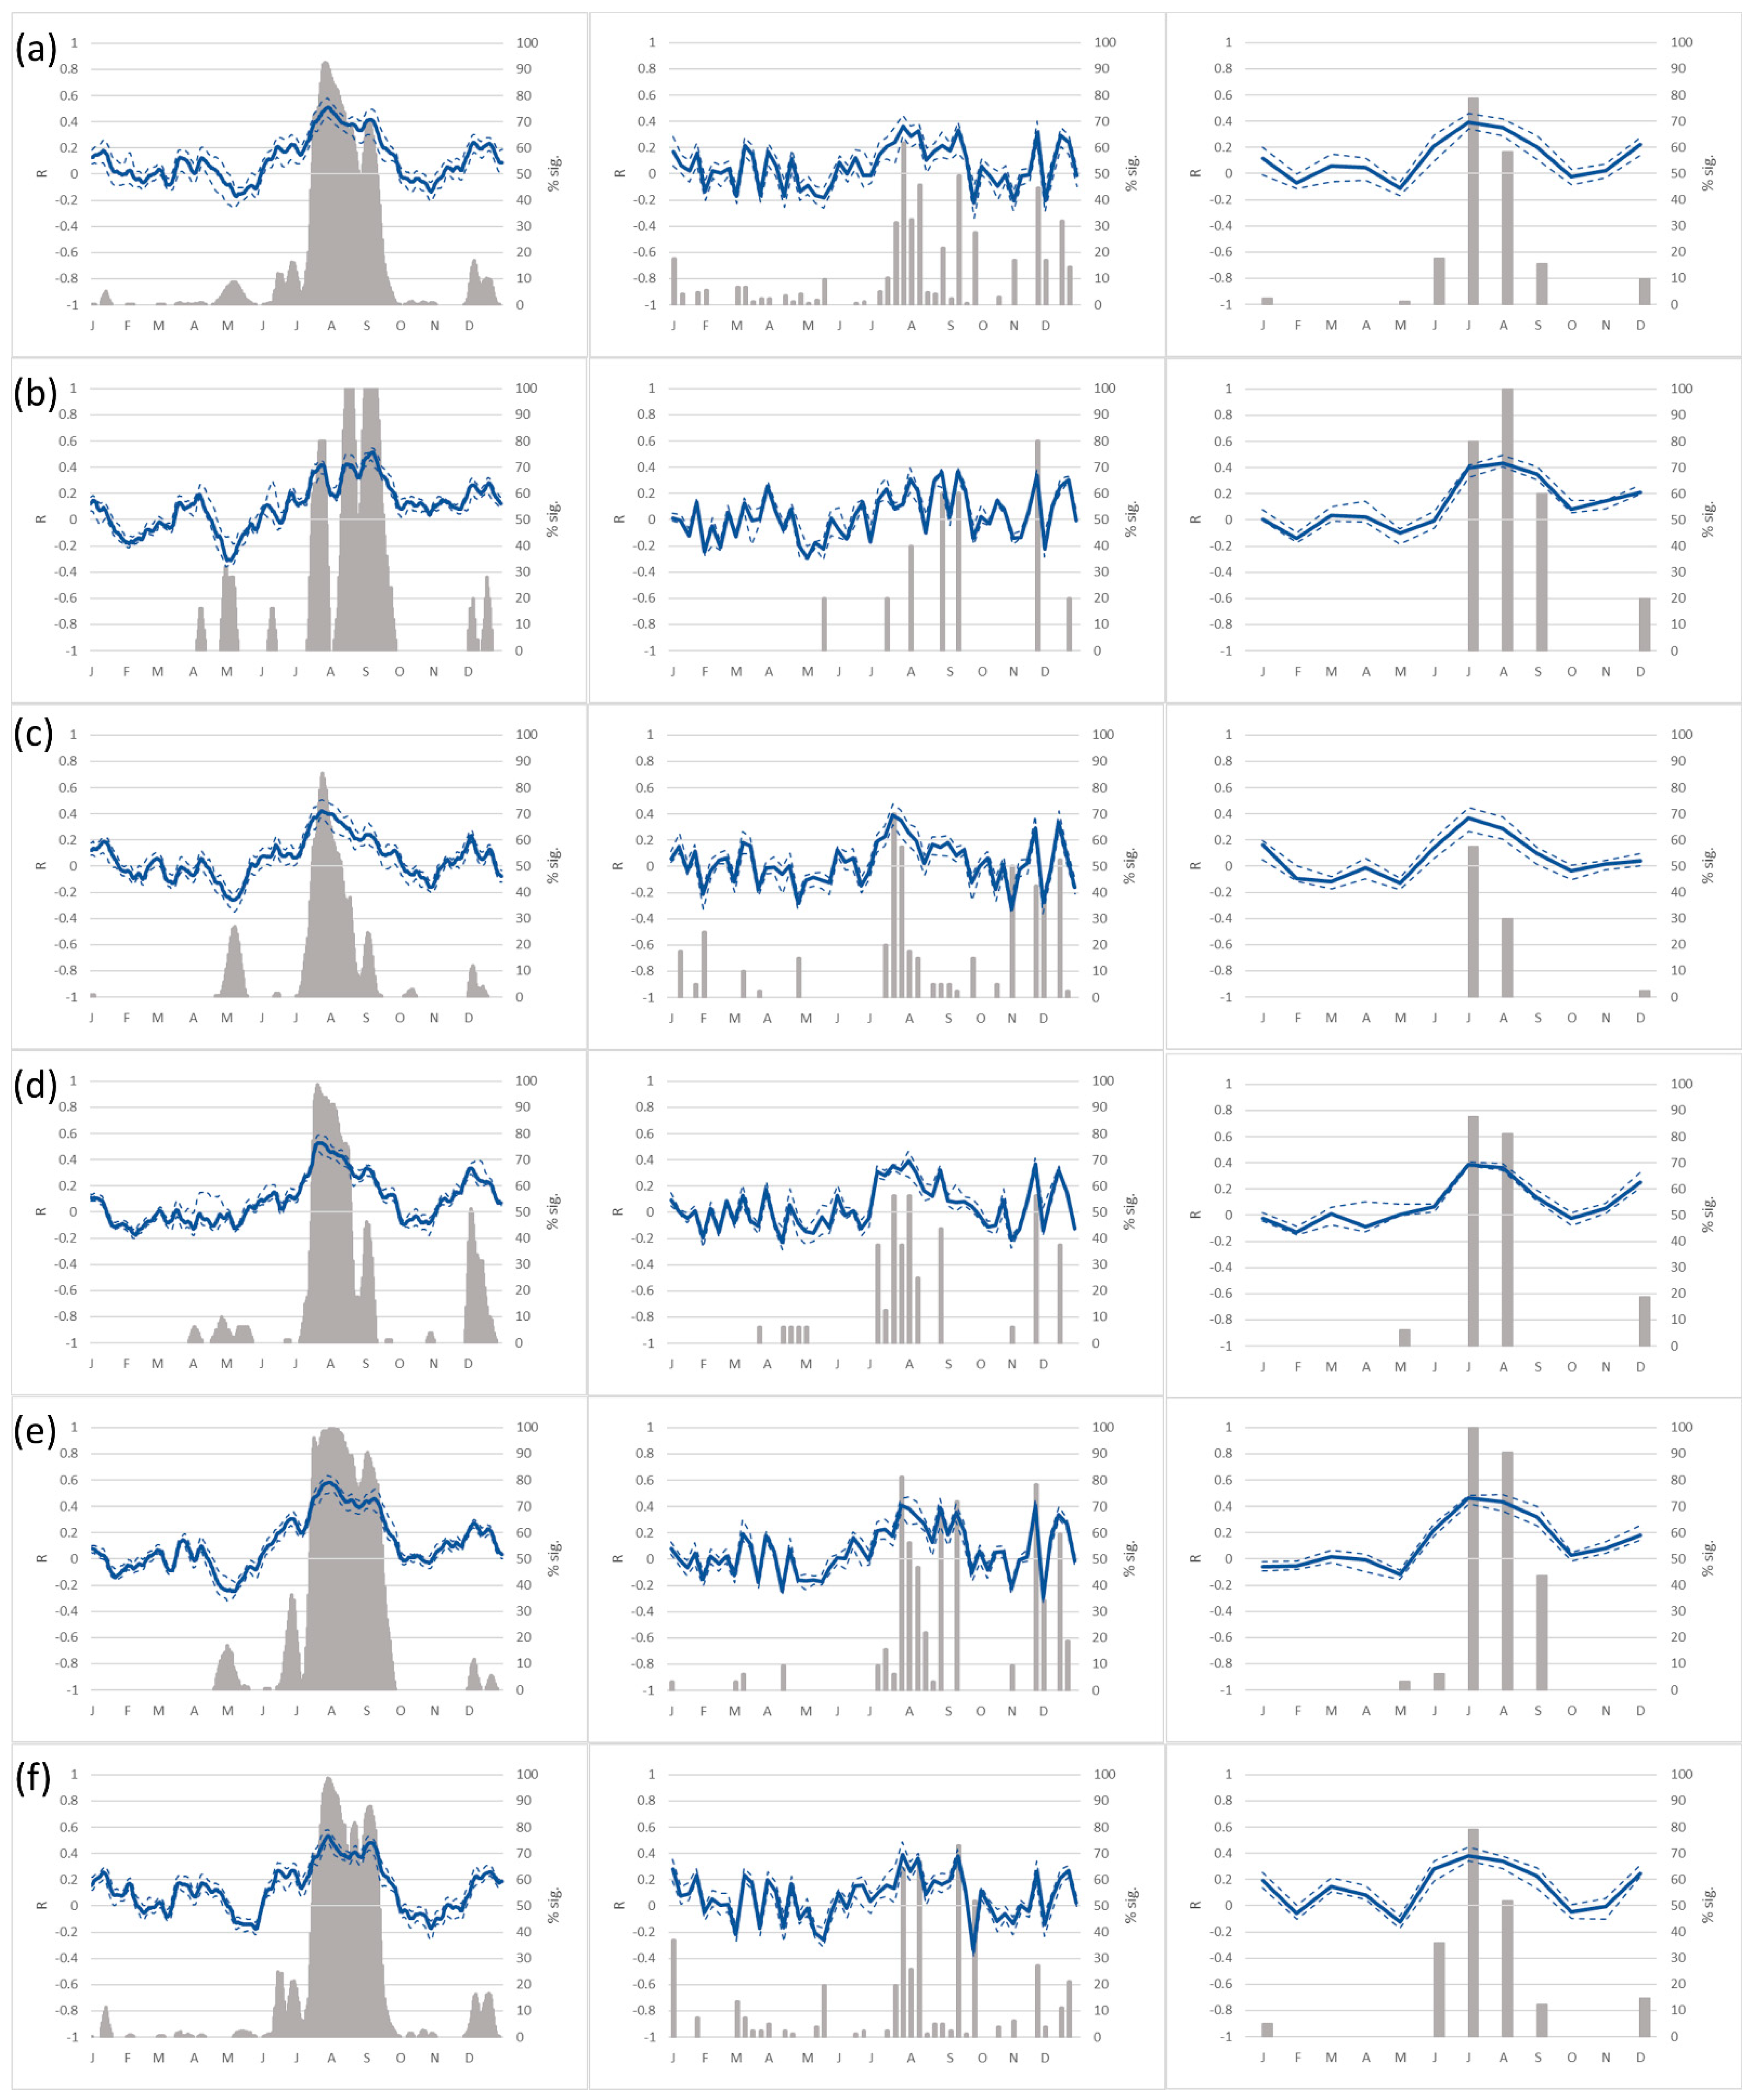
| Critical Summer Period | R Max. | Date | Delay (Days) | ||
|---|---|---|---|---|---|
| Iberian Peninsula | SM | 8 July–17 Sepember | 0.85 | 29 July | +6 |
| P | 14 June–12 September | 0.76 | 23 July | ||
| Betic Range | SM | 28 June–8 September | 0.63 | 24 July | −28 |
| P | 16 July–22 September | 0.63 | 21 August | ||
| Pyrenees | SM | 7 August–4 September | 0.85 | 25 July | +5 |
| P | 12 July–1 September | 0.68 | 20 July | ||
| North Iberian Range | SM | 10 July–11 September | 0.76 | 23 July | +8 |
| P | 08 July–8 September | 0.69 | 15 July | ||
| Center Iberian Range | SM | 12 July–13 September | 0.77 | 11 August | +18 |
| P | 25 June–10 September | 0.72 | 24 July | ||
| South Iberian Range | SM | 8 July–22 September | 0.79 | 1 August | +14 |
| P | 14 June–12 September | 0.76 | 28 July | ||
Publisher’s Note: MDPI stays neutral with regard to jurisdictional claims in published maps and institutional affiliations. |
© 2022 by the authors. Licensee MDPI, Basel, Switzerland. This article is an open access article distributed under the terms and conditions of the Creative Commons Attribution (CC BY) license (https://creativecommons.org/licenses/by/4.0/).
Share and Cite
González-Zamora, Á.; García-Barreda, S.; Martínez-Fernández, J.; Almendra-Martín, L.; Gaona, J.; Benito-Verdugo, P. Soil Moisture and Black Truffle Production Variability in the Iberian Peninsula. Forests 2022, 13, 819. https://doi.org/10.3390/f13060819
González-Zamora Á, García-Barreda S, Martínez-Fernández J, Almendra-Martín L, Gaona J, Benito-Verdugo P. Soil Moisture and Black Truffle Production Variability in the Iberian Peninsula. Forests. 2022; 13(6):819. https://doi.org/10.3390/f13060819
Chicago/Turabian StyleGonzález-Zamora, Ángel, Sergi García-Barreda, José Martínez-Fernández, Laura Almendra-Martín, Jaime Gaona, and Pilar Benito-Verdugo. 2022. "Soil Moisture and Black Truffle Production Variability in the Iberian Peninsula" Forests 13, no. 6: 819. https://doi.org/10.3390/f13060819
APA StyleGonzález-Zamora, Á., García-Barreda, S., Martínez-Fernández, J., Almendra-Martín, L., Gaona, J., & Benito-Verdugo, P. (2022). Soil Moisture and Black Truffle Production Variability in the Iberian Peninsula. Forests, 13(6), 819. https://doi.org/10.3390/f13060819