Article

Analysis of Tree Species Suitability for Plantation Forests in Beijing (China) Using an Optimal Random Forest Algorithm

1
Precision Forestry Key Laboratory of Beijing, Beijing Forestry University, Beijing 100083, China
2
Key Laboratory of Genetics and Germplasm Innovation of Tropical Special Forest Trees and Ornamental Plants, Ministry of Education, School of Forestry, Hainan University, Haikou 570228, China
3
School of Science, University of New South Wales, Canberra, ACT 2612, Australia
*
Author to whom correspondence should be addressed.
Forests 2022, 13(6), 820; https://doi.org/10.3390/f13060820
Submission received: 14 April 2022 / Revised: 15 May 2022 / Accepted: 23 May 2022 / Published: 25 May 2022
(This article belongs to the Section Forest Ecology and Management)

Abstract

:
For afforestation, it is necessary to consider habitat conditions and their impact on specific tree species, in order to enable the selection of appropriate species to improve forest productivity and stand stability. Based on the 2014 Beijing forest management inventory data, we evaluated site quality using theoretical growth equations and quantile regression; we analyzed the effects of climate, topography, and soil variables on the growth of six main tree species using random forest models optimized by a genetic algorithm; and we mapped the potential habitat of six main tree species in Beijing. The results showed that climatic factors were the most important factors affecting tree growth. The prediction models had good accuracy, with an AUC of 0.75–0.85. Among the six main tree species studied, Pinus tabulaeformis Carr. was suitable for all of Beijing’s forest land. Platycladus orientalis (Linn.) Franco, Robinia pseudoacacia Linn. and Salix matsudana Koidz. were suitable for the mountainous areas, while Sophora japonica Linn. and Populus tomentosa Carr. were suitable for planting in the plains area of southeast Beijing. The optimized random forest model applied in this study gives insight into the distribution suitability of the main tree species in Beijing, and could serve as a reference for afforestation design.

1. Introduction

Forests are ecosystems with rich biodiversity [1,2] and they play an important role in soil and water conservation, climate regulation, and carbon cycling [3,4]. Tree species suitability refers to the adaptation of the growth characteristics of tree species to site conditions, so that high productivity levels can be achieved under the existing site conditions [5,6]. With the increased afforestation in recent years, the number of planted forests has continued to proliferate and, like natural forests, they deliver great potential to provide a wide range of goods and ecosystem services [7,8,9,10]. However, in some areas, the productivity of planted forests is relatively low due to the unscientific selection of plantation species and unreasonable plantation densities [11]. Moreover, the overall plan for Beijing presents a demand for further afforestation, and this requires insight into the suitability of land and trees in the area.
Environmental factors such as climate, topography, soil, vegetation, and water can have a dramatic effect on forest type, function, composition, structure, and productivity [12,13,14]. Trees will grow better in a more suitable environment; therefore, the stand environment of the target area needs to be considered during afforestation, and suitable tree species need to be selected according to that environment. Tree species selection is one of the most important forest management decisions to improve forest productivity and stand stability [15], and the suitability of the land and trees are key factors in plantation management. The stand quality evaluation method can be used to judge the suitability of tree species for a plot of land, and it is an important tool to study and understand the forest growth environment and the influence of the environment on forest productivity [16]. For stand quality evaluation on forested sites, a model is usually constructed using the relationship between the stand height or mean height of dominant trees, and age, which is usually considered to be independent of stand density [17,18,19]. For non-forested stand quality evaluation, only the correlated factors for forested stands can be used to determine stand suitability [17,20,21].
In the study of stand quality–stand environmental factors, correlation analysis [22], linear regression [23,24], mixed-effects modelling [25], generalized linear modelling [26], and discriminant analysis [27] are the methods usually applied at present. Linear regression is widely used, but non-parametric and machine learning methods are also often used to simulate typical nonlinear relationships.
The random forest model has been successfully applied to many fields [28]; it can effectively deal with nonlinearities, interactions, and cointegration, and it effectively avoids overfitting. It can be used not only for regression, classification, and prediction, but also for the measurement of important variables. However, the random forest model faces the problem of appropriate parameter selection. If the selection of features is completely randomized, it will lead to the more important attributes being filtered out, eventually causing a model underfitting problem. This study was based on using genetic algorithms to search for parameter combinations in order to obtain optimal classification and prediction results from the random forest algorithm.
The stand height–age relationship model has little association with density [17], so we assumed that the same tree species would have similar height and growth processes in the same environment, enabling us to extend tree growth on forested sites to all suitable sites. We hypothesized that the most influential factors on tree suitability distribution in Beijing are temperature and precipitation, that these have a positive effect on tree growth, and that they further combine with other factors to influence the distribution of tree species in Beijing’s suitability zones. In this study, we used an optimized random forest algorithm to analyze the relationship between tree species suitability and stand factors using six main tree species (Platycladus orientalis (Linn.) Franco, Robinia pseudoacacia Linn., Sophora japonica Linn., Salix matsudana Koidz., Populus tomentosa Carr., and Pinus tabulaeformis Carr.), with the plantation types chosen from the 2014 Beijing forest management inventory data. The specific objectives were: (1) to combine theoretical growth equations and quantile regression for stand quality evaluation; (2) to analyze the effects of stand and climatic conditions on the study tree species; and (3) to predict the suitability zones for the study tree species within Beijing.

2. Materials and Methods

2.1. Data Collection

The study area was Beijing, centered at 116°20′ E and 39°56′ N (Figure 1). It has a temperate continental monsoon climate with hot and rainy summers, cold and dry winters, and short spring and autumn seasons. There are significant differences in topography between the different regions of Beijing, with higher mountainous areas in the northwest and plains in the southeast.
The technical framework diagram for this study is shown in Figure 2.
The data used in this study were obtained from the Forest Management Inventory (FMI), which is a forest resources survey conducted by forest management units such as state-owned forestry bureaus (farms), nature reserves, forest parks, and county-level administrative areas. The FMI is conducted once every ten years, and its main task is to determine the species, quantity, quality, and distribution of forest, woodland, and tree resources. In the FMI, the plot is the most basic survey unit. We selected six dominant tree species, i.e., Platycladus orientalis (Linn.) Franco, Pinus tabulaeformis Carr., Robinia pseudoacacia Linn., Sophora japonica Linn., Salix matsudana Koidz., and Populus tomentosa Carr. from the 2014 Beijing Forest Management Inventory data. The sample size for each tree species is shown in Table 1, with a total of 35,742 plots.

2.2. Data Preprocessing

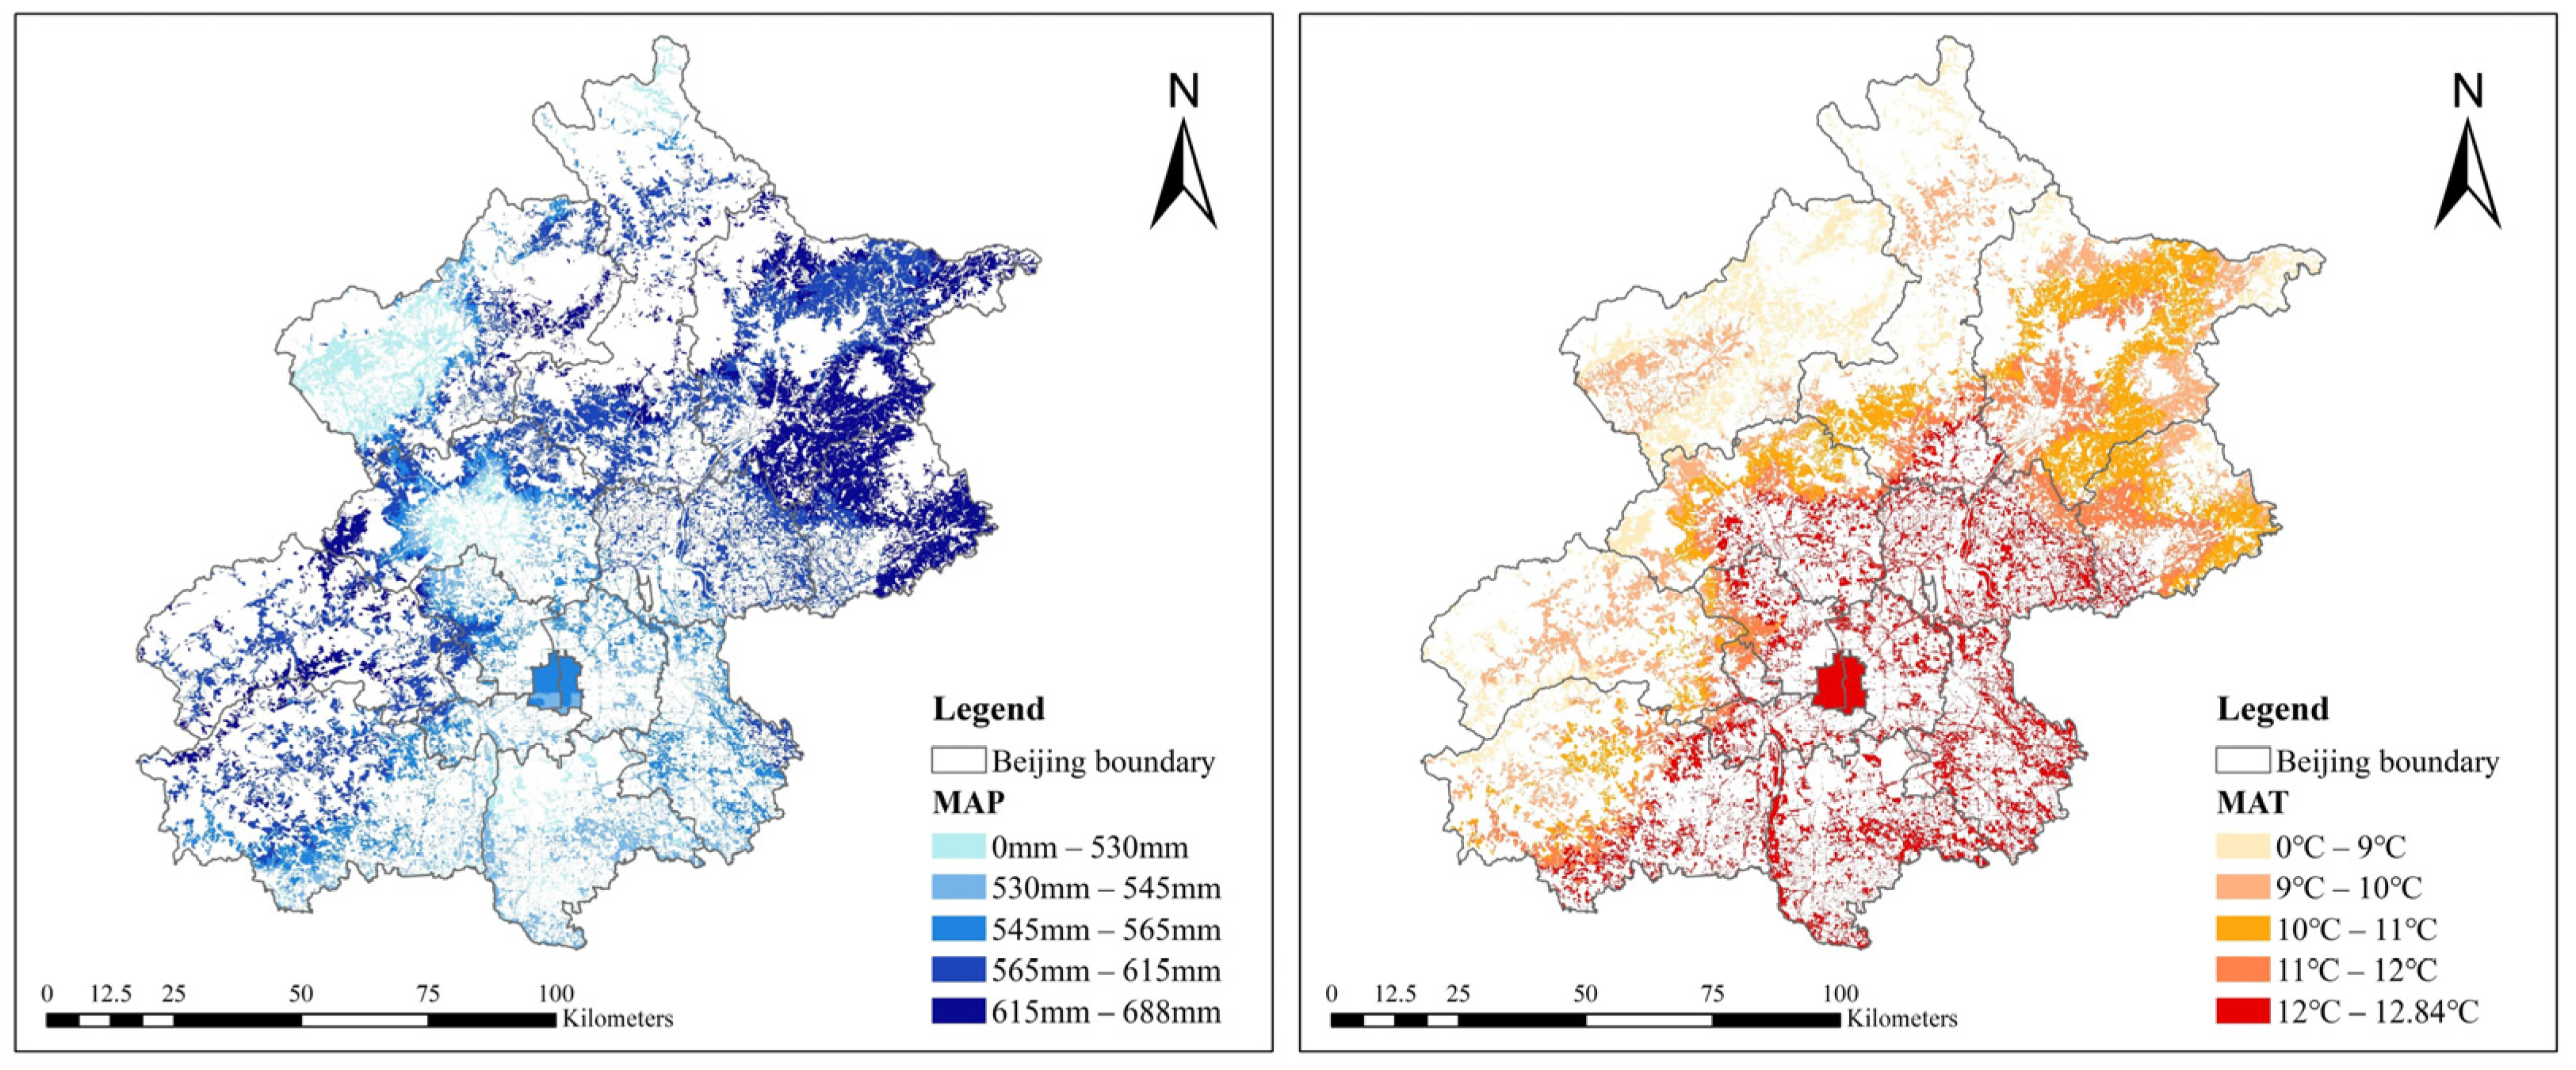
2.2.1. Independent Variables

From the FMI and climatic data, we selected 16 environmental factors as independent variables, including six climatic factors, five topographic factors, and five edaphic factors (Table 2).
Climatic data were referenced from an open access software package, ClimateAP, developed by Wang et al. [29]. We extracted the annual meteorological data for a total of 35 years, from 1980 to 2014, based on the latitude, longitude, and elevation coordinate information of each plot in the FMI, and we averaged them for use as the meteorological factors in the calculation.
There were some categorical variables in the data: slope aspect and slope position, which were classified according to Table 3; and soil type and landform, which were classified using FMI data codes.

2.2.2. Dependent Variable—Site Quality Evaluation

According to our hypothesis, the same tree species will have a similar tree height growth process under the same stand conditions and stand type, i.e., at the same age, a taller tree height indicates a more suitable stand environment for tree growth in the sample site. We combined theoretical growth equations and quantile regression to quantify the process for the evaluation of stand quality. The age–height theoretical growth equation was used to classify stand suitability into three categories: most suitable, suitable, and unsuitable, and these three categories were used as dependent variables in the random forest model.
Theoretical growth equations have shown good simulation performance when applied to studies of tree growth volume in the field, and are commonly used to describe the various patterns of tree height, diameter at breast height, and stand index curves of tree species [30]. The quantile regression (QR) method, proposed by Koenker et al. in 1978 [31,32], has the advantage over the mean regression method in that it can describe the conditional probability distribution of the dependent variable at any quantile, and therefore, it can extract more information from the data and provide a more comprehensive analysis of the relationship between tree age and tree height [33,34]. Stand index can be used to describe the strength of the relationship between tree height and age in same-age stands [5,35], and in this study, the tree height growth at different ages was converted to the same-age case using the QR method for stand quality classification.
In this study, we used five theoretical growth equations (Table 4) to fit the mean age and mean height of the stand, respectively. We filtered the optimal equation using the Akaike information criterion (AIC) to obtain two quantile regression lines at the one-third and two-thirds quantile positions; thus, we divided the data for each tree species into three equal parts. The tree height data above the two-thirds regression line were the considered to be the best, the data between the two regression lines were the second best, and the data below the one-third regression line were considered to be the worst. These three data sets were defined as three categories: most suitable, suitable, and unsuitable, respectively.

2.3. Model

We used an optimized random forest model to study the relationship between stand environment and tree height growth, and to study the degree of influence of environmental factors for six main tree species in Beijing, with 16 environmental factors as independent variables and three categories of stand quality as dependent variables. Random forest modelling is an integrated learning technique derived from classification or regression trees (CARTs), which has high prediction accuracy, a high tolerance for outliers and “noise”, performs well even when some variables are moderately co-linear, and is not easily overfitted [36,37,38]. In addition, the random forest model has the function of evaluating the importance of features. In this paper, the Gini coefficient was chosen as a measure.
G i n i t = 1 i = 0 c 1 p i | t 2
where t represents the given node, i represents any classification of the label, and p(i|t) represents the proportion of the label classification i on node t.
Three parameters have a significant impact on the accuracy and performance of random forest classification: the size of the tree (n_estimators), the minimum number of samples of leaf nodes (min_leaf) [39], and the number of features in the selected feature subset (max_feature) [40]. Due to the computational complexity, it is usually not possible to traverse all combinations of the parameter sequences to obtain the optimal result. Genetic algorithms use probabilistic optimization methods, which can automatically obtain and guide an optimized search space and adaptively adjust the search direction [41]. Therefore, we used genetic algorithms to search for parameter combinations in order to obtain the best classification and prediction results from the random forest algorithm. These algorithms were implemented through sklearn, a machine learning package for Python. In the random forest algorithm, usually only 63% of the data are repeatedly extracted during tree generation, and the remaining 37% of the data never appear; this is called out of bag (OOB) [42,43]. The OOB estimate is an unbiased estimate of the RF algorithm. The accuracy of OOB data is chosen as the objective function of the genetic algorithm. The number of populations was set to 500; the number of iterations, T, was set to 100; and the probability of variation, Pm, was set to 0.3. The problem solutions in this study were in binary encoding form, and each solution was divided into three segments, representing n_estimators, min_leaf, and max_feature.
It was shown that the larger the n_estimators, the more stable the random forest classification accuracy. Considering the time and space complexity, the n_estimators was set to take the value interval (0, 600). Meanwhile, the minimum sample number min_leaf of the leaf nodes was set to take the value space (1, 16), and the subset size max_feature of attribute features was (1, M), where M was the total number of initial sample attribute features. The random forest model is insensitive to collinearity among independent variables, and the model results are robust to unbalanced and missing data. Therefore, a collinearity test was not conducted in this study.
The receiver operating characteristic (ROC) curve is a coordinate pattern analysis method that uses the area under the curve (AUC) to measure the predictive ability of the optimized random forest model [44]. AUC values range from 0.5 to 1, with values close to 1 indicating relatively high accuracy, while AUC values > 0.8 usually indicate good predictive power [45]. We randomly selected 70% of the total dataset as training data for obtaining model-related parameters, and the remaining 30% was used as test data for validating the model.

3. Results

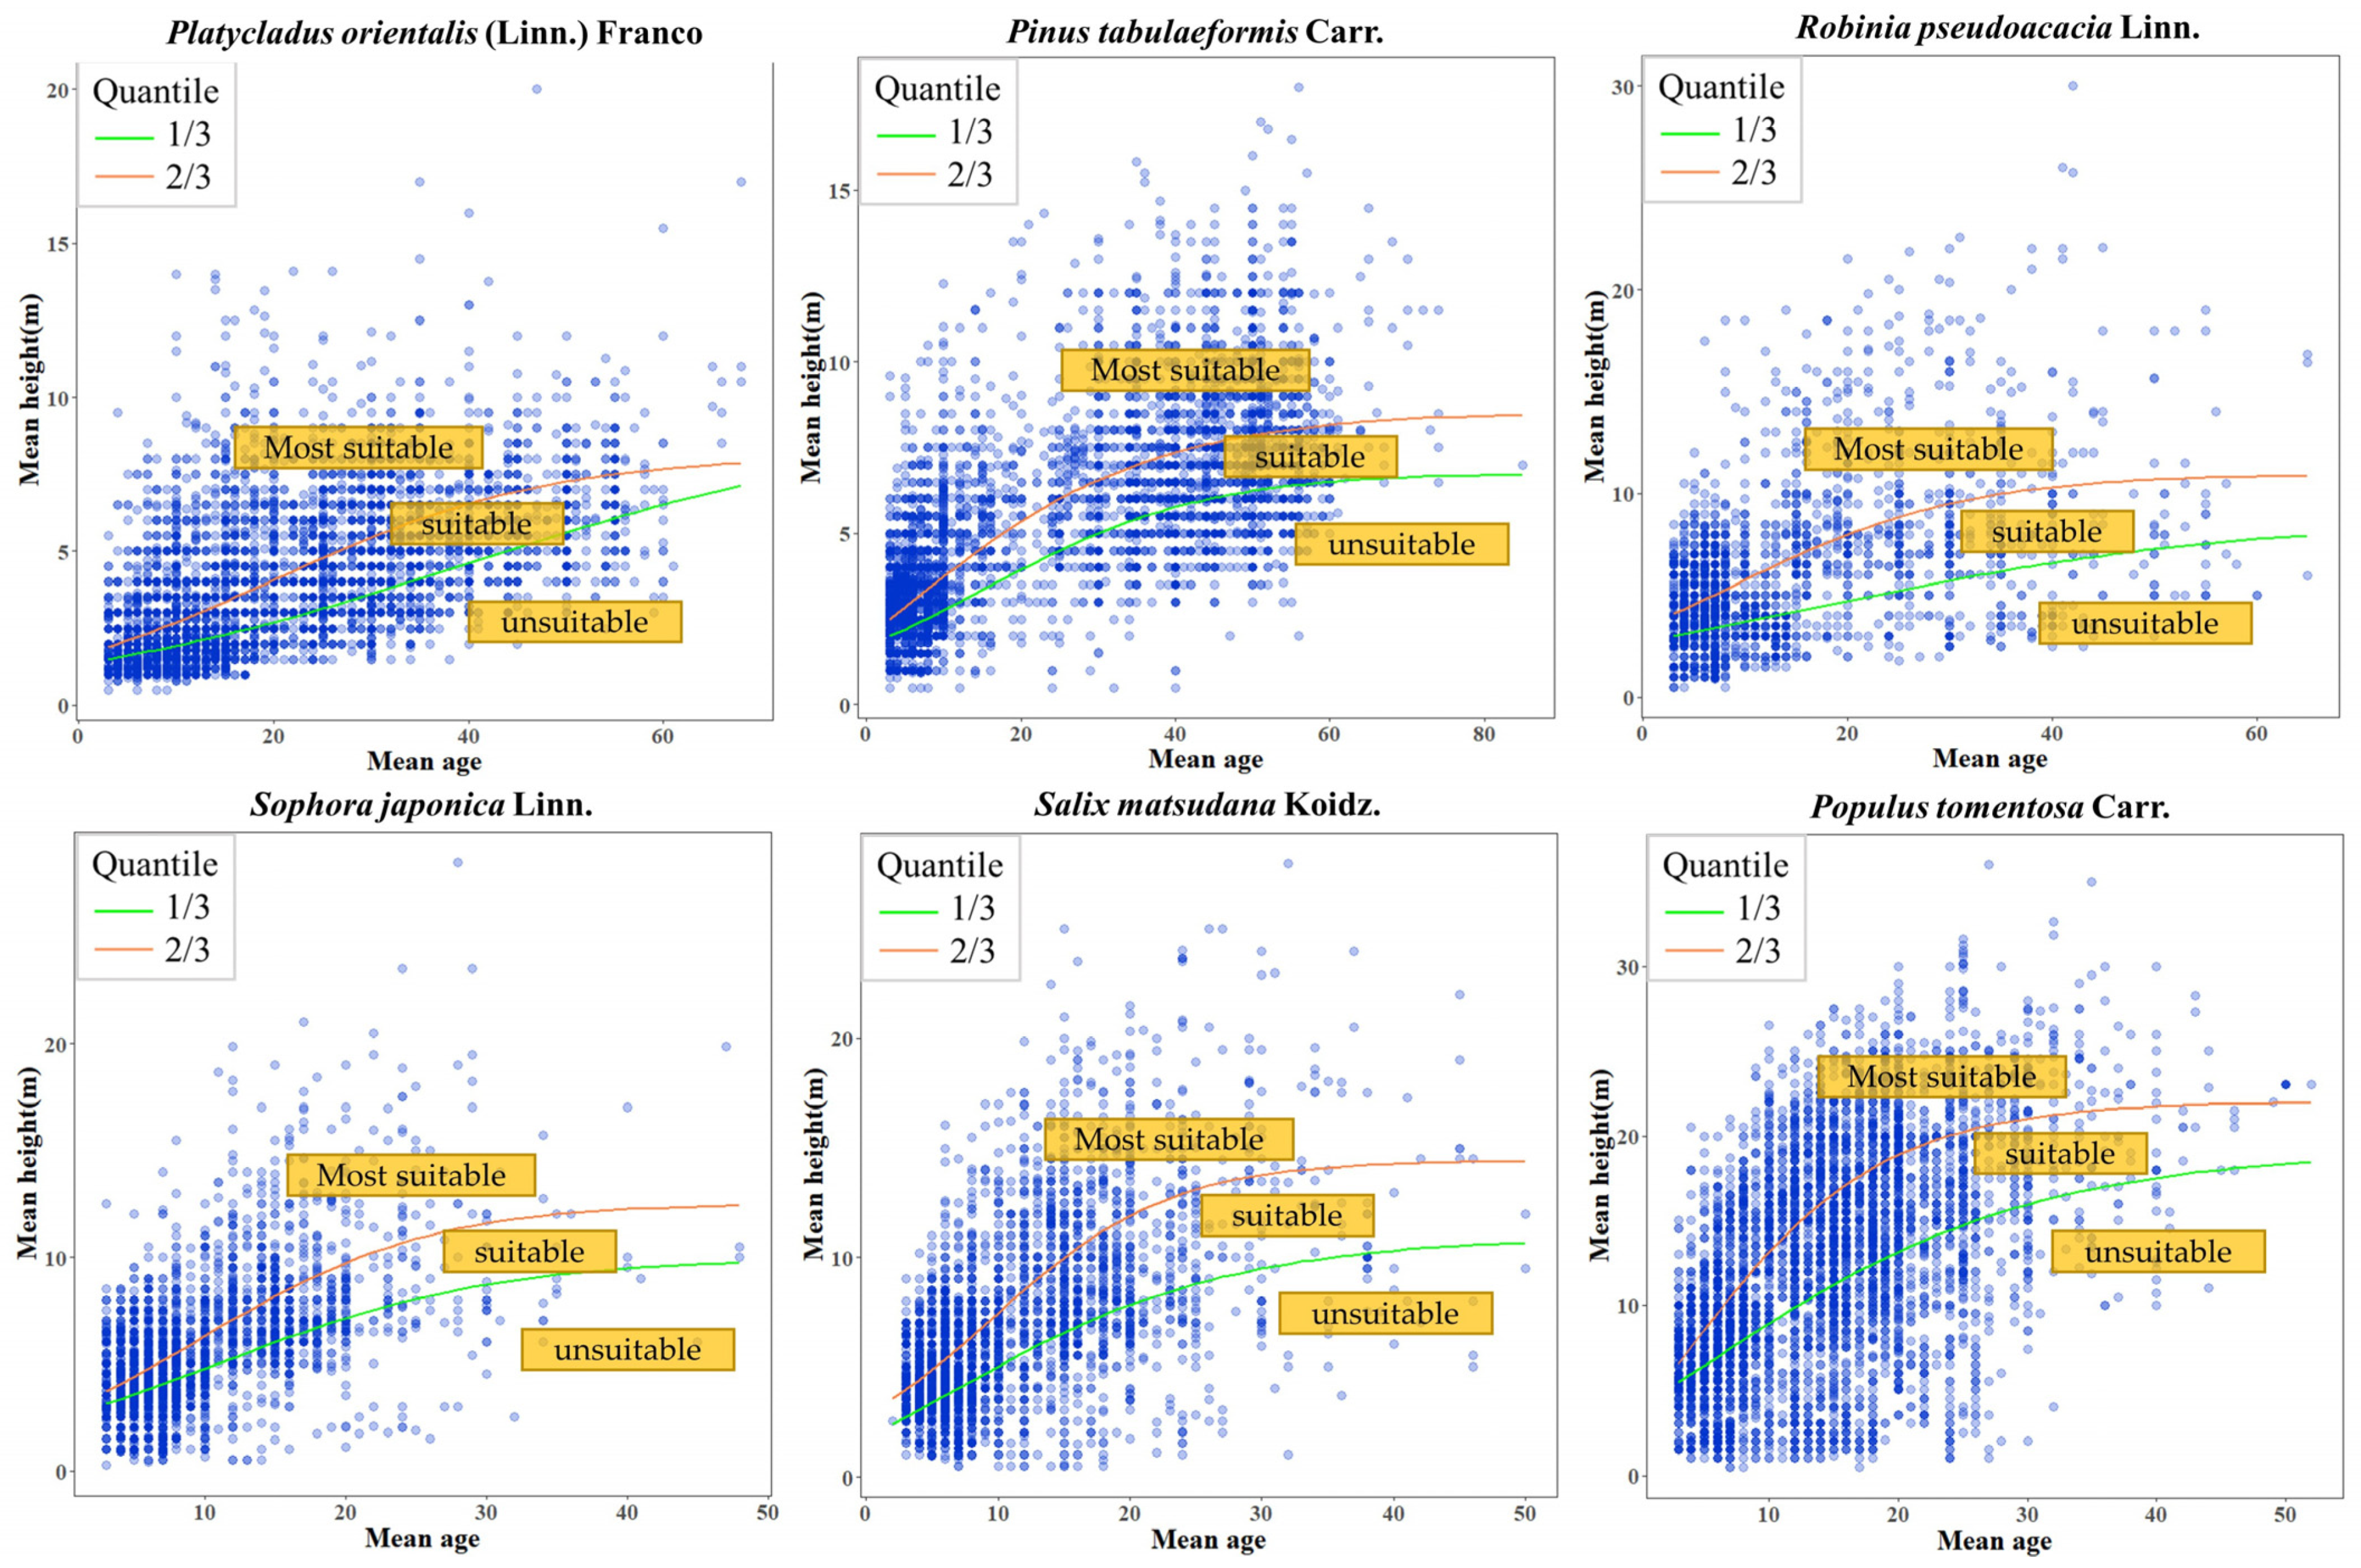
3.1. Site Quality Evaluation

The fit results at the one-third and two-thirds quantile positions, calculated by the mean age–mean tree height growth quantile method, are shown in Table 5. Filtering by the minimum AIC, the logistic model worked best for most tree species in the quantile regressions; with the Gompertz model working best for Salix matsudana Koidz. and Populus tomentosa Carr. in the one-third quantile regression line and Populus tomentosa Carr. and Pinus tabulaeformis Carr. in the two-thirds quantile regression line.
In other studies, three equations, such as the Richards, Weibull, and Logistic equations, were simulated with outstanding results [30], and this study was similar to them.
As shown in Figure 3, for the same age, sample plots with mean tree height distribution below the one-third quantile regression line showed relatively poor growth and were considered unsuitable; plots with mean tree height distribution between the one-third and two-thirds quantile regression lines indicated better growth and were considered suitable; and sample plots with mean tree height distribution above the two-thirds quantile regression line demonstrated the best growth and were considered the most suitable.

3.2. Model Verification

We evaluated the accuracy of the model using the training and test samples, and we obtained the AUC values for the suitability classification of six main tree species in Beijing plantation forests, as shown in Table 6. The AUC values ranged from 0.75 to 0.85, showing good accuracy.

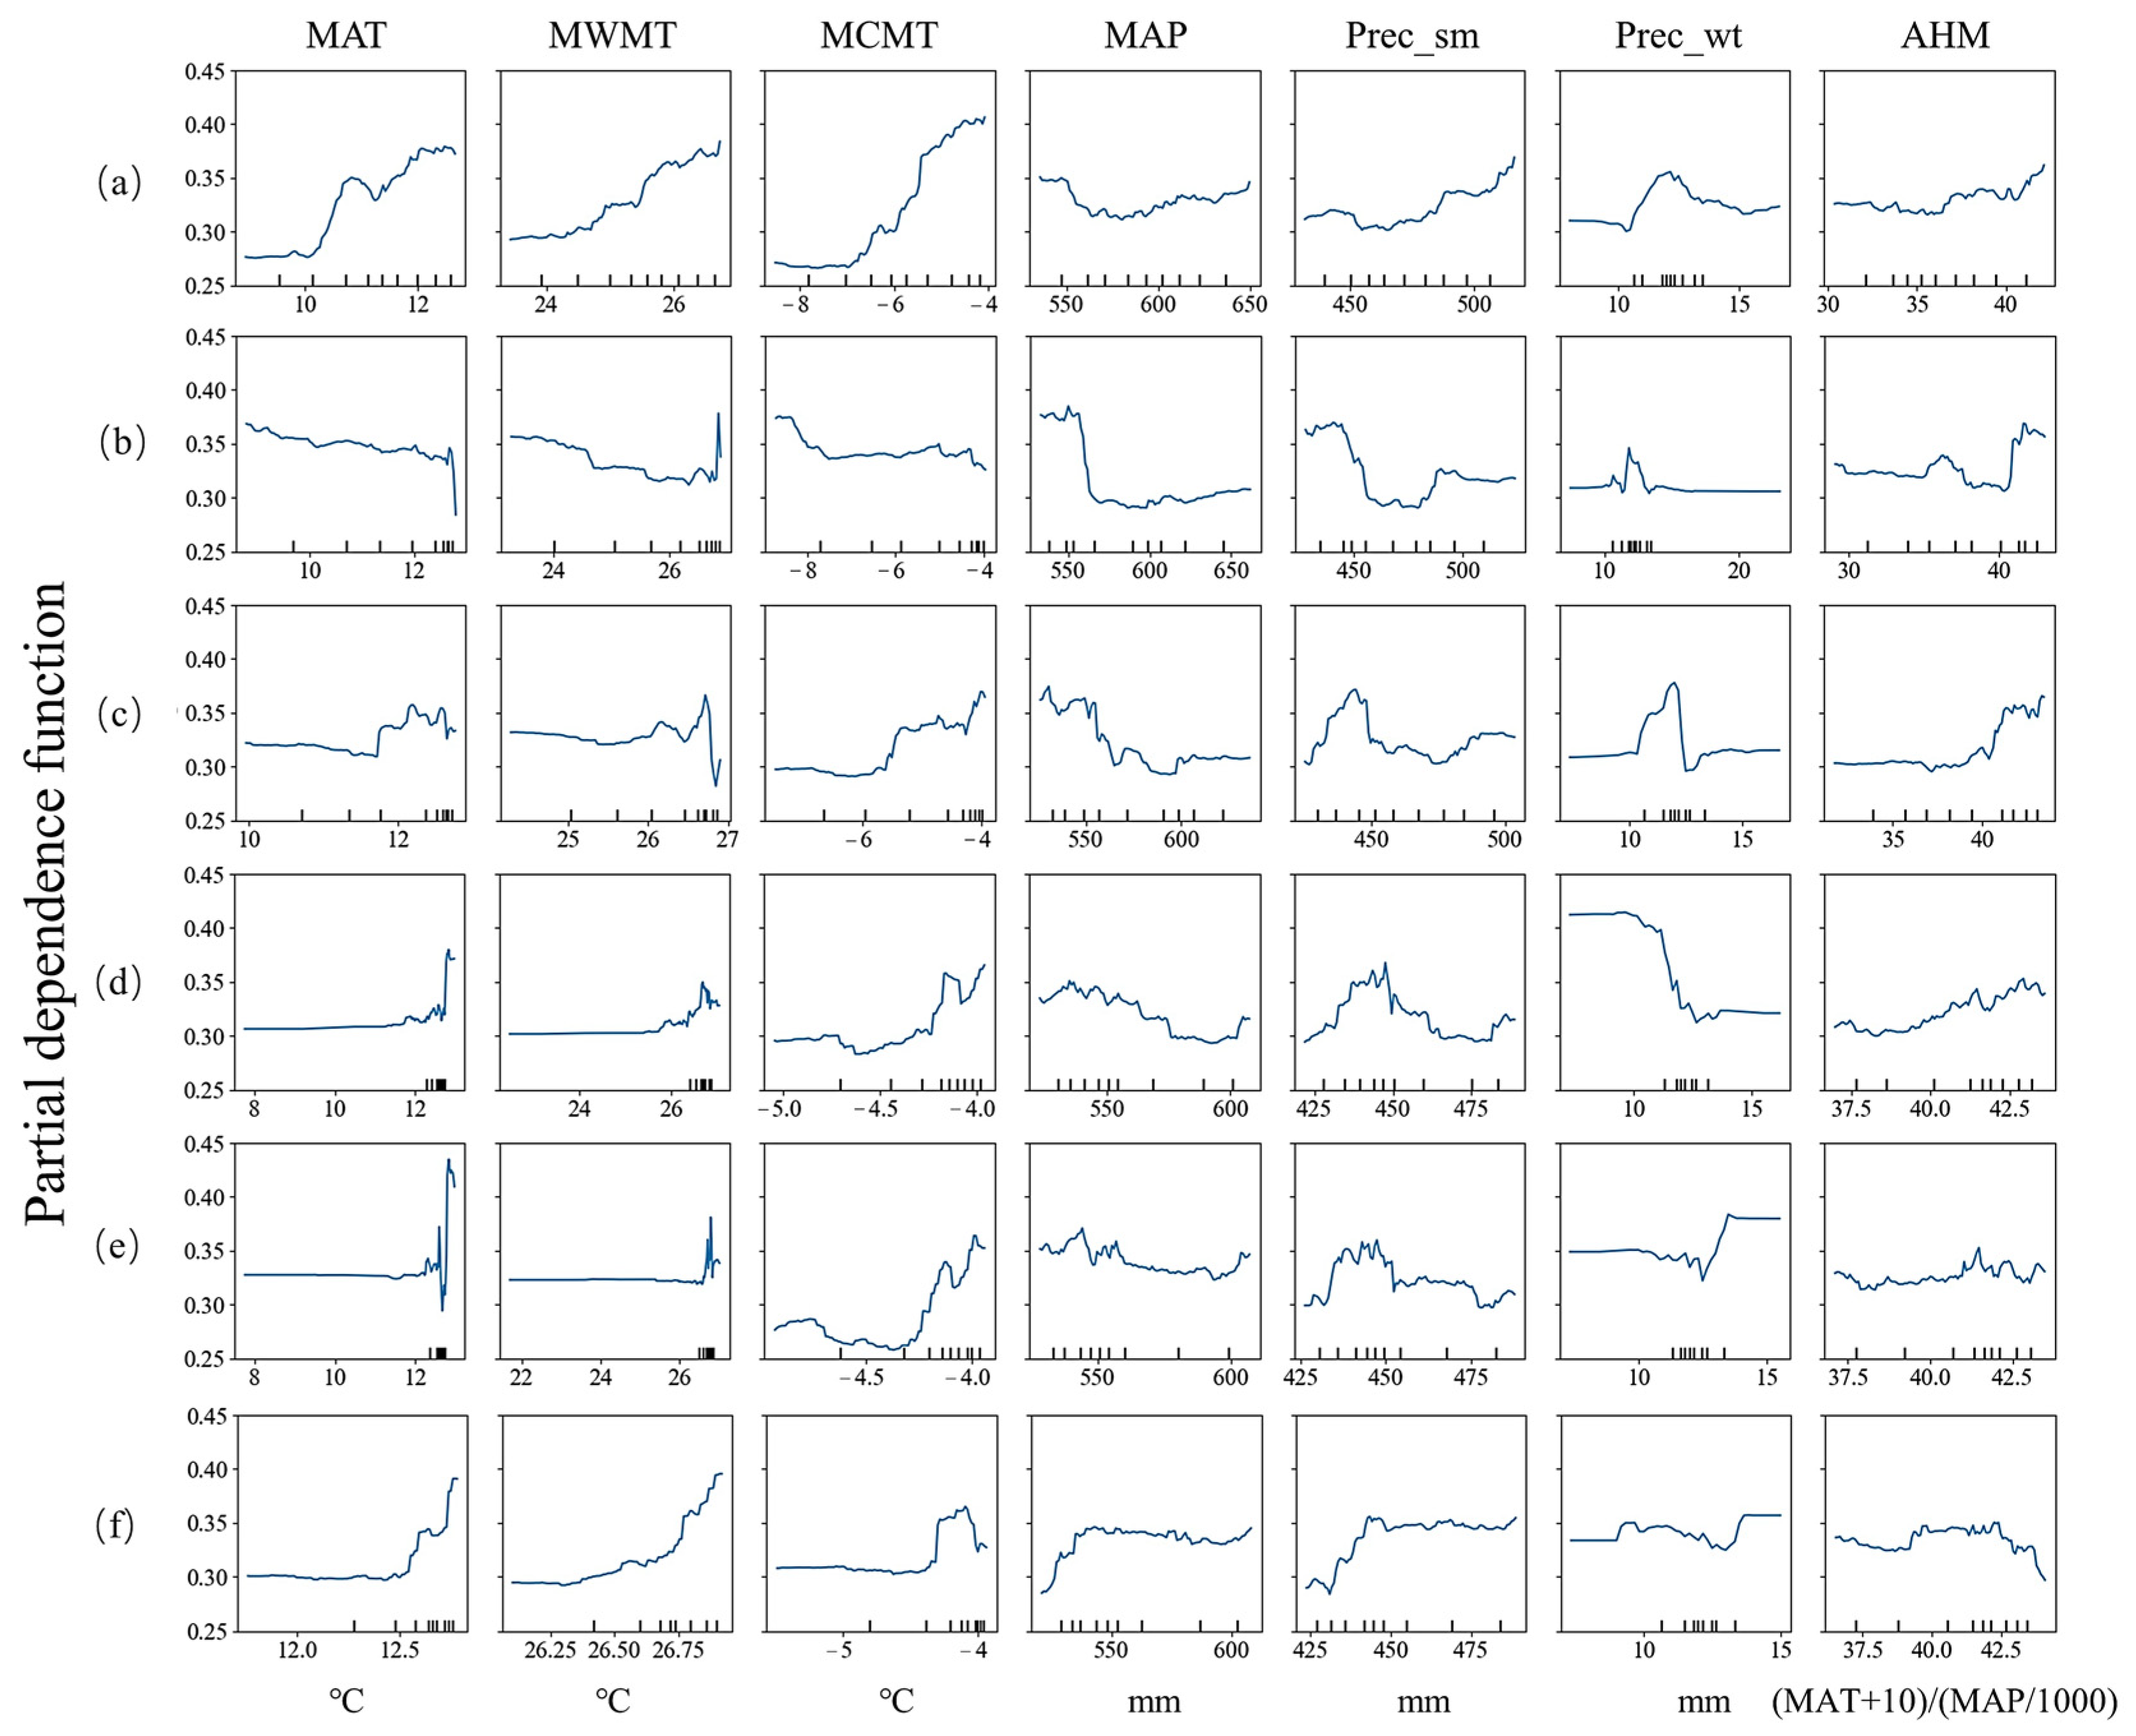
3.3. Relative Importance Analysis and Partial Dependence Plots

Figure 4 reflects the relative importance of each environmental factor on the growth of the six tree species. It can be seen that, for each species, the top six environmental factors with the highest importance account for most of the total. For Platycladus orientalis (Linn.) Franco, the top 6 environmental factors were MWMT, AHM, Prec_sm, MAT, MCMT, and MAP, which cumulatively accounted for 66.35% of the total for that species. The top six environmental factors with the highest importance for Pinus tabulaeformis Carr. were Prec_sm, MAP, AHM, MWMT, MCMT, and MAT, with 73.53% of its cumulative total. Those for Robinia pseudoacacia Linn. were MAP, AHM, Prec_sm, MCMT, MWMT, and MAT, accounting for 69.82% of the total. Those for Sophora japonica Linn. were Prec_sm, MAP, AHM, MCMT, MAT, and MWMT, adding up to 82.45% of the total. Those for Salix matsudana Koidz. were Prec_sm, MAP, AHM, MCMT, MAT, and MWMT, together contributing to 85.29% of the total, and the top six environmental factors with the highest importance for Populus tomentosa Carr. were Prec_sm, MAP, AHM, MWMT, MCMT, and MAT, cumulatively realizing 78.91% of the total.
Table 7 summarizes the relative importance of the three types of environmental factors on the growth of the tree species. It was concluded that the total contribution of climatic factors was the highest for all tree species, and far exceeded that of the remaining two factor groups. In summary, the climatic factors all influenced tree height growth in Beijing. Prec_sm, MAP, AHM were the most important variables in almost all tree species; while the topographic and edaphic factor groups each accounted for a relatively small proportion. Of these factors, slope degree, slope aspect, soil thickness, and soil type were the most important, but these factors showed differences between coniferous and broad-leaved species.
A partial dependence function can provide a useful description of the effect of selected variables on the response, incorporating the effects of other variables [46] and helping to explain the “black box” models built using advanced classification methods. We used partial dependence plots (PDP) to show the nature of the dependence of tree growth on different variables. Only single factor PDP were investigated, due to a visualization limitation among high-dimensional arguments.
As shown in Figure 5, we drew partial dependence plots for the factors with high relative importance to further analyze the effects of environmental factors on tree height growth. The partial dependence values of the indicators related to MAT fluctuated less in Pinus tabulaeformis Carr. and Robinia pseudoacacia Linn., while most of the partial dependence values of the remaining tree species increased with increasing temperature. For MWMT, all species showed an increasing trend with increasing temperature, except for Robinia pseudoacacia Linn., which showed an increasing trend and then decreased between 26 and 27 °C. For MCMT, there was an obvious increasing tree height trend with increasing temperature for Platycladus orientalis (Linn.) Franco, Sophora japonica Linn. and Salix matsudana Koidz., with little fluctuation for Pinus tabulaeformis Carr. and Robinia pseudoacacia Linn., and an increasing and then decreasing trend for Populus tomentosa Carr. Among the precipitation-related indicators used in this study, the partial dependence values for Pinus tabulaeformis Carr. first decreased and then levelled off with increasing MAP, while for other tree species, the fluctuations were relatively small. For Prec_sm, the partial dependence values for Platycladus orientalis (Linn.) Franco and Populus tomentosa Carr. showed an increasing trend, while those of the other species showed a fluctuating trend with increasing Prec_sm: increasing, then decreasing, and then increasing again. For Prec_wt, the partial dependence values of Platycladus orientalis (Linn.) Franco, Pinus tabulaeformis Carr. and Robinia pseudoacacia Linn. reached a maximum at around 12, that of Sophora japonica Linn. showed a decreasing trend, while those of Salix matsudana Koidz. and Populus tomentosa Carr. slightly increased. The AHM trend was relatively smooth overall, with some species reaching the maximum value of partial dependence at around 42.

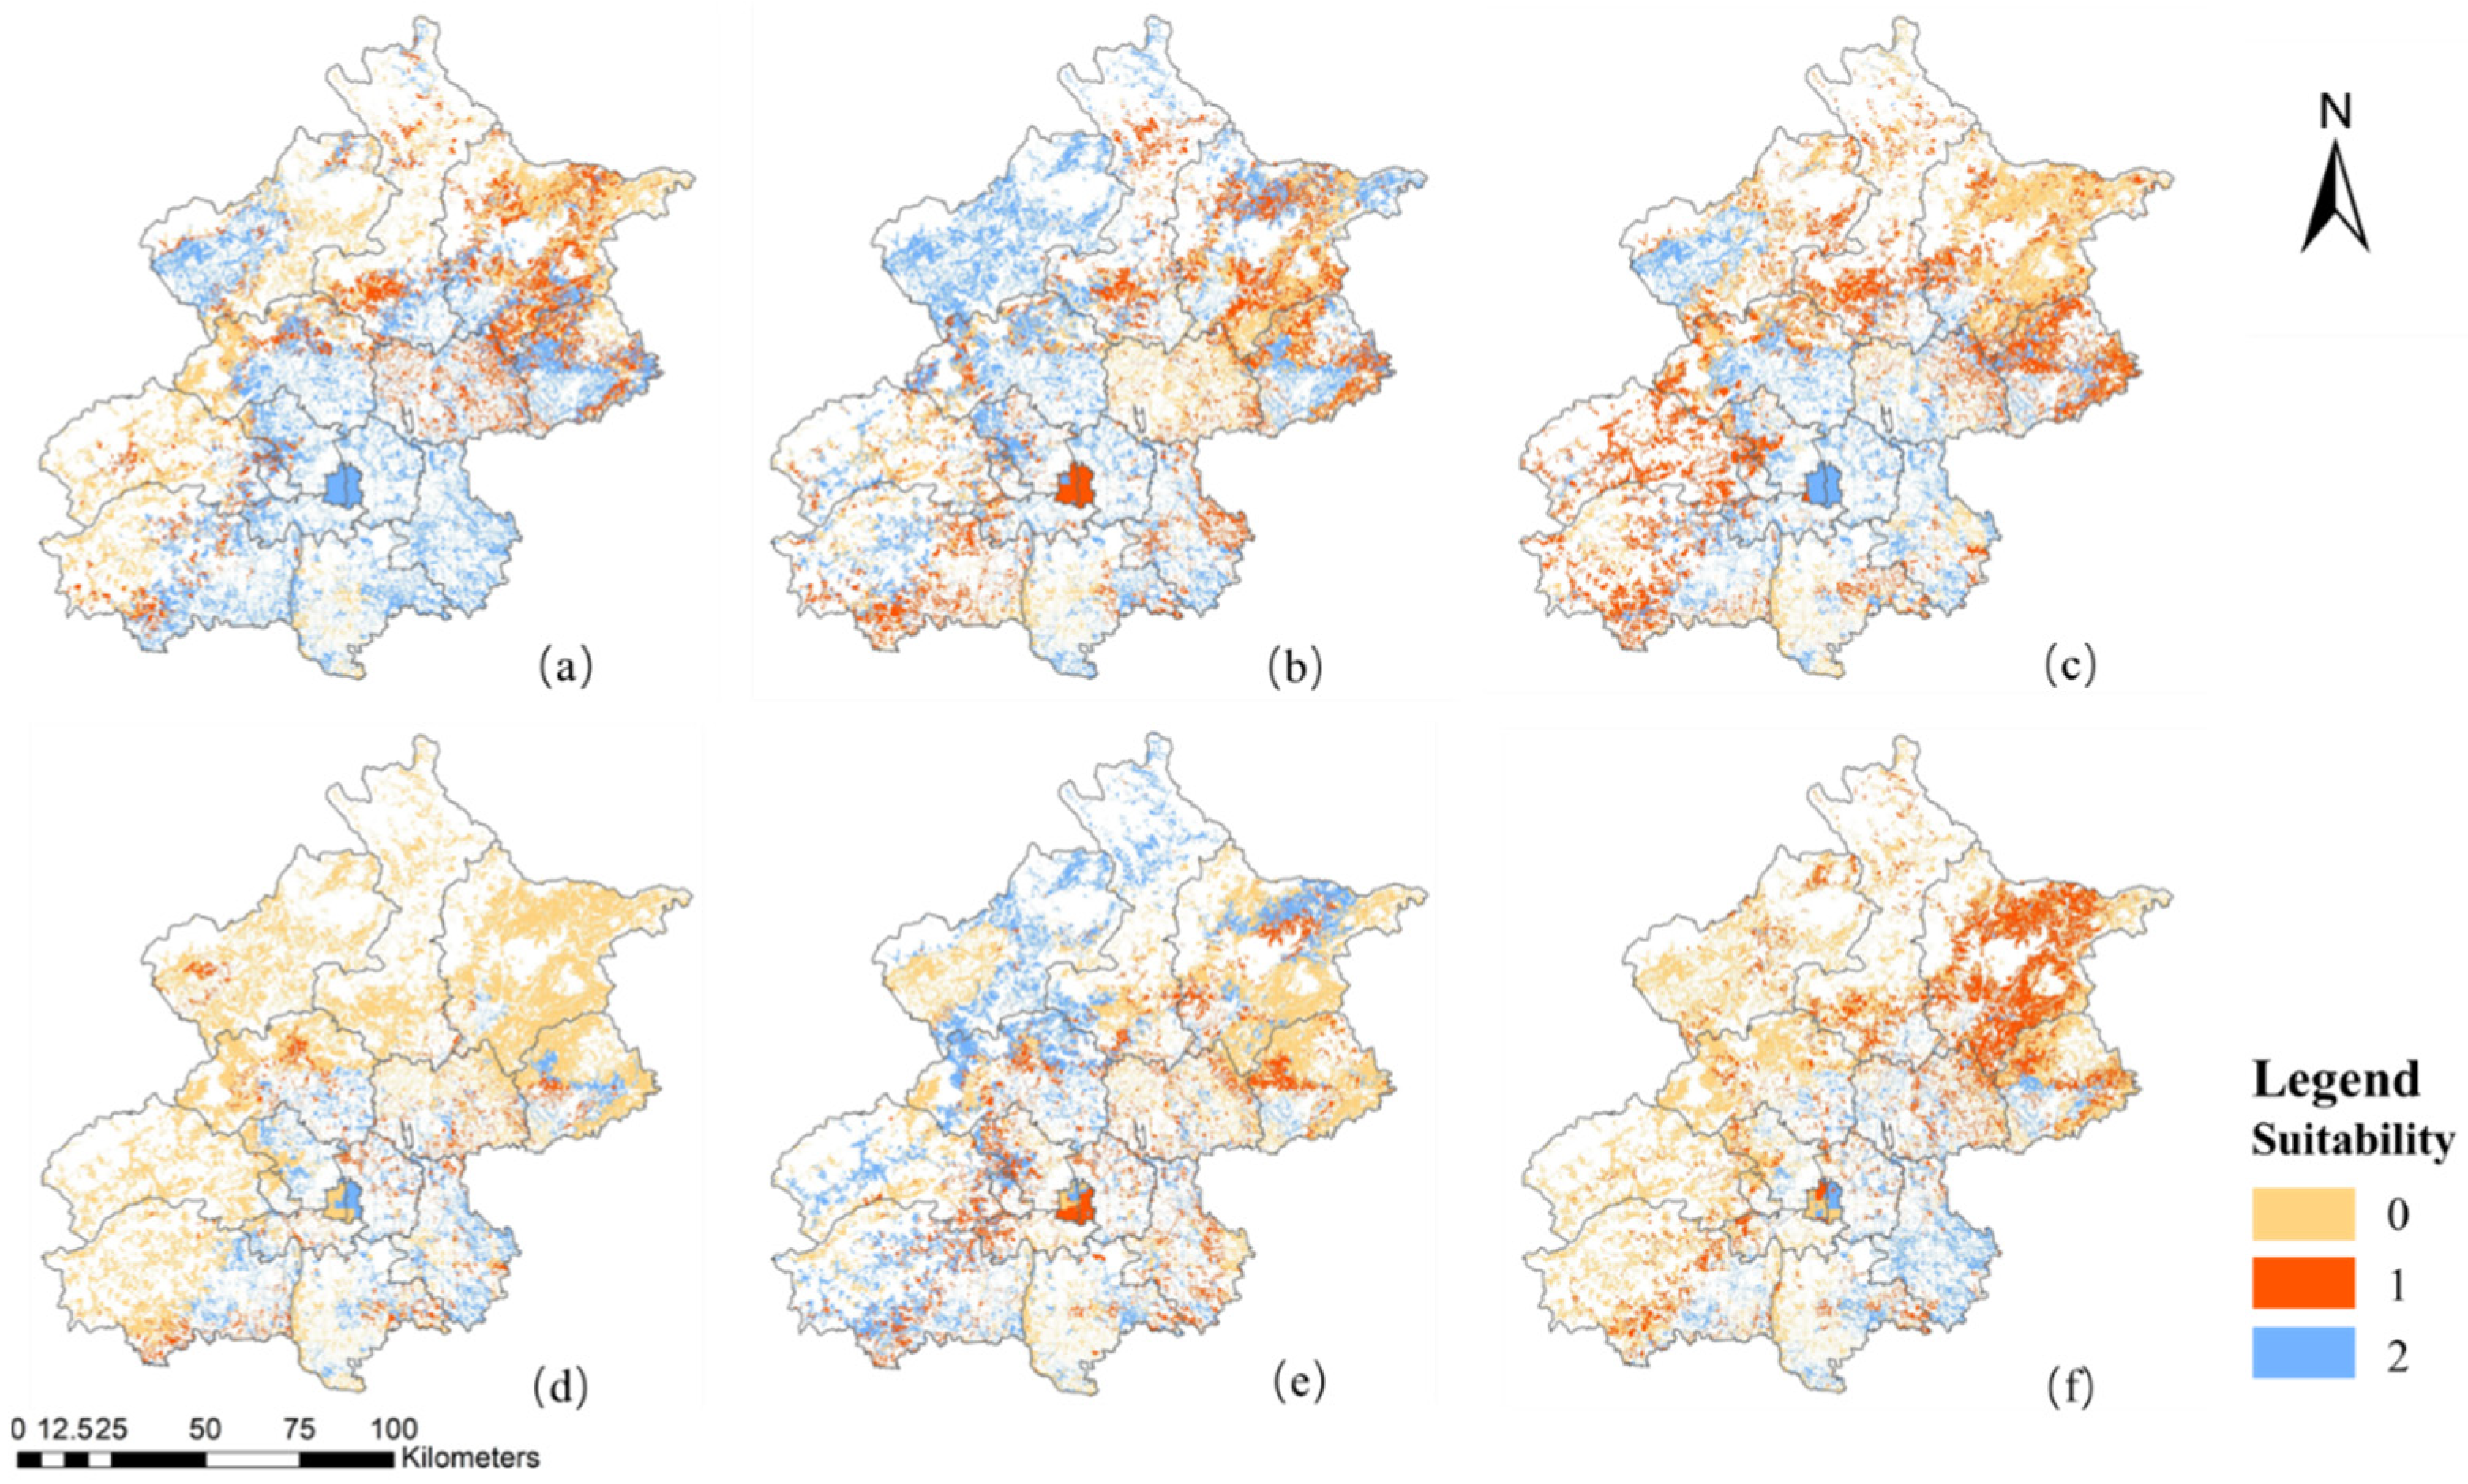
3.4. Spatial Distribution of Tree Species Suitability Zones in Beijing

Based on the results of the random forest model, all plantation plots in Beijing were predicted and a suitability distribution map for each tree species was obtained. The elevation distribution in Beijing presents an increasing trend from southeast to northwest (as shown in Figure 1). According to Figure 6, the distribution for most tree species largely followed this elevation profile; the distribution range and suitability areas decreased from east to west as the elevation increased, and the most suitable growth areas were mainly in the low elevation areas. For Pinus tabulaeformis Carr., Robinia pseudoacacia Linn., and Salix matsudana Koidz., the overall suitable area was wide, almost all of Beijing. Although the southwestern part, Yanqing, is at a higher elevation, the terrain is flat and still suitable for the growth of Platycladus orientalis (Linn.) Franco and Robinia pseudoacacia Linn. The optimum growth area for Pinus tabulaeformis Carr. was the most extensive, with fewer unsuitable locations; most of the Beijing area was suitable for its growth. The optimum growth area for Sophora japonica Linn. was smaller; this species was practically only suitable for growing on the plains. The southeastern part of Beijing was suitable for all six tree species, while the mountainous area in the northwestern part was suitable for Pinus tabulaeformis Carr., Robinia pseudoacacia Linn., and Salix matsudana Koidz.

4. Discussion

4.1. Factors and Their Influence

The growth of trees is influenced by factors such as climate and stand conditions [12]. In this study, climatic factors had a large effect on all tree species, indicating that climate is the main driver of regional forest growth in Beijing, and these findings are consistent with previous studies [47,48]. Combining the elevation distribution in Figure 1 and the results shown in Figure 6, the tree growth distribution in Beijing is clearly correlated with the elevation gradient, which is probably due to the differences in temperature, precipitation, and topography brought about by the differences in elevation. In Beijing, there is a decrease in temperature of 1 °C for every elevation increase of approximately 167 m, and a corresponding change in precipitation [49,50]; the distribution of MAP and MAT is shown in Figure 7. Studies by other researchers of the climatic response relationships for large-scale tree growth have found that the upper limit of forest distribution at high elevations or high latitudes is mainly limited by temperature, while forest growth at low elevations is more sensitive to moisture [51,52]. The elevation of Beijing’s plains ranges from 20 to 60 m, and the mountains generally range from 1000 to 1500 m above sea level—relatively low elevations. In this study, MAT and Prec_sm were variables with a strong influence on tree growth, ranking in the top three positions for all species, which was consistent with the findings of others.
For the MAT factor, except for Pinus tabulaeformis Carr. and Robinia pseudoacacia Linn., all species showed that the higher the temperature, the greater the partial dependence value. The experimental results indicated that MCMT is an important factor affecting tree growth. According to the results of the partial dependence plot, the larger the MCMT value of the tree species, the larger the effect [53]. This is similar to the results of most previous studies—warm winters favor tree growth in northern forests [54,55,56]. Previous studies have shown that temperature has a lesser effect on trees as elevation decreases [54], while MWMT, which first promoted and then inhibited tree growth with increasing temperature (probably because high summer temperatures cause drought stress and decreased net photosynthesis, which negatively affects tree growth at lower elevations), and precipitation, especially summer precipitation (Prec_sm), have a significant effect on growth [57]. Prec_wt affects tree growth by influencing soil water content in spring [58]. Precipitation generally has a positive effect on tree growth, but in this study, the areas with more precipitation were mountainous, and the temperature and topographic conditions were not conducive to storing water and nutrients for tree growth, so the partial dependent values instead show a decreasing trend with increasing MAP, peaking at 550 mm. This was probably because the overall environmental conditions in areas of Beijing under this precipitation condition are more favorable for tree growth.
The annual heat:moisture index (AHM) [29] is used to indicate annual climatic water deficits. Larger values of AHM indicate dry conditions due to high evaporative demand relative to the available moisture, while lower values of AHM indicate relatively wet conditions [59]. In this study, the highest value of partial dependence, at approximately 42, is considered high for AHM, and this was a different result from other studies [53], probably due to the use of other topographic conditions and anthropogenic control. According to the AHM distribution, areas with an index of 42 were mainly in the Daxing, Fangshan, and Changping districts, where the temperature conditions are better, and in accordance with the data, these are the areas of Beijing’s plain afforestation, where the other stand conditions are relatively superior and the management and care factors are strong, so tree growth is optimal.
Among the topographic factors, other researchers have found that slope has an effect on soil preservation and water storage, as well as surface runoff after rainfall [60], with gently sloping soils having better preservation and water accumulation; mountain soils being more water-scarce and barren compared to flatlands, and evergreen tree species being more suitable for barren environments [60]. Therefore, coniferous forests have a relatively larger range of suitable habitat. This is consistent with the present study. According to the prediction and partial dependence maps of the suitability zones for each tree species, Pinus tabulaeformis Carr. and Platycladus orientalis (Linn.) Franco can be grown in most areas. In this study, the remaining topographic factors showed less significant effects on tree growth, probably because the Beijing area is dominated by plains and low mountains, as shown in the geomorphological data. Some tree species, especially some broad-leaved species, are planted mainly on flatlands in Beijing, so the effects of slope aspect, slope position, and slope degree of these species are weak in comparison to the effects of these factors on tree species growing at higher elevations.
The general effect from the soil data was small. For Platycladus orientalis (Linn.) Franco, Pinus tabulaeformis Carr. and Robinia pseudoacacia Linn., soil thickness was secondary to climatic factors, and all three species can grow at higher elevations in mountainous areas as well. Some studies have reported a strong relationship between species distribution and soil thickness, but they point out that this relationship is indirectly achieved through the soil thickness affecting the soil moisture [61,62]. The data relating to GWL, HLT, and BRP showed similar values for most plots, and therefore had a only a small effect on the classification results.

4.2. Implications for Matching Species with the Site

Different combinations of site conditions have different degrees of influence on the growth of trees. Within the same area, there are differences in the relative importance of the influencing factors for each tree species, which further affects the growth of the trees, so it is important to conduct research using suitable trees in the right place. Therefore, when managing plantation forests, we should objectively consider the degree of influence of each site factor, so that the growth environment can be in the best possible condition to achieve the highest benefits.
Beijing is divided into plains, shallow mountains, and steep mountains according to elevation. The “Beijing shallow mountains protection plan (2017–2035)” classifies elevations of 100–300 m as shallow mountains, areas below 100 m as plains, and areas above 300 m as steep mountains. According to the results of this study, geographically, the plain areas are suitable for the growth of almost all tree species in this study; of the six studied tree species, five were suitable for growth in shallow mountainous areas (all species except Sophora japonica Linn.); and the tree species suitable for growth in steep mountainous areas were Pinus tabulaeformis Carr., Robinia pseudoacacia Linn., and Salix matsudana Koidz. Although the southwest area of Yanqing is higher in elevation, the terrain is flat, and this part of the Beijing area is also suitable for the growth of Pinus tabulaeformis Carr., Platycladus orientalis (Linn.) Franco, and Robinia pseudoacacia Linn.
The distribution map showed that the predicted distribution range of each tree species gradually decreased according to the elevation, which is similar to the actual situation in Beijing. In general, higher elevation results in lower temperatures and a more barren environment. Most tree species are suitable for growth on the plains due to better topography and temperature conditions, while the number of suitable species decreases gradually from southeast to northwest, with the increasing elevation. The six tree species selected for the study were all native species suitable for afforestation and greening in Beijing, according to the Beijing afforestation protocol. This study predicted the suitable areas for distribution of these species through random forest modelling, demonstrating which of them can be selected for planting, where, which provides a reference for afforestation work.

4.3. Strengths and Limitations

In this study, two stand variables, mean age and mean tree height, were studied using data from the 2014 Beijing forest management inventory. These two variables are generally included in forest survey data. Compared with the variable of stand dominant height required by the site index method, the average tree height of the stand used in this study is easier to obtain. Applicable to heterogeneous stands, the quantile approach converts the problem of growth volume at different ages into a homogeneous stand growth volume according to the different quantile distributions.
We used the random forest model and selected the optimal combination of parameters by genetic algorithm, which had the advantages of being a simple algorithm with easy calculation. It can improve the accuracy of classification and prediction, it can deal with nonlinearities and interactions, and it can be used for variable importance assessment; the model itself has algorithmic advantages and is easy to compute.
At the same time, there are some shortcomings in this study. The study area was Beijing, which has extensive plains and a relatively low overall elevation, resulting in some tree species, especially broad-leaved species, being mainly distributed on flatlands, and so there are limitations to the study relating to stand factors. In this study, only climate, soil, and topography-related environmental factors were considered, and no anthropogenic factors were taken into account. A future study could be extended to areas with richer landforms for more in-depth investigation.

5. Conclusions

We investigated tree suitability distributions for six main tree species in Beijing, using seven climatic, four topographic, and five edaphic factors as impact variables. The results showed that tree growth impact factors play various roles due to the different growth mechanisms of different tree species, clarifying the importance of tree spatial suitability studies. We analyzed the influences affecting the distribution of the main tree species in Beijing using a random forest model, and the model had a good predictive ability, with a prediction accuracy between 0.75 and 0.85. Based on this, a prediction map for the distribution of six tree species in Beijing was drawn. Temperature and precipitation had the most important influence on the distribution of these tree species. For the six main tree species studied, Pinus tabulaeformis Carr. was the most widely distributed, while Platycladus orientalis (Linn.) Franco, Robinia pseudoacacia Linn. and Salix matsudana Koidz. also had a large range of suitable areas and grow well when planted in mountainous areas, while Sophora japonica Linn. and Populus tomentosa Carr. were more suitable for growing on the plains of southeastern Beijing.
In this study, we optimized the random forest parameters using genetic algorithms to improve the accuracy of classification and prediction, analyzed the importance of each impact factor on tree growth, and visualized and further analyzed these influences through partial dependency plots. The results of the study demonstrated suitability areas for the distribution of the main tree species within Beijing. This could help decision-makers with afforestation planning and design, and aid in the rational allocation of resources.

Author Contributions

Conceptualization, Y.W.; Data curation, Y.W.; Formal analysis, Y.W.; Funding acquisition, Z.F.; Methodology, Y.W.; Resources, Z.F.; Visualization, Y.W.; Writing—original draft, Y.W.; Writing—review & editing, Y.W. and W.M. All authors have read and agreed to the published version of the manuscript.

Funding

This research was funded by Natural Science Foundation of Hainan University, grant numbers KYQD (ZR) 21115.

Institutional Review Board Statement

Not applicable.

Informed Consent Statement

Not applicable.

Data Availability Statement

The data is available on request from the corresponding author.

Acknowledgments

We would like to acknowledge support from Beijing Key Laboratory for Precision Forestry and Beijing Forestry University.

Conflicts of Interest

The authors declare no conflict of interest.

References

  1. Morales-Hidalgo, D.; Oswalt, S.N.; Somanathan, E. Status and trends in global primary forest, protected areas, and areas designated for conservation of biodiversity from the Global Forest Resources Assessment 2015. For. Ecol. Manag. 2015, 352, 68–77. [Google Scholar] [CrossRef] [Green Version]
  2. Keenan, R.J.; Reams, G.A.; Achard, F.; de Freitas, J.V.; Grainger, A.; Lindquist, E. Dynamics of global forest area: Results from the FAO Global Forest Resources Assessment 2015. For. Ecol. Manag. 2015, 352, 9–20. [Google Scholar] [CrossRef]
  3. Piao, S.; Huang, M.; Liu, Z.; Wang, X.; Ciais, P.; Canadell, J.G.; Wang, K.; Bastos, A.; Friedlingstein, P.; Houghton, R.A.; et al. Lower land-use emissions responsible for increased net land carbon sink during the slow warming period. Nat. Geosci. 2018, 11, 739–743. [Google Scholar] [CrossRef] [Green Version]
  4. Aerts, R.; Honnay, O. Forest restoration, biodiversity and ecosystem functioning. BMC Ecol. 2011, 11, 29. [Google Scholar] [CrossRef] [PubMed] [Green Version]
  5. Chen, Y.; Wu, B.; Chen, D.; Qi, Y. Using Machine Learning to Assess Site Suitability for Afforestation with Particular Species. Forests 2019, 10, 739. [Google Scholar] [CrossRef] [Green Version]
  6. Cuong, N.D.; Volker, M.; Kohl, M. Facilitating objective forest land use decisions by site classification and tree growth modeling: A case study from Vietnam. iForest-Biogeosciences For. 2019, 12, 542–550. [Google Scholar] [CrossRef]
  7. Mbabazi, J. Ecosystem Goods and Services from Plantation Forests. Int. J. Environ. Stud. 2010, 68, 249–250. [Google Scholar] [CrossRef]
  8. Barua, S.K.; Lehtonen, P.; Pahkasalo, T. Plantation Vision: Potentials, Challenges and Policy Options for Global Industrial Forest Plantation Development. Int. For. Rev. 2014, 16, 117–127. [Google Scholar] [CrossRef]
  9. Payn, T.; Carnus, J.M.; Freer-Smith, P.; Kimberley, M.; Kollert, W.; Liu, S.; Orazio, C.; Rodriguez, L.; Silva, L.N.; Wingfield, M.J. Changes in planted forests and future global implications. For. Ecol. Manag. 2015, 352, 57–67. [Google Scholar] [CrossRef] [Green Version]
  10. Baral, H.; Guariguata, M.R.; Keenan, R.J. A proposed framework for assessing ecosystem goods and services from planted forests. Ecosyst. Serv. 2016, 22, 260–268. [Google Scholar] [CrossRef] [Green Version]
  11. Qiu, Z.; Feng, Z.; Song, Y.; Li, M.; Zhang, P. Carbon sequestration potential of forest vegetation in China from 2003 to 2050: Predicting forest vegetation growth based on climate and the environment. J. Clean. Prod. 2020, 252, 119715. [Google Scholar] [CrossRef]
  12. Schneider, R.; Franceschini, T.; Fortin, M.; Saucier, J.-P. Climate-induced changes in the stem form of 5 North American tree species. For. Ecol. Manag. 2018, 427, 446–455. [Google Scholar] [CrossRef]
  13. Calama, R.; Conde, M.; de-Dios-García, J.; Madrigal, G.; Vázquez-Piqué, J.; Gordo, F.J.; Pardos, M. Linking climate, annual growth and competition in a Mediterranean forest: Pinus pinea in the Spanish Northern Plateau. Agric. For. Meteorol. 2019, 264, 309–321. [Google Scholar] [CrossRef]
  14. Zhao, X.; Feng, Z.; Zhou, Y.; Lin, Y. Key Technologies of Forest Resource Examination System Development in China. Engineering 2019, 6, 491–494. [Google Scholar] [CrossRef]
  15. Eckhart, T.; Pötzelsberger, E.; Koeck, R.; Thom, D.; Lair, G.J.; van Loo, M.; Hasenauer, H. Forest stand productivity derived from site conditions: An assessment of old Douglas-fir stands (Pseudotsuga menziesii (Mirb.) Franco var. menziesii) in Central Europe. Ann. For. Sci. 2019, 76, 19. [Google Scholar] [CrossRef] [Green Version]
  16. Louw, J.H.; Scholes, M. Forest site classification and evaluation: A South African perspective. For. Ecol. Manag. 2002, 171, 153–168. [Google Scholar] [CrossRef]
  17. Watt, M.S.; Dash, J.P.; Bhandari, S.; Watt, P. Comparing parametric and non-parametric methods of predicting Site Index for radiata pine using combinations of data derived from environmental surfaces, satellite imagery and airborne laser scanning. For. Ecol. Manag. 2015, 357, 1–9. [Google Scholar] [CrossRef]
  18. Carmean, W.H. Forest Site Quality Evaluation in The United States. Adv. Agron. 1975, 27, 209–269. [Google Scholar] [CrossRef]
  19. Schoenholtz, S.H.; Van Miegroet, H.; Burger, J.A. A review of chemical and physical properties as indicators of forest soil quality: Challenges and opportunities. For. Ecol. Manag. 2000, 138, 335–356. [Google Scholar] [CrossRef]
  20. Fiandino, S.; Plevich, J.; Tarico, J.; Utello, M.; Demaestri, M.; Gyenge, J. Modeling forest site productivity using climate data and topographic imagery in Pinus elliottii plantations of central Argentina. Ann. For. Sci. 2020, 77, 95. [Google Scholar] [CrossRef]
  21. Barrio-Anta, M.; Castedo-Dorado, F.; Cámara-Obregón, A.; López-Sánchez, C.A. Predicting current and future suitable habitat and productivity for Atlantic populations of maritime pine (Pinus pinaster Aiton) in Spain. Ann. For. Sci. 2020, 77, 41. [Google Scholar] [CrossRef]
  22. Beaulieu, J.; Raulier, F.; Prégent, G.; Bousquet, J. Predicting site index from climatic, edaphic, and stand structural properties for seven plantation-grown conifer species in Quebec. Can. J. For. Res. 2011, 41, 682–693. [Google Scholar] [CrossRef]
  23. Curt, T.; Bouchaud, M.; Agrech, G. Predicting site index of Douglas-Fir plantations from ecological variables in the Massif Central area of France. For. Ecol. Manag. 2001, 149, 61–74. [Google Scholar] [CrossRef]
  24. Sharma, R.P.; Brunner, A.; Eid, T. Site index prediction from site and climate variables for Norway spruce and Scots pine in Norway. Scand. J. For. Res. 2012, 27, 619–636. [Google Scholar] [CrossRef]
  25. Uzoh, F.C.C.; Oliver, W.W. Individual tree height increment model for managed even-aged stands of ponderosa pine throughout the western United States using linear mixed effects models. For. Ecol. Manag. 2006, 221, 147–154. [Google Scholar] [CrossRef]
  26. Farrelly, N.; Dhubháin, Á.N.; Nieuwenhuis, M. Sitka spruce site index in response to varying soil moisture and nutrients in three different climate regions in Ireland. For. Ecol. Manag. 2011, 262, 2199–2206. [Google Scholar] [CrossRef]
  27. Bueis, T.; Bravo, F.; Pando, V.; Turrion, M.B. Relationship between environmental parameters and Pinus sylvestris L. site index in forest plantations in northern Spain acidic plateau. iForest-Biogeosciences For. 2016, 9, 394–401. [Google Scholar] [CrossRef] [Green Version]
  28. Liu, M.; Feng, Z.; Ma, C.; Yang, L. Influencing factors and growth state classification of a natural Metasequoia population. J. For. Res. 2019, 30, 337–345. [Google Scholar] [CrossRef]
  29. Wang, T.; Wang, G.; Innes, J.L.; Seely, B.; Chen, B. ClimateAP: An application for dynamic local downscaling of historical and future climate data in Asia Pacific. Front. Agric. Sci. Eng. 2017, 4, 448–458. [Google Scholar] [CrossRef] [Green Version]
  30. Zhang, J.; Duan, A. Approach to Theoretical Growth Equations for Modelling Stands Diameter Structure of Chinese Fir Plantations. Sci. Silvae Sin. 2003, 39, 55–61. [Google Scholar] [CrossRef]
  31. Koenker, R.; Bassett, G.W. Regression quantiles. Econometrica 1978, 46, 211–244. [Google Scholar] [CrossRef]
  32. Furno, M.; Vistocco, D. Quantile Regression: Estimation and Simulation; John Wiley & Sons: Hoboken, NJ, USA, 2018; pp. 1–287. [Google Scholar]
  33. Cade, B.S.; Noon, B.R. A gentle introduction to quantile regression for ecologists. Front. Ecol. Environ. 2003, 1, 412–420. [Google Scholar] [CrossRef]
  34. Zhang, B.; Sajjad, S.; Chen, K.; Zhou, L.; Zhang, Y.; Yong, K.K.; Sun, Y. Predicting Tree Height-Diameter Relationship from Relative Competition Levels Using Quantile Regression Models for Chinese Fir (Cunninghamia lanceolata) in Fujian Province, China. Forests 2020, 11, 183. [Google Scholar] [CrossRef] [Green Version]
  35. Weiskittel, A.R.; Crookston, N.L.; Radtke, P.J. Linking climate, gross primary productivity, and site index across forests of the western United States. Can. J. For. Res. 2011, 41, 1710–1721. [Google Scholar] [CrossRef]
  36. Sun, A.; Lim, E.P. Hierarchical Text Classification and Evaluation. In Proceedings of the 2001 IEEE International Conference on Data Mining, San Jose, CA, USA, 29 November–2 December 2001. [Google Scholar]
  37. Heung, B.; Bulmer, C.E.; Schmidt, M.G. Predictive soil parent material mapping at a regional-scale: A Random Forest approach. Geoderma 2014, 214–215, 141–154. [Google Scholar] [CrossRef]
  38. Zhu, Y.; Feng, Z.; Lu, J.; Liu, J. Estimation of Forest Biomass in Beijing (China) Using Multisource Remote Sensing and Forest Inventory Data. Forests 2020, 11, 163. [Google Scholar] [CrossRef] [Green Version]
  39. Díaz-Uriarte, R.; Bioinformatics, S.A.J.B. Gene selection and classification of microarray data using random forest. BMC Bioinform. 2006, 7, 3. [Google Scholar] [CrossRef] [Green Version]
  40. Bernard, S.; Heutte, L.; Adam, S. Influence of Hyperparameters on Random Forest Accuracy; Springer: Berlin/Heidelberg, Germany, 2009; Volume 5519, pp. 171–180. [Google Scholar]
  41. Goldberg, D.E. Genetic Algorithm in Search, Optimization, and Machine Learning; Addison Wesley Publishing Company: Boston, MA, USA, 1989. [Google Scholar]
  42. Bylander, T. Estimating Generalization Error on Two-Class Datasets Using Out-of-Bag Estimates. Mach. Learn. 2002, 48, 287–297. [Google Scholar] [CrossRef]
  43. Breiman, L. Out-Of-Bag Estimation. 1996. Available online: https://www.stat.berkeley.edu/~breiman/OOBestimation.pdf (accessed on 14 April 2022).
  44. Jiménez-Valverde, A. Insights into the area under the receiver operating characteristic curve (AUC) as a discrimination measure in species distribution modelling. Glob. Ecol. Biogeogr. 2012, 21, 498–507. [Google Scholar] [CrossRef]
  45. Ma, W.; Feng, Z.; Cheng, Z.; Chen, S.; Wang, F. Identifying Forest Fire Driving Factors and Related Impacts in China Using Random Forest Algorithm. Forests 2020, 11, 507. [Google Scholar] [CrossRef]
  46. Friedman, J.H. Greedy function approximation: A gradient boosting machine. Ann. Stat. 2001, 29, 1189–1232. [Google Scholar] [CrossRef]
  47. Toledo, M.; Poorter, L.; Peña-Claros, M.; Alarcón, A.; Balcázar, J.; Leaño, C.; Licona, J.C.; Llanque, O.; Vroomans, V.; Zuidema, P.; et al. Climate is a stronger driver of tree and forest growth rates than soil and disturbance. J. Ecol. 2011, 99, 254–264. [Google Scholar] [CrossRef]
  48. Price, D.T.; Cooke, B.J.; Metsaranta, J.M.; Kurz, W.A. If forest dynamics in Canada’s west are driven mainly by competition, why did they change? Half-century evidence says: Climate change. Proc. Natl. Acad. Sci. USA 2015, 112, E4340. [Google Scholar] [CrossRef] [PubMed] [Green Version]
  49. Jump, A.S.; Mátyás, C.; Peñuelas, J. The altitude-for-latitude disparity in the range retractions of woody species. Trends Ecol. Evol. 2009, 24, 694–701. [Google Scholar] [CrossRef] [PubMed] [Green Version]
  50. Sanchez-Moreno, J.F.; Mannaerts, C.M.; Jetten, V. Influence of topography on rainfall variability in Santiago Island, Cape Verde. Int. J. Climatol. 2014, 34, 1081–1097. [Google Scholar] [CrossRef]
  51. Harsch, M.A.; Hulme, P.E.; McGlone, M.S.; Duncan, R.P. Are treelines advancing? A global meta-analysis of treeline response to climate warming. Ecol. Lett. 2009, 12, 1040–1049. [Google Scholar] [CrossRef]
  52. Babst, F.; Poulter, B.; Trouet, V.; Tan, K.; Neuwirth, B.; Wilson, R.; Carrer, M.; Grabner, M.; Tegel, W.; Levanic, T.; et al. Site- and species-specific responses of forest growth to climate across the European continent. Glob. Ecol. Biogeogr. 2013, 22, 706–717. [Google Scholar] [CrossRef]
  53. Wang, Z.; Zhang, X.; Chhin, S.; Zhang, J.; Duan, A. Disentangling the effects of stand and climatic variables on forest productivity of Chinese fir plantations in subtropical China using a random forest algorithm. Agric. For. Meteorol. 2021, 304–305, 108412. [Google Scholar] [CrossRef]
  54. Linares, J.C.; Tiscar, P.A. Buffered climate change effects in a Mediterranean pine species: Range limit implications from a tree-ring study. Oecologia 2011, 167, 847–859. [Google Scholar] [CrossRef]
  55. Sidor, C.G.; Popa, I.; Vlad, R.; Cherubini, P. Different tree-ring responses of Norway spruce to air temperature across an altitudinal gradient in the Eastern Carpathians (Romania). Trees 2015, 29, 985–997. [Google Scholar] [CrossRef]
  56. Kolář, T.; Čermák, P.; Trnka, M.; Žid, T.; Rybníček, M. Temporal changes in the climate sensitivity of Norway spruce and European beech along an elevation gradient in Central Europe. Agric. For. Meteorol. 2017, 239, 24–33. [Google Scholar] [CrossRef]
  57. Driscoll, W.W.; Wiles, G.C.; D’Arrigo, R.D.; Wilmking, M. Divergent tree growth response to recent climatic warming, Lake Clark National Park and Preserve, Alaska. Geophys. Res. Lett. 2005, 32, L20703. [Google Scholar] [CrossRef] [Green Version]
  58. Zhang, X.; Liu, X.; Zhang, Q.; Zeng, X.; Xu, G.; Wu, G.; Wang, W. Species-specific tree growth and intrinsic water-use efficiency of Dahurian larch (Larix gmelinii) and Mongolian pine (Pinus sylvestris var. mongolica) growing in a boreal permafrost region of the Greater Hinggan Mountains, Northeastern China. Agric. For. Meteorol. 2018, 248, 145–155. [Google Scholar] [CrossRef]
  59. Metzen, D.; Sheridan, G.J.; Benyon, R.G.; Bolstad, P.V.; Griebel, A.; Lane, P.N.J. Spatio-temporal transpiration patterns reflect vegetation structure in complex upland terrain. Sci. Total Environ. 2019, 694, 133551. [Google Scholar] [CrossRef] [PubMed]
  60. Aerts, R. The advantages of being evergreen. Trends Ecol. Evol. 1995, 10, 402–407. [Google Scholar] [CrossRef]
  61. Tromp-van Meerveld, H.J.; McDonnell, J.J. On the interrelations between topography, soil depth, soil moisture, transpiration rates and species distribution at the hillslope scale. Adv. Water Resour. 2006, 29, 293–310. [Google Scholar] [CrossRef]
  62. Burley, S.T.; Harper, K.A.; Lundholm, J.T. Vegetation composition, structure and soil properties across coastal forest–barren ecotones. Plant Ecol. 2010, 211, 279–296. [Google Scholar] [CrossRef]
Figure 1. Overview map of the study area.
Forests 13 00820 g001
Figure 2. Technical framework diagram for this study.
Forests 13 00820 g002
Figure 3. Distribution of stand site tree suitability for 6 main tree species.
Forests 13 00820 g003
Figure 4. Map of the relative importance of environmental factors for six main tree species.
Forests 13 00820 g004
Figure 5. Partial dependence plots of important impact factors for six main tree species. (a) Platycladus orientalis (Linn.) Franco; (b) Pinus tabulaeformis Carr.; (c) Robinia pseudoacacia Linn.; (d) Sophora japonica Linn.; (e) Salix matsudana Koidz.; (f) Populus tomentosa Carr.
Forests 13 00820 g005
Figure 6. Predicted suitable areas for six main tree species in Beijing. In the legend, 0 means unsuitable, 1 means suitable, and 2 means the most suitable. (a) Platycladus orientalis (Linn.) Franco; (b) Pinus tabulaeformis Carr.; (c) Robinia pseudoacacia Linn.; (d) Sophora japonica Linn.; (e) Salix matsudana Koidz.; (f) Populus tomentosa Carr.
Forests 13 00820 g006
Figure 7. MAP and MAT distribution.
Forests 13 00820 g007
Table 1. Sample sizes and elevation distribution of the main tree species.
NoSpeciesSample SizeElevation (m)
Min.Max.MeanMedian
1Platycladus orientalis (Linn.) Franco882201248252.5219
2Pinus tabulaeformis Carr.968903501165.746
3Robinia pseudoacacia Linn.320801146113.740
4Sophora japonica Linn.4193082435.330
5Salix matsudana Koidz.4346098028.628
6Populus tomentosa Carr.5484075034.930
Table 2. Summary of environment variables used in this study.
Variable TypeVariable NameDescribeMeanMedianMin.Max.
ClimaticMATMean annual temperature (°C)11.9512.525.6412.98
MWMTMean warmest month temperature (°C)26.1126.6220.5827.1
MCMTMean coldest month temperature (°C)−4.98−4.3−12.52−3.68
MAPMean annual precipitation (mm)575.6567.2472.2764.6
Prec_smSummer precipitation (mm) 462.4456.2366605.3
Prec_wtWinter precipitation (mm)12.1127.323.7
AHMAnnual heat:moisture index
((MAT + 10)/(MAP/1000))
38.839.721.248.94
TopographicLandformLandform ////
Slope-ASlope aspect ////
Slope-DSlope degree (°)8.060060
Slope-PSlope position ////
EdaphicSoil-TPSoil type ////
Soil-TNSoil thickness (cm) 47.71600430
BRPBare rock percentage (%)0.570090
HLTHumus layer thickness (cm) 0.200060
GWLGroundwater level (m) 17.44002013
Note: “/” means classified variable, and the data statistics are shown in Table 3.
Table 3. Classification criteria and quantity for each type.
Variable NameCategories (Number)
Slope aspectNorth (338°~22°) (1795), Northeast (23°~67°) (1481), East (68°~112°) (1385), Southeast (113°~157°) (1468), South (158°~202°) (1795), Southwest (203°~247°) (1277), West (248°~292°) (1046), Northwest (293°~337°) (1260), No slope direction (24,235)
Slope positionRidge (35), Upslope (1195), Mid (634), Downslope (1570), Valley (164), Flat (24,309), Whole slope (7835)
Soil typeAlluvial soil (18,617), Drab soil (13,808), Brown soil (475), Wind-blown soil (2842)
LandformPlain (23,077), Low mountain (12,201), Medium mountain (464)
Table 4. Theoretical growth equations.
NoModelModel Expression
1 Logistic (Verhulst, 1838)h = A/(1 + B × exp(C × t))
2 Gompertz (Gompertz, 1825)h = A × exp(−B × exp(−C × t))
3Richards (Richards, 1959)h = A × (1 − exp(−C × t))^B
4 Korf (Korf, 1939)h = A × exp(−B × t^(−C))
5 Mitscherlich (Mitscherlich, 1919)h = A × (1 − exp(−C × t))
Note: h represents tree height; t represents age; A, B, and C are regression parameters.
Table 5. The estimated parameters and evaluated statistics of models.
Species1/3 Quantile Regression Line2/3 Quantile Regression Line
ModelABCAICModelABCAIC
Platycladus orientalis (Linn.) Franco19.075.77−0.0429,267.5918.2754.135−0.06932,881.02
Pinus tabulaeformis Carr.16.8082.967−0.07032,963.4528.6281.4640.05636,639.91
Robinia pseudoacacia Linn.18.7192.206−0.04815,158.21110.9552.191−0.08916,228.38
Sophora japonica Linn.19.113.33−0.1217,361.99112.5433.448−0.12318,686.13
Salix matsudana Koidz.210.991.810.0820,781.45114.4324.155−0.14918,686.13
Populus tomentosa Carr.219.211.560.07434,250.48222.0251.7420.12134,080.18
Note: A, B, and C are regression parameters.
Table 6. Model parameters and validation accuracy.
Speciesn_estimatorsmax_featuremin_leafRF AUCORF AUC
Platycladus orientalis (Linn.) Franco600320.79200.8042
Pinus tabulaeformis Carr.300220.80730.8257
Robinia pseudoacacia Linn.70630.82310.8399
Sophora japonica Linn.420220.73480.7626
Salix matsudana Koidz.440420.75310.7642
Populus tomentosa Carr.510120.74240.7518
Table 7. Importance of environmental factor groups for each species.
SpeciesClimaticTopographicEdaphic
Platycladus orientalis (Linn.) Franco73.16%13.26%13.58%
Pinus tabulaeformis Carr.81.65%7.99%10.36%
Robinia pseudoacacia Linn.72.57%16.39%11.04%
Sophora japonica Linn.91.87%1.51%7.40%
Salix matsudana Koidz.93.32%0.75%5.93%
Populus tomentosa Carr.86.90%2.09%11.01%
Publisher’s Note: MDPI stays neutral with regard to jurisdictional claims in published maps and institutional affiliations.

