
A 25-Year Study of the Population Dynamics of a Harvested Population of Sika Deer on Kyushu Island, Japan

 ,
,
Abstract
:1. Introduction
2. Methods
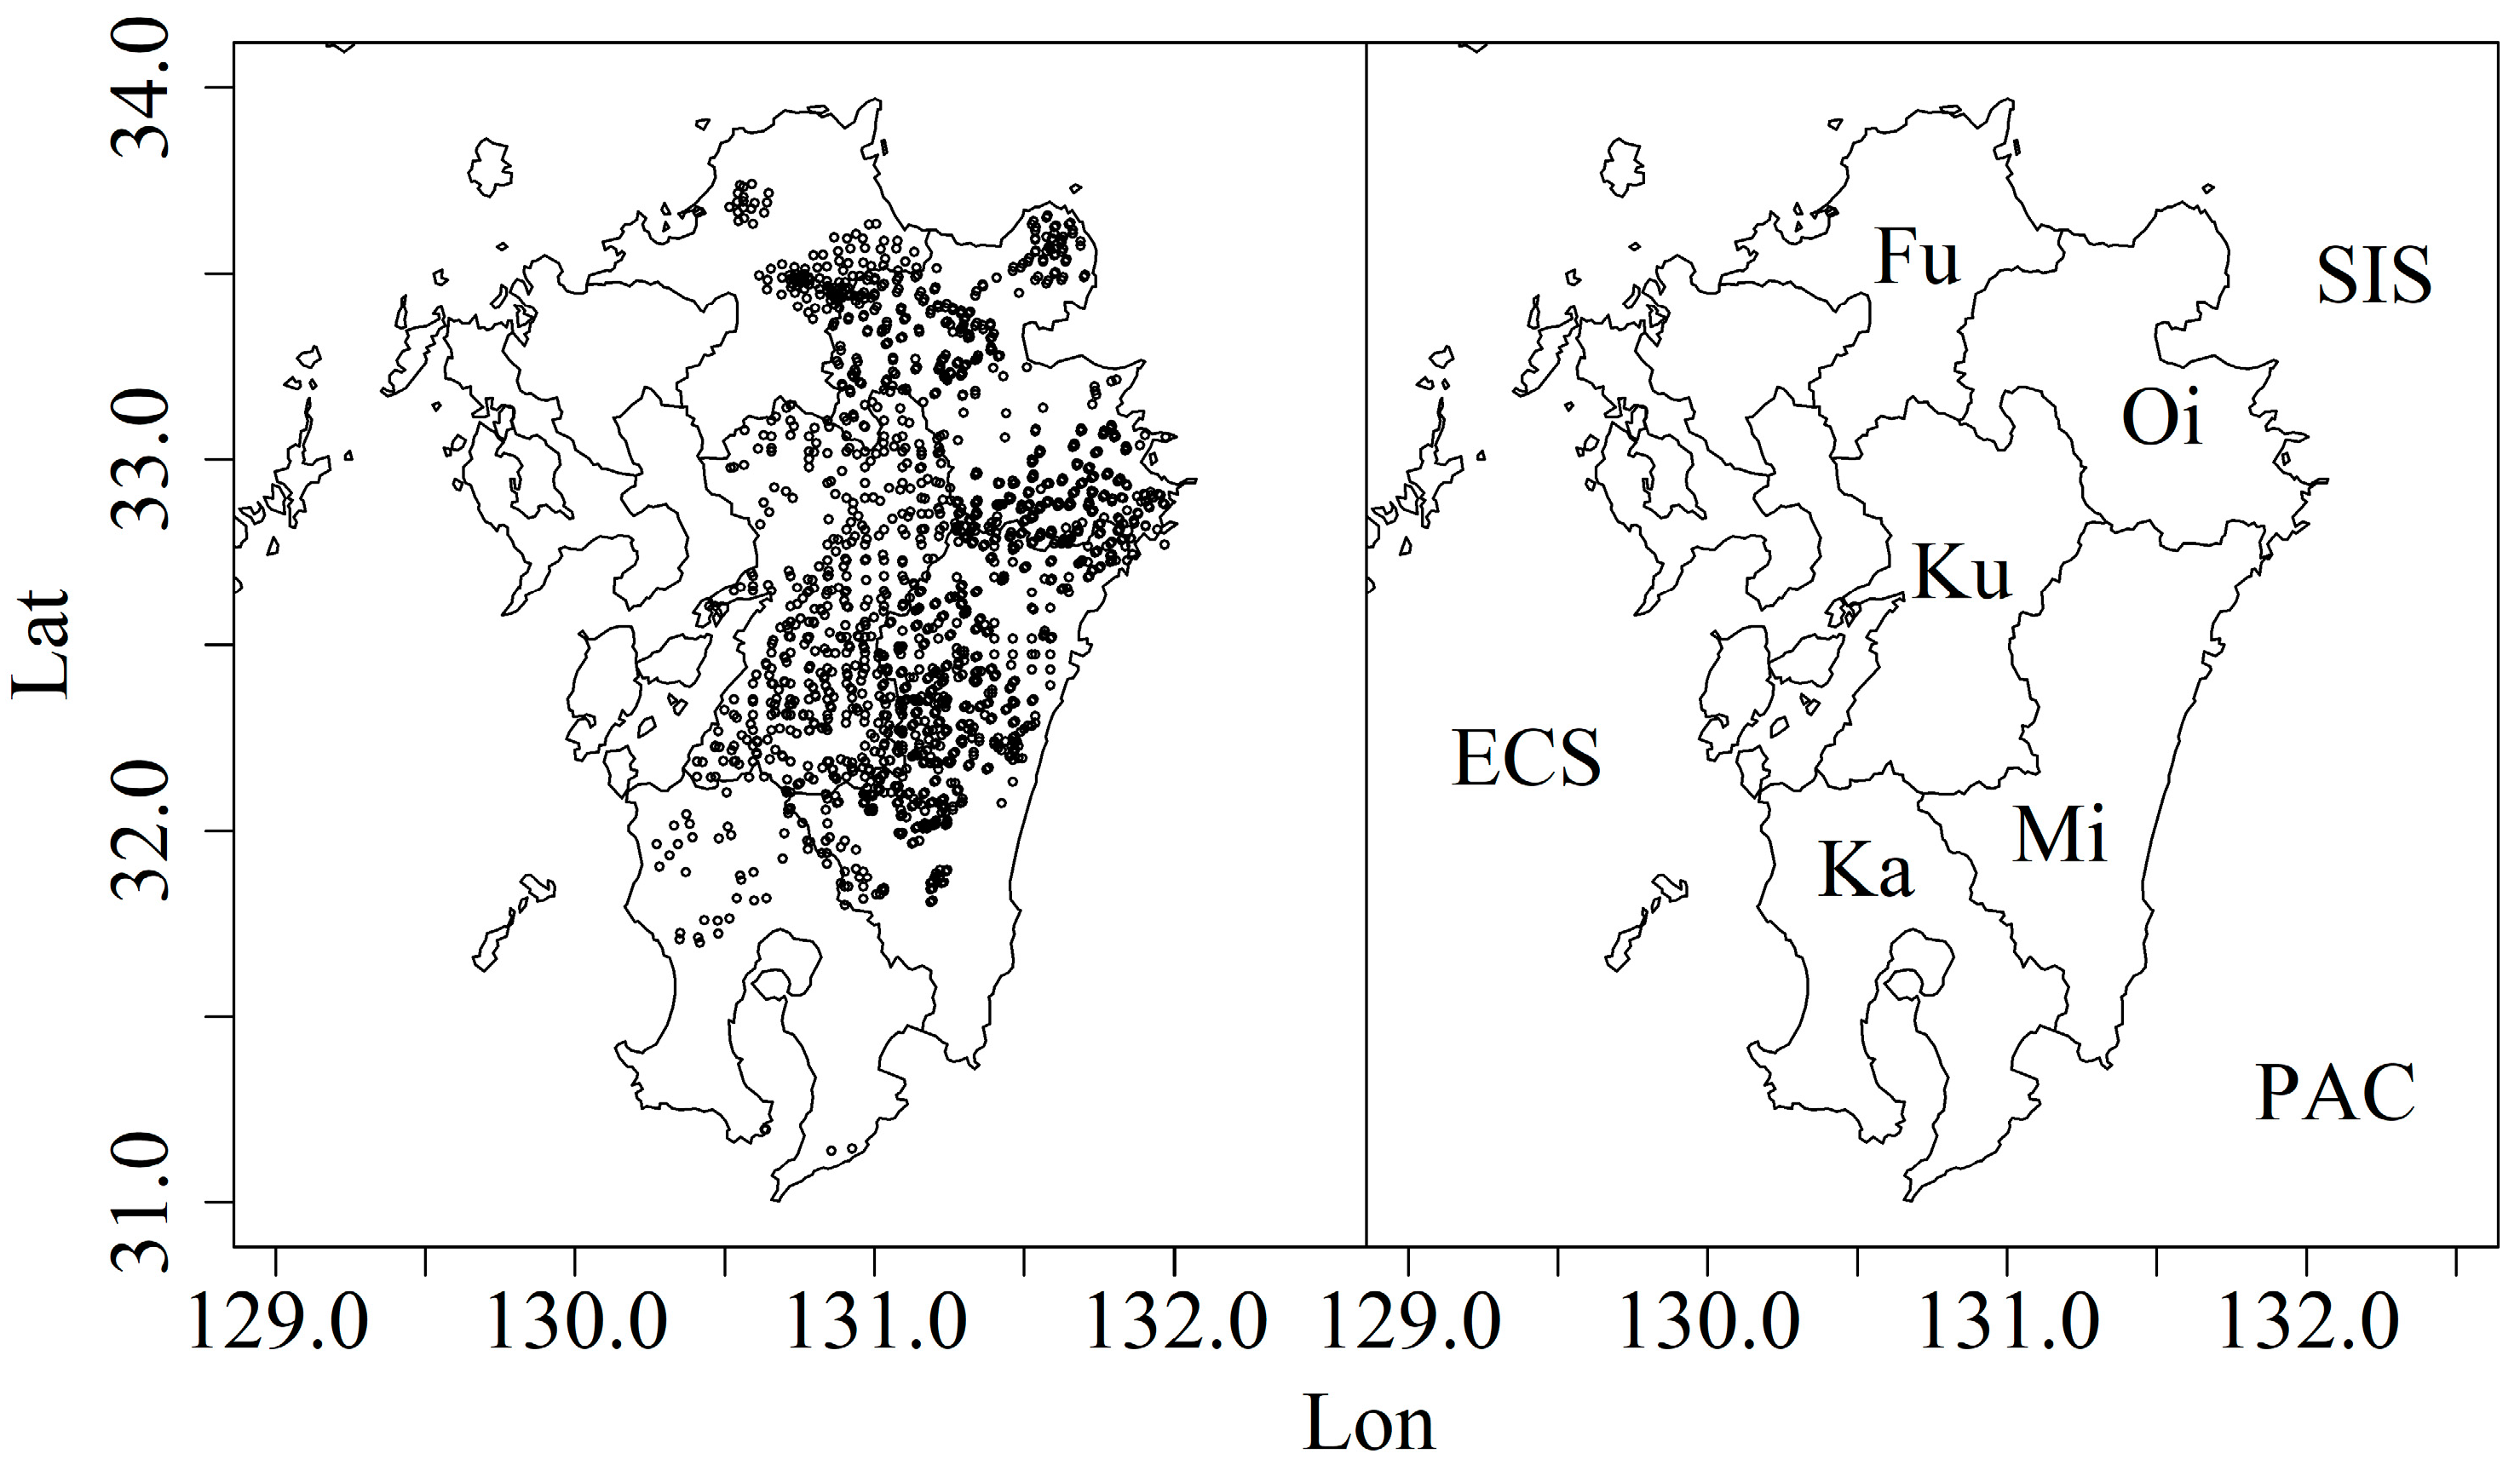
2.1. Study Areas
2.2. Fecal Pellet Count Method
2.3. Spatio-Temporal Changes of Deer Density and Population Dynamics
3. Results
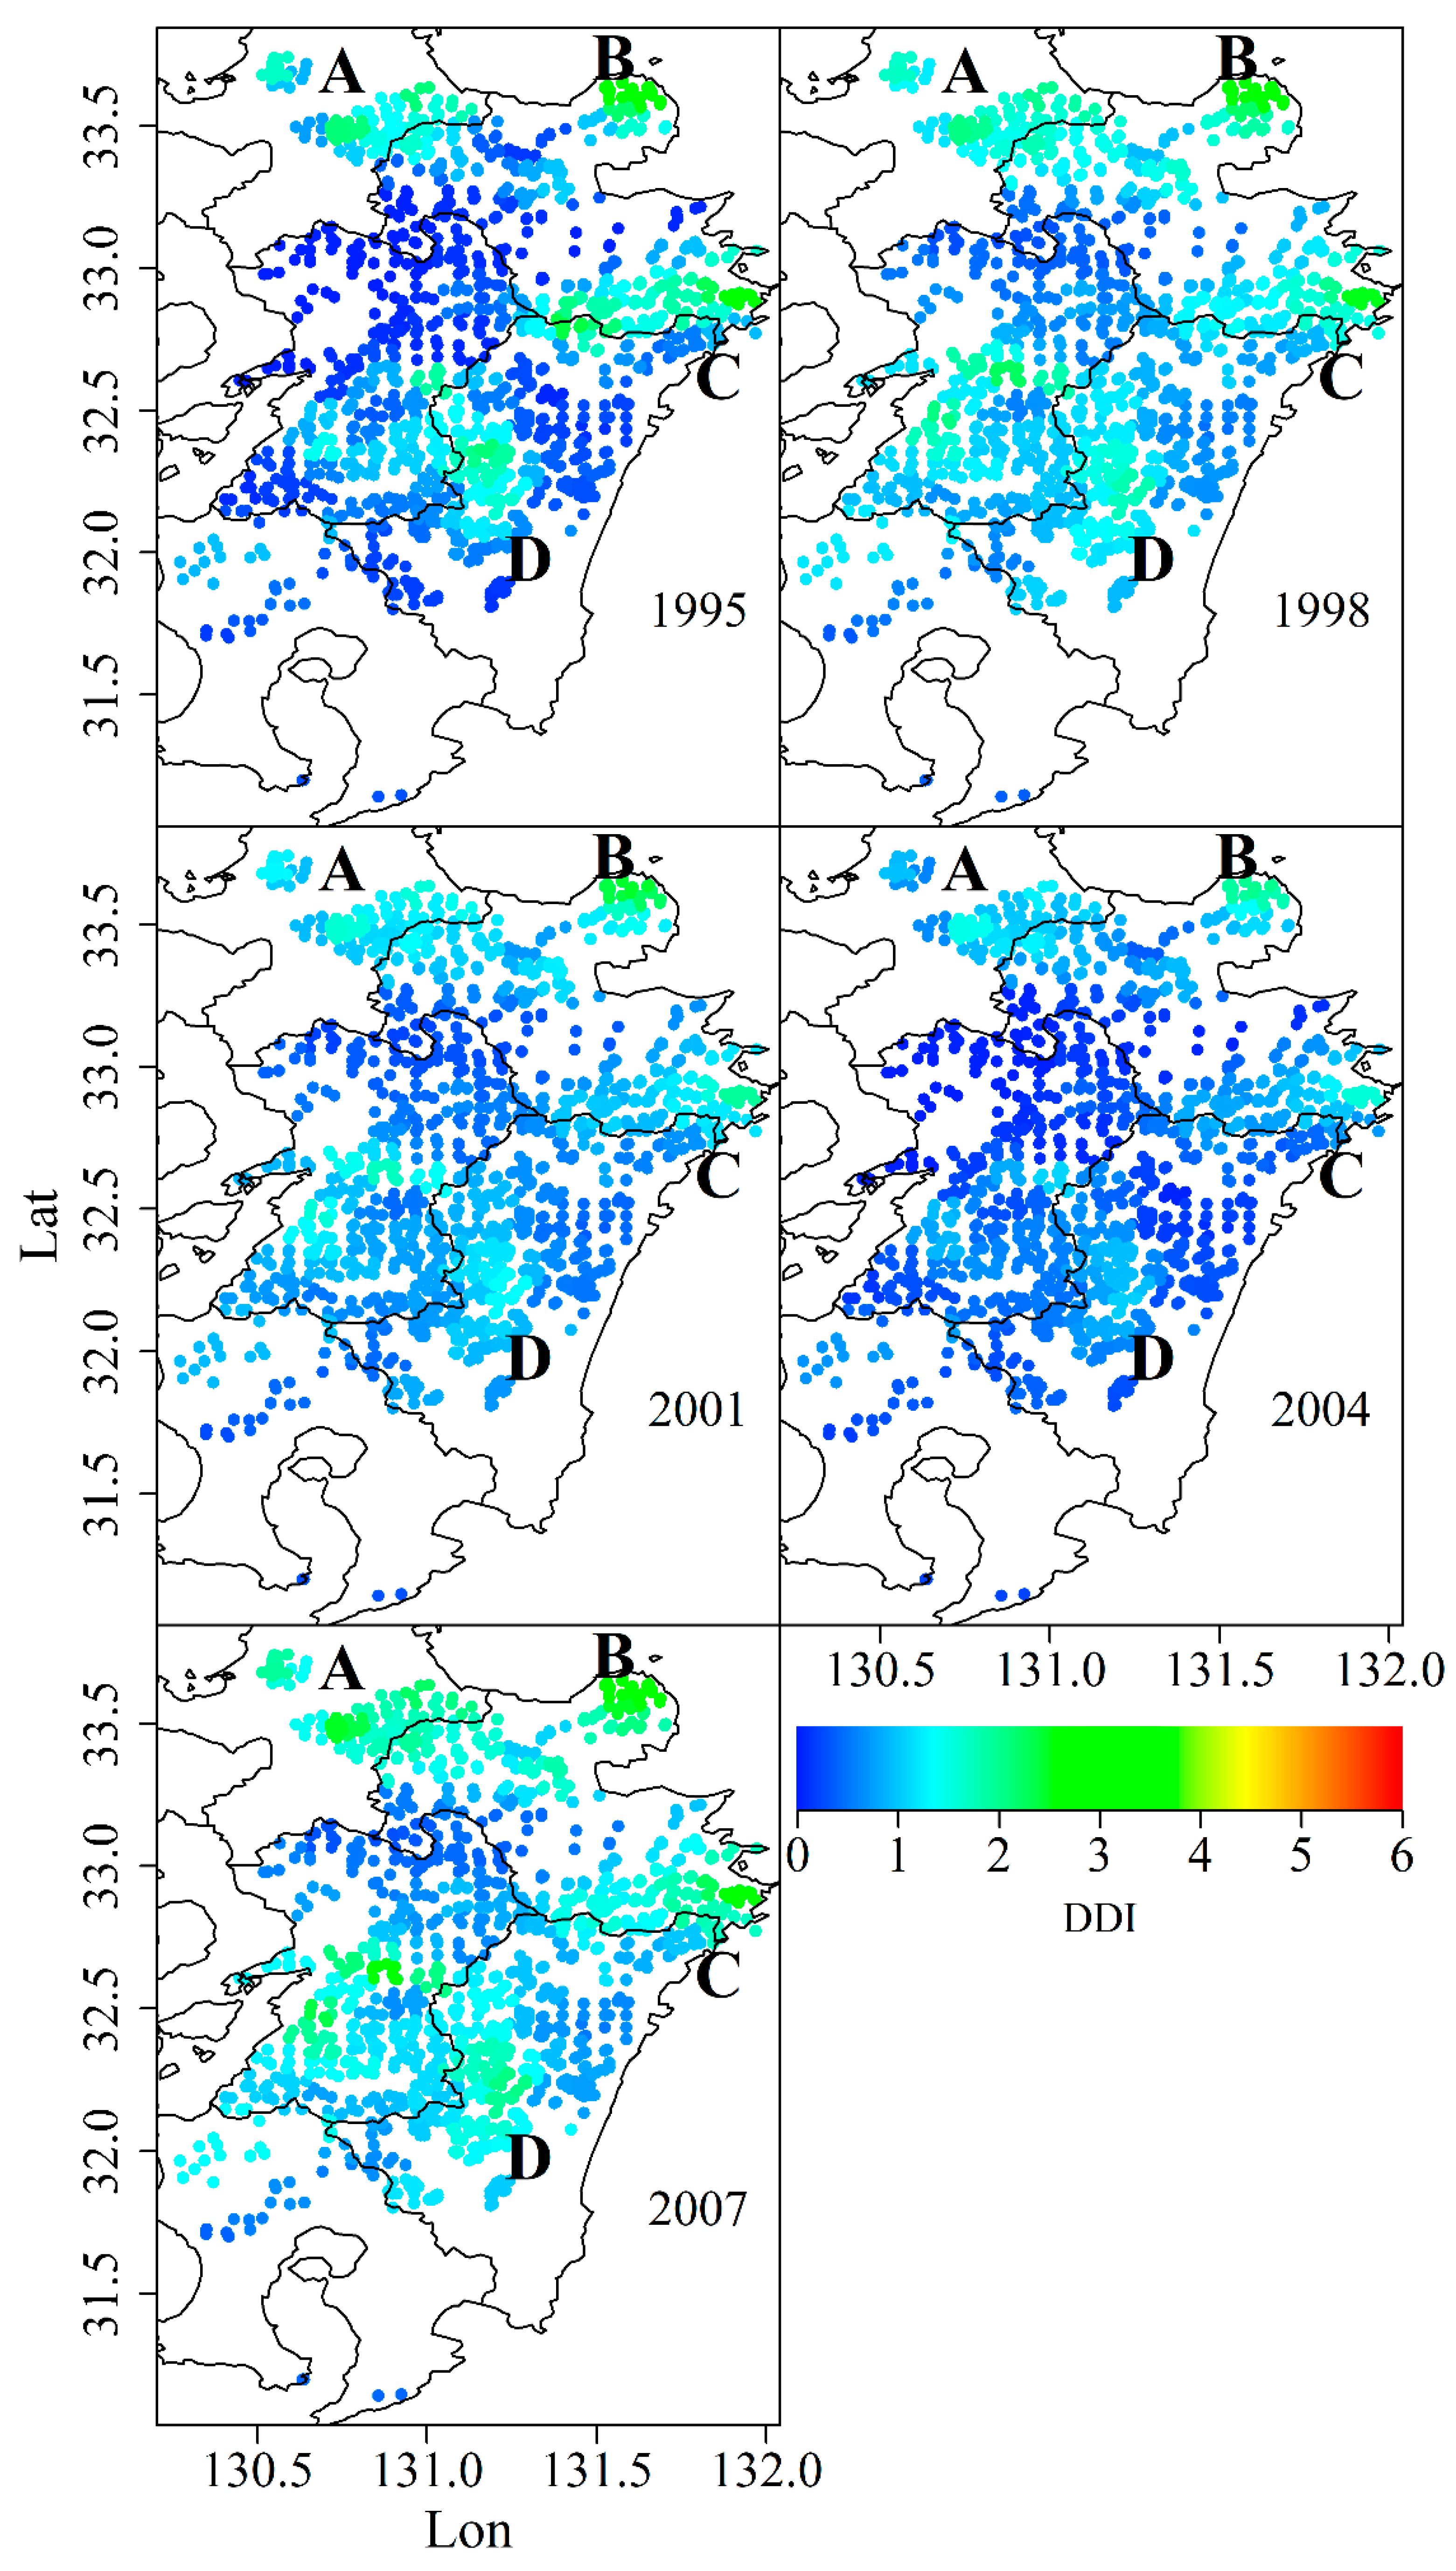
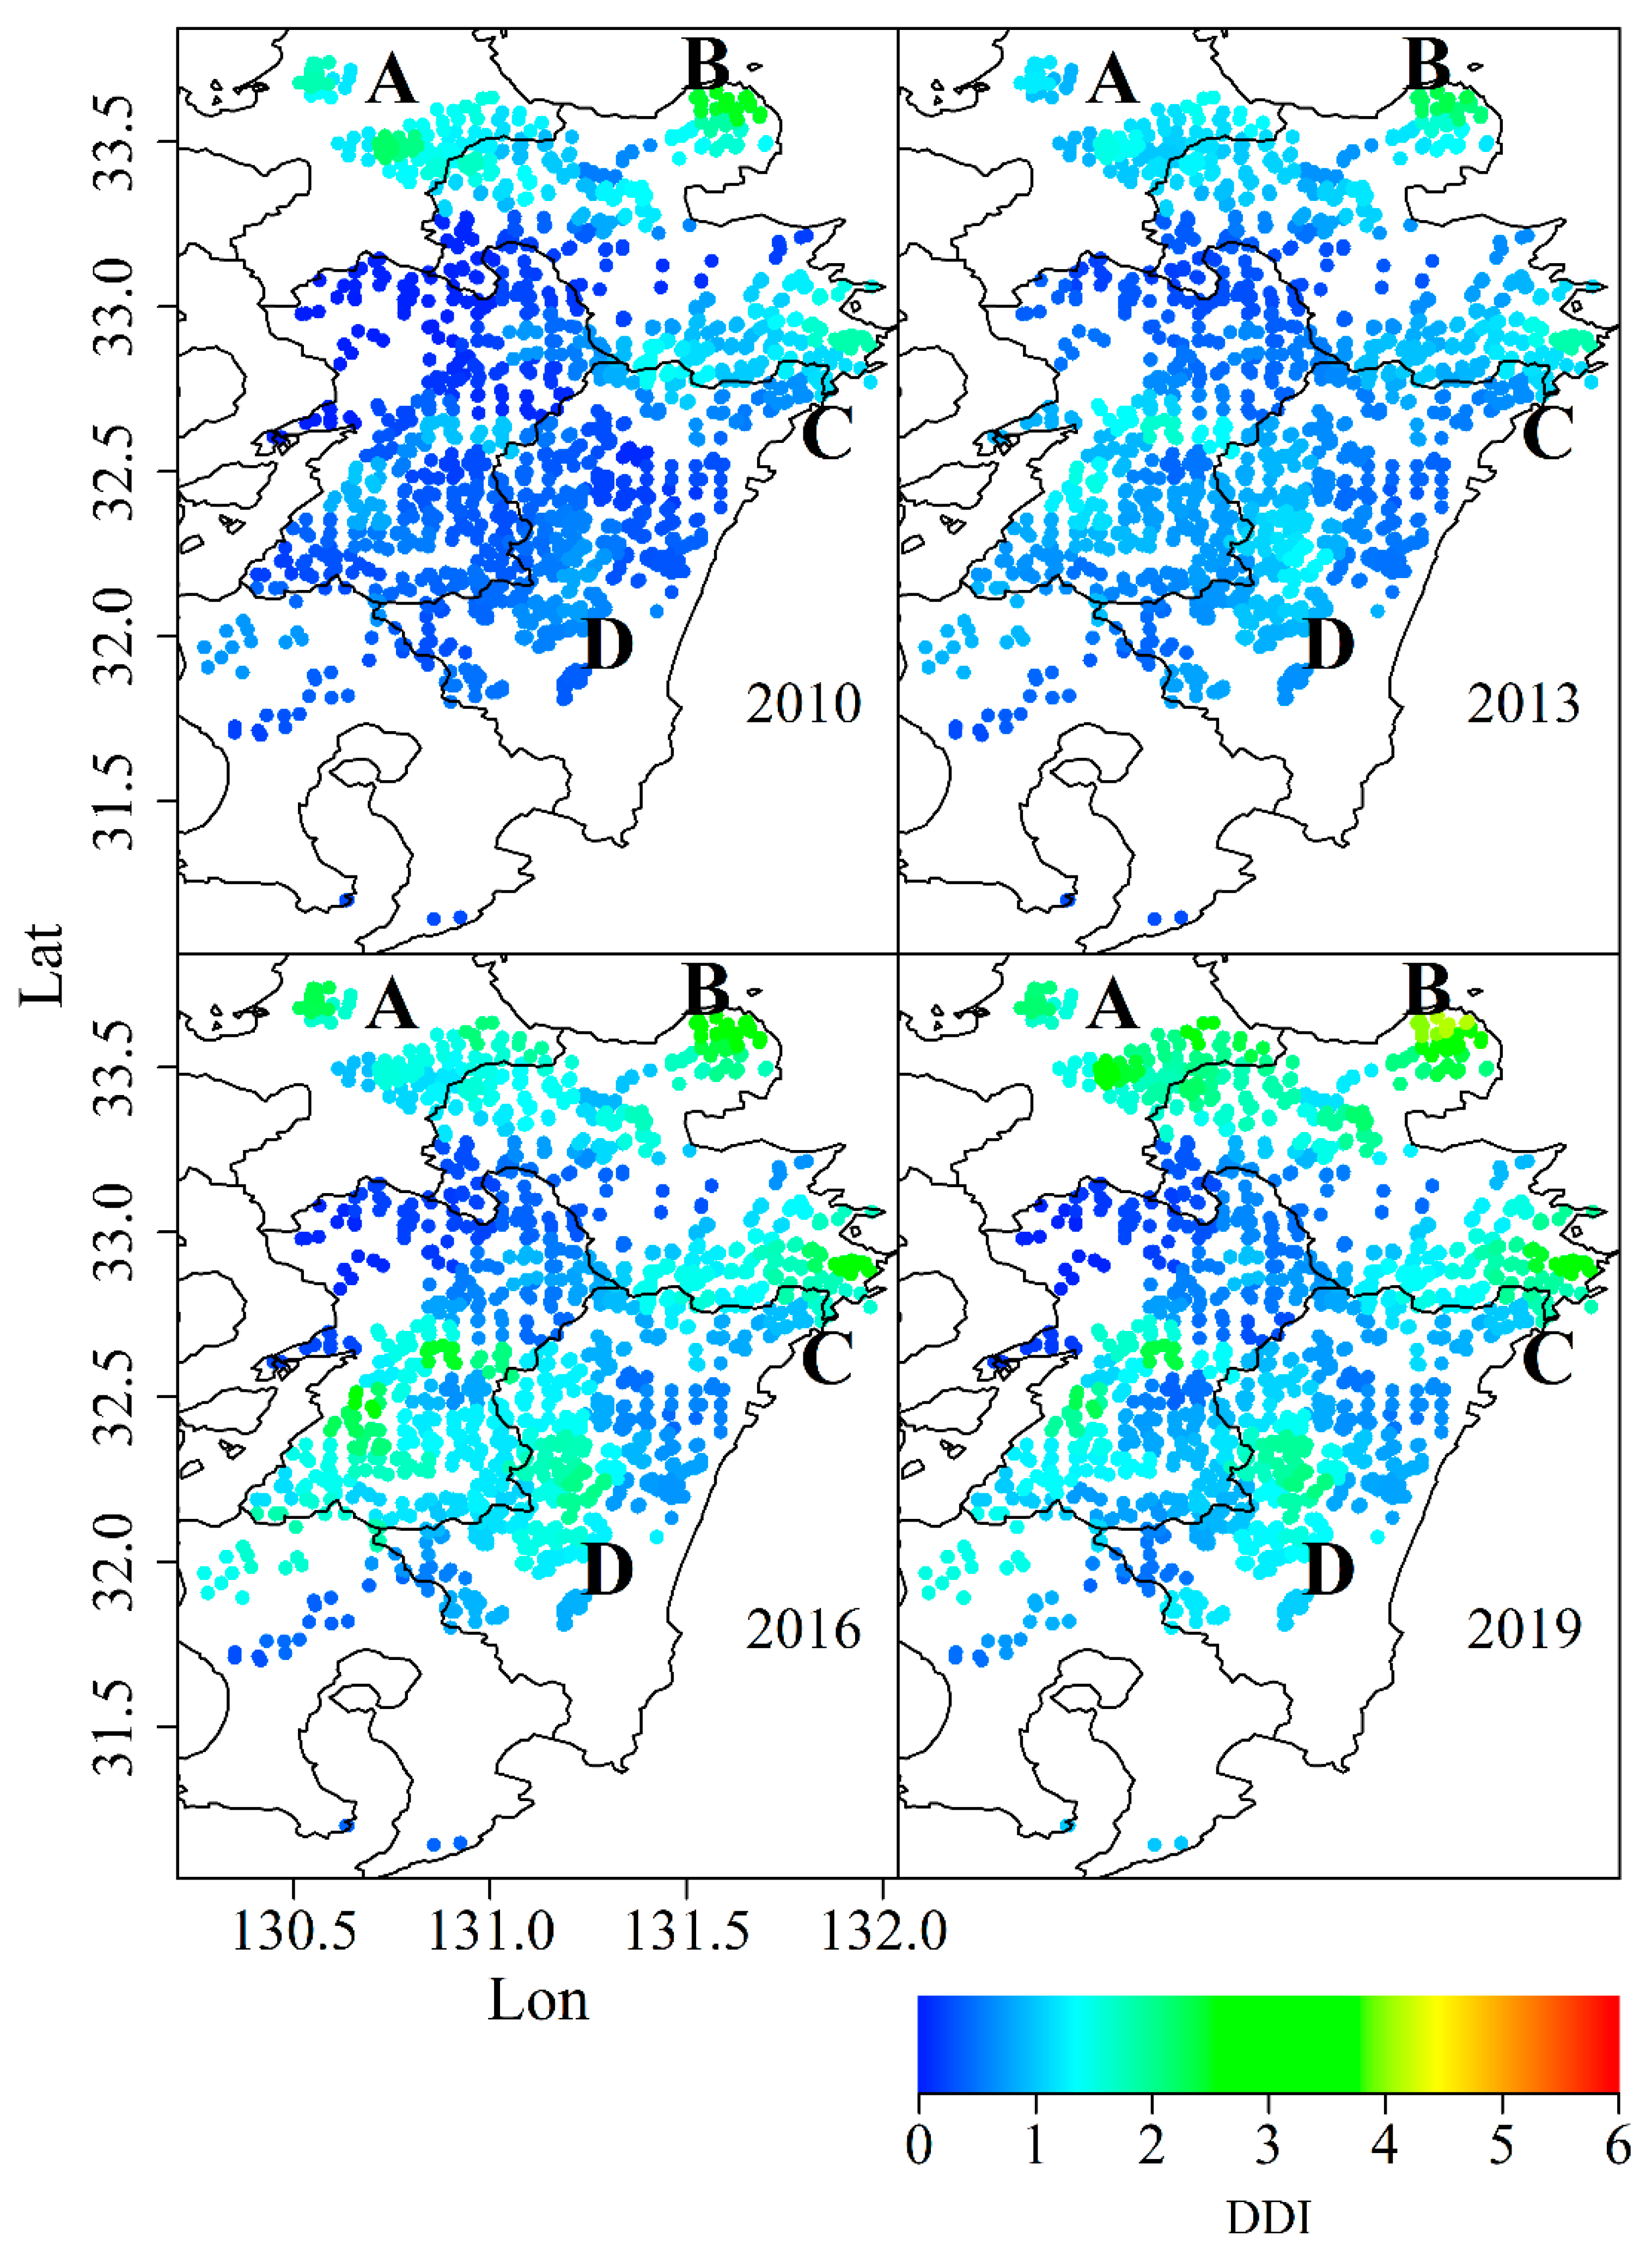
3.1. Spatio-Temporal Changes of Deer Density
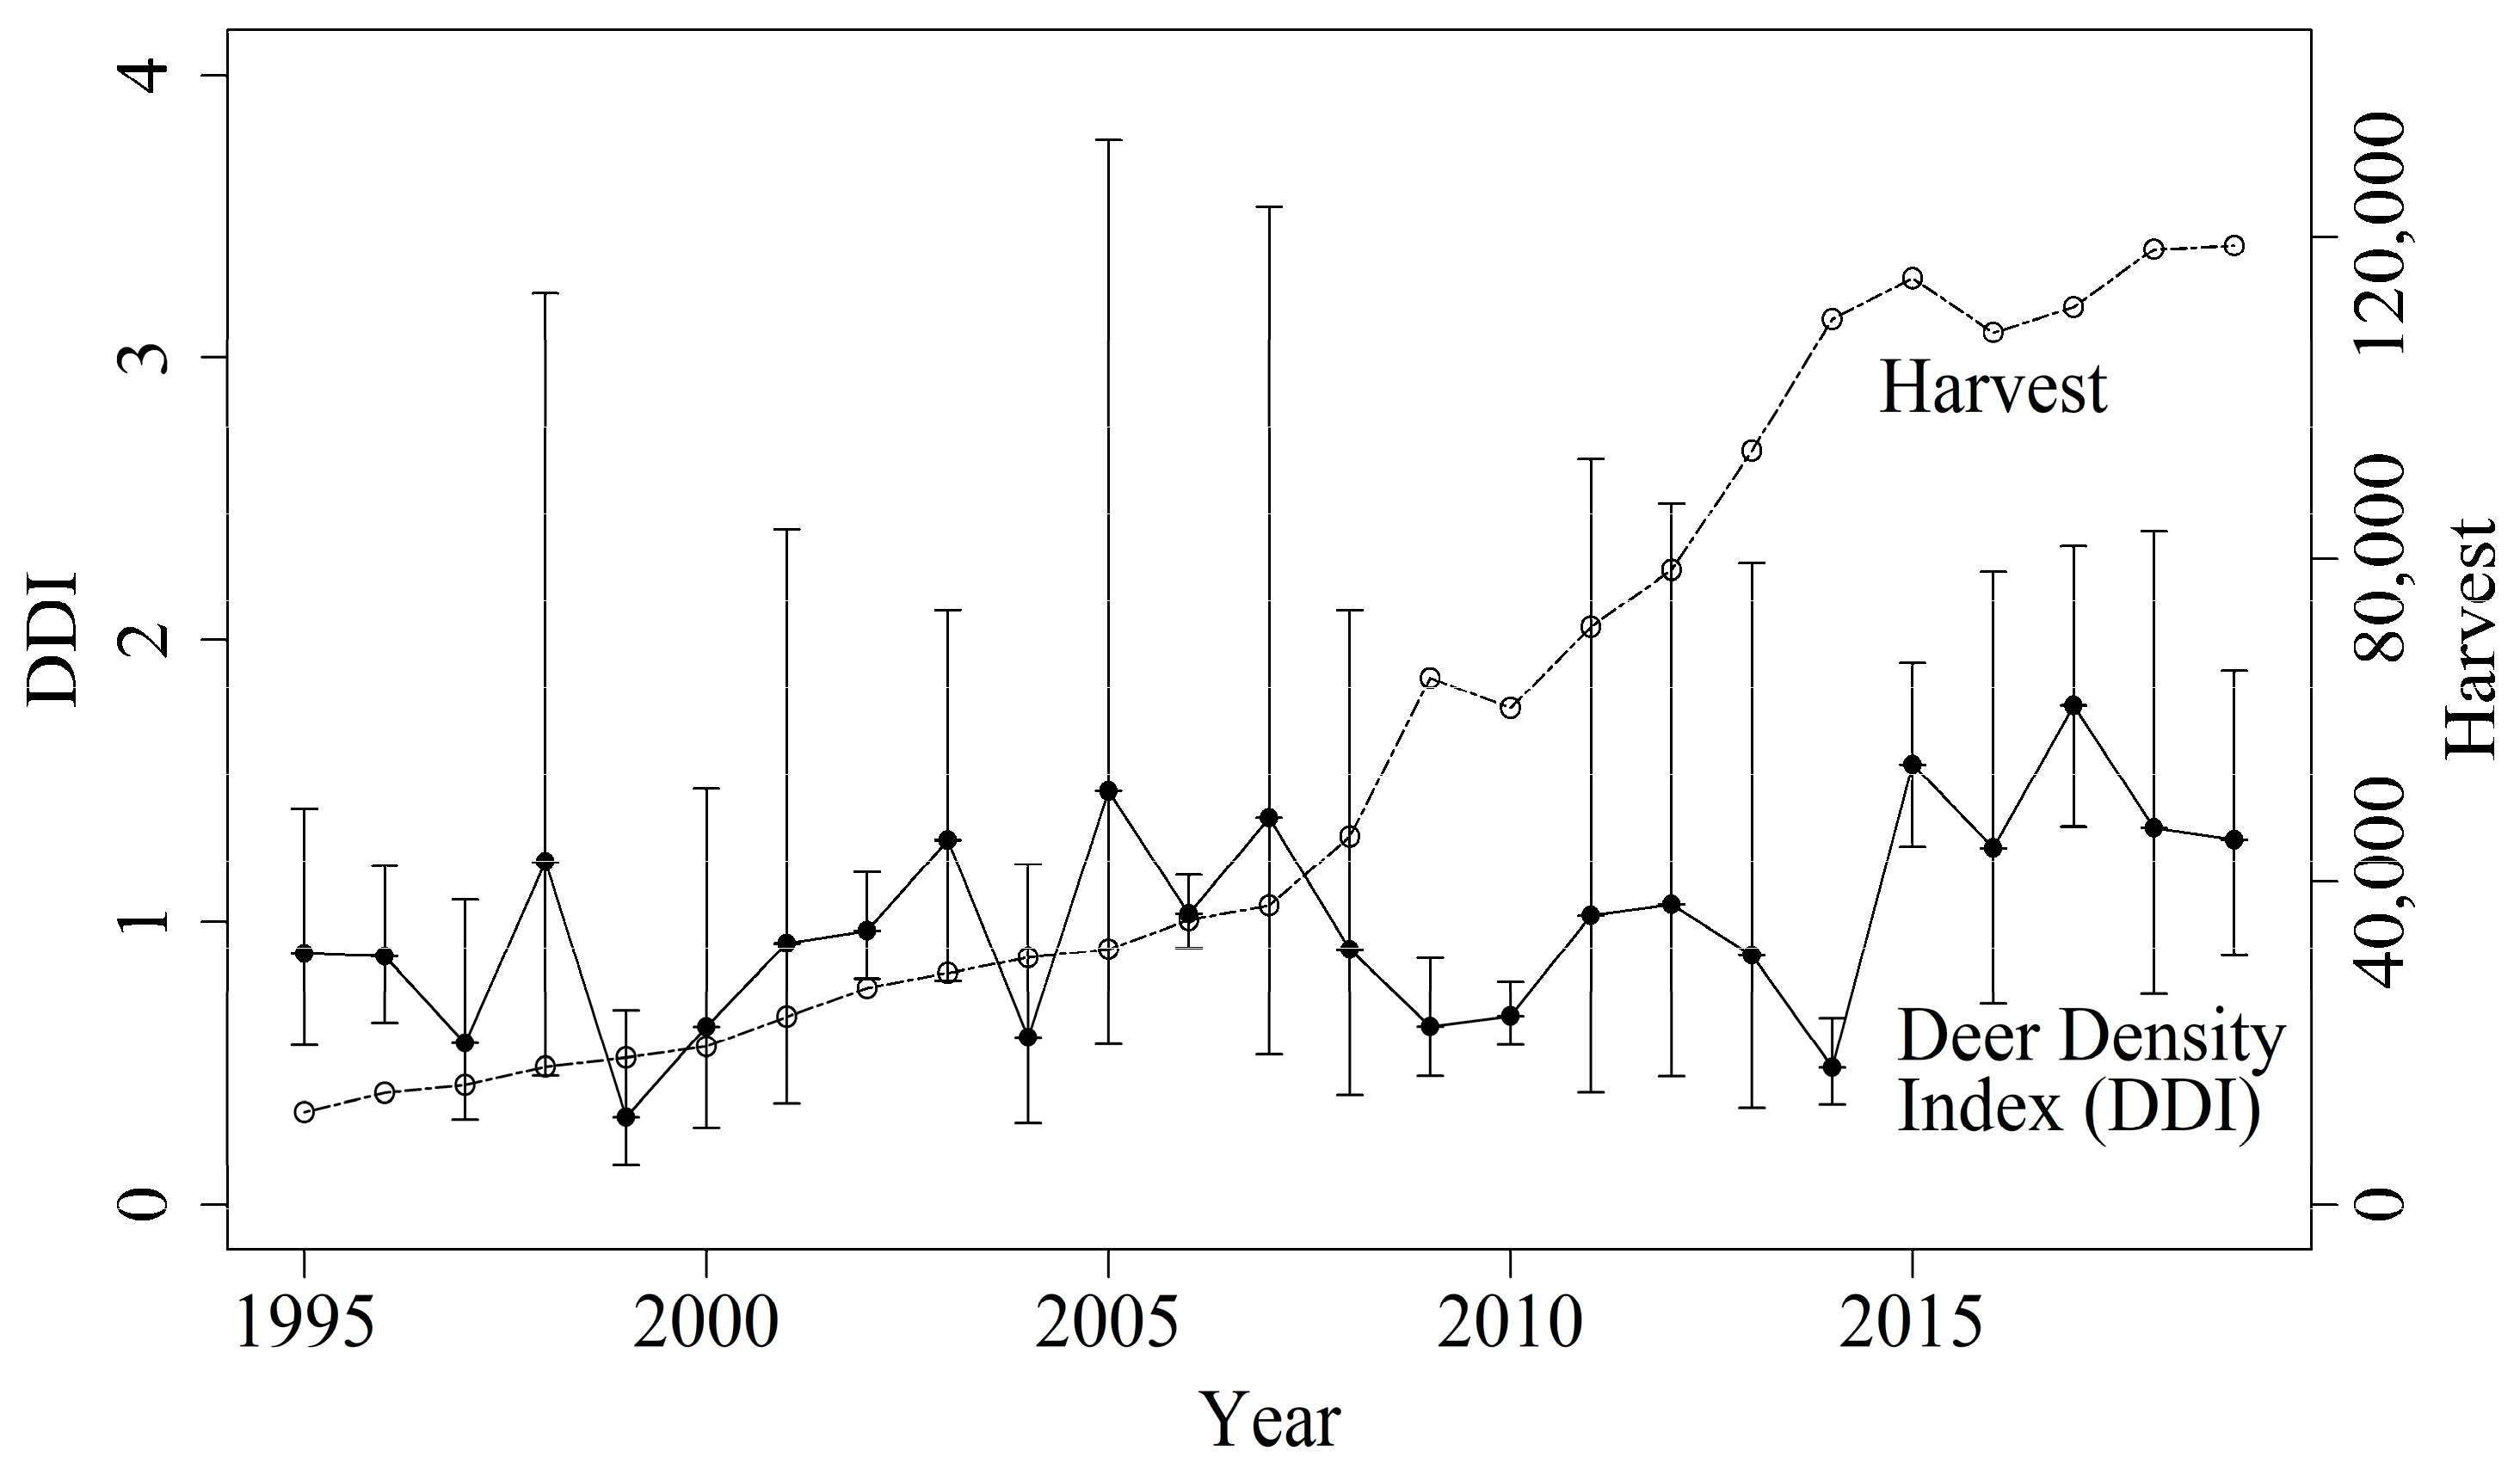
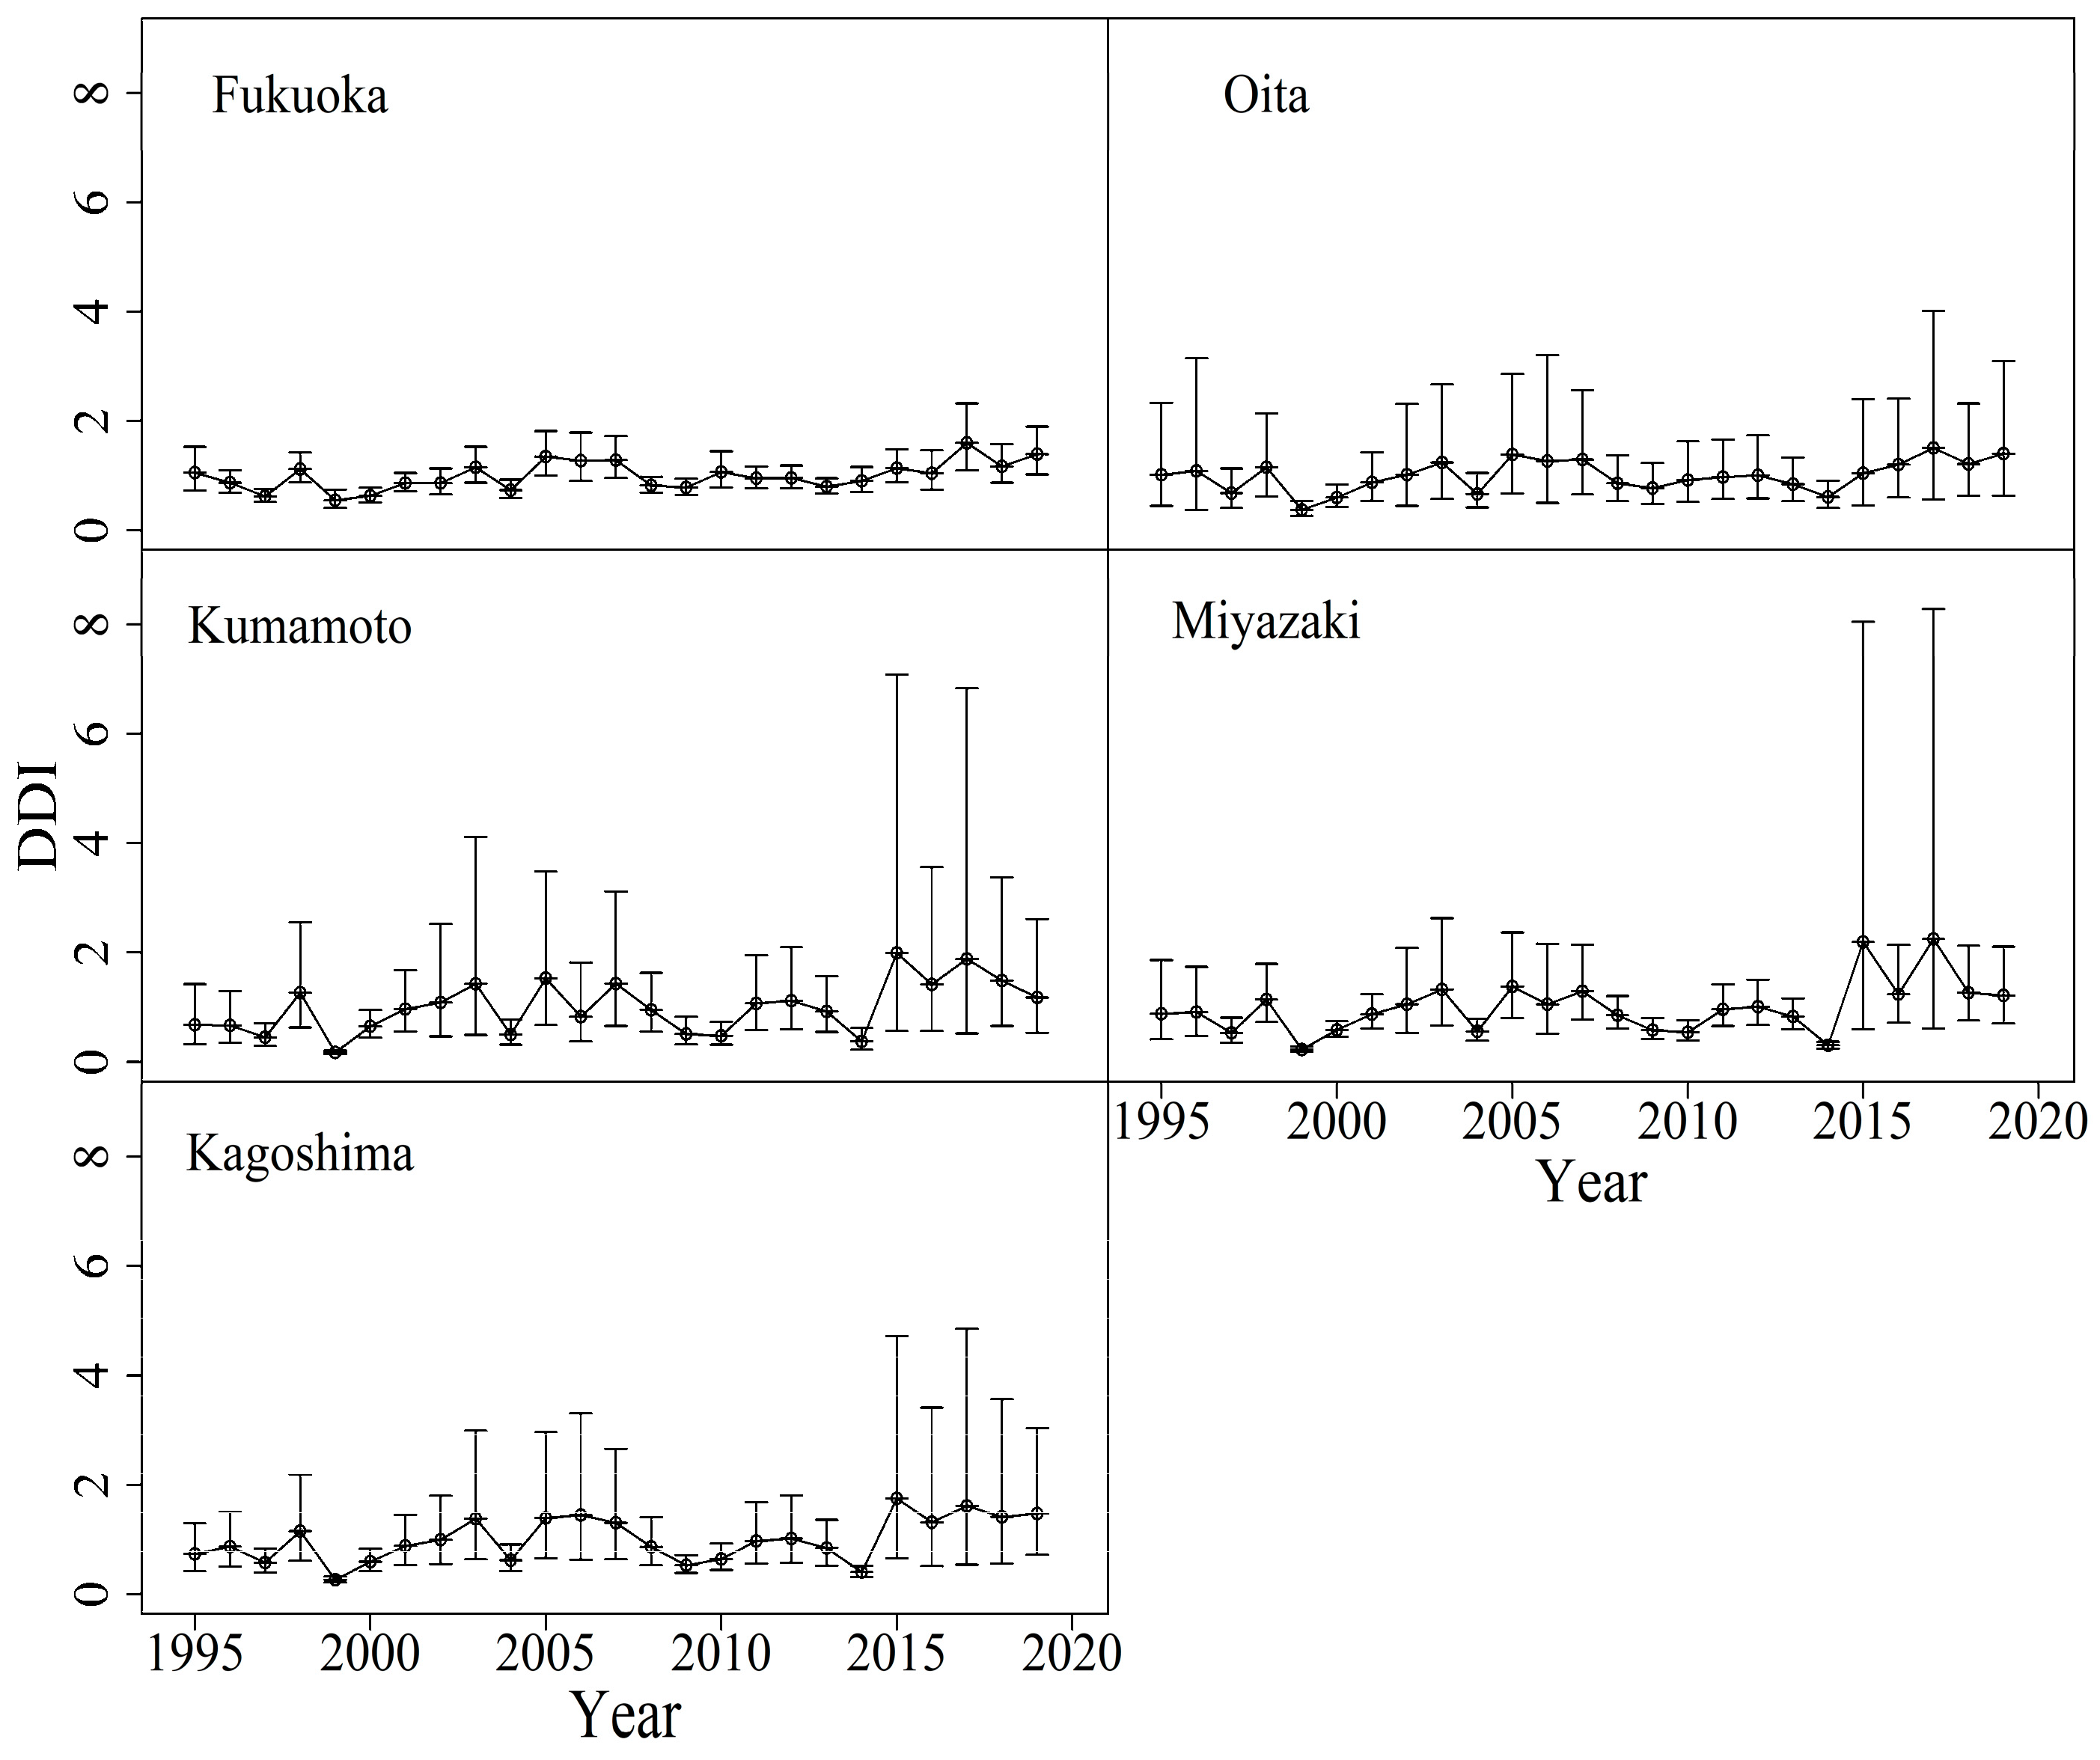
3.2. Population Dynamics of Sika Deer
4. Discussion
4.1. Spatio-Temporal Changes of Deer Density
4.2. Population Dynamics of Sika Deer
5. Conclusions
Supplementary Materials
Author Contributions
Funding
Data Availability Statement
Acknowledgments
Conflicts of Interest
Appendix A

| Year | Fukuoka | Oita | Kumamoto | Miyazaki | Kagoshima | |||||
|---|---|---|---|---|---|---|---|---|---|---|
| ED | NH | ED | NH | ED | NH | ED | NH | ED | NH | |
| 1995 | 21.9 | 255 | NA | 2867 | NA | 2078 | 16.9 | 4163 | NA | 2130 |
| 1996 | 21.5 | 365 | 30.5 | 3231 | NA | 2897 | 21.3 | 5057 | NA | 2303 |
| 1997 | 15.8 | 517 | NA | 3640 | NA | 3153 | 11.5 | 5178 | NA | 2328 |
| 1998 | 33.7 | 699 | NA | 4167 | NA | 3825 | NA | 5792 | NA | 2602 |
| 1999 | 14.5 | 791 | NA | 4516 | NA | 4335 | NA | 6050 | NA | 2951 |
| 2000 | 19.3 | 842 | NA | 5241 | NA | 5381 | NA | 4914 | NA | 3634 |
| 2001 | 18.5 | 961 | NA | 6150 | NA | 6837 | NA | 6465 | NA | 3334 |
| 2002 | 24.1 | 1241 | 29.3 | 8288 | 21.5 | 8266 | 16.3 | 5999 | NA | 3546 |
| 2003 | 21.9 | 1289 | NA | 6905 | 25.7 | 9775 | NA | 7422 | NA | 3848 |
| 2004 | 19.2 | 1297 | NA | 6935 | NA | 10,703 | NA | 8125 | NA | 4142 |
| 2005 | 29.3 | 1891 | NA | 6981 | NA | 10,608 | NA | 8112 | NA | 4558 |
| 2006 | 33.3 | 2237 | 33.0 | 8015 | 11.1 | 11,404 | 18.9 | 9197 | NA | 5012 |
| 2007 | 27.6 | 2485 | NA | 9389 | NA | 12,967 | NA | 7985 | NA | 4836 |
| 2008 | 23.5 | 2768 | NA | 12,910 | NA | 16,052 | NA | 9254 | NA | 5160 |
| 2009 | 19.2 | 3242 | NA | 19,723 | 7.2 | 16,730 | NA | 20,195 | NA | 6057 |
| 2010 | 37.2 | 3426 | 19.3 | 23,651 | 6.1 | 14,401 | NA | 13,705 | NA | 8522 |
| 2011 | 20.4 | 3914 | NA | 27,811 | NA | 14,952 | NA | 17,525 | NA | 10,381 |
| 2012 | 28.1 | 4315 | NA | 30,597 | NA | 16,073 | NA | 18,923 | NA | 13,951 |
| 2013 | 17.6 | 6539 | NA | 33,417 | NA | 17,762 | NA | 25,298 | NA | 15,944 |
| 2014 | 24.1 | 9077 | NA | 40,963 | 6.2 | 19,249 | NA | 27,992 | NA | 19,638 |
| 2015 | 18.7 | 9555 | 21.6 | 41,092 | NA | 19,470 | 34.7 | 28,467 | 22.4 | 24,212 |
| 2016 | 30.7 | 9273 | NA | 39,285 | NA | 17,427 | NA | 27,200 | 17.5 | 21,580 |
| 2017 | 32.2 | 10,166 | NA | 41,137 | NA | 17,360 | 35.2 | 26,467 | 19.1 | 21,819 |
| 2018 | 35.9 | 11,590 | NA | 41,576 | NA | 20,554 | NA | 28,932 | 23.4 | 22,244 |
| 2019 | NA | 10,932 | NA | 43,054 | 15.3 | 21,524 | NA | 27,537 | 14.7 | 23,019 |
References
- Gill, R.M.A. A review of damage by mammals in north temperate forests: 1. Deer. Forestry 1992, 65, 145–169. [Google Scholar] [CrossRef] [Green Version]
- Côté, S.D.; Rooney, T.P.; Tremblay, J.P.; Dussault, C.; Waller, D.M. Ecological impacts of deer overabundance. Annu. Rev. Ecol. Evol. Syst. 2004, 35, 113–147. [Google Scholar] [CrossRef] [Green Version]
- Putman, R.; Langbein, J.; Green, P.; Watson, P. Identifying threshold densities for wild deer in the UK above which negative impacts may occur. Mamm. Rev. 2011, 41, 175–196. [Google Scholar] [CrossRef]
- Anderson, R.C. Height of white-flowered trillium (Trillium grandiflorum) as an index of deer browsing intensity. Ecol. Appl. 1994, 4, 104–109. [Google Scholar] [CrossRef]
- Whigham, D.F. Ecology of woodland herbs in temperate deciduous forests. Annu. Rev. Ecol. Evol. Syst. 2004, 35, 583–621. [Google Scholar] [CrossRef] [Green Version]
- Ramirez, J.I.; Jansen, P.A.; Poorter, L. Effects of wild ungulates on the regeneration, structure and functioning of temperate forests: A semi-quantitative review. For. Ecol. Manag. 2018, 424, 406–419. [Google Scholar] [CrossRef]
- Tanentzap, A.J.; Burrows, L.E.; Lee, W.G.; Nugent, G.; Maxwell, J.M.; Coomes, D.A. Landscape-level vegetation recovery from herbivory: Progress after four decades of invasive red deer control. J. Appl. Ecol. 2009, 46, 1064–1072. [Google Scholar] [CrossRef]
- Harada, K.; Ann, J.A.M.; Suzuki, M. Legacy effects of sika deer overpopulation on ground vegetation and soil physical properties. For. Ecol. Manag. 2020, 474, 118346. [Google Scholar] [CrossRef]
- Putman, R.J.; Moore, N. Impact of deer in lowland Britain on agriculture, forestry and conservation habitats. Mamm. Rev. 1998, 28, 141–164. [Google Scholar] [CrossRef]
- Putman, R.J.; Apollonio, M.; Andersen, R. Ungulate Management in Europe: Problems and Practices; Cambridge University Press: Cambridge, UK, 2011. [Google Scholar]
- Apollonio, M.; Andersen, R.; Putman, R. European Ungulates and Their Management in the 21st Century; Cambridge University Press: Cambridge, UK, 2010. [Google Scholar]
- Hewitt, D.G. Biology and Management of White-Tailed Deer; CRC Press: Boca Raton, FL, USA, 2011. [Google Scholar]
- McCullough, D.R.; Takatsuki, S.; Kaji, K. Sika Deer: Biology and Management of Native and Introduced Populations; Springer: Tokyo, Japan, 2009. [Google Scholar]
- Pérez-Espona, S.; Pemberton, J.M.; Putman, R. Red and sika deer in the British Isles, current management issues and management policy. Mammal. Biol. 2009, 74, 247–262. [Google Scholar] [CrossRef]
- Walters, C.J.; Hilborn, R. Ecological optimization and adaptive management. Annu. Rev. Ecol. Evol. Syst. 1978, 9, 157–188. [Google Scholar] [CrossRef]
- Shea, K.; the NCEAS Working Group on Population Management. Management of populations in conservations, harvesting and control. Trends Ecol. Evol. 1998, 13, 371–375. [Google Scholar] [CrossRef]
- Westgate, M.J.; Likens, G.E.; Lindenmayer, D.B. Adaptive management of biological systems: A review. Biol. Conserv. 2013, 158, 128–139. [Google Scholar] [CrossRef]
- Vicente, J.; Apollonio, M.; Blanco-Aguiar, J.A.; Borowik, T.; Brivio, F.; Casaer, J.; Croft, S.; Ericsson, G.; Ferroglio, E.; Gavier-Widen, D.; et al. Science-based wildlife disease response. Science 2019, 364, 943–944. [Google Scholar] [CrossRef] [PubMed]
- Bhat, M.G.; Huffaker, R.G. Management of a transboundary wildlife population: A self–enforcing cooperative agreement with renegotiation and variable transfer payments. J. Environ. Econ. Manag. 2007, 53, 54–67. [Google Scholar] [CrossRef]
- Nathan, R.; Getz, W.M.; Revilla, E.; Holyak, M.; Kadmon, R.; Saltz, D.; Smouse, P.E. A movement ecology paradigm for unifying organismal movement research. Proc. Natl. Acad. Sci. USA 2008, 105, 19052–19059. [Google Scholar] [CrossRef] [Green Version]
- Abrahms, B.; Aikens, E.O.; Armstrong, J.B.; Deacy, W.W.; Kauffman, M.J.; Merkle, J.A. Emerging perspectives on resource tracking and animal movement ecology. Trends Ecol. Evol. 2021, 36, 308–320. [Google Scholar] [CrossRef]
- Allen, A.M.; Singh, N.J. Linking movement ecology with wildlife management and conservation. Front. Ecol. Evol. 2016, 3, 155. [Google Scholar] [CrossRef] [Green Version]
- Taylor, R.H.; Williams, R.M. The use of pellet counts for estimating the density of populations of the wild rabbit (Oryctolagus cuniculus L.). N. Z. J. Sci. Technol. B 1956, 38, 236–256. [Google Scholar]
- Iwamoto, T.; Sakata, T.; Nakazono, T.; Utaoka, H.; Ikeda, K.; Nishishita, Y.; Tsuneda, K.; Doi, T. Improvement of the pellet count method for the estimation of Sika deer density. Mammal. Sci. 2000, 40, 1–17. (In Japanese) [Google Scholar]
- Thorson, J.T.; Barnett, L.A.K. Comparing estimates of abundance trends and distribution shifts using single- and multispecies models of fishes and biogenic habitat. ICES J. Mar. Sci. 2017, 74, 1311–1321. [Google Scholar] [CrossRef]
- Thorson, J.T. Guidance for decisions using the Vector Autoregressive Spatio-Temporal (VAST) package in stock, ecosystem, habitat and climate assessments. Fish. Res. 2019, 210, 143–161. [Google Scholar] [CrossRef]
- Thorson, J.T.; Shelton, A.O.; Ward, E.J.; Skaug, H.J. Geostatistical delta-generalized linear mixed models improve precision for estimated abundance indices for West Coast groundfishes. ICES J. Mar. Sci. 2015, 72, 1297–1310. [Google Scholar] [CrossRef]
- James-Thorson-NOAA/VAST. Available online: https://github.com/James-Thorson-NOAA/VAST (accessed on 8 April 2022).
- Thorson, J.T.; Skaug, H.J.; Kristensen, K.; Shelton, A.O.; Ward, E.J.; Harms, J.H.; Benante, J.A. The importance of spatial models for estimating the strength of density dependence. Ecology 2014, 96, 1202–1212. [Google Scholar] [CrossRef] [PubMed]
- Brodie, S.J.; Thorson, J.T.; Carroll, G.; Hazen, E.L.; Bograd, S.; Haltuch, M.A.; Holsman, K.K.; Kotwicki, S.; Samhouri, J.F.; Willis-Norton, E.; et al. Trade-offs in covariate selection for species distribution models: A methodological comparison. Ecography 2020, 43, 11–24. [Google Scholar] [CrossRef] [Green Version]
- Kanamori, Y.; Takasuka, A.; Nishijima, S.; Okamura, H. Climate change shifts the spawning ground northward and extends the spawning period of chub mackerel in the western North Pacific. Mar. Ecol. Prog. Ser. 2019, 624, 155–166. [Google Scholar] [CrossRef] [Green Version]
- Dolder, P.J.; Thorson, J.T.; Minto, C. Spatial separation of catches in highly mixed fisheries. Sci. Rep. 2018, 8, 13886. [Google Scholar] [CrossRef]
- Xu, H.; Lennert-Cody, C.E.; Maunder, M.; Minte-Vera, C.V. Spatiotemporal dynamics of the dolphin-associated purse-seine fishery for yellowfin tuna (Thunnus albacares) in the eastern Pacific Ocean. Fish. Res. 2019, 213, 121–131. [Google Scholar] [CrossRef]
- Lindgren, F. Continuous domain spatial models in R-INLA. ISBA Bull. 2012, 19, 14–20. [Google Scholar]
- The R Project for Statistical Computing. Available online: https://www.R-project.org/ (accessed on 8 April 2022).
- Ohashi, H.; Yoshikawa, M.; Oono, K.; Tanaka, N.; Hatase, Y.; Murakami, Y. The impact of sika deer on vegetation in Japan: Setting management priorities on a national scale. Environ. Manag. 2014, 54, 631–640. [Google Scholar] [CrossRef]
- Suzuki, K.K.; Watanabe, Y.; Kubota, T.; Kuwano, Y.; Kawauchi, Y.; Yamagawa, H.; Yasuda, M.; Kondoh, H.; Nomiya, H.; Oka, T. Large-scale spatial distribution of deer browsing damage to young tree plantations. iForest 2021, 14, 34–40. [Google Scholar] [CrossRef]
- Ward, A.I.; White, P.C.L.; Walker, N.J.; Critchley, C.H. Conifer leader browsing by roe deer in English upland forests: Effects of deer density and understory vegetation. For. Ecol. Manag. 2008, 256, 1333–1338. [Google Scholar] [CrossRef]
- Ijima, H.; Fujimaki, A.; Ohta, U.; Yamamura, K.; Yokomizo, H.; Uno, H.; Matsuda, H. Efficient management for the Hokkaido population of sika deer Cervus nippon in Japan: Accounting for migration and management cost. Popul. Ecol. 2015, 57, 397–408. [Google Scholar] [CrossRef]
- Yamamura, K.; Matsuda, H.; Yokomizo, H.; Kaji, K.; Uno, H.; Tamada, K.; Kurumada, T.; Saitoh, T.; Hirakawa, H. Harvest-based Bayesian estimation of sika deer populations using state-space models. Popul. Ecol. 2008, 50, 131–144. [Google Scholar] [CrossRef]
- Kilpatrick, H.J.; Walter, W.D.A. Controlled archery deer hunt in a residential community: Cost, effectiveness, and deer recovery rates. Wildl. Soc. Bull. 1999, 27, 115–123. [Google Scholar]
- Hagen, R.; Hayden, A.; Suchant, R. Estimating red deer (Cervus elaphus) population size in the Southern Black Forest: The role of hunting in population control. Eur. J. Wildl. Res. 2018, 64, 42. [Google Scholar] [CrossRef]
- Mizuki, I.; Itô, H.; Yamasaki, M.; Fukumoto, S.; Okamoto, Y.; Katsuki, M.; Fukushima, K.; Sakai, M.; Sakaguchi, S.; Fujiki, D.; et al. Seasonal and annual fluctuations of deer populations estimated by a Bayesian state–space model. PLoS ONE 2020, 15, e0225872. [Google Scholar] [CrossRef]
- Kaji, K.; Okada, H.; Yamanaka, M.; Matsuda, H.; Yabe, T. Irruption of a colonizing sika deer population. J. Wildl. Manag. 2004, 68, 889–899. [Google Scholar] [CrossRef]
- Drastic Measures to Strengthen the Capture of Birds and Animals. Available online: https://www.env.go.jp/nature/choju/effort/effort9/kyouka.pdf (accessed on 8 April 2022).
- Data 1-2 Results of Estimation and Prediction of Sika Deer Population. Available online: https://www.env.go.jp/press/files/jp/26912.pdf (accessed on 8 April 2022).
- Matsuda, H.; Uno, H.; Tamada, K.; Kaji, K.; Saitoh, T.; Hirakawa, H.; Kurumada, T.; Fujimoto, T. Harvest-based estimation of population size for sika deer on Hokkaido Island, Japan. Wildl. Soc. Bull. 2002, 30, 1160–1171. [Google Scholar]
- Giles, B.G.; Findlay, C.S. Effectiveness of a selective harvest system in regulating deer populations in Ontario. J. Wildl. Manag. 2004, 68, 266–277. [Google Scholar] [CrossRef]
- Bengsen, A.J.; Forsyth, D.M.; Harris, S.; Latham, A.D.M.; McLeod, S.R.; Pople, A. A systematic review of ground-based shooting to control overabundant mammal populations. Wildl. Res. 2020, 47, 197–207. [Google Scholar] [CrossRef]
- Walters, C.; Maguire, J.-J. Lessons for stock assessment from the northern cod collapse. Rev. Fish Biol. Fish. 1996, 6, 125–137. [Google Scholar] [CrossRef]
- Adaptive Management: A Tool for Conservation Practitioners. Biodiversity Support Program. Available online: https://fosonline.org/library/am-tool/ (accessed on 8 April 2022).
- Kaji, K.; Saitoh, T.; Uno, H.; Matsuda, H.; Yamamura, K. Adaptive management of sika deer populations in Hokkaido, Japan: Theory and practice. Popul. Ecol. 2010, 52, 373–387. [Google Scholar] [CrossRef]
- Williams, B.K. Adaptive management of natural resources—Framework and issues. J. Environ. Manag. 2011, 92, 1346–1353. [Google Scholar] [CrossRef]
- Fattorini, N.; Lovari, S.; Watson, P.; Putman, R. The scale-dependent effectiveness of wildlife management: A case study on British deer. J. Environ. Manag. 2020, 276, 111303. [Google Scholar] [CrossRef] [PubMed]
- Swihart, R.K.; Caudell, J.N.; Brook, J.M.; Ma, Z. A flexible model-based approach to delineate wildlife management unit. Wildl. Soc. Bull. 2020, 44, 77–85. [Google Scholar] [CrossRef]
- Suzuki, K.K.; Yasuda, M.; Sonoda, M. Spatially biased reduction of browsing damage by sika deer through culling. J. Wildl. Manag. 2022, in press. [CrossRef]
| Prefecture | Number of Sites | Number of Surveys |
|---|---|---|
| Fukuoka | 105 | 878 |
| Oita | 517 | 588 |
| Kumamoto | 441 | 811 |
| Miyazaki | 482 | 837 |
| Kagoshima | 42 | 165 |
Publisher’s Note: MDPI stays neutral with regard to jurisdictional claims in published maps and institutional affiliations. |
© 2022 by the authors. Licensee MDPI, Basel, Switzerland. This article is an open access article distributed under the terms and conditions of the Creative Commons Attribution (CC BY) license (https://creativecommons.org/licenses/by/4.0/).
Share and Cite
Suzuki, K.K.; Kuwano, Y.; Kanamori, Y.; Kawauchi, Y.; Uchimura, Y.; Yasuda, M.; Kondoh, H.; Oka, T. A 25-Year Study of the Population Dynamics of a Harvested Population of Sika Deer on Kyushu Island, Japan. Forests 2022, 13, 760. https://doi.org/10.3390/f13050760
Suzuki KK, Kuwano Y, Kanamori Y, Kawauchi Y, Uchimura Y, Yasuda M, Kondoh H, Oka T. A 25-Year Study of the Population Dynamics of a Harvested Population of Sika Deer on Kyushu Island, Japan. Forests. 2022; 13(5):760. https://doi.org/10.3390/f13050760
Chicago/Turabian StyleSuzuki, Kei K., Yasumitsu Kuwano, Yuki Kanamori, Yohei Kawauchi, Yoshihiko Uchimura, Masatoshi Yasuda, Hiroshi Kondoh, and Teruki Oka. 2022. "A 25-Year Study of the Population Dynamics of a Harvested Population of Sika Deer on Kyushu Island, Japan" Forests 13, no. 5: 760. https://doi.org/10.3390/f13050760
APA StyleSuzuki, K. K., Kuwano, Y., Kanamori, Y., Kawauchi, Y., Uchimura, Y., Yasuda, M., Kondoh, H., & Oka, T. (2022). A 25-Year Study of the Population Dynamics of a Harvested Population of Sika Deer on Kyushu Island, Japan. Forests, 13(5), 760. https://doi.org/10.3390/f13050760