
Forest Area, CO2 Emission, and COVID-19 Case-Fatality Rate: A Worldwide Ecological Study Using Spatial Regression Analysis


Abstract
:1. Introduction
2. Materials and Methods
2.1. Data Sources
2.2. Case-Fatality Rate (CFR)
2.3. Statistical Analyses
3. Results
3.1. Descriptive Characteristics of the Variables
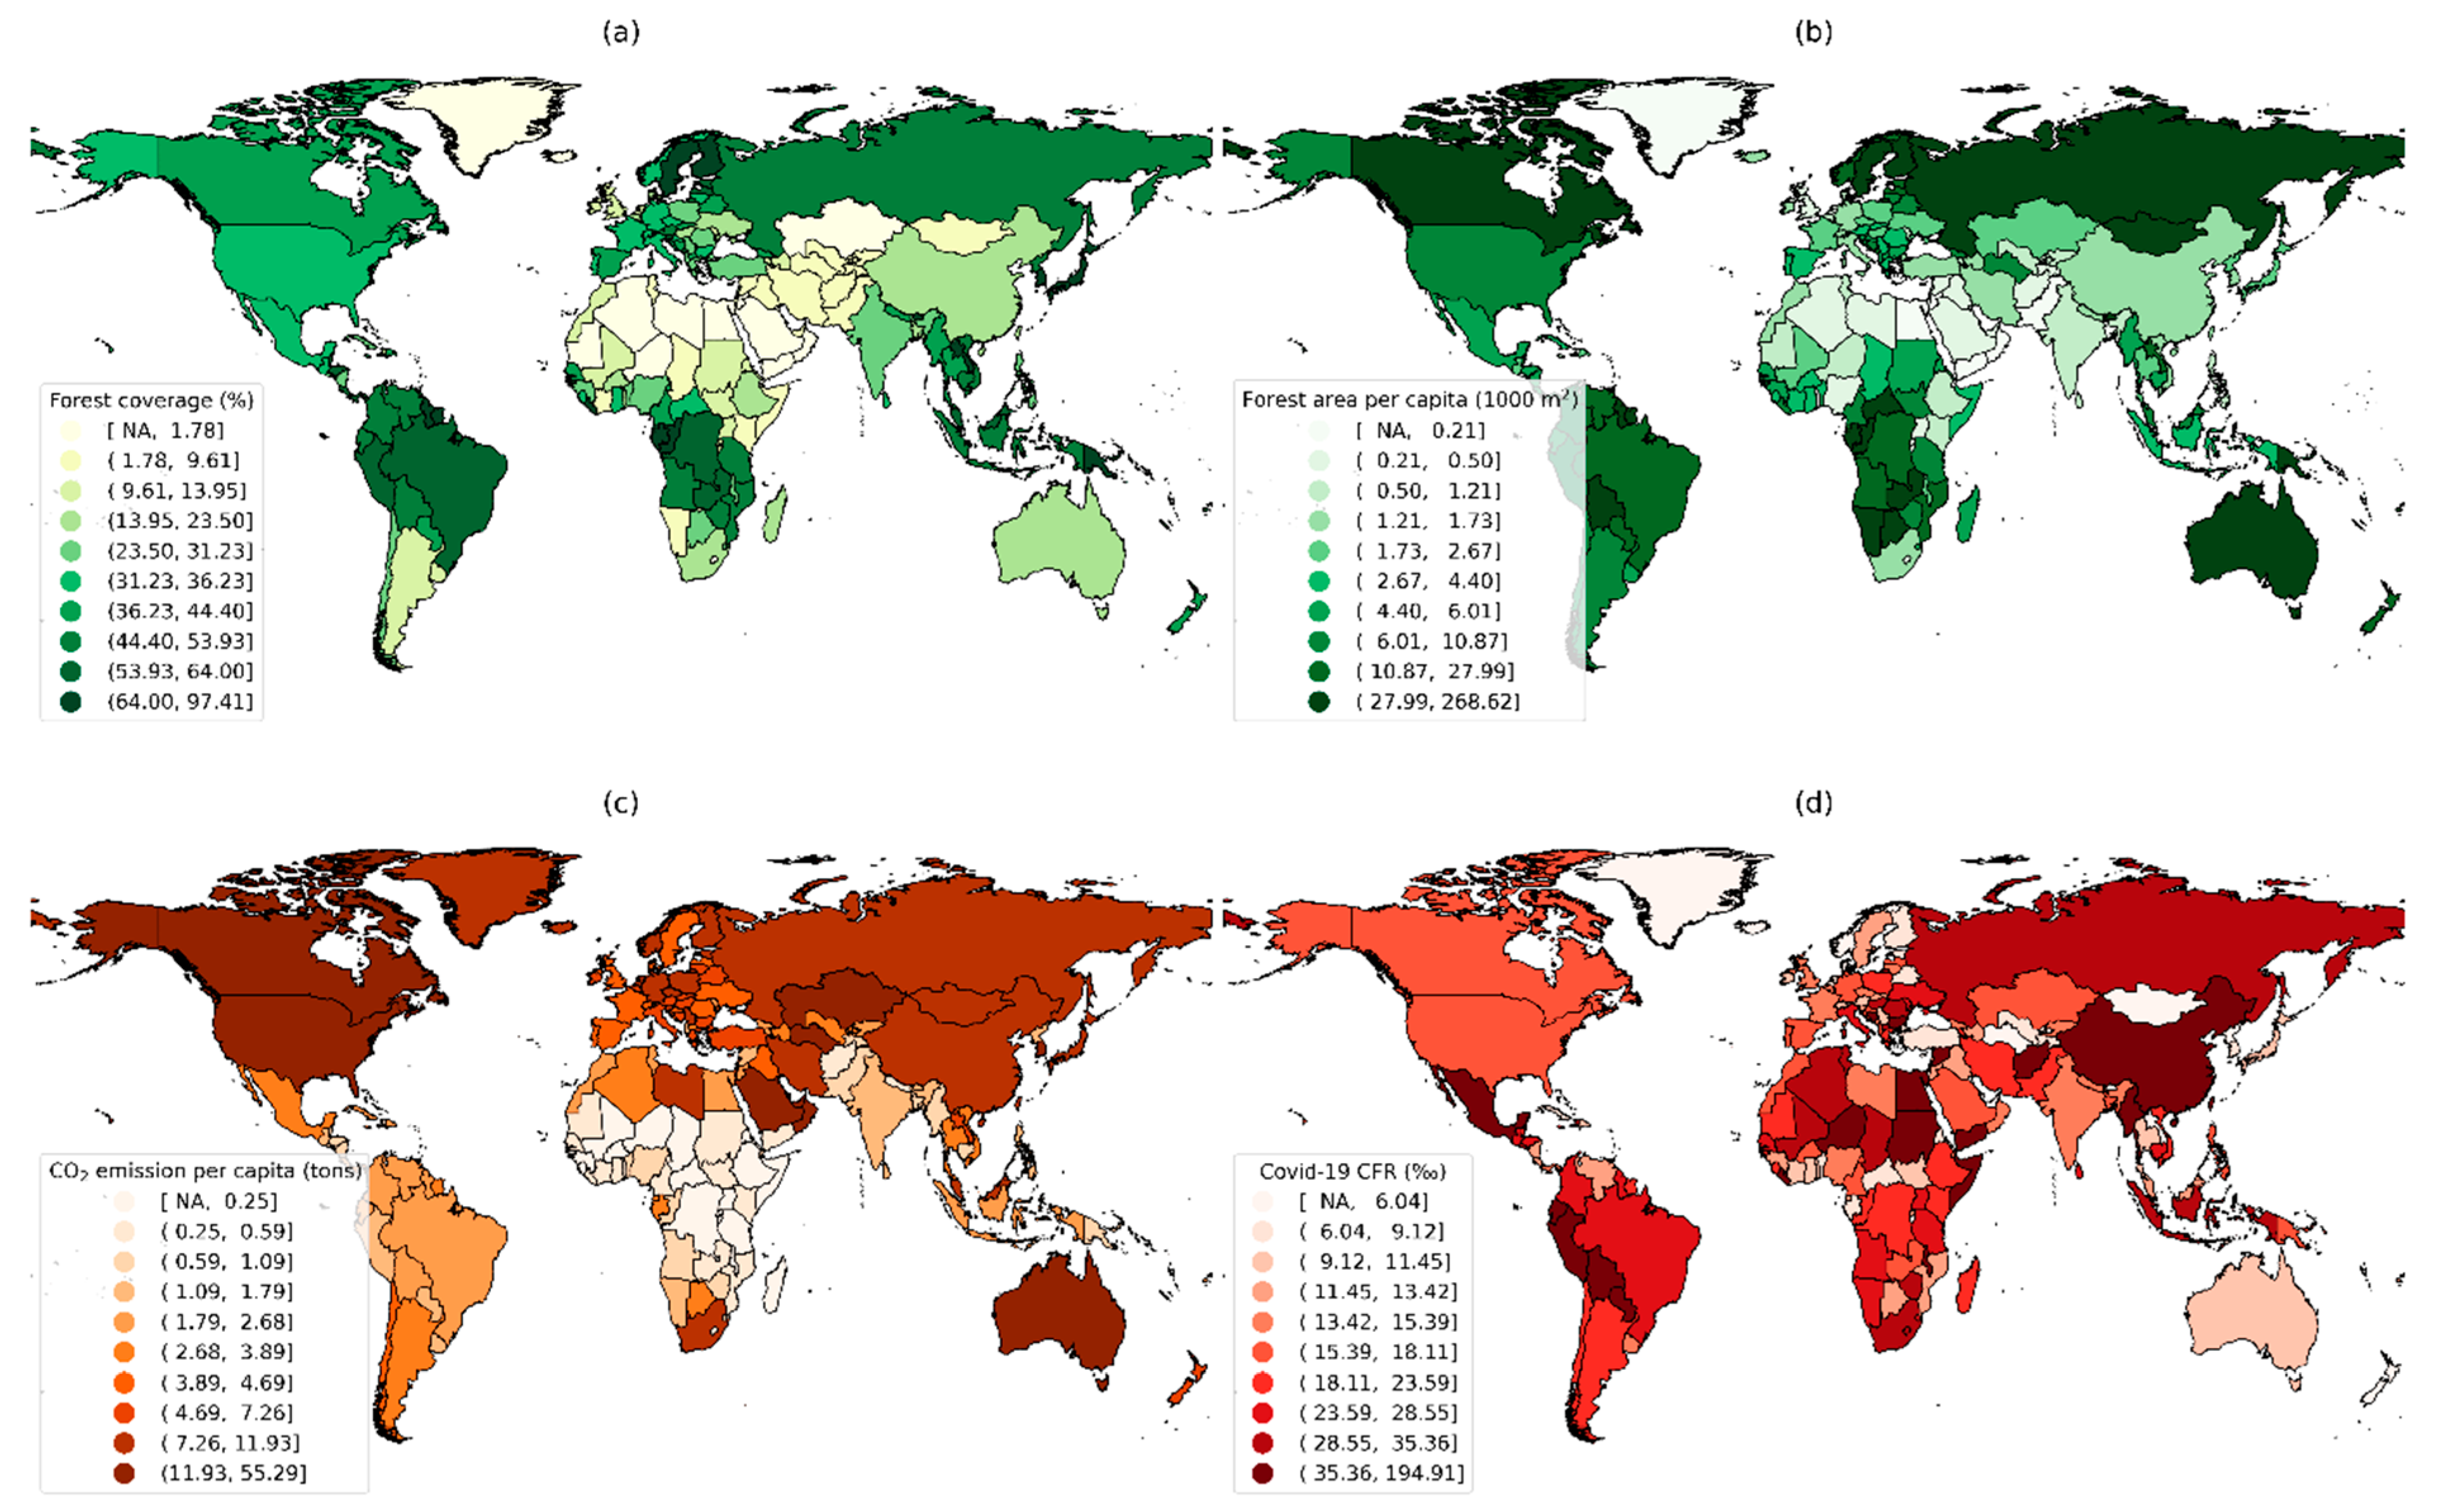
3.2. Worldwide Distributions of Forest, CO2 Emission, and COVID-19 CFR
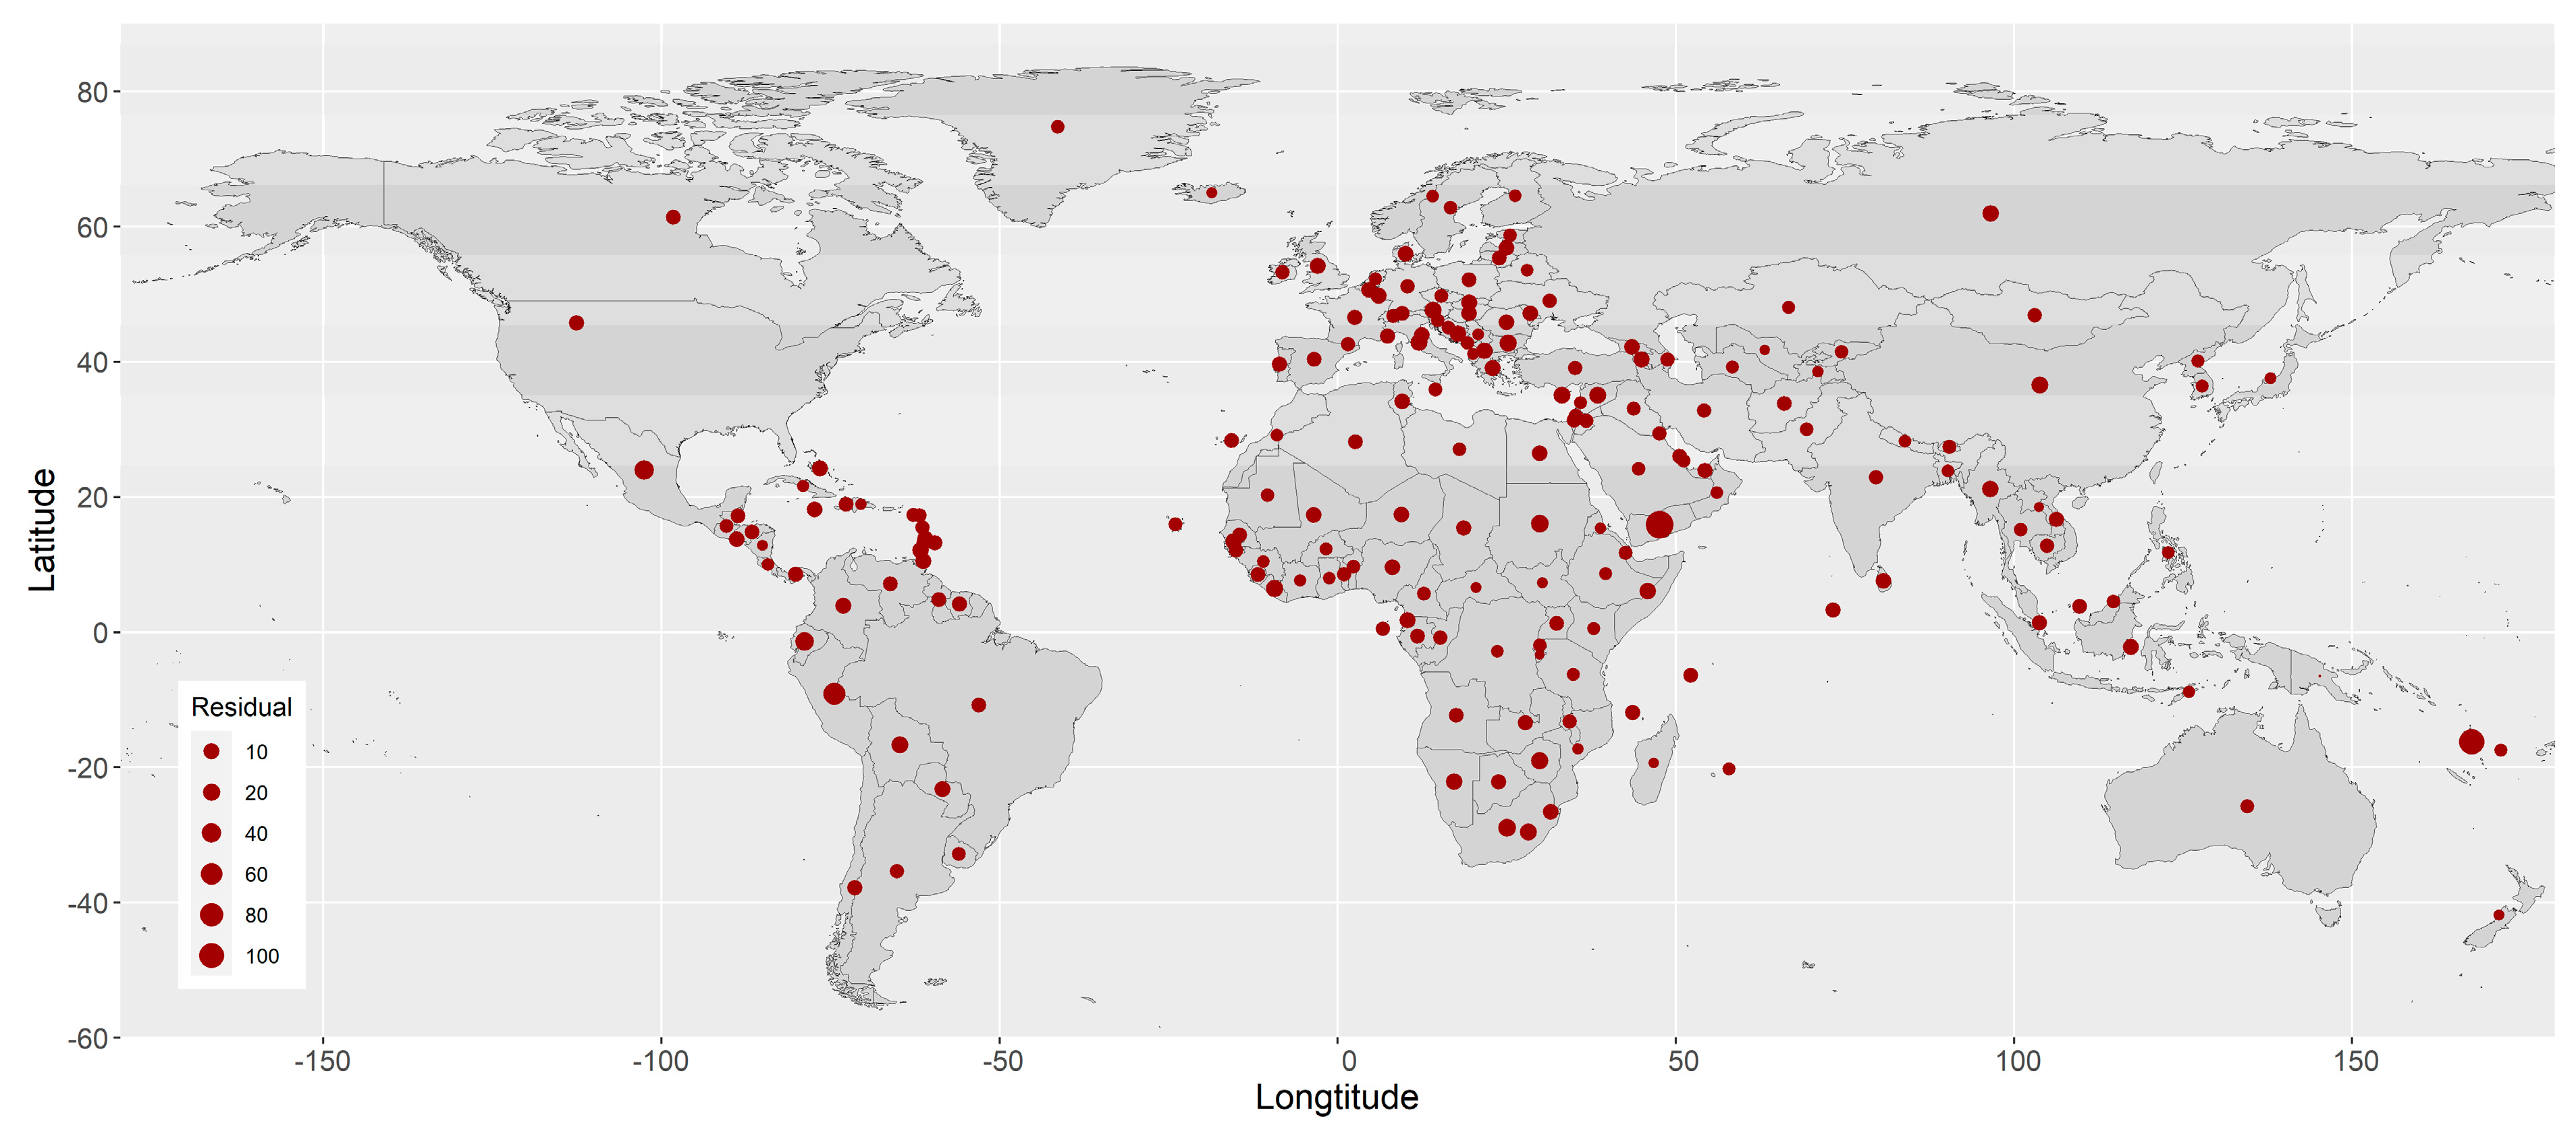
3.3. Spatial Autocorrelation of the COVID-19 CFR
3.4. Association of Ecological and Socioeconomic Variables with COVID-19 CFR
4. Discussion
4.1. Forest Coverage and COVID-19 CFR
4.2. CO2 Emission and COVID-19 CFR
4.3. Limitations
5. Conclusions
Supplementary Materials
Author Contributions
Funding
Conflicts of Interest
References
- Cucinotta, D.; Vanelli, M. WHO Declares COVID-19 a Pandemic. Acta Biomed. Atenei Parm. 2020, 91, 157–160. [Google Scholar] [CrossRef]
- WHO. COVID-19 Public Health Emergency of International Concern (PHEIC) Global Research and Innovation Forum. Available online: https://www.who.int/publications/m/item/covid-19-public-health-emergency-of-international-concern-(pheic)-global-research-and-innovation-forum (accessed on 2 February 2022).
- Gorbalenya, A.E.; Baker, S.C.; Baric, R.S.; de Groot, R.J.; Drosten, C.; Gulyaeva, A.A.; Haagmans, B.L.; Lauber, C.; Leontovich, A.M.; Neuman, B.W.; et al. The species Severe acute respiratory syndrome-related coronavirus: Classifying 2019-nCoV and naming it SARS-CoV-2. Nat. Microbiol. 2020, 5, 536–544. [Google Scholar] [CrossRef] [Green Version]
- Li, C.; Ji, F.; Wang, L.; Wang, L.; Hao, J.; Dai, M.; Liu, Y.; Pan, X.; Fu, J.; Li, L.; et al. Asymptomatic and Human-to-Human Transmission of SARS-CoV-2 in a 2-Family Cluster, Xuzhou, China. Emerg. Infect. Dis. 2020, 26, 1626–1628. [Google Scholar] [CrossRef]
- Habib, Y.; Xia, E.; Fareed, Z.; Hashmi, S.H. Time–Frequency co-movement between COVID-19, crude oil prices, and atmospheric CO2 emissions: Fresh global insights from partial and multiple coherence approach. Environ. Dev. Sustain. 2021, 23, 9397–9417. [Google Scholar] [CrossRef] [PubMed]
- Worldometer. COVID-19 CORONAVIRUS PANDEMIC. Available online: https://www.worldometers.info/coronavirus/ (accessed on 2 February 2022).
- Wang, Q.; Dong, W.; Yang, K.; Ren, Z.; Huang, D.; Zhang, P.; Wang, J. Temporal and spatial analysis of COVID-19 transmission in China and its influencing factors. Int. J. Infect. Dis. 2021, 105, 675–685. [Google Scholar] [CrossRef] [PubMed]
- Kang, D.; Choi, H.; Kim, J.H.; Choi, J. Spatial epidemic dynamics of the COVID-19 outbreak in China. Int. J. Infect. Dis. IJID Off. Publ. Int. Soc. Infect. Dis. 2020, 94, 96–102. [Google Scholar] [CrossRef]
- Raymundo, C.E.; Oliveira, M.C.; de Araujo Eleuterio, T.; André, S.R.; da Silva, M.G.; da Silva Queiroz, E.R.; de Andrade Medronho, R. Spatial analysis of COVID-19 incidence and the sociodemographic context in Brazil. PLoS ONE 2021, 16, e0247794. [Google Scholar] [CrossRef]
- Sun, Y.; Hu, X.; Xie, J. Spatial inequalities of COVID-19 mortality rate in relation to socioeconomic and environmental factors across England. Sci. Total Environ. 2021, 758, 143595. [Google Scholar] [CrossRef]
- Paul, R.; Adeyemi, O.; Ghosh, S.; Pokhrel, K.; Arif, A.A. Dynamics of COVID-19 mortality and social determinants of health: A spatiotemporal analysis of exceedance probabilities. Ann. Epidemiol. 2021, 62, 51–58. [Google Scholar] [CrossRef]
- Francetic, I.; Munford, L. Corona and coffee on your commute: A spatial analysis of COVID-19 mortality and commuting flows in England in 2020. Eur. J. Public Health 2021, 31, 901–907. [Google Scholar] [CrossRef]
- Konstantinoudis, G.; Padellini, T.; Bennett, J.; Davies, B.; Ezzati, M.; Blangiardo, M. Long-term exposure to air-pollution and COVID-19 mortality in England: A hierarchical spatial analysis. Environ. Int. 2021, 146, 106316. [Google Scholar] [CrossRef] [PubMed]
- Bossak, B.H.; Andritsch, S. COVID-19 and Air Pollution: A Spatial Analysis of Particulate Matter Concentration and Pandemic-Associated Mortality in the US. Int. J. Environ. Res. Public Health 2022, 19, 592. [Google Scholar] [CrossRef] [PubMed]
- Yue, H.; Hu, T. Geographical Detector-Based Spatial Modeling of the COVID-19 Mortality Rate in the Continental United States. Int. J. Environ. Res. Public Health 2021, 18, 6832. [Google Scholar] [CrossRef] [PubMed]
- Franch-Pardo, I.; Napoletano, B.M.; Rosete-Verges, F.; Billa, L. Spatial analysis and GIS in the study of COVID-19. A review. Sci. Total Environ. 2020, 739, 140033. [Google Scholar] [CrossRef] [PubMed]
- Pichlerová, M.; Önkal, D.; Bartlett, A.; Výbošťok, J.; Pichler, V. Variability in Forest Visit Numbers in Different Regions and Population Segments before and during the COVID-19 Pandemic. Int. J. Environ. Res. Public Health 2021, 18, 3469. [Google Scholar] [CrossRef]
- Roviello, V.; Gilhen-Baker, M.; Vicidomini, C.; Roviello, G.N. Forest-bathing and physical activity as weapons against COVID-19: A review. Environ. Chem. Lett. 2021, 20, 131–140. [Google Scholar] [CrossRef]
- Xu, L.; Ren, C.; Yuan, C.; Nichol, J.E.; Goggins, W.B. An Ecological Study of the Association between Area-Level Green Space and Adult Mortality in Hong Kong. Climate 2017, 5, 55. [Google Scholar] [CrossRef] [Green Version]
- Bauwelinck, M.; Casas, L.; Nawrot, T.S.; Nemery, B.; Trabelsi, S.; Thomas, I.; Aerts, R.; Lefebvre, W.; Vanpoucke, C.; Van Nieuwenhuyse, A.; et al. Residing in urban areas with higher green space is associated with lower mortality risk: A census-based cohort study with ten years of follow-up. Environ. Int. 2021, 148, 106365. [Google Scholar] [CrossRef]
- Villeneuve, P.J.; Jerrett, M.; Su, J.G.; Burnett, R.T.; Chen, H.; Wheeler, A.J.; Goldberg, M.S. A cohort study relating urban green space with mortality in Ontario, Canada. Environ. Res. 2012, 115, 51–58. [Google Scholar] [CrossRef]
- Meo, S.A.; Almutairi, F.J.; Abukhalaf, A.A.; Usmani, A.M. Effect of Green Space Environment on Air Pollutants PM2.5, PM10, CO, O(3), and Incidence and Mortality of SARS-CoV-2 in Highly Green and Less-Green Countries. Int. J. Environ. Res. Public Health 2021, 18, 13151. [Google Scholar] [CrossRef]
- Russette, H.; Graham, J.; Holden, Z.; Semmens, E.O.; Williams, E.; Landguth, E.L. Greenspace exposure and COVID-19 mortality in the United States: January-July 2020. Environ. Res. 2021, 198, 111195. [Google Scholar] [CrossRef] [PubMed]
- Adiba, A.; Jaelani, L.M. The Effect of Greenness Index on Case Fatality Rate of COVID-19 Analyzed by Using Landsat-8 Image (Case Study: DKI Jakarta). In Proceedings of the IOP Conference Series: Earth and Environmental Science, Surakarta, Indonesia, 27 July 2021; p. 012039. [Google Scholar]
- Liu, S.; Li, M. Ambient air pollutants and their effect on COVID-19 mortality in the United States of America. Pan Am. J. Public Health 2020, 44, e159. [Google Scholar] [CrossRef] [PubMed]
- Pansini, R.; Fornacca, D. COVID-19 Higher Mortality in Chinese Regions with Chronic Exposure to Lower Air Quality. Front. Public Health 2020, 8, 597753. [Google Scholar] [CrossRef] [PubMed]
- Shamsi, S.; Zaman, K.; Usman, B.; Nassani, A.A.; Haffar, M.; Abro, M.M.Q. Do environmental pollutants carrier to COVID-19 pandemic? A cross-sectional analysis. Environ. Sci. Pollut. Res. Int. 2021, 29, 17530–17543. [Google Scholar] [CrossRef]
- Sarfraz, M.; Mohsin, M.; Naseem, S.; Kumar, A. Modeling the relationship between carbon emissions and environmental sustainability during COVID-19: A new evidence from asymmetric ARDL cointegration approach. Environ. Dev. Sustain. 2021, 23, 16208–16226. [Google Scholar] [CrossRef]
- Badulescu, D.; Simut, R.; Badulescu, A.; Badulescu, A.-V. The Relative Effects of Economic Growth, Environmental Pollution and Non-Communicable Diseases on Health Expenditures in European Union Countries. Int. J. Environ. Res. Public Health 2019, 16, 5115. [Google Scholar] [CrossRef] [PubMed] [Green Version]
- Liu, Z.; Ciais, P.; Deng, Z.; Lei, R.; Davis, S.J.; Feng, S.; Zheng, B.; Cui, D.; Dou, X.; Zhu, B.; et al. Near-real-time monitoring of global CO2 emissions reveals the effects of the COVID-19 pandemic. Nat. Commun. 2020, 11, 5172. [Google Scholar] [CrossRef]
- Levin, K.A. Study Design VI-Ecological Studies. Evid.-Based Dent. 2006, 7, 108. [Google Scholar] [CrossRef] [Green Version]
- World-Bank. Forest Area (% of Land Area). 2020. Available online: https://databank.worldbank.org/reports.aspx?source=2&type=metadata&series=AG.LND.FRST3.ZS# (accessed on 11 February 2022).
- Worldometer. Forest Area by Country. 2017. Available online: https://www.worldometers.info/food-agriculture/forest-by-country/ (accessed on 6 December 2021).
- EDGAR. Emission Database for Global Atmospheric Research (EDGAR). 2022. Available online: https://data.jrc.ec.europa.eu/collection/edgar (accessed on 6 December 2021).
- Ourworldindata. Coronavirus Pandemic (COVID-19). 2022. Available online: https://ourworldindata.org/coronavirus (accessed on 6 December 2021).
- Hale, T.; Webster, S.; Petherick, A.; Phillips, T.; Kira, B. Oxford COVID-19 government response tracker (OxCGRT). Last Updated 2020, 8, 30. [Google Scholar]
- Stevens, G.A.; Alkema, L.; Black, R.E.; Boerma, J.T.; Collins, G.S.; Ezzati, M.; Grove, J.T.; Hogan, D.R.; Hogan, M.C.; Horton, R.; et al. Guidelines for Accurate and Transparent Health Estimates Reporting: The GATHER statement. PLoS Med. 2016, 13, e1002056. [Google Scholar] [CrossRef]
- Rajgor, D.D.; Lee, M.H.; Archuleta, S.; Bagdasarian, N.; Quek, S.C. The many estimates of the COVID-19 case fatality rate. Lancet Infect. Dis. 2020, 20, 776–777. [Google Scholar] [CrossRef] [Green Version]
- Verity, R.; Okell, L.C.; Dorigatti, I.; Winskill, P.; Whittaker, C.; Imai, N.; Cuomo-Dannenburg, G.; Thompson, H.; Walker, P.G.T.; Fu, H.; et al. Estimates of the severity of coronavirus disease 2019: A model-based analysis. Lancet Infect. Dis. 2020, 20, 669–677. [Google Scholar] [CrossRef]
- Mason, C.H.; Perreault, W.D. Collinearity, Power, and Interpretation of Multiple Regression Analysis. J. Mark. Res. 1991, 28, 268–280. [Google Scholar] [CrossRef]
- Lee, S.-I. Correlation and Spatial Autocorrelation. In Encyclopedia of GIS; Shekhar, S., Xiong, H., Zhou, X., Eds.; Springer International Publishing: Cham, Switzerland, 2015; pp. 1–8. [Google Scholar]
- Ren, T.; Long, Z.; Zhang, R.; Chen, Q. Moran’s I test of spatial panel data model—Based on bootstrap method. Econ. Model. 2014, 41, 9–14. [Google Scholar] [CrossRef]
- Matérn, B. Spatial Variation; Springer Science & Business Media: Berlin, Germany, 2013; Volume 36. [Google Scholar]
- Ward, M.D.; Gleditsch, K.S. Spatial Regression Models; Sage Publications: Thousand Oaks, CA, USA, 2018; Volume 155. [Google Scholar]
- Royston, P. Multiple imputation of missing values. Stata J. 2004, 4, 227–241. [Google Scholar] [CrossRef] [Green Version]
- World-Bank. World Bank Country and Lending Groups. 2022. Available online: https://datahelpdesk.worldbank.org/knowledgebase/articles/906519 (accessed on 6 December 2021).
- Rousset, F.; Ferdy, J.B. Testing environmental and genetic effects in the presence of spatial autocorrelation. Ecography 2014, 37, 781–790. [Google Scholar] [CrossRef]
- Jordahl, K.; Bossche, J.; Wasserman, J.; McBride, J.; Gerard, J.; Fleischmann, M.; Tratner, J. Geopandas/Geopandas, V0. 6.1; Zenodo: Geneva, Switzerland, 2019. [Google Scholar]
- Klompmaker, J.O.; Hart, J.E.; Holland, I.; Sabath, M.B.; Wu, X.; Laden, F.; Dominici, F.; James, P. County-level exposures to greenness and associations with COVID-19 incidence and mortality in the United States. Environ. Res. 2021, 199, 111331. [Google Scholar] [CrossRef] [PubMed]
- Vlahov, D.; Galea, S. Urbanization, urbanicity, and health. J. Urban Health 2002, 79, S1–S12. [Google Scholar] [CrossRef] [PubMed] [Green Version]
- Ekkel, E.D.; de Vries, S. Nearby green space and human health: Evaluating accessibility metrics. Landsc. Urban Plan. 2017, 157, 214–220. [Google Scholar] [CrossRef]
- Coombes, E.; Jones, A.P.; Hillsdon, M. The relationship of physical activity and overweight to objectively measured green space accessibility and use. Soc. Sci. Med. 2010, 70, 816–822. [Google Scholar] [CrossRef] [Green Version]
- Ugolini, F.; Massetti, L.; Pearlmutter, D.; Sanesi, G. Usage of urban green space and related feelings of deprivation during the COVID-19 lockdown: Lessons learned from an Italian case study. Land Use Policy 2021, 105, 105437. [Google Scholar] [CrossRef] [PubMed]
- Congdon, P. COVID-19 Mortality in English Neighborhoods: The Relative Role of Socioeconomic and Environmental Factors. J 2021, 4, 131–146. [Google Scholar] [CrossRef]
- Diao, X.; Hazell, P.; Thurlow, J. The role of agriculture in African development. World Dev. 2010, 38, 1375–1383. [Google Scholar] [CrossRef]
- Roviello, V.; Roviello, G.N. Less COVID-19 deaths in southern and insular Italy explained by forest bathing, Mediterranean environment, and antiviral plant volatile organic compounds. Environ. Chem. Lett. 2021, 20, 7–17. [Google Scholar] [CrossRef]
- Hanaoka, T.; Masui, T. Exploring effective short-lived climate pollutant mitigation scenarios by considering synergies and trade-offs of combinations of air pollutant measures and low carbon measures towards the level of the 2 C target in Asia. Environ. Pollut. 2020, 261, 113650. [Google Scholar] [CrossRef]
- Wang, W.; Li, M.; Zhang, M. Study on the changes of the decoupling indicator between energy-related CO2 emission and GDP in China. Energy 2017, 128, 11–18. [Google Scholar] [CrossRef]
- Adebayo, T.S.; Awosusi, A.A.; Kirikkaleli, D.; Akinsola, G.D.; Mwamba, M.N. Can CO2 emissions and energy consumption determine the economic performance of South Korea? A time series analysis. Environ. Sci. Pollut. Res. 2021, 28, 38969–38984. [Google Scholar] [CrossRef]
- Han, P.; Cai, Q.; Oda, T.; Zeng, N.; Shan, Y.; Lin, X.; Liu, D. Assessing the recent impact of COVID-19 on carbon emissions from China using domestic economic data. Sci. Total Environ. 2021, 750, 141688. [Google Scholar] [CrossRef]
- Rashed, E.A.; Kodera, S.; Gomez-Tames, J.; Hirata, A. Influence of Absolute Humidity, Temperature and Population Density on COVID-19 Spread and Decay Durations: Multi-Prefecture Study in Japan. Int. J. Environ. Res. Public Health 2020, 17, 5354. [Google Scholar] [CrossRef]
- Dowd, J.B.; Andriano, L.; Brazel, D.M.; Rotondi, V.; Block, P.; Ding, X.; Liu, Y.; Mills, M.C. Demographic science aids in understanding the spread and fatality rates of COVID-19. Proc. Natl. Acad. Sci. USA 2020, 117, 9696. [Google Scholar] [CrossRef] [Green Version]
- Onder, G.; Rezza, G.; Brusaferro, S. Case-Fatality Rate and Characteristics of Patients Dying in Relation to COVID-19 in Italy. JAMA 2020, 323, 1775–1776. [Google Scholar] [CrossRef] [PubMed]
- McMahon, D.E.; Peters, G.A.; Ivers, L.C.; Freeman, E.E. Global resource shortages during COVID-19: Bad news for low-income countries. PLoS Negl. Trop. Dis. 2020, 14, e0008412. [Google Scholar] [CrossRef] [PubMed]
- Carter, C.; Notter, J. COVID-19 1 year on: The challenge for low-middle income countries. Nurs. Crit. Care 2021, 26, 410–411. [Google Scholar] [CrossRef] [PubMed]
- Asfahan, S.; Shahul, A.; Chawla, G.; Dutt, N.; Niwas, R.; Gupta, N. Early trends of socio-economic and health indicators influencing case fatality rate of COVID-19 pandemic. Monaldi Arch. Chest Dis. 2020, 90. [Google Scholar] [CrossRef] [PubMed]
- Trethewey, S.P.; Reynolds, E.K. Exposure to green spaces and all-cause mortality: Limitations in measurement and definitions of exposure. Lancet Planet. Health 2021, 5, e501. [Google Scholar] [CrossRef]


| Variable | N | Mean | SD | Median | Min | Max | IQR |
|---|---|---|---|---|---|---|---|
| Forest cover (%) | 207 | 32.41 | 23.98 | 31.23 | 0.01 | 97.41 | 38.74 |
| Forest area (m2 per capita) | 202 | 11,055.09 | 28,442.80 | 2661.50 | 4.00 | 268,615.00 | 7561.25 |
| CO2 emission (tons per capita) | 201 | 4.76 | 6.52 | 2.71 | 0.02 | 55.29 | 5.43 |
| Total COVID-19 cases | 194 | 1,370,420.43 | 4,789,589.59 | 194,817.50 | 1.00 | 49,085,361.00 | 713,475.25 |
| Total COVID-19 deaths | 186 | 28,257.25 | 89,303.97 | 2982.50 | 1.00 | 788,363.00 | 14,259.25 |
| COVID-19 CFR (‰) | 186 | 21.43 | 21.90 | 15.52 | 1.14 | 194.91 | 15.93 |
| Population (million) | 222 | 35.34 | 139.78 | 6.32 | 0.01 | 1444.22 | 22.64 |
| GDP per capita (USD) | 194 | 19,110.90 | 20,439.72 | 12,265.79 | 661.24 | 116,935.60 | 23,190.07 |
| Population density (per km2) | 207 | 451.33 | 2089.29 | 87.18 | 0.14 | 20,546.77 | 176.53 |
| CVD death rate (per 100,000 people) | 189 | 264.92 | 122.70 | 244.66 | 79.37 | 724.42 | 164.06 |
| Diabetes prevalence (%) | 201 | 8.48 | 4.90 | 7.20 | 0.99 | 30.53 | 5.33 |
| Stringency index | 182 | 55.38 | 12.65 | 56.11 | 10.93 | 82.95 | 16.18 |
| Total tests for COVID-19 (per 1000 people) | 131 | 1340.29 | 2421.37 | 573.74 | 8.63 | 18,758.22 | 1229.37 |
| Total vaccinations for COVID-19 (per 100 people) | 217 | 96.76 | 60.73 | 101.75 | 0.01 | 297.99 | 98.62 |
| Life expectancy (year) | 218 | 73.38 | 7.49 | 74.71 | 53.28 | 86.75 | 10.64 |
| Median age of the population(year) | 190 | 30.30 | 9.12 | 29.50 | 15.10 | 48.20 | 16.65 |
| Percentage of population aged 65 years or older (%) | 188 | 8.61 | 6.12 | 6.22 | 1.14 | 27.05 | 10.42 |
| Percentage of population living in extreme poverty (%) | 125 | 13.88 | 20.25 | 2.50 | 0.10 | 77.60 | 20.80 |
| Percentage of female smokers (%) | 146 | 10.82 | 10.85 | 6.30 | 0.10 | 44.00 | 17.35 |
| Percentage of male smokers (%) | 144 | 32.90 | 13.67 | 32.25 | 7.70 | 78.10 | 19.00 |
| Hospital beds (per 1000 people) | 171 | 3.04 | 2.45 | 2.40 | 0.10 | 13.80 | 2.80 |
| Percentage of population with basic handwashing facilities (%) | 95 | 50.69 | 32.28 | 49.54 | 1.19 | 100.00 | 62.77 |
| Human development index | 189 | 0.72 | 0.15 | 0.74 | 0.39 | 0.96 | 0.23 |
| Variables | All Countries (N = 186) | Low-Income Countries (N = 26) | Lower-Middle-Income Countries (N = 50) | Upper-Middle-Income Countries (N = 51) | High-Income-Countries (N = 59) | |||||
|---|---|---|---|---|---|---|---|---|---|---|
| CFR Change (95% CI) | p | CFR Change (95% CI) | p | CFR Change (95% CI) | p | CFR Change (95% CI) | p | CFR Change (95% CI) | p | |
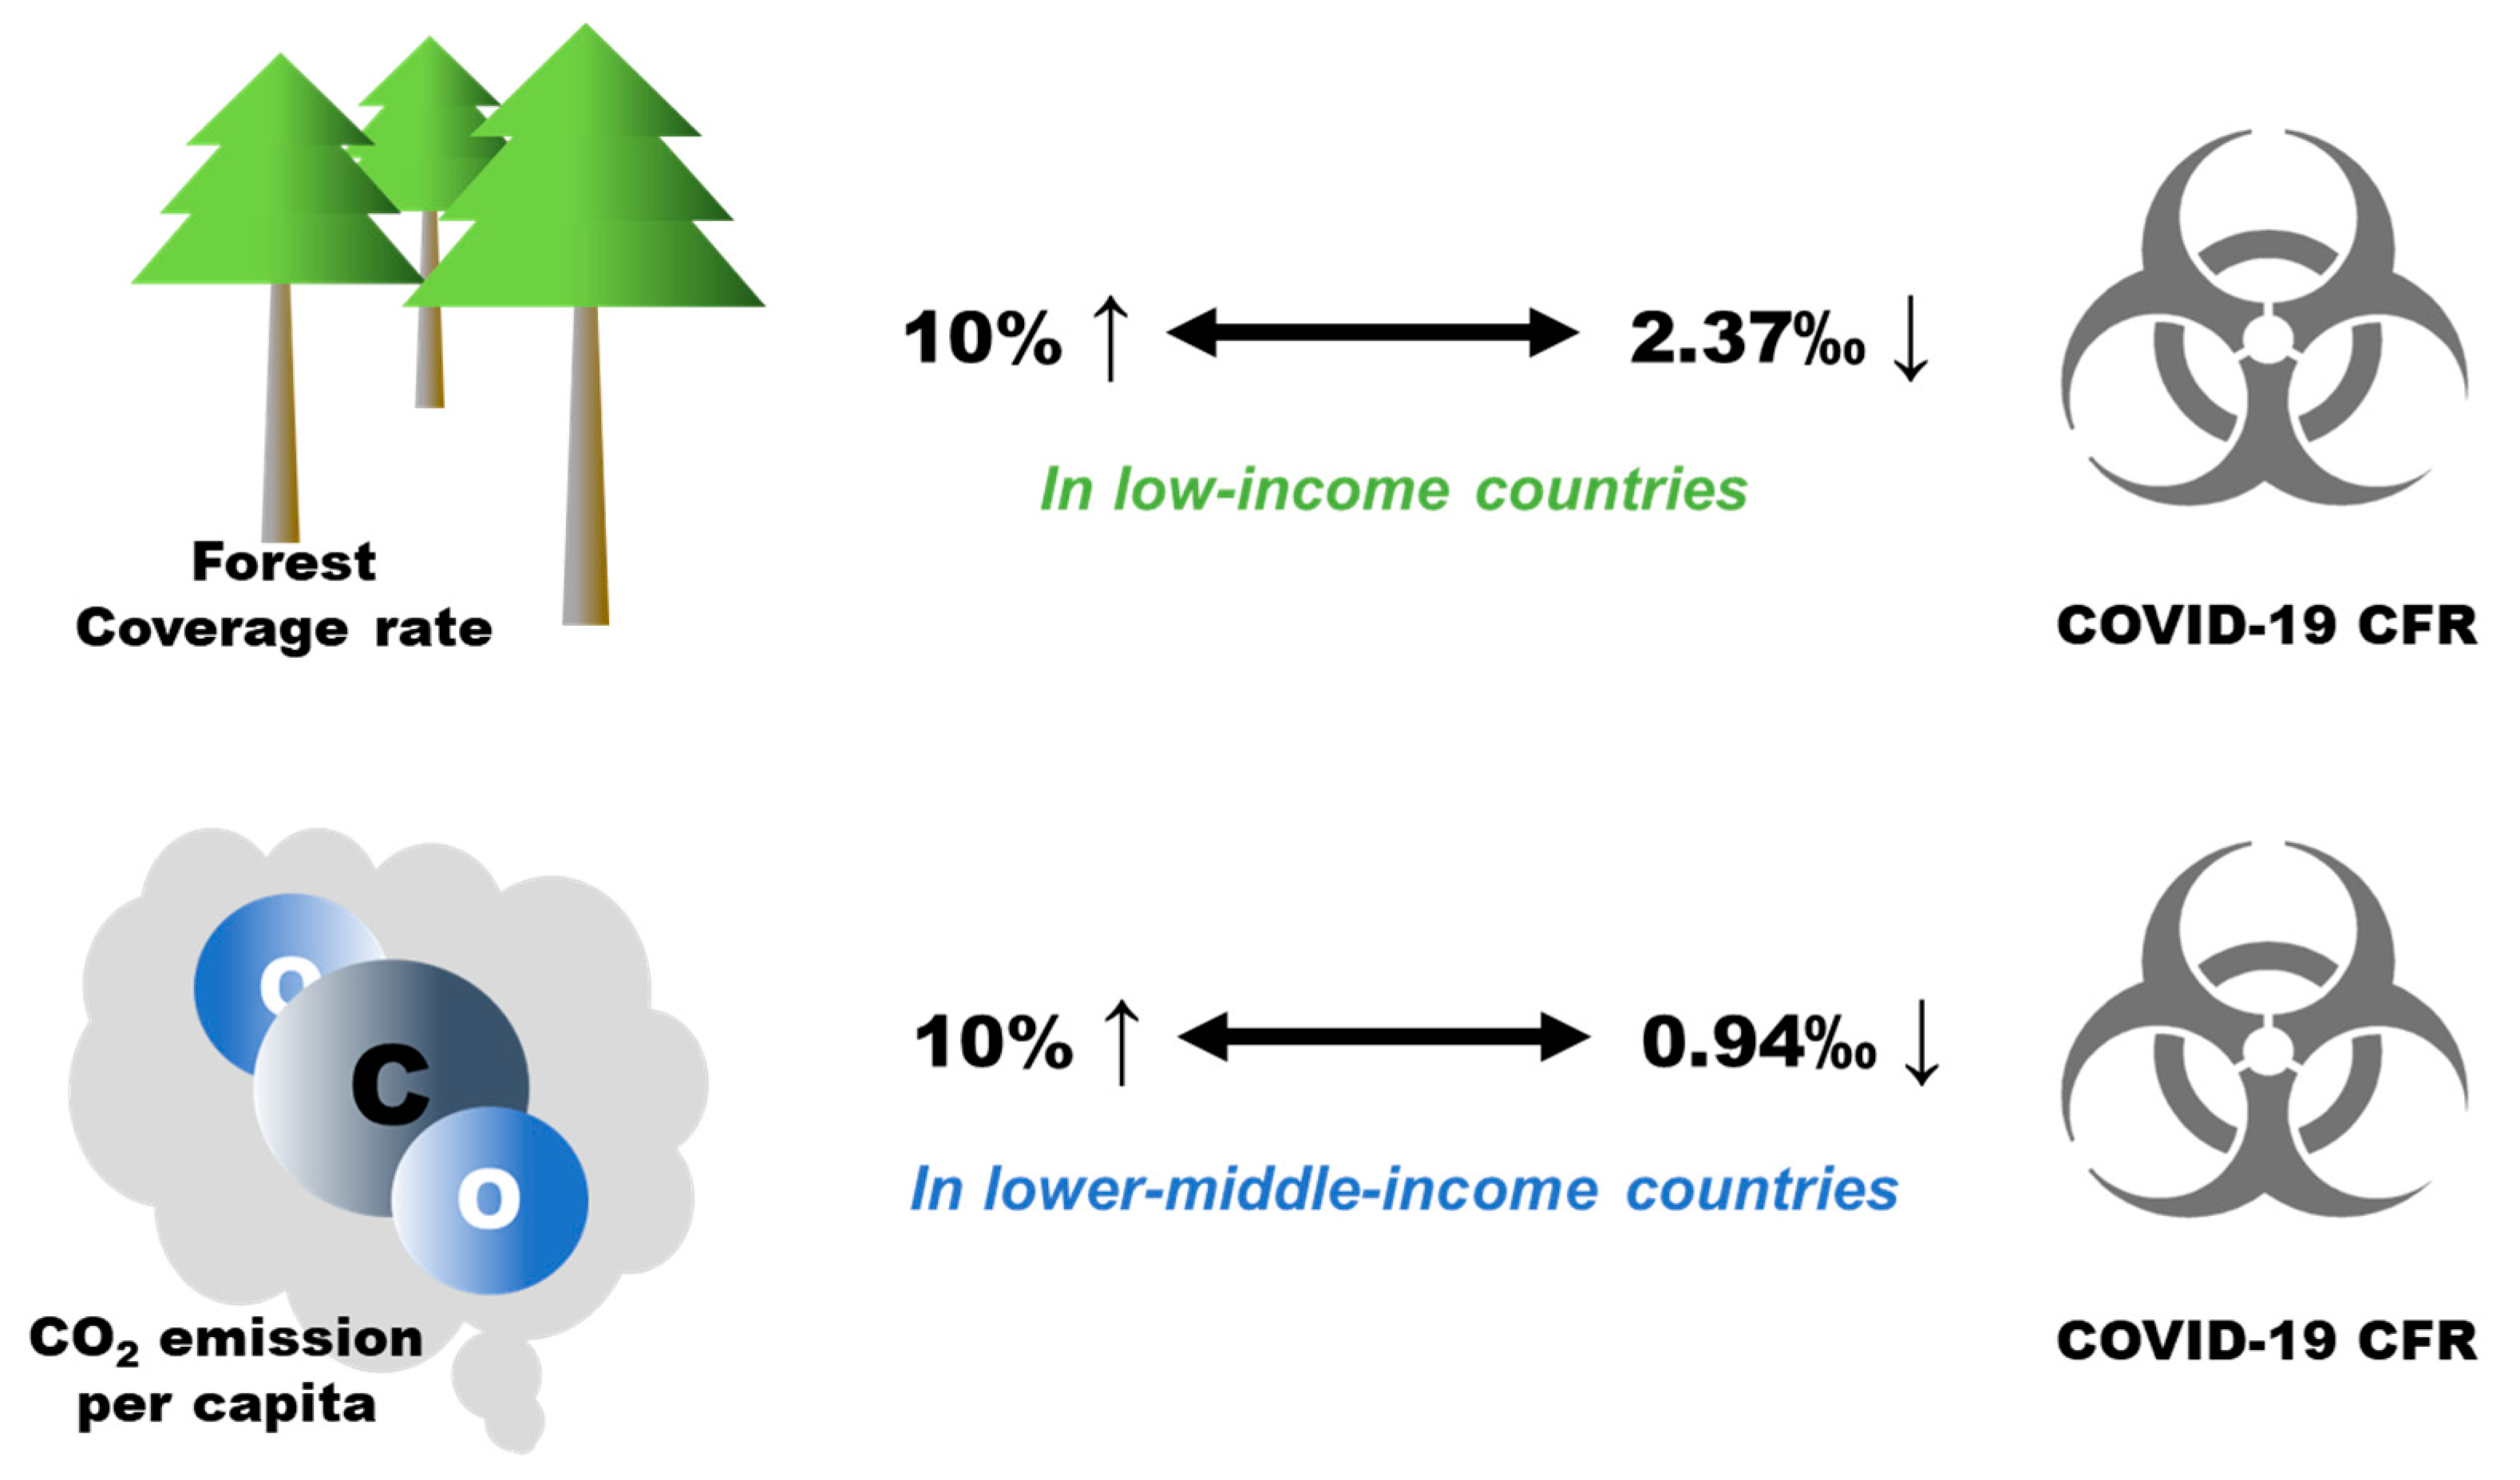
| Forest cover | −0.16 (−0.37, 0.06) | 0.198 | −2.37 (−3.12, −1.62) | 0.003 | 0.09 (−0.18, 0.36) | 0.557 | 0.17 (−0.20, 0.53) | 0.426 | 0.05 (−0.02, 0.13) | 0.215 |
| CO2 emission per capita | −0.24 (−0.61, 0.13) | 0.215 | 0.93 (−0.02, 1.87) | 0.120 | −0.94 (−1.46, −0.42) | 0.004 | 0.13 (−0.77, 1.04) | 0.646 | −0.13 (−0.34, 0.08) | 0.274 |
| Population | 0.04 (−0.11, 0.18) | 0.635 | 0.46 (−0.32, 1.23) | 0.173 | 0.33 (0.08, 0.57) | 0.030 | 0.17 (−0.13, 0.46) | 0.308 | 0.02 (−0.04, 0.08) | 0.397 |
| Population density | −0.10 (−0.31, 0.11) | 0.359 | −1.89 (−2.82, −0.95) | 0.085 | −0.31 (−0.65, 0.02) | 0.135 | −0.21 (−0.56, 0.14) | 0.306 | 0.03 (−0.05, 0.11) | 0.553 |
| Life expectancy | 0.12 (0.04, 0.20) | 0.009 | 0.36 (0.18, 0.53) | 0.121 | 0.09 (0, 0.19) | 0.068 | 0.11 (−0.03, 0.24) | 0.155 | 0.02 (−0.03, 0.08) | 0.437 |
| Male smoker | −0.01 (−0.03, 0.02) | 0.522 | −0.05 (−0.15, 0.04) | 0.189 | 0 (−0.02, 0.02) | 0.485 | 0.00 (−0.04, 0.04) | 0.650 | −0.01 (−0.03, 0.00) | 0.118 |
| Female smoker | 0.25 (−0.02, 0.52) | 0.112 | 2.14 (1.64, 2.65) | 0.002 | 0.11 (−0.27, 0.5) | 0.312 | 0.07 (−0.32, 0.45) | 0.578 | 0.32 (0.12, 0.51) | 0.018 |
| CVD death rate | 1.05 (0.12, 1.98) | 0.034 | −0.30 (−3.86, 3.25) | 0.228 | −0.64 (−1.77, 0.49) | 0.364 | −0.65 (−2.01, 0.71) | 0.390 | 1.03 (0.56, 1.49) | <0.001 |
| Diabetes prevalence | 0.31 (−0.32, 0.93) | 0.354 | 0.33 (−0.89, 1.56) | 0.150 | −0.12 (−0.63, 0.4) | 0.571 | −0.40 (−1.9, 1.09) | 0.605 | 0.19 (−0.17, 0.55) | 0.355 |
| Hospital beds | −0.17 (−0.64, 0.30) | 0.458 | 2.07 (0.61, 3.54) | 0.107 | 0.1 (−0.5, 0.7) | 0.548 | −0.09 (−1.06, 0.87) | 0.670 | 0.17 (−0.11, 0.45) | 0.343 |
| Stringency index | −0.80 (−1.09, −0.51) | <0.001 | −0.60 (−1.54, 0.33) | 0.231 | −0.47 (−0.84, −0.1) | 0.087 | −0.95 (−1.50, −0.41) | 0.003 | −0.36 (−0.49, −0.23) | <0.001 |
| Tests | 0.24 (−0.06, 0.54) | 0.151 | −0.23 (−0.83, 0.36) | 0.101 | 0.2 (−0.2, 0.6) | 0.357 | −0.58 (−1.40, 0.24) | 0.177 | 0.07 (−0.54, 0.68) | 0.484 |
| Vaccinations | −0.16 (−0.37, 0.06) | 0.198 | −2.37 (−3.12, −1.62) | 0.003 | 0.09 (−0.18, 0.36) | 0.557 | 0.17 (−0.20, 0.53) | 0.426 | 0.05 (−0.02, 0.13) | 0.215 |
Publisher’s Note: MDPI stays neutral with regard to jurisdictional claims in published maps and institutional affiliations. |
© 2022 by the authors. Licensee MDPI, Basel, Switzerland. This article is an open access article distributed under the terms and conditions of the Creative Commons Attribution (CC BY) license (https://creativecommons.org/licenses/by/4.0/).
Share and Cite
Li, H.; Zhang, G.; Cao, Y. Forest Area, CO2 Emission, and COVID-19 Case-Fatality Rate: A Worldwide Ecological Study Using Spatial Regression Analysis. Forests 2022, 13, 736. https://doi.org/10.3390/f13050736
Li H, Zhang G, Cao Y. Forest Area, CO2 Emission, and COVID-19 Case-Fatality Rate: A Worldwide Ecological Study Using Spatial Regression Analysis. Forests. 2022; 13(5):736. https://doi.org/10.3390/f13050736
Chicago/Turabian StyleLi, Hansen, Guodong Zhang, and Yang Cao. 2022. "Forest Area, CO2 Emission, and COVID-19 Case-Fatality Rate: A Worldwide Ecological Study Using Spatial Regression Analysis" Forests 13, no. 5: 736. https://doi.org/10.3390/f13050736
APA StyleLi, H., Zhang, G., & Cao, Y. (2022). Forest Area, CO2 Emission, and COVID-19 Case-Fatality Rate: A Worldwide Ecological Study Using Spatial Regression Analysis. Forests, 13(5), 736. https://doi.org/10.3390/f13050736