Article

Influence of Planting Scheme on Some Physical Properties of Norway Spruce (Picea abies (L.) H. Karst) Wood

1
“Marin Drăcea” National Research-Development Institute in Forestry, 077190 Voluntari, Romania
2
Interdisciplinary Doctoral School, “Transylvania” University from Brașov, 500036 Brașov, Romania
3
Interdisciplinary Doctoral School, “Stefan cel Mare” University from Suceava, 720229 Suceava, Romania
*
Author to whom correspondence should be addressed.
Forests 2022, 13(4), 540; https://doi.org/10.3390/f13040540
Submission received: 12 March 2022 / Revised: 28 March 2022 / Accepted: 29 March 2022 / Published: 30 March 2022
(This article belongs to the Section Wood Science and Forest Products)

Abstract

:
This study analyses the influence of a planting scheme on physical properties of Norway spruce wood. The research material consisted of 326 Norway spruce trees (Picea abies (L.) H. Karst) selected from an experimental plot with four planting variants (2500, 3330, 5000, and 7510 trees·ha−1). The research aspects were: (1) wood density (measured by volumetric method and using microdrilling resistance as proxy), (2) microdrilling resistance, and (3) sound speed. There was a decrease in wood density values (from 0.3376 to 0.3367 g·cm−3) and in microdrilling resistance values (from 15.136% to 14.292%) as the number of trees·ha−1 used for plantation increased from 2500 to 5000. The planting variant with 7510 trees·ha−1 had the largest value (0.3445 g·cm−3 for wood density and 15.531% for microdrilling resistance). Sound speed decreased from 1032.8 to 989.8 m·s−1 as the number of trees·ha−1 increased from 2500 to 7510. These results show a relationship between DBH values and studied physical properties. This relationship is more evident for variants with low planting density (e.g., 2500, 3330 trees·ha−1) than that of dense planting variants (e.g., 7510 trees·ha−1). The explanation may be that the growth of trees in dense plantings is slower; in less dense planting variants, the increase in wood is greater, and as a result, wood volumetric density dependence on the DBH value is greater.

1. Introduction

Wood quality stems from a series of wood characteristics, such as diameter, stalk shape and defects, age, annual ring characteristics (regularity, average width, percentage of latewood), density, juvenile wood, duramen or sapwood report, and log length [1,2,3]. In total, 27 significant wood attributes have been identified that offer information about its quality [4]. Traditionally, wood quality is evaluated through measurements and visual observations of its size and defects, and how those defects are distributed. Although these characteristics can be sufficient when those aspects are considered, the same thing cannot be said when considering the wood’s rigidity and resistance [5]. The physical and chemical structure of fibrowood cells is the most important characteristic in establishing wood quality. Physical–mechanical properties are necessary for establishing the structural category in which the wood can be used (conventional residential buildings, large modern structures, bridges, etc.) [6].
Wood density is one of the most crucial predictors of wood quality and is influenced by many factors. These include genetic factors, tree age, and stational conditions [4,7]. Density is greater in improper stational conditions, while the value decreases as conditions are improved [8,9]. In the case of Norway spruce, wood density decreases as the annual ring’s width increases, and latewood percentages and tracheids with large walls correspondingly decrease [2]. Analysis was conducted on the wood’s average variation at the level of annual rings, together with early and latewood at different heights and radial positions on Norway spruce (Picea abies (L.) H. Karst) trees [10]. Wood density was used for understanding the influence of some quantitative genetic aspects, and the intraspecific competition on structural properties and the growth of Norway spruce wood [11,12]. Other research aspects focused on density analysis based on the origin of young Norway spruce trees [13], analysing wood density profiles in tree trunks [14], the relationship between the tree’s ring width and its density [7,15,16], variability in wood density based on the annual ring’s age [17], and density’s spatial variation in Norway spruce trunks [18].
Traditionally, a volumetric method is used as a method for determining density. This method is destructive and has numerous disadvantages connected to repeated measurements, limited applications in natural reservations, the transport and classification of materials [19,20]. Recently, indirect methods were developed for measuring the density of tree trunks. They refer to the resistance couple method where a minidrill is inserted into a tree [21], spectroscopic studies or radiation densitometry [22], computerised tomography with X rays for scanning standing trees [23], or specific laser methods. The microdrilling resistance method has considerable advantages in determining tree density when compared with a volumetric method referring to diminishing tree damage, fast performance, and the measurement’s sensibility degree [24,25]. The Resistograph device uses microdrilling resistance to offer a useful proxy for wood density [20]. Strong correlations were identified between dendrogram data (microdrilling resistance) and wood density [26,27,28].
The relative resistance profile obtained by directly measuring the usage of electric energy is offered by the Resistograph device. This can simultaneously measure, display, and record values while a 3 mm microdrill penetrates the tree [29,30]. Applying the microdrilling resistance method allows for us to identify young defects and wood discontinuities without affecting functional properties [31]. It is possible to evaluate the volume of interior defects from the wood covered by other materials [32,33]. Furthermore, microdrilling resistance measurements offer a graphical representation of the distribution of annual growth rings [24,34]. Investigations performed for testing wood resistance towards microdrilling also intended to estimate the wood’s mechanical properties [33]. Results showed that the Resistograph offers good results in emphasising wood density changes caused by biological factors [35]. The device’s efficiency in evaluating wood quality and density was confirmed by comparing the obtained results with stress waves or acoustical tomography, or through X-ray testing [30,36,37].
The purpose of ultrasound inspections in trees and stands is to evaluate the health of an element or structure. Evaluating the current state of trees and stands allows for decisions regarding its sufficiency, so that both production and protection functions are achieved in safe and reliable conditions [38,39]. Internal defects can have a significant, damaging, and decisive effect [30]. These methods stem from the principle that the propagation speed of acoustic waves inside tree trunks is influenced by their density. Acoustic waves spread differently in the wood of healthy trunks compared to those that contain mould [20,40]. Although these methods have a wide range of applications and are used in numerous domains, they were introduced late in silviculture. They are used in qualitative evaluations and for detecting interior defects [41]. In the past, a series of internal defects and the presence of cavities in tree trunks were identified by hitting the tree with an axe or special hammer. This practical method has led to numerous studies regarding the possibility of using acoustic waves and developing specific instruments. Numerous electric versions of instruments that use acoustic waves with frequencies smaller or greater than 20 kHz are currently available on a large scale. Their functioning principle measures the speed of acoustic waves at the moment of passing through the trunk. Current electronic hammers have an accuracy of ±1 μs. Errors in establishing the speed of acoustic waves are possible due to weak connections between sensors (transductors) or moisture [5,27,30,41,42].
The current research examines the influence of the planting scheme on physical properties of the Norway spruce wood into standing trees, and shows that forest management expressed by the planting scheme influences the diversity of stands. The aims of the present study, developed in an experimental plot installed using different plantation variants, were:
  • highlight wood density particularities;
  • measure microdrilling resistance;
  • quantify sound speed.

2. Materials and Methods
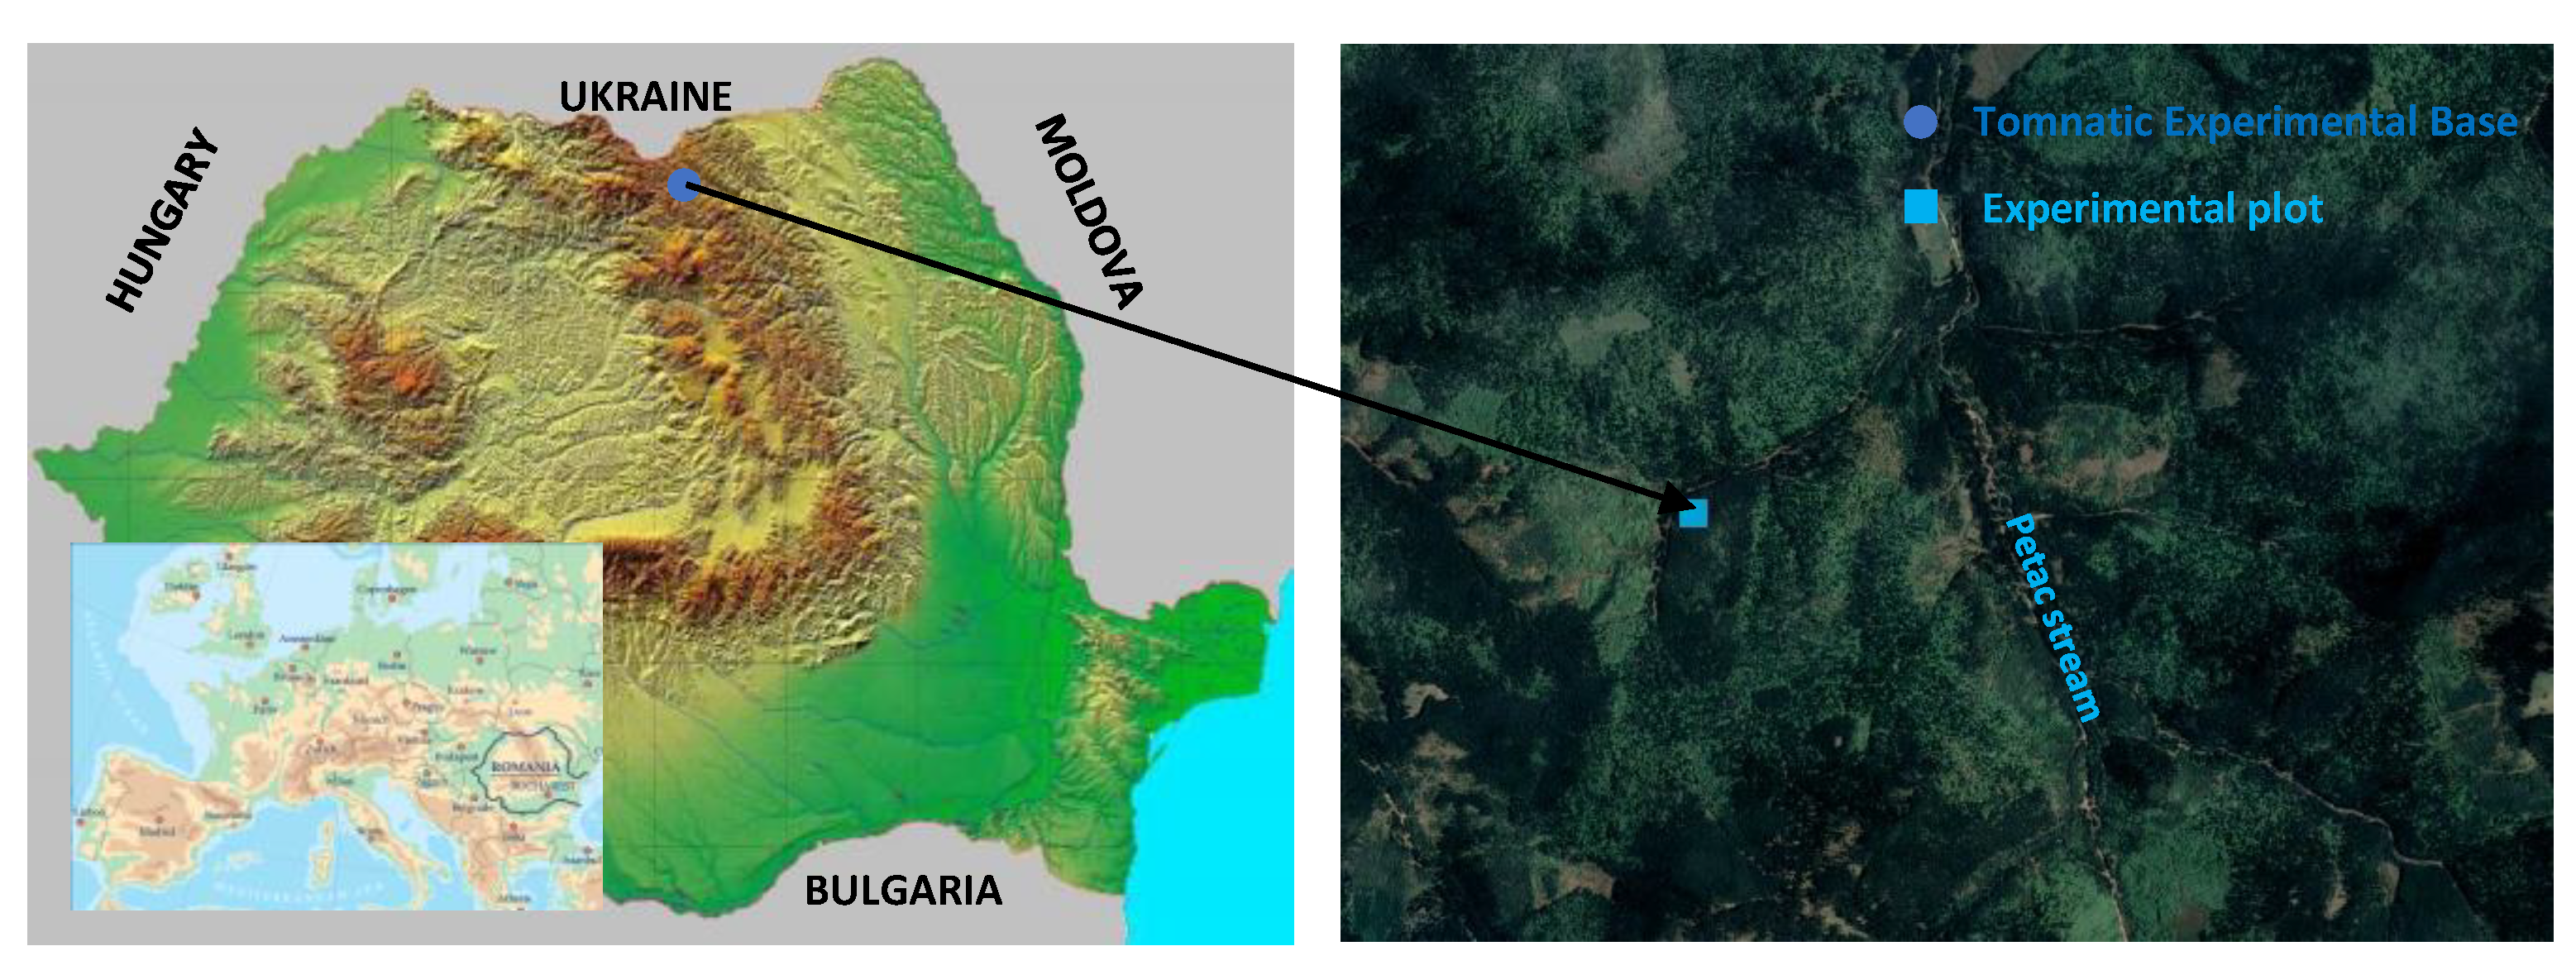
2.1. Study Site

The studied experimental plot was located in Tomnatic Experimental Base (47°42′52″ N and 25°23′46″ E), Suceava county, north of the eastern Carpathians (Figure 1). The area is characterised by a continental climate and it is located at an altitude of 890 m. The average annual precipitations reach 800 mm, while the average annual temperature is 6 °C. The geologic underlayer from the studied area is flysch, while the dominant soil is eutric cambisol, with a clayey–sandy texture. The area mainly contains pure Norway spruce (Picea abies (L.) H. Karst) stands and Norway spruce, fir, and common beech mixtures.
Gathering primary data for analysing the influence of the planting scheme on certain physical Norway spruce wood properties focused on an experimental plot. This was installed through different plantation variants, with four work variations and four repetitions (V1, 2500; V2, 3330; V3, 5000; V4, 7510 trees·ha−1). Planting variant is synonymous with planting density, which represents the number of trees used to create stands. The analysed experimental plot, installed by using different plantation variants, did not undergo specific forestry works for its development stage. This covered a period from its installation up to 2021 (when the stand’s age reached 40 years) and when the first valorisation was identified. As a result, density values and values of all other qualitative indicators (the wood’s physical–mechanic properties) refer to the work variant in which no maintenance and stand management works were realised, up to the present stand’s age.

2.2. Sampling

To assess the physical–mechanical properties of Norway spruce wood (density, resistance towards microdrilling, sound speed) we sampled 370 trees in an experimental plot installed through different plantation methods. This sample included approximately 90 trees (3–4 trees from all diameter categories) for each of the four work variants using the same samples for all studied characteristics.

2.3. Method

To measure density, the necessary database for emphasising wood density was constructed from Norway spruce (Picea abies (L.) H. Karst) trees belonging to the experimental plot. We used the volumetric method of determining density and its indirect establishment through modern devices. The volumetric method involved extracting samples from the tree with the use of a Pressler drill [43]. Samples were extracted for each tree at a DBH height of 1.30 m. Samples’ total length was measured and recorded in the field. The fresh sample volume was assimilated to a geometrically regular figure, namely, the cylinder, whose base was considered a circle with the inner diameter of the Pressler drill. At the office, samples were dried on a stove at a temperature of 70 °C for 48 h. The density (g·cm−3) of samples extracted from trees was calculated as the ratio between mass in a dry state and the sample’s volume in a fresh state [20]. Wood density, measured traditionally through the volumetric method, requires great expenses for gathering samples on a large scale. A new device called a Resistograph was researched and is used for the fast evaluation of the wood’s relative density. Recent investigations used the Resistograph IML RESI F500-S device (Instrumenta Mechanik Labor System GmbH Großer Stadtacker 2, 69168, Wiesloch, Germany). By determining wood resistance, we can also indirectly identify wood portions that have defects (rot). This can be used as a specific wood density proxy. The method is nondestructive and much cheaper than the traditional volumetric method [44]. We emphasised the temporal dynamic of general statistical parameters for density in the researched experimental plot, and wood density values in relation with diameter and plantation variant. Furthermore, to indirectly measure wood density, we quantified the relationship between wood density and microdrill resistance value indicated by the Resistograph device.
Emphasising the resistance of Norway spruce trees was achieved through modern methods and techniques. Resistograph IML RESI F500-S was used for determining the resistance of the tree’s transversal sections. The device uses a microdrilling instrument with a small drill of 3 mm in diameter and 50 cm in length. Penetration speed automatically adapts [35]. Microdrill resistance is recorded at a spatial resolution of 0.01 mm. Data were saved on the device’s electronic data storage gadget. Microdrilling resistance was measured for each tree at a height of 1.30 m. The wood was divided into concentric rings of 1/2 mm width to calculate the microdrill resistance. An average was calculated by considering the microdrill resistance value recorded by the device, the surface of the annual ring, the total surface (corresponding to the considered ring’s diameter), and the number of rings with a threshold depth of 1/2 mm [20]. Lastly, we established the temporal dynamic of the general statistic parameters for microdrilling resistance in the analysed experimental plot, as well as the relationship between diameter and wood resistance differentiated on planting variants. In addition, we measured the values of microdrilling resistance in relation to the planting variant and diameter.
In order to emphasize sound speed in the tree’s transversal sections, we used the IML MicroHammer device (Instrumenta Mechanik Labor System GmbH Großer Stadtacker 2, 69168, Wiesloch, Germany). IML Micro Hammer measures the necessary time for an impulse to pass through a tree. Due to the sound speed characteristic for each tree species, measurement values clearly display a tree’s interior conditions. The device’s sensor is small and very sensitive. The fixing system was based on a magnetic device with special screws that minimize damage caused to trees. The electronic unit detects and saves the results of measurements [30,45]. As such, we underlined the temporal dynamic of general statistic parameters for the speed of sound (m·s−1) in the studied experimental plot, as well as the relation between diameter and sound speed, differentiated on plantation variants. This was complemented by the values of sound speed through the wood, in relation to the plantation variant and diameter.

2.4. Statistical Analyses

For wood density measured through volumetric methods, microdrilling resistance and sound speed in Norway spruce (Picea abies (L.) H. Karst) stands installed by using different plantation variants, the basic statistical descriptors (average, standard deviation, variation coefficient, asymmetry, excess, minimum and maximum) were used for studying the plantation scheme’s effect (V1, 2500; V2, 3330; V3, 5000; V4, 7510 trees·ha−1) on the studied physical properties of Norway spruce wood. The data were expressed as mean ± standard deviation (SD). Studying correlation in the present article shows connections between the analysed predictors, highlights the form of these connections, and shows the intensity of the existing connection. The correlation coefficient (r) and determination coefficient (R2) were used to assess the significance of relationships among the used predictors. To examine the significance among values of density, microdrilling resistance, and sound speed, for the four working variants under analysis (V1, V2, V3 and V4), a two-way t-test was used. The significance level for all analyses was accepted to be α = 0.05. All statistical analyses were performed by using STATISTICA 12.5 [46] and MS Excel 2019 software [47].

3. Results

3.1. Wood Density Particularities in an Experimental Plot Installed by Using Different Plantation Variants

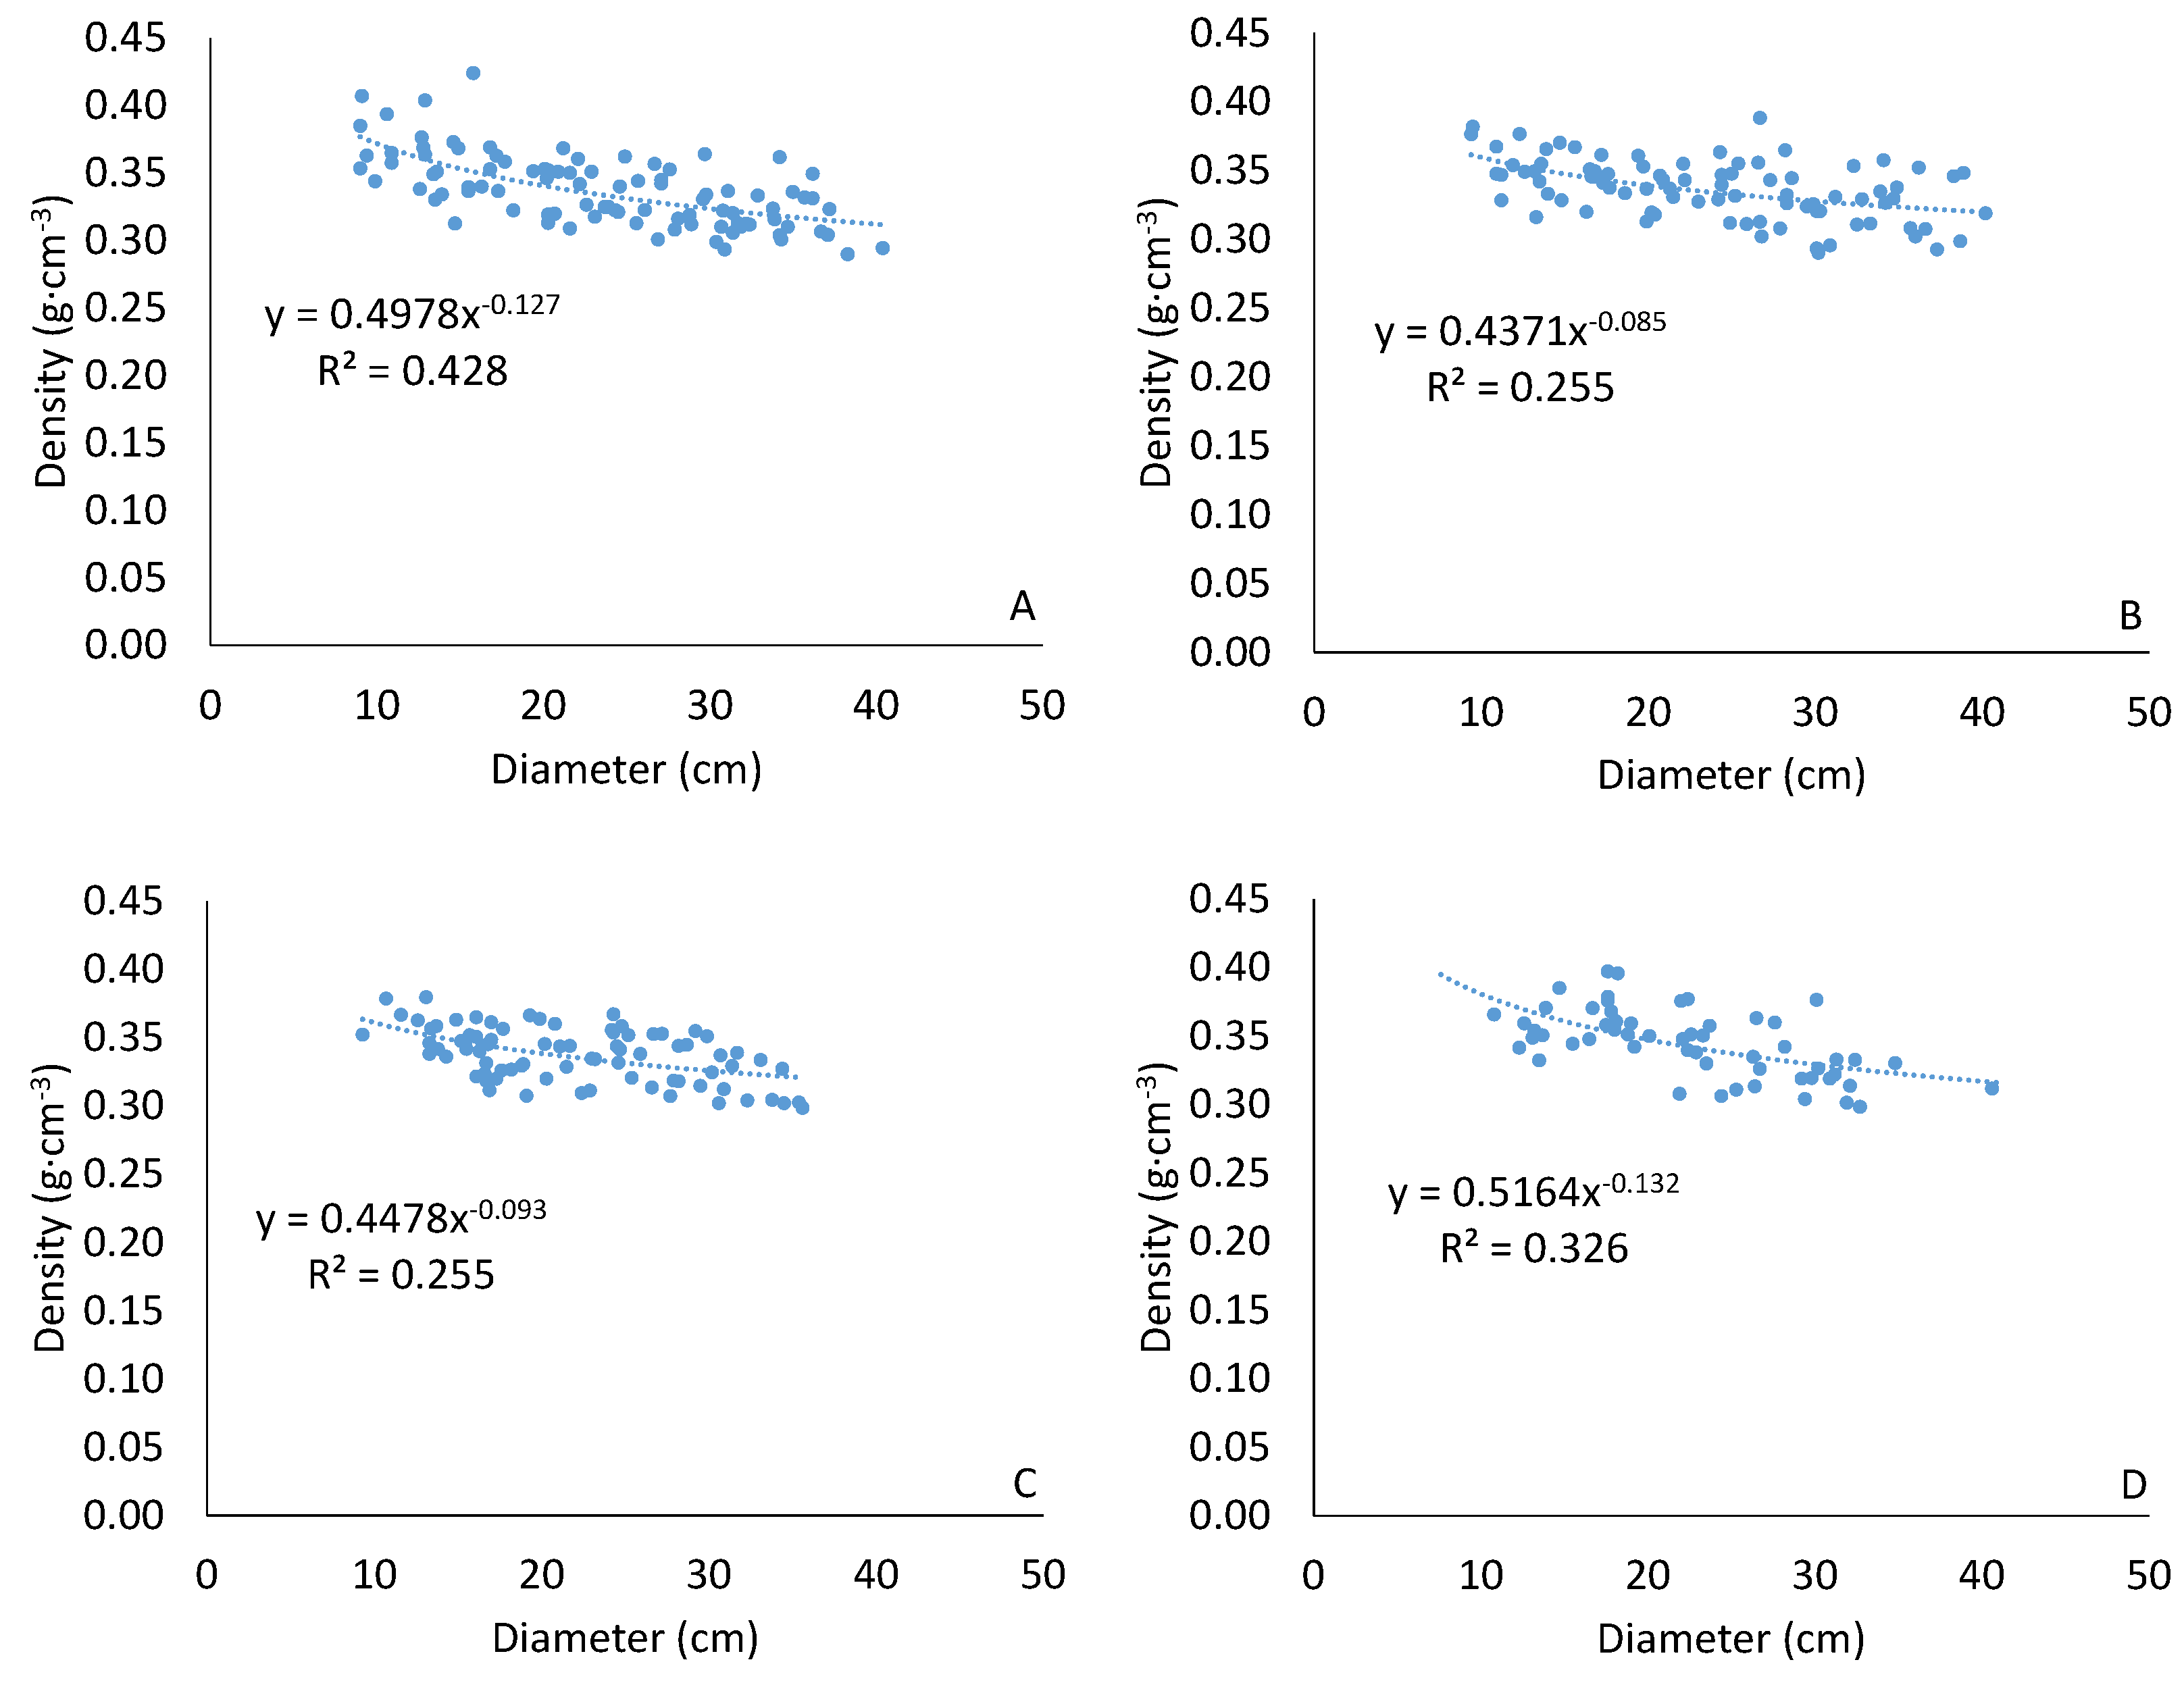
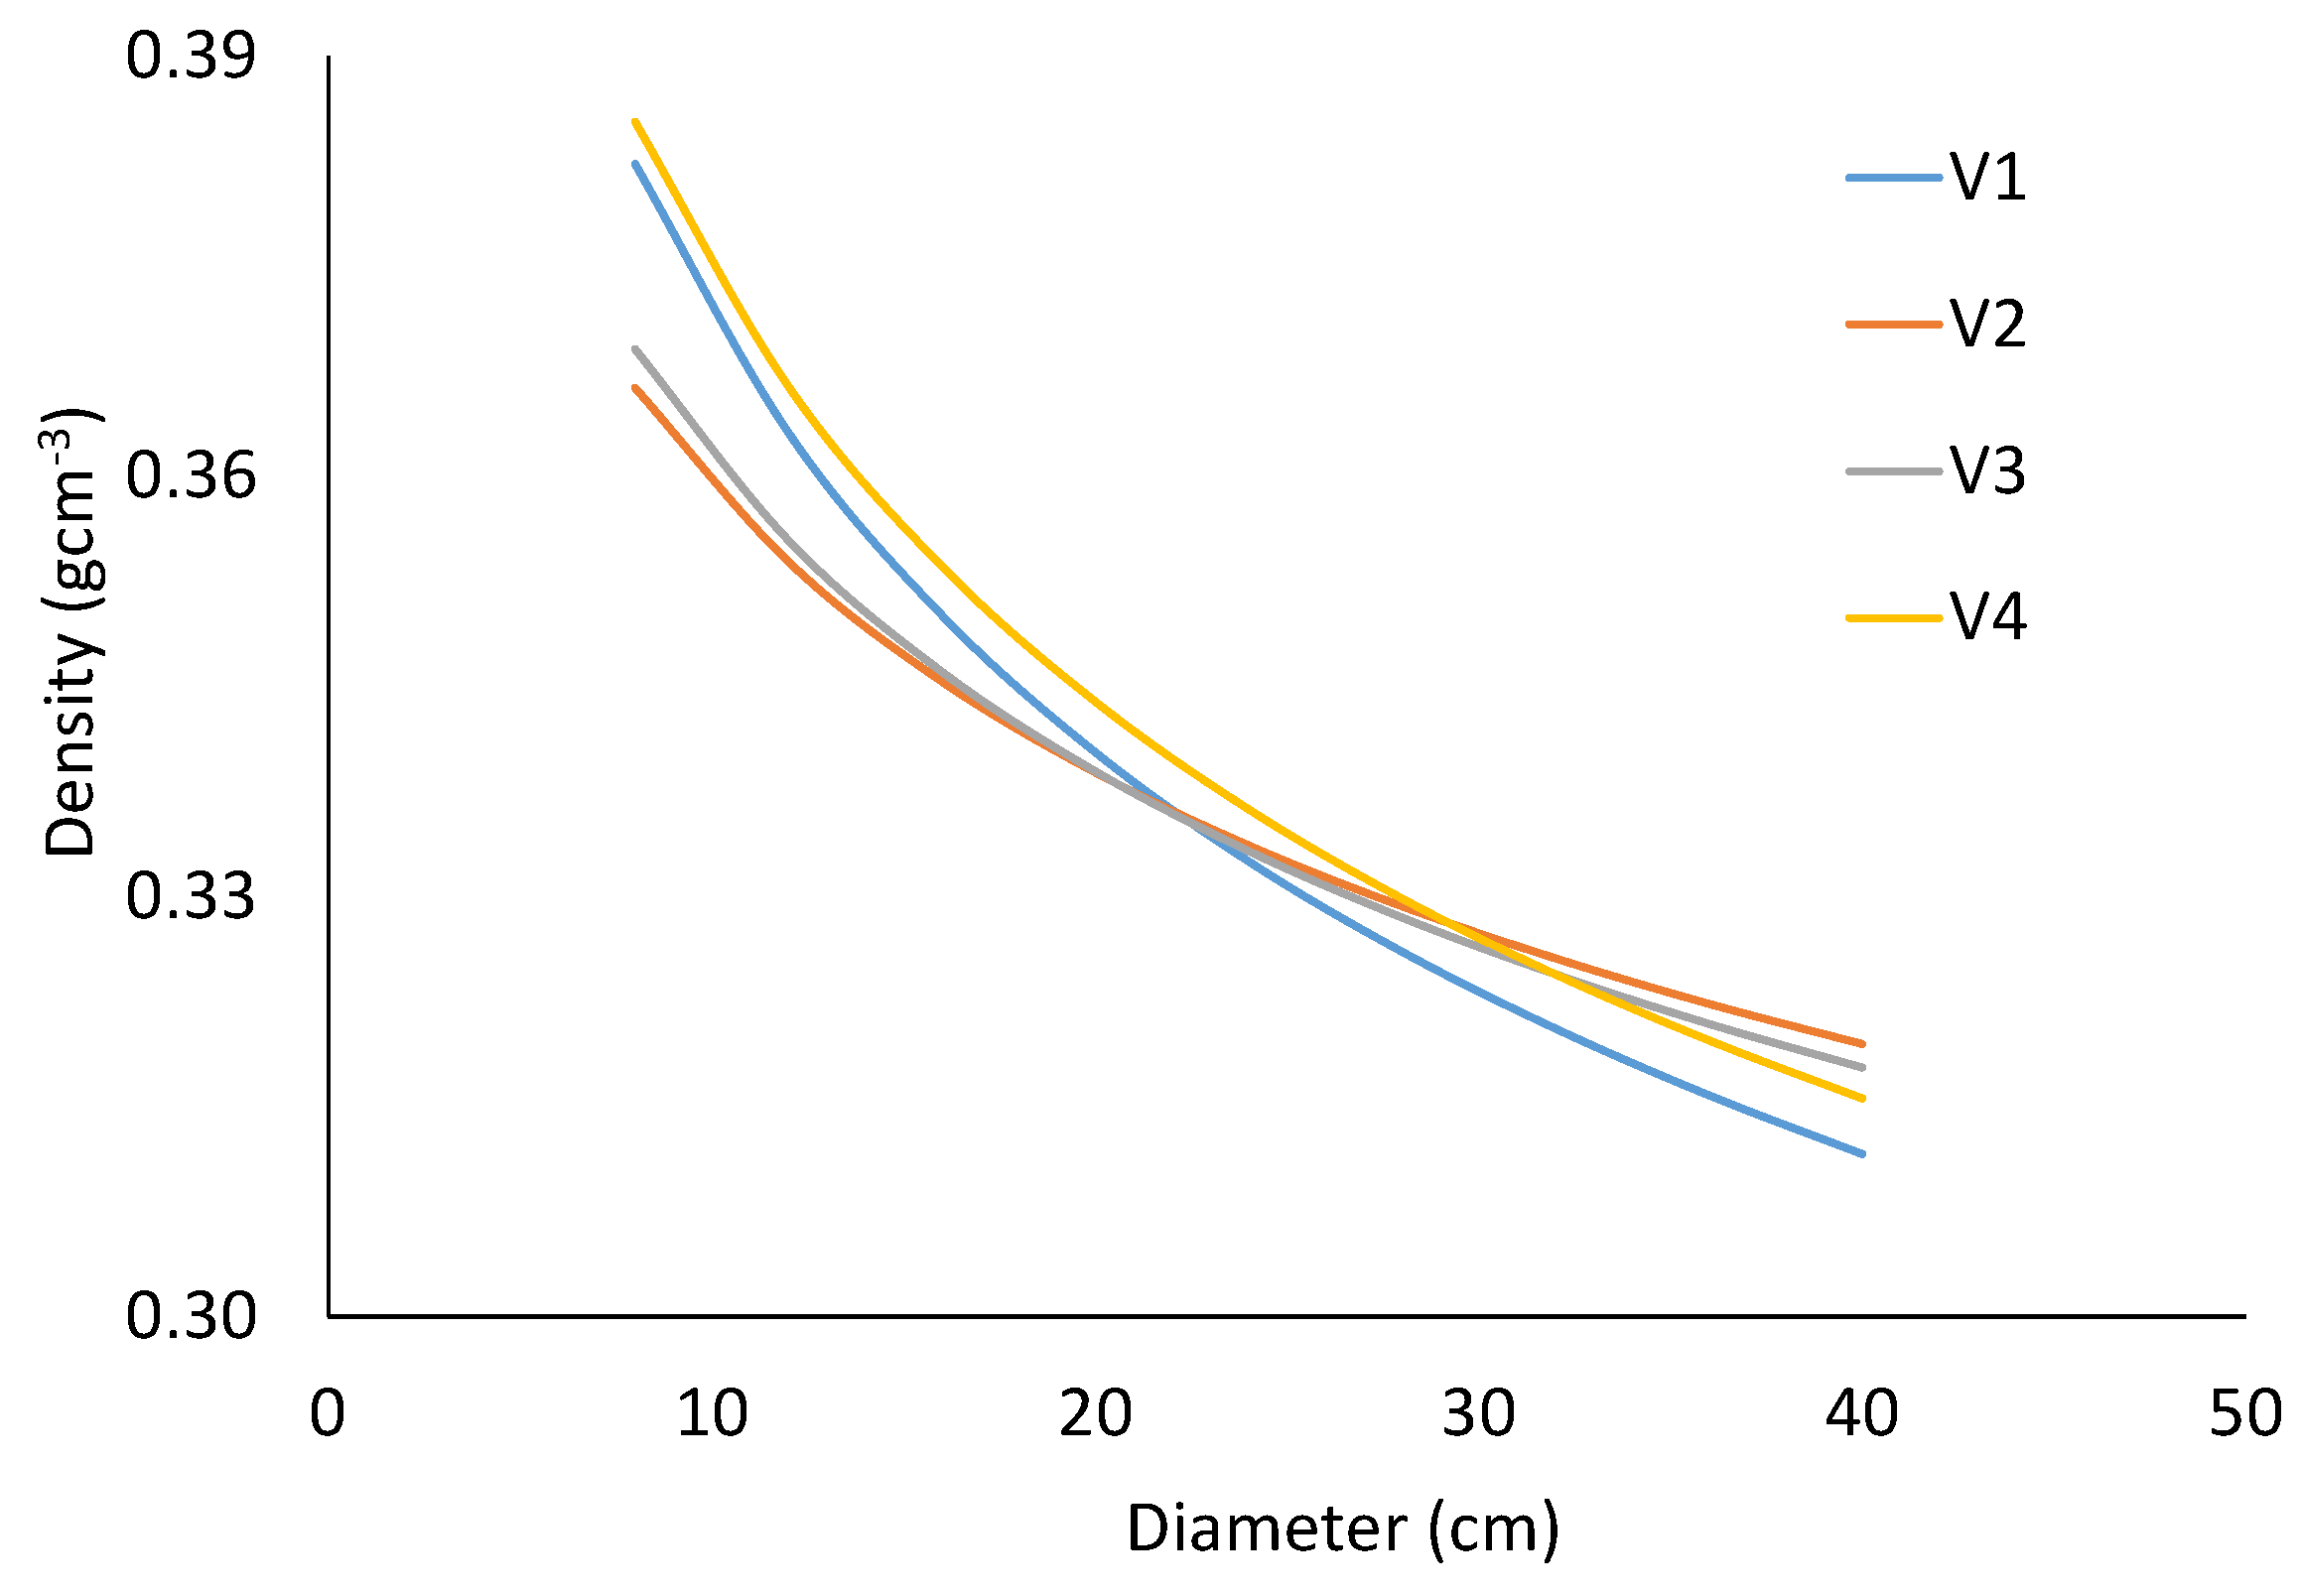
3.1.1. Wood Density Measured through Volumetric Method

Average density showed values of 0.33764 ± 0.026 g·cm−3 in the V1 variant from the experimental plot, and 0.33742 ± 0.019 g·cm−3 in V2. V3 had an average density of 0.33673 ± 0.021 g·cm−3, while V4 had 0.34454 ± 0.029 g·cm−3. Tree population variability is diminished in all cases, with a variation coefficient value between 12.8% (V1) and 11.8% (V4) (Table 1).
Analysing the average values for each work variant from the experimental plot indicated a small density decrease. This occurred as the number of trees·ha−1 used for plantation increased from V1 to V3. V4 (with the largest number of trees·ha−1 planted at installations) had the largest value for the analysed parameters.
Research conducted in the experimental plot installed through different plantation variants showed that wood density decreased as diameter increased, which was specific for each plantation variant. This happened in accordance with a y = axb power regression (y represents wood density, and x the diameter). The significance test of the relationship demonstrates that these were average-to-strong and highly significant (V1: r = 0.658, V2: r = 0.504, V3: r = 0.506, V4: r = 0.569) (Figure 2).
If we consider this, the carriage of average density curves in relation to diameter and plantation variation indicates the superiority of V4 values over all other variants up to the 28 cm diameter. This extends for V1 over V2 and V3, up to the 22 cm diameter. The disposal of density in relation to the diameter for V2 and V3 indicates that they were almost the same, with small values for small diameters and higher values in V2’s higher diameters (Figure 3).
A two-way t test result indicated that no significant interaction was detected between the V1 and V2, V1 and V3, and V2 and V3 variants, while differences between variants V1 and V4, V2 and V4, and V3 and V4 were significant (Table 2).

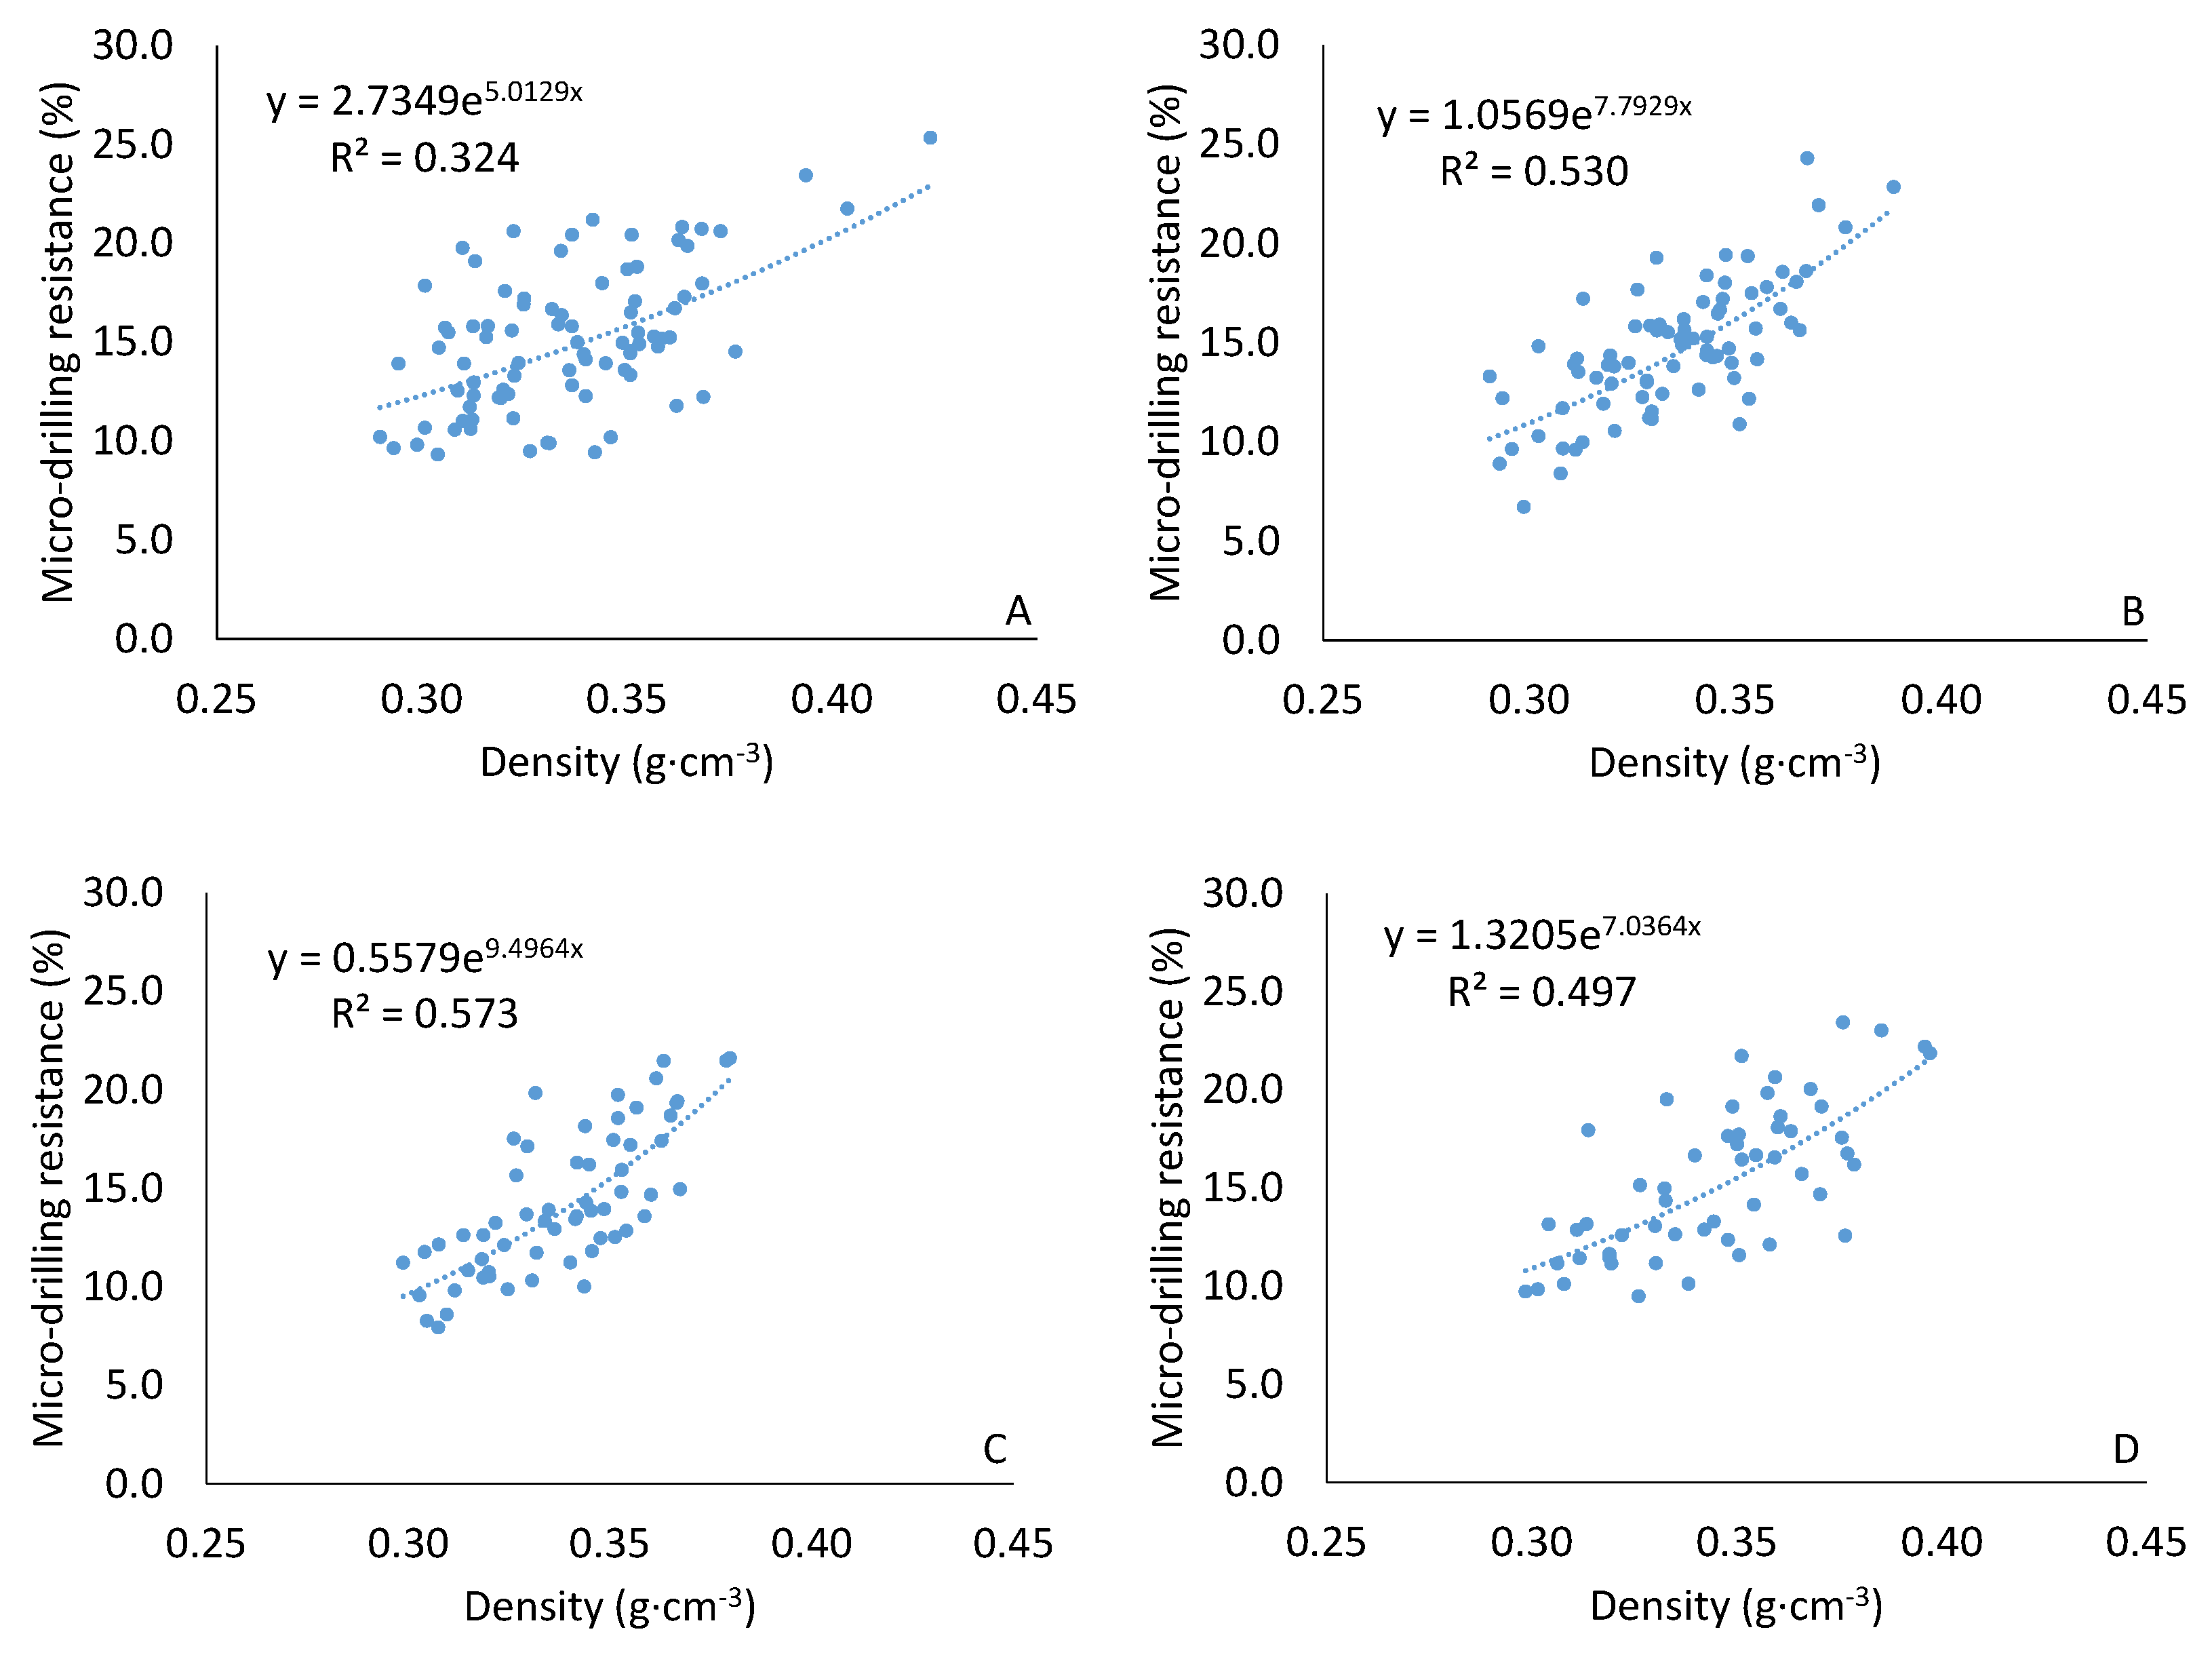
3.1.2. Wood Density Measured through Microdrilling Resistance as Proxy

The results of this research aspect indicate that the Resistograph’s resistance value increased as wood density increased. This finding was realised through a y = aebx exponential regression equation (x, wood density; y, microdrilling resistance value indicated by the Resistograph). The significance test of the relationship indicated that these were average-to-strong (V1), very strong (V2, V3, V4), and very significant for all variants (V1: r = 0.575, V2: r = 0.728, V3: r = 0.757, V4: r = 0.712) (Figure 4).

3.2. Microdrilling Resistance in Norway Spruce (Picea abies (L.) H. Karst) Stands Installed through Different Plantation Variants

Microdrilling resistance showed a value of 15.1 ± 3.6% in V1, followed by 14.8 ± 3.3% in V2, 14.3 ± 3.6% in V3, and 15.5 ± 4.1% in V4. From the perspective of the considered parameters, tree population variability was low, ranging between 3.8% (V4) and 4.5% (V2) (Table 3).
Analysing the averages for each work variant from the experimental plot indicated a decrease in microdrilling resistance as the number of trees·ha−1 used in planting increased from V1 to V3. V4 showed the highest value for the analysed parameter in the conditions in which the largest number of trees·ha−1 (7510) were used in plantation.
The study realised in the experimental plot installed by using different plantation variants showed that microdrill wood resistance decreased as diameter increased, according to the specifications of each planting variant. This was realised through a y = axb regression (y, microdrilling resistance; and x, diameter). The significance test of relation showed average but significant correlation intensity (V1: r = 0.403000, V2: r = 0.401000, V3: r = 0.466000, V4: r = 0.469000) (Figure 5).
The relationship between resistance in the microdrill resistance test and trunk diameter in combination with plantation variant showed the superiority of V3 over all other variants, up to the 22 cm diameter. This was followed by V3 over V1 and V2, up to the 12 cm diameter. The disposition of density in relation to the diameter for V1 and V2 indicated their similarity, with lower values for low diameters, and higher values for high diameters in the case of V1. These characteristics, specific to each planting variant, occurred as microdrilling resistance decreased in relation to diameter (Figure 6).
A two-way t-test indicated that there was no significant correlation between the V1 and V2, V1 and V4, and V2 and V4 variants, while differences between variants V1 and V3, V2 and V3, and V3 and V4 were significant (Table 4).

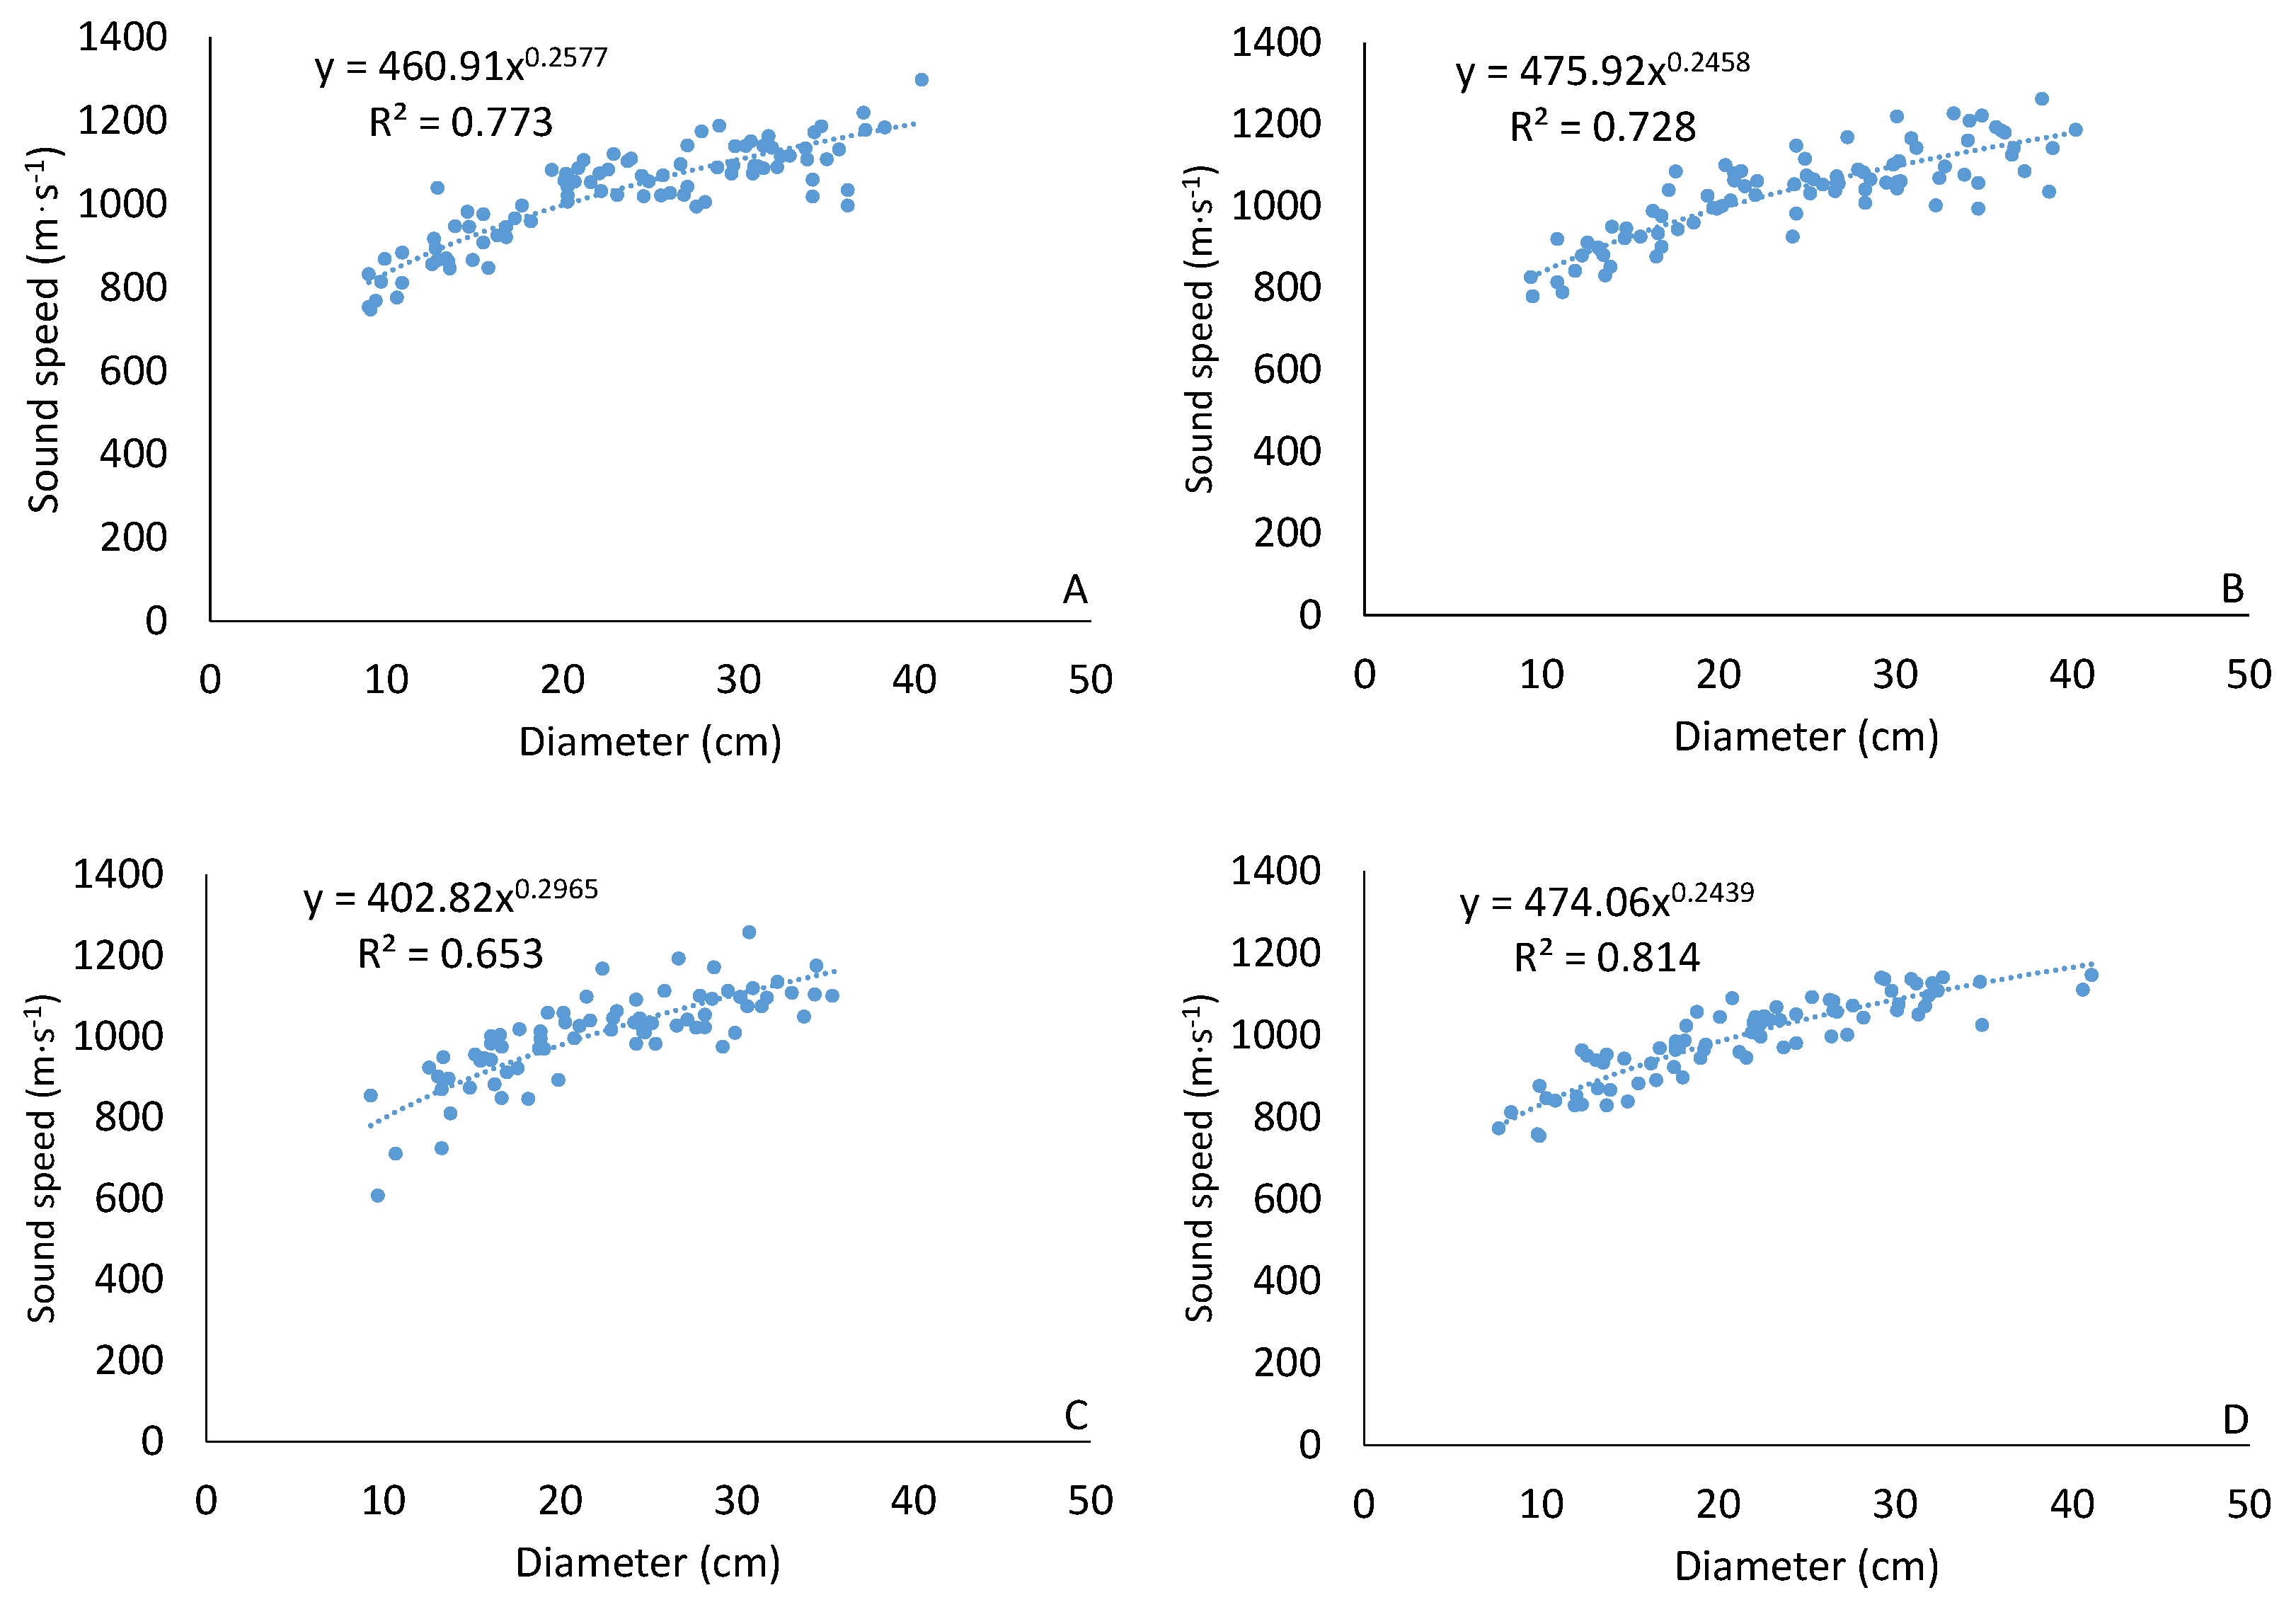
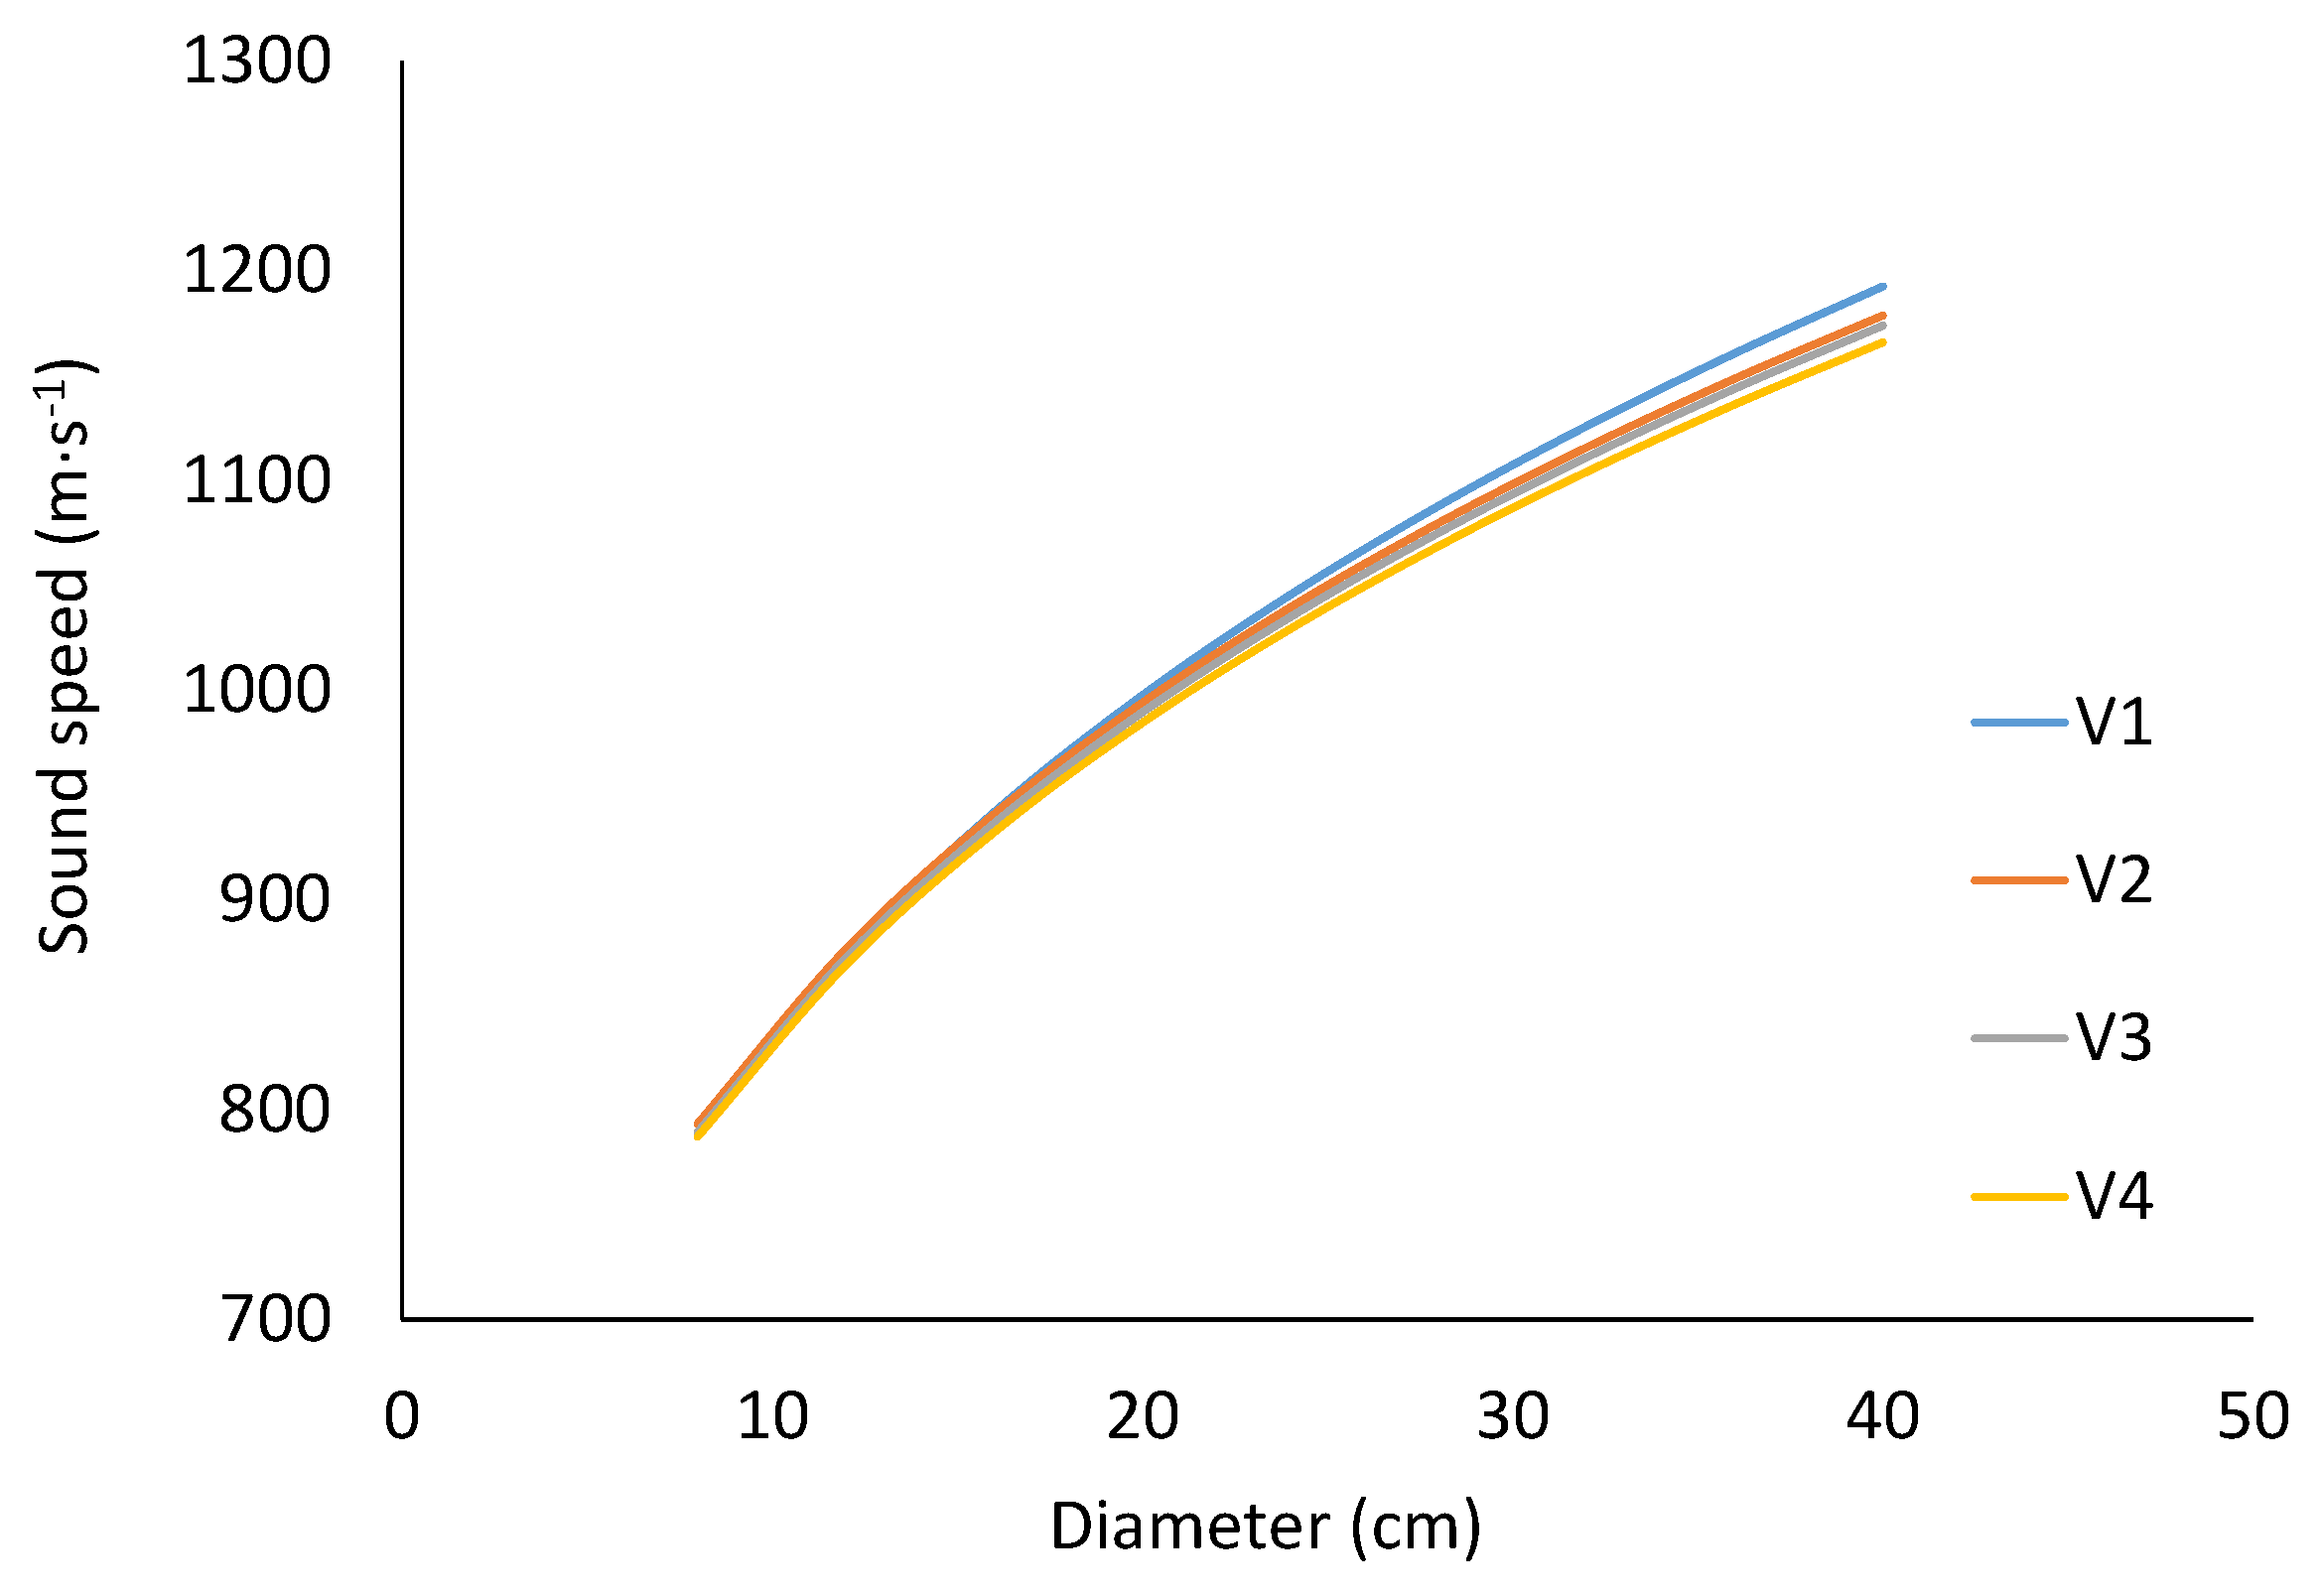
3.3. Sound Speed in Norway Spruce (Picea abies (L.) H. Karst) Stands Installed by Using Different Plantation Variants

Sound speed in the wood of trees from an experimental plot installed using different plantation variants, was recorded with the following results: 1032.9 ± 109.5 m·s−1 (V1), 1025.4 ± 116.2 m·s−1 (V2), 1003.9 ± 111.2 m·s−1 (for V3) and 989.9 ± 101.3 m·s−1 (V4). From this perspective, tree population variability was low, with a variation coefficient ranging from 8.8% (V2) to 9.8% (V4) (Table 5).
Analysis of averages for each work variant from the experimental plot indicated a sound speed decrease as the number of trees·ha−1 used for planting increased.
Regarding sound speed, research on an experimental plot showed that sound speed increased as diameter increased, specific for each plantation variant. Furthermore, it conformed to a y = axb power regression (y, sound speed; x, diameter). Conditions were robust and strongly significant after applying the significance test for the relationship (V1: r = 0.889, V2: r = 0.865, V3: r = 0.807, V4: r = 0.903) (Figure 7).
Considering the data, the carriage of average speed sound curves in relation to diameter and planting variant indicated the superiority of V1 values over all other variants. If values were sensibly equal for small diameters, all analysed variants displayed the greatest speed sound at high diameters for the planting variant that used the smallest number of trees·ha−1 (2500) in the installation phase. On the other hand, the planting variant that used the largest number of trees·ha−1 (7510) during installation showed the lowest sound speed (Figure 8).
The two-way t test result indicated that no significant interaction was detected between the V1 and V2 variants, while differences between variants V1 and V4, V1 and V3, V2 and V3, V2 and V4, and V3 and V4 were significant (Table 6).

4. Discussion

4.1. Wood Density

On the basis of stational conditions, Norway spruce wood density was between 0.308 and 0.418 g·cm−3, with an average of 0.356 g·cm−3 [9]. In the case of Norway spruce, wood density decreases as annual ring width increases. This wood is thus thicker than young wood, with a density that could be greater by 1.5 up to 4 times [2]. Results obtained by [10] showed that variation between annual rings represents 11–27% of total wood density variation, while small density differences (3–6%) are recorded between different trunk heights. Density difference between early and latewood is higher for growth rings located near the trunk’s central part, unlike ones situated towards the exterior. Within the annual ring, in the earlywood area, density reached 0.350 g·cm−3 and increased steadily towards the latewood, showing maximal values of 0.848 g·cm−3. This shows that wood density had maximal variability at the level of the annual ring, with values from 0.300 up to 1.0 g·cm−3 [48]. Other investigations obtained average density values of 0.461 g·cm−3 for the annual ring, 0.750 g·cm−3 for the average density of old wood, and 0.415 g·cm−3 for the young one [49]. Wood density from the annual ring strongly reacts to June droughts and can lead to the apparition of a false annual ring. Wood density is relatively independent of growth rate and climatic conditions during the first part of the vegetation season, but increases as radial growth decreases. During the second stage of the vegetation season, densities between 0.427 and 0.540 g·cm−3 were recorded at a 0.25 trunk height with 290 mm precipitations, while the number decreased between 0.354 and 0.471 g·cm−3 during 411 mm precipitation [17]. Regarding wood density variation on height, Norway spruce (Picea abies (L.) H. Karst) showed very low variation. As such, the measured density value for the 1.30 height was 0.386 g·cm−3, with an average value of 0.386 g·cm−3 for 0.7 of the tree’s height, and 0.385 g·cm−3 as an average value for plates collected from the entire trunk length [50]. Research regarding Norway spruce wood density indicated 0.378 g·cm−3 as a value for the entire considered lot. This value corresponds to the inferior limit of the dry wood’s data interval for which different authors indicated density of 0.330–0.680 g·cm−3, with an average value of 0.430–0.470 g·cm−3 [51]. Our research shows that a Norway spruce (Picea abies (L.) H. Karst) stand of 40 years has wood density in relation with the planting variant between 0.3376 g·cm−3 (2500 trees·ha−1) and 0.3445 g·cm−3 (7510 trees·ha−1).

4.2. Microdrilling Resistance

The combined effect of wood moisture, drill rotation speed, and drilling advance speed showed that Norway spruce (Picea abies (L.) H. Karst) has an average microdrill resistance of 13.3% [52,53,54]. Wood treatments showed that variation between 15% and 16% on the radial and axial directions can significantly impact microdrilling resistance measurements [55,56]. The influence of drilling direction on Scots pine, common beech, oak, and poplar shows that average resistance advancement decreased by approximately 27% for Scots pine, 33% for common beech, 37% for oak, and 40% for poplar when the drilling direction was changed from longitudinal to tangential. The conclusion was that drilling direction must be considered when predicting wood properties on the basis of microdrilling resistance measurements [57,58,59].
In addition to evaluating microdrilling resistance, this research included predicting the wood elasticity model for certain species in different moisture conditions and advancement speed by measuring microdrilling resistance. With the strong correlation between microdrilling resistance and wood properties, it is recommended to evaluate the density and predict elasticity for healthy wood [52,60,61,62]. A common tendency of elasticity based on thinning types indicates that it decreases as intervention intensity increases. These results show that both microdrilling resistance and acoustic technology can be used for monitoring wood properties changes and for determining how silvicultural works affect wood properties. This information helps managers in choosing the most efficient treatment for future plantations to obtain the desired fibre quality [5]. Expedite and precise estimations of wood quality based on the resistance value indicated by the Resistograph device can be realised to indirectly measure wood density if prior relations are calculated and validated for certain areas and species. The microdrilling method offers considerable advantages compared with other methods regarding diminishing tree damage, fast functioning, and a more sensible recording value scale [25,63,64]. Together with its potential for density proxy, the method offers a series of distinctive advantages: it is nondestructive, offers additional information during measurements, and can be useful in studying the fragmentation process, the cavity spatial model, insect holes, and wood cracks [20,65]. The method can also be used in areas where destructive sampling is legally prohibited (natural reservations and protected areas) [66,67]. The current research, realised in a Norway spruce (Picea abies (L.) H. Karst) experimental plot installed with different plantation variants, shows that the trunk’s microdrilling resistance (at DBH height of 1.30 m) varied between 15.1% (2500 trees·ha−1) and 15.5% (7510 trees·ha−1).

4.3. Sound Speed

The main elements that can influence the propagation of acoustic waves are the following: (1) The position of wood fibres in relation with concerning the direction of the acoustic wave’s propagation; propagation time is lower where waves propagate along fibres, and higher when they propagate perpendicularly on the fibres [41]. In the case where wood rot location is followed, it is recommended that acoustic sounds propagate in a transversal direction. This eliminates the possibility of waves propagating longitudinally to avoid rot samples. (2) Rot presence: significantly influences the type of acoustic waves propagation. Propagation time is approximately 800 μs·m−1 for healthy wood from a Douglas trunk, while the value reaches 3200 μs·m−1 or even more for degraded wood [68,69]. (3) Wood moisture: plays an important role, especially when it shows values lower than 30%. In this case, it is necessary to use correction factors. Experiments showed that the 1.03 correction factor is necessary to be used at 16.5% moisture and temperature of 27 °C [68,69]. Its influence is not significant for moisture greater than 30%, while propagation time does not need to be corrected.
The speed of waves measured perpendicularly on the trunk depends on the tree species. In our case, it varied between 931 and 1085 m·s−1 for [70]. Other research showed that the average radial sound speed in the Norway spruce wood had an average of 1361.3 m·s−1, taking into account the measurement direction and level (1450 m·s1 perpendicularly on the wood fibre, 1320 m·s−1 parallel with the wood fibre). For trees that present defects in their internal structure, a significant decrease to the 1172.2 m·s−1 value was detected [71]. Research realised with the acoustic tomography method on Norway spruce wood showed tangential speed values between 1048 and 1483 m·s1 [72,73]. The current research, realised in an experimental Norway spruce plots installed with different plantation variants, showed that sound speed in a tree’s trunk (at the height of 1.30 m) varied between 1063.9 (2500 trees·ha−1) and 1021.9 m·s−1 (7510 trees·ha−1).
Investigations of which regression model would be most suitable for a scatter plot in relation to experimental data showed that the power regression equation was used because it best predicts wood density values that are in graphical diameter values. The exponential regression equation was used because it best predicted microdrilling resistance indicated by the Resistograph device values that were in the graphical values of wood density. The power regression equation was used because it best predicted the sound speed values depending on diameter. The two equation parameters were slightly different between these four variants due to the used planting scheme (2500, 3300, 5000, and 7510 trees·ha−1), development conditions, and the influence of abiotic factors because the experimental plot was not covered by forestry work until the current research.

5. Conclusions

Changes in wood density indicate that the average values for the planting variant from the experimental plot decreased as the number of trees·ha−1 used for plantation increased from 2500 to 5000. The planting variant with the largest number of trees·ha−1 (7510) had the highest value. Faster-growing trees in less dense planting variants have a higher value of wood density in the same DBH class compared to variants with a small number of trees·ha−1 (2500, 3330). This was visible for the DBH average, and not greater than 20 cm (for variant with 5000 trees·ha−1) or 30 cm (for variant with 7510 trees·ha−1). Depending on DBH, variation in wood density was smaller in dense plantings (7510 trees·ha−1) compared to that in variants with a small number of trees·ha−1 (2500, 3330). Differentiation in density was the greatest for sparse plantations that had a small coefficient of correlation. This suggests more homogeneous wood volumetric density in dense planting variants and similar physical properties (correlated with density).
Microdrilling resistance showed a decrease as the number of trees·ha−1 used in planting increased from 2500 to 5000. The highest value for the analysed parameter was in conditions in which the largest number of trees·ha−1 (7510) were used in plantation. In experimental plots with different plantation variants, a lower wood density has a lower physical property (lower microdrill resistance). Wood density increased when microdrilling resistance (used as proxy) increased through an exponential regression.
Regarding sound speed, the average for each variant from the experimental plot indicated a sound speed decrease as the number of trees·ha−1 used for planting increased from 2500 to 7510. Presented results showed a relationship between DBH values and studied physical properties. This relationship is more evident for variants with low planting density (e.g., 2500, 3330 trees·ha−1) than that for dense planting variants (e.g., 7510 trees·ha−1). The explanation may be that the growth of trees in dense plantings is slower; in less dense planting variants, the increase in wood is greater, and as a result, the wood volumetric density dependence on the DBH value is greater.

Author Contributions

Conceptualization, R.V., A.I. and C.S.; methodology, R.V. and L.D.; analysis, R.V., C.C. and G.S.; resources, C.C. and G.S.; data curation R.V. and C.S.; writing—original draft preparation, R.V. and A.I.; writing—review and editing, R.V., L.D. and A.I. All authors have read and agreed to the published version of the manuscript.

Funding

This research was funded by the Nucleu Program, project PN 19070402, and the CresPerfInst project (contract no. 34PFE/30.12.2021).

Institutional Review Board Statement

Not applicable.

Informed Consent Statement

Not applicable.

Data Availability Statement

Not applicable.

Conflicts of Interest

The authors declare no conflict of interest. The funders had no role in the design of the study; in the collection, analyses, or interpretation of data; in the writing of the manuscript, or in the decision to publish the results.

References

  1. Ciubotaru, A. Sortarea și Prelucrarea Lemnului; Editura Lux Libris: Brașov, Romania, 1997; p. 194. [Google Scholar]
  2. Beldeanu, E.C. Unele consideraţii privind noţiunea de calitate a lemnului. Rev. Pădurilor 2007, 3, 23–27. [Google Scholar]
  3. Beldeanu, E.C. Produse Forestiere; Editura Universității Transilvania: Brașov, Romania, 2008; p. 331. [Google Scholar]
  4. Zhang, S.Y. Wood Quality Attributes and Their Impacts on Wood Utilization. In Proceedings of the XII World Forestry Congres, Québec City, QC, Canada, 21–28 September 2003; Available online: https://www.fao.org/3/XII/0674-B1.htm (accessed on 2 February 2022).
  5. Rudnicki, M.; Wang, X.; Ross, R.J.; Allison, R.B.; Perzynski, K. Measuring Wood Quality in Standing Trees—A Review; General Technical Report. FPL-GTR-248; U.S. Department of Agriculture, Forest Service, Forest Products Laboratory: Madison, WI, USA, 2017; 13p. [Google Scholar]
  6. Barnett, J.; Jeronimidis, G. Wood Quality and Its Biological Basis; Blackwell: London, UK, 2003. [Google Scholar]
  7. Diaconu, D.; Wassenberg, M.; Spiecker, H. Variability of European beech wood density as influenced by interactions between tree-ring growth and aspect. For. Ecosyst. 2016, 3, 6. [Google Scholar] [CrossRef] [Green Version]
  8. Gräns, D.; Hannrup, B.; Isik, F.; Lundqvist, S.O.; Mckeand, S. Genetic variation and relationships to growth traits for microfibril angle, wood density and modulus of elasticity in a Picea abies clonal trial in southern Sweden. Scand. J. For. Res. 2009, 24, 494–503. [Google Scholar] [CrossRef]
  9. Câmpu, V.R.; Ciubotaru, A. Apparent volumic mass models for pulpwood Norway spruce logs. Rural. Dev. 2013, 6, 215–220. [Google Scholar]
  10. Jyske, T.; Mäkinen, H.; Saranpää, P. Wood density within Norway spruce stems. Silva Fenn. 2008, 42, 439–455. [Google Scholar] [CrossRef] [Green Version]
  11. Gerendiain, A.Z.; Peltola, H.; Pulkkinen, P.; Kellomaki, S. Effects of genetic entry and competition by neighbouring trees on growth and wood properties of cloned Norway spruce (Picea abies). Ann. For. Sci. 2009, 66, 806. [Google Scholar] [CrossRef]
  12. Chen, Z.-Q.; Gil, M.R.G.; Karlsson, B.; Lundqvist, S.-O.; Olsson, L.; Wu, H.X. Inheritance of growth and solid wood quality traits in a large Norway spruce population tested at two locations in southern Sweden. Tree Genet. Genomes 2014, 10, 1291–1303. [Google Scholar] [CrossRef]
  13. Molteberg, D.; Høibø, O. Development and variation of wood density, kraft pulp yield and fibre dimensions in young Norway spruce (Picea abies). Wood Sci. Technol. 2006, 40, 173–189. [Google Scholar] [CrossRef]
  14. Wassenberg, M.; Chiu, H.-S.; Guo, W.; Spiecker, H. Analysis of wood density profiles of tree stems: Incorporating vertical variations to optimize wood sampling strategies for density and biomass estimations. Trees 2015, 29, 551–561. [Google Scholar] [CrossRef]
  15. Franceschini, T.; Bontemps, J.D.; Gelhaye, P.; Rittie, D.; Herve, J.C.; Gegout, J.C.; Leban, J.M. Decreasing trend and fluctuations in the mean ring density of Norway spruce through the twentieth century. Ann. For. Sci. 2010, 67, 816. [Google Scholar] [CrossRef] [Green Version]
  16. Franceschini, T.; Longuetaud, F.; Bontemps, J.-D.; Bouriaud, O.; Caritey, B.-D.; Leban, J.-M. Effect of ring width, cambial age, and climatic variables on the within-ring wood density profile of Norway spruce (Picea abies L. Karst.). Trees 2013, 27, 913–925. [Google Scholar] [CrossRef]
  17. Bouriaud, O.; Leban, J.; Bert, M.; Deleuze, C. Intra-annual variations in climate influence growth and wood density of Norway spruce. Tree Physiol. 2005, 25, 651–660. [Google Scholar] [CrossRef] [PubMed] [Green Version]
  18. Gjerdrum, P.; Eikenes, B. A model for spatial wood density gradients in Norway spruce stems and stochastic between-stem dissimilarities for basic and dry density. Wood Sci. Technol. 2014, 48, 71–84. [Google Scholar] [CrossRef]
  19. Yatskov, M.; Harmon, M.E.; Krankina, O.N. A chronosequence of wood decomposition in the boreal forests of Russia. Can. J. Forest Res. 2003, 33, 1211–1226. [Google Scholar] [CrossRef]
  20. Kahl, T.; Wirth, C.; Mund, M.; Böhnisch, G.; Schulze, E. Using drill resistance to quantify the density in coarse woody debris of Norway spruce. Eur. J. Forest Res. 2009, 128, 467–473. [Google Scholar] [CrossRef] [Green Version]
  21. Wessels, C.B.; Malan, F.S.; Rypstra, T. A review of measurement methods used on standing trees for the prediction of some mechanical properties of timber. Eur. J. Forest Res. 2011, 130, 881–893. [Google Scholar] [CrossRef]
  22. Polge, H. Fifteen years of wood radiation densitometry. Wood Sci. Technol. 1978, 12, 187–196. [Google Scholar] [CrossRef]
  23. Habermehl, A.; Ridder, H.-W.; Seidl, P. Computerized tomographic systems as tools for diagnosing urban tree health. Acta Hortic. 1999, 496, 261–268. [Google Scholar] [CrossRef]
  24. Wang, S.Y.; Chiu, C.M.; Lin, C.J. Application of the drilling resistance method for annual ring characteristics: Evaluation of Taiwania (Taiwania cryptomeribides) trees grown with different thinning and pruning treatments. J. Wood Sci. 2003, 49, 116–124. [Google Scholar] [CrossRef]
  25. Gao, S.; Wang, X.; Wiemann, M.C.; Brashaw, B.K.; Ross, R.J.; Wang, L. A critical analysis of methods for rapid and nondestructive determination of wood density in standing trees. Ann. For. Sci. 2017, 74, 27. [Google Scholar] [CrossRef] [Green Version]
  26. Johnstone, D.M.; Ades, P.K.; Moore, G.M.; Smith, I.W. Predicting Wood Decay in Eucalypts Using an Expert System and the IML-Resistograph Drill. Arboric. Urban For. 2007, 33, 76–82. [Google Scholar] [CrossRef]
  27. Leong, E.C.; Burcham, D.C.; Fong, Y.K. A purposeful classification of tree decay detection tools. Arboric. J. Int. J. Urban For. 2012, 34, 91–115. [Google Scholar] [CrossRef]
  28. Vlad, R.; Zhiyanski, M.; Dincă, L.; Sidor, C.G.; Constandache, C.; Pei, G.; Ispravnic, A.; Blaga, T. Assessment of the density of wood with stem decay of Norway spruce trees using drill resistance. Comptes Rendus l’Acad. Bulg. Sci. 2018, 71, 1502–1510. [Google Scholar] [CrossRef]
  29. Rinn, F. Basics of micro-resistance drilling for timber inspection. Holztechnologie 2012, 53, 24–28. [Google Scholar]
  30. Ross, R.J. Nondestructive Evaluation of Wood: Second Edition; General Technical Report FPLGTR-238; U.S. Department of Agriculture, Forest Service, Forest Products Laboratory: Madison, WI, USA, 2015. [Google Scholar]
  31. Macchioni, N.; Brunetti, M.; Pizzo, B.; Burato, P.; Nocetti, M.; Palanti, S. The timber structures in the Church of the Nativity in Bethlehem: Typologies and diagnosis. J. Cult. Herit. 2012, 13, 42–53. [Google Scholar] [CrossRef]
  32. Anthony, R.W. Nondestructive evaluation: Wood. APT Bull. 2010, 41, 1–6. [Google Scholar]
  33. Feio, A.O.; Machado, J.S.; Lourenço, P.B. Compressive behavior and NDT correlations for chestnut wood (Castanea sativa Mill.). In Structural Analysis of Historical Constructions; Taylor & Francis Group: London, UK, 2005; pp. 369–375. [Google Scholar]
  34. Hiroshima, T. Applying age-based mortality analysis to a natural forest stand in Japan. J. For. Res. 2014, 19, 379–387. [Google Scholar] [CrossRef]
  35. Rinn, F.; Schweingruber, F.H.; Schar, E. Resistograph and X-ray density charts of wood comparative evaluation of drill resistance profiles and x-ray density charts of different wood species. Holzforschung 1996, 50, 303–311. [Google Scholar] [CrossRef]
  36. Wang, X.; Allsion, R.B. Decay detection in red oak trees using a combination of visual inspection, acoustic testing, and resisatnce microdrilling. Arboric. Urban For. 2008, 34, 1–4. [Google Scholar] [CrossRef]
  37. Rinn, F. Typical trends in resistance drilling profiles of trees. Arborist News 2014, 23, 42–47. [Google Scholar]
  38. Dincă, L.; Murariu, G.; Enescu, C.M.; Achim, F.; Georgescu, L.; Murariu, A.; Timiș-Gânsac, V.; Holonec, L. Productivity differences between southern and northern slopes of Southern Carpathians (Romania) for Norway spruce, silver fir, birch and black alder. Not. Bot. Horti Agrobot. Cluj-Napoca 2020, 48, 1070–1084. [Google Scholar] [CrossRef]
  39. Murariu, G.; Dinca, L.; Tudose, N.; Crisan, V.; Georgescu, L.; Munteanu, D.; Dragu, M.D.; Rosu, B.; Mocanu, G.D. Structural Characteristics of the Main Resinous Stands from Southern Carpathians. Romania. Forests 2021, 12, 1029. [Google Scholar] [CrossRef]
  40. Lawday, G.; Hodges, P.A. The analytical use of stress waves for the detection of decay in standing trees. Forestry 2000, 73, 447–456. [Google Scholar] [CrossRef]
  41. David, E.C. Cercetări Privind Calitatea Arborilor pe Picior Situați în Localități, Parcuri și Aliniamente Stradale. Ph.D. Thesis, Universitatea Transilvania din Brașov, Brașov, Romania, 2011; p. 360. [Google Scholar]
  42. Sambuelli, L.; Socco, L.V.; Godio, A.; Nicolotti, G.; Martinis, R. Ultrasonic, electric and radar measurements for living trees assessment. Boll. Geofis. Teor. Appl. 2003, 44, 253–279. [Google Scholar]
  43. Chave, J. Measuring Wood Density for Tropical Forest Trees. A Field Manual for the CTFS. 2005. Available online: http://chave.ups-tlse.fr/chave/wood-density-protocol.pdf (accessed on 23 January 2022).
  44. Isik, F.; Li, B. Rapid assessment of wood density of live trees using the Resistograph for selection in tree improvement programs. Can. J. For. Res. 2003, 33, 2426–2435. [Google Scholar] [CrossRef]
  45. Dowding, B.; Murphy, G.; Murphy, G. Estimating Within Tree Spatial Changes in Acoustic Velocity in Felled Douglas-fir Stems. Int. J. For. Eng. 2014, 22, 24–34. [Google Scholar] [CrossRef]
  46. Dell. STATISTICA 12.5; Dell: Round Rock, TX, USA, 2020. [Google Scholar]
  47. Microsoft. MS Excel 2019 Software; Microsoft: Redmond, WA, USA, 2020. [Google Scholar]
  48. Decoux, V.; Varcin, E.; Leban, J.M. Relationships between the intra-ring wood density assessed by X-ray densitometry and optical anatomical measurements in conifers. Consequences for the cell wall apparent density determination. Ann. Sci. For. 2004, 61, 251–262. [Google Scholar] [CrossRef] [Green Version]
  49. Raiskila, S.; Saranpää, P.; Fagerstedt, K.; Laakso, T.; Löija, M.; Mahlberg, R.; Paajanen, L.; Ritschkoff, A.C. Growth rate and wood properties of Norway spruce cutting clones on different sites. Silva Fenn. 2006, 40, 247–256. [Google Scholar] [CrossRef] [Green Version]
  50. Repola, J. Models for vertical wood density of Scots pine, Norway spruce and birch stems, and their application to determine average wood density. Silva Fenn. 2006, 40, 673–685. [Google Scholar] [CrossRef] [Green Version]
  51. Horáček, P.; Fajstavr, M.; Stojanović, M. The variability of wood density and compression strength of Norway spruce (Piceaabies /L./Karst.) within the stem. Beskydy 2017, 10, 17–26. [Google Scholar] [CrossRef] [Green Version]
  52. Sharapov, E.; Wang, X.; Smirnova, E.; Wacker, J.P. Wear behavior of drill bits in wood drilling resistance measurements. Wood Fiber Sci. 2018, 50, 154–166. [Google Scholar] [CrossRef] [Green Version]
  53. Frühwald, K.; Hasenstab, A.; Osterloh, K. Detection of fungal damage of wood in early stages using drilling cores and drilling resistance comparedâ to non-destructive testing methods. In Proceedings of the 2011 International Conference on Structural Health Assessment of Timber Structures (SHATIS’11), Lisbon, Portugal, 16–17 June 2011. [Google Scholar]
  54. Imposa, S.; Mele, G.; Corrao, M.; Coco, G.; Battaglia, G. Characterization of decay in the wooden roof of the S. Agata Church of Ragusa Ibla (Southeastern Sicily) by means of sonic tomography and resistograph penetration tests. Int. J. Arch. Herit. 2014, 8, 213–223. [Google Scholar] [CrossRef] [Green Version]
  55. Brashaw, B.K.; Vatalaro, R.J.; Wacker, J.P.; Ross, R.J. Condition Assessment of Timber Bridges: 1: Evaluation of a Micro-Drilling Resistance Tool; General Technical Report FPL–GTR–159; U.S. Department of Agriculture, Forest Service, Forest Products Laboratory: Madison, WI, USA, 2005; p. 8. [Google Scholar]
  56. Sharapov, E.; Brischke, C.; Militz, H. Effect of grain direction on drilling resistance measurements in wood. Int. J. Archit. Herit. 2020, 15, 250–258. [Google Scholar] [CrossRef]
  57. Wang, S.Y.; Lin, C.J. Application of the drill resistance method for density boundary evaluation of earlywood and latewood of Taiwania (Taiwania cryptomerioides Hay.) plantation wood. Taiwan J. For. Sci. 2001, 16, 196–199. [Google Scholar]
  58. Guller, B.; Guller, A.; Kazaz, G. Is Resistograph an appropriate tool for the annual ring measurement of Pinus brutia? In Proceedings of the International Conference NDE Safety, Seč, Czech Rebublic, 31 October–1 November 2012; pp. 89–94. [Google Scholar]
  59. Sharapov, E.; Brischke, C.; Militz, H. Assessment of preservative-treated wooden poles using drilling-resistance measurements. Forests 2020, 11, 20. [Google Scholar] [CrossRef] [Green Version]
  60. Feio, A.O.; Machado, J.S.; Lourenço, P.B. Testing and modeling of a traditional timber mortise and tenon joint. Mater. Struct. 2014, 47, 213–225. [Google Scholar] [CrossRef] [Green Version]
  61. Kloiber, M.; Tippner, J.; Hrivnak, J. Mechanical properties of wood examined by semi-destructive devices. Mater. Struct. 2014, 47, 199–212. [Google Scholar] [CrossRef]
  62. Nowak, T.P.; Jasienko, J.; Hamrol-Bielecka, K. In situ assessment of structural timber using the resistance drilling method—Evaluation of usefulness. Constr. Build. Mater. 2016, 102, 403–415. [Google Scholar] [CrossRef]
  63. Oliveira, J.T.; Wang, X.; Vidaurre, G.B. Assessing specific gravity of young Eucalyptus plantation trees using a resistance drilling technique. Holzforschung 2017, 71, 137–145. [Google Scholar] [CrossRef]
  64. Vlad, R.; Ispravnic, A.; Sidor, C.G.; Pei, G. Resistance to micro-drilling of wood with rot on Norway spruce standing trees. Rev. Silvic. Cineg. 2019, 24, 37–43. [Google Scholar]
  65. Allison, R.B.; Wang, X. Nondestructive testing in the urban forest. In Nondestructive Evaluation of Wood: Second Edition; Ross, R.J., Ed.; General Technical Report, FPL-GTR-238; U.S. Department of Agriculture, Forest Service, Forest Products Laboratory: Madison, WI, USA, 2015; pp. 77–86. [Google Scholar]
  66. Christensen, M.; Hahn, K.; Mountford, E.P.; Odor, P.; Standovar, T.; Rozenbergar, D.; Diaci, J.; Wijdeven, S.; Meyer, P.; Winter, S.; et al. Dead wood in European beech (Fagus sylvatica) forest reserves. For. Ecol. Manag. 2005, 210, 267–282. [Google Scholar] [CrossRef]
  67. Mund, M.; Schulze, E.D. Impacts of forest management on the carbon budget of European beech (Fagus sylvatica) forests. Allg. Forst Jagdztg. 2006, 177, 47–63. [Google Scholar]
  68. Ross, R.J.; Brashaw, B.K.; Wang, X.; White, R.; Pellerin, R.F. Wood and Timber Condition Assessment Manual; Forest Products Society: Madison, WI, USA, 2004. [Google Scholar]
  69. Ross, R.J.; Pellerin, R.F. Inspection of Timber Structures Using Stress Wave Timing Nondestructive Evaluation Tools. In Wood and Timber Condition Assessment Manual: Second Edition; General Technical Report FPL-GTR-234; U.S. Department of Agriculture, Forest Service, Forest Products Laboratory: Madison, WI, USA, 2014; pp. 13–21. [Google Scholar]
  70. Mattheck, C.G.; Bethge, K.A. Detection of decay in trees with the Metriguard stress wave timer. J. Arboric. 1993, 19, 374–378. [Google Scholar]
  71. Krajnc, L.; Kadunc, A.; Straže, A. The use of ultrasound velocity and damping for the detection of internal structural defects in standing trees of European beech and Norway spruce. Holzforschung 2019, 73, 807–836. [Google Scholar] [CrossRef]
  72. Maurer, H.; Schubert, S.; Bachle, F.; Clauss, S.; Gsell, D.; Dual, J.; Niemz, P. A simple anisotropy correction procedure for acoustic wood tomography. Holzforschung 2006, 60, 567–573. [Google Scholar] [CrossRef] [Green Version]
  73. Schubert, S.; Gsell, D.; Dual, J.; Motavalli, M.; Niemz, P. Acoustic wood tomography on trees and the challenge of wood heterogeneity. Holzforschung 2009, 63, 107–112. [Google Scholar] [CrossRef] [Green Version]
Figure 1. Location of experimental plot with different plantation variants for Norway spruce.
Forests 13 00540 g001
Figure 2. Relationship between diameter and wood density differentiated on plantation variants (A) V1, 2500; (B) V2, 3330; (C) V3, 5000; (D) V4, 7510 trees·ha−1.
Forests 13 00540 g002
Figure 3. Average density curves in relation with diameter and plantation variant.
Forests 13 00540 g003
Figure 4. Relationship between wood density and microdrilling resistance indicated by Resistograph device (A) V1, 2500; (B) V2, 3330; (C) V3, 5000; (D) V4, 7510 trees·ha−1.
Forests 13 00540 g004
Figure 5. Relationship between trunk diameter and wood resistance to microdrilling, differentiated on plantation variant (A) V1, 2500; (B) V2, 3330; (C) V3, 5000; (D) V4, 7510 trees·ha−1.
Forests 13 00540 g005
Figure 6. Average curves of microdrilling resistance in relation with diameter and planting variant.
Forests 13 00540 g006
Figure 7. Relationship between diameter and sound speed differentiated on planting variants (A) V1, 2500; (B) V2, 3330; (C) V3, 5000; (D) V4, 7510 trees·ha−1.
Forests 13 00540 g007
Figure 8. Average sound speed curves in relation with diameter and planting variant.
Forests 13 00540 g008
Table 1. General statistical parameters (average, standard deviation, variation coefficient—%, asymmetry, excess, minimum and maximum) for density (g·cm−3).
Statistic ParametersExperimental Variant
V1V2V3V4
Average0.33760.33740.33670.3445
Standard deviation0.0260.0190.0210.029
Variation coefficient12.83716.93015.66211.787
Excess0.543−0.806−0.3470.152
Asymmetry0.637−0.103−0.0700.144
Min0.2890.2980.2900.271
Max0.4240.3790.3880.430
Table 2. Result summary of two-way t significance tests between four variants of experimental plot for density.
ParametersExperimental Variant
V1/V2V1/V3V1/V4V2/V3V2/V4V3/V4
Variance0.000551/
0.000242
0.000551/
0.000291
0.000551/
0.000536
0.000242/
0.000291
0.000242/
0.000536
0.000291/
0.000536
Observations969696969696
df959595959595
t theoretic1.8591.8591.8591.8591.8591.859
t experimental0.3180.414−34.2370.100−1.770−2.225
pp > 0.05p > 0.05p < 0.05p > 0.05p < 0.05p < 0.05
Significance--*-**
-: no significance; *: significant.
Table 3. General statistical parameters (average, standard deviation, variation coefficient—%, asymmetry, excess, minimum and maximum) for microdrilling resistance (%).
Statistic ParametersExperimental Variant
V1V2V3V4
average15.13614.74914.29215.531
standard deviation3.6083.3153.6024.062
variation coefficient4.1944.4493.9683.822
excess−0.300.418−0.754−0.351
asymmetry0.4280.2880.3850.543
min9.3276.7267.9459.496
max25.33624.31021.62326.637
Table 4. Result summary of two-way t-tests for significance between four variants of experimental plot for microdrilling.
ParametersExperimental Variant
V1/V2V1/V3V1/V4V2/V3V2/V4V3/V4
Variance4.097/5.3034.097/9.7804.097/11.1125.303/9.7805.303/11.1129.780/11.112
Observations969696969696
df959595959595
t theoretic1.8591.8591.8591.8591.8591.859
t experimental2.4832.970−0.5473.134−1.365−19.405
pp > 0.05p < 0.05p > 0.05p < 0.05p > 0.05p < 0.05
Significance-*-*-*
-: no significance; *: significant.
Table 5. General statistical parameters (average, standard deviation, variation coefficient—%, asymmetry, excess, minimum and maximum) for sound speed (m·s−1).
Statistic ParametersExperimental Variant
V1V2V3V4
Average1032.8491025.3761003.907989.859
Standard deviation109.509116.205111.220101.247
Variation coefficient9.4328.8249.0269.777
Excess−0.370−0.2071.885−0.567
Asymmetry−0.278−0.543−0.885−0.459
Min780747607754
Max1263129812581147
Table 6. Result summary of two-way t significance tests between four variants of experimental plot for microdrilling.
ParametersExperimental Variant
V1/V2V1/V3V1/V4V2/V3V2/V4V3/V4
Variance18,458.4/
16,684.2
18,458.4/
16,630.4
18,458.4/
16,116.5
16,684.2/
16,630.4
16,684.2/
16,116.5
16,630.4/
16,116.5
Observations969696969696
df959595959595
t theoretic185918591859185918591859
t experimental23564203512963,24013,5118312
pp > 0.05p < 0.05p < 0.05p < 0.05p < 0.05p < 0.05
Significance-*****
-: no significance; *: significant.
Publisher’s Note: MDPI stays neutral with regard to jurisdictional claims in published maps and institutional affiliations.

