1. Introduction
Building construction is an industry with high energy consumption and high pollution, which has caused serious impacts on the environment and ecology [
1,
2,
3]. Exploring new building materials has become an urgent problem to be solved in the civil engineering industry. In recent years, various countries have issued a series of policies to promote the application of green buildings, and the development of the green buildings is an inevitable trend of economic and social development. Bamboo has the advantages of fast growth, wide distribution, high strength, high strength-to-weight ratio, and high rigidity-to-weight ratio [
4,
5,
6,
7,
8,
9,
10]. It has been successfully applied in several projects [
11,
12,
13] and is a new kind of green building material with great development potential. China is one of the main distribution centers of bamboo resources in the world and Phyllostachys edulis (moso) bamboo is the most widely distributed bamboo species with the highest economic value. However, due to the lack of design specifications, the application of bamboo structure is quite limited at present. Before the bamboo structure can be safely designed and popularized, it is essential to put forward the design strengths of bamboo material. However, currently, there is little relevant research on the design strengths of
P. edulis bamboo material.
The development of an engineering structure design method has experienced the evolution process from the Allowable Stress Design (ASD) method to the probabilistic Limit State Design (LSD) method based on reliability theory. Currently, the LSD method based on the reliability theory is widely accepted and adopted in the design specification of various countries, including the wood structure specifications of Chinese and European code. The LSD method has also been adopted for emerging new materials that no design specifications are available. For example, Xiao et al. [
14] obtained the design values of the recombined bamboo strengths through the LSD method. Zhong et al. [
15] analyzed the reliability of the compressive strength of bamboo fiber-reinforced composite (BFRC) and proposed the recommended design strengths. Gong et al. [
16] carried out the compression test parallel to the grain of Chinese fir specification wood and obtained the design strengths by using the LSD method. Zhu et al. [
17] analyzed the reliability of wood structure and proposed the strength determination method of wood material. Liu et al. [
18] analyzed the influence of probability distribution model and fitting data points on reliability. Therefore, the probabilistic LSD method based on reliability was used to study the design value of strength (design strength) for the
P. edulis bamboo material in this research. Reliability analysis methods include the central point method, JC method, and so on. Each method has its advantages. In order to simplify the calculation, a reliability calculation formula based on the central point method is adopted in this paper.
Reasonable determination of the standard value of strength for bamboo material is the basis of bamboo structure design. It was found that there are great differences in the standard values of the strength obtained by different sample quantities; however, there is no uniform regulation on the sample quantity at present. The resistance factor is the key index to determine the design strengths of materials, and the target reliability is the key parameter to determine the resistance factor. At present, the target reliability is determined according to the ductile or brittle failure characteristics of the materials, while the bending resistance of bamboo presents semi-brittle failure characteristics, and there is still lack of a method to evaluate the target reliability of semi-brittle materials.
The strength design values are very important for the design and application of bamboo structures. In order to study the design strengths of the P. edulis bamboo material, the following work was carried out in this research for Chinese P. edulis bamboo material: (1) Systematic tests on different strengths of P. edulis bamboo material were carried out, including compression strength parallel to the grain, bending strength, tension strength parallel to the grain, shear strength parallel to the grain, and compression strength perpendicular to the grain; (2) The influence of sample quantity on the standard values of strengths was analyzed, and then the standard values of bamboo strengths were obtained based on Bootstrap method; (3) A method for determining the target reliability of bending strength of bamboo was explored; (4) The LSD method based on the reliability theory was used to analyze the relationship between the reliability and the resistance factor considering different load combinations; (5) The design strengths of the P. edulis bamboo material were determined, and the adjustment method for the design strengths under different load combinations and load effect ratios was proposed.
2. Materials and Methods
2.1. Materials
The strength tests of the
P. edulis bamboo material were carried out according to ISO 22157-2019 [
19] and JG/T199-2007 [
20] standards. The bamboo material used in the experiment is
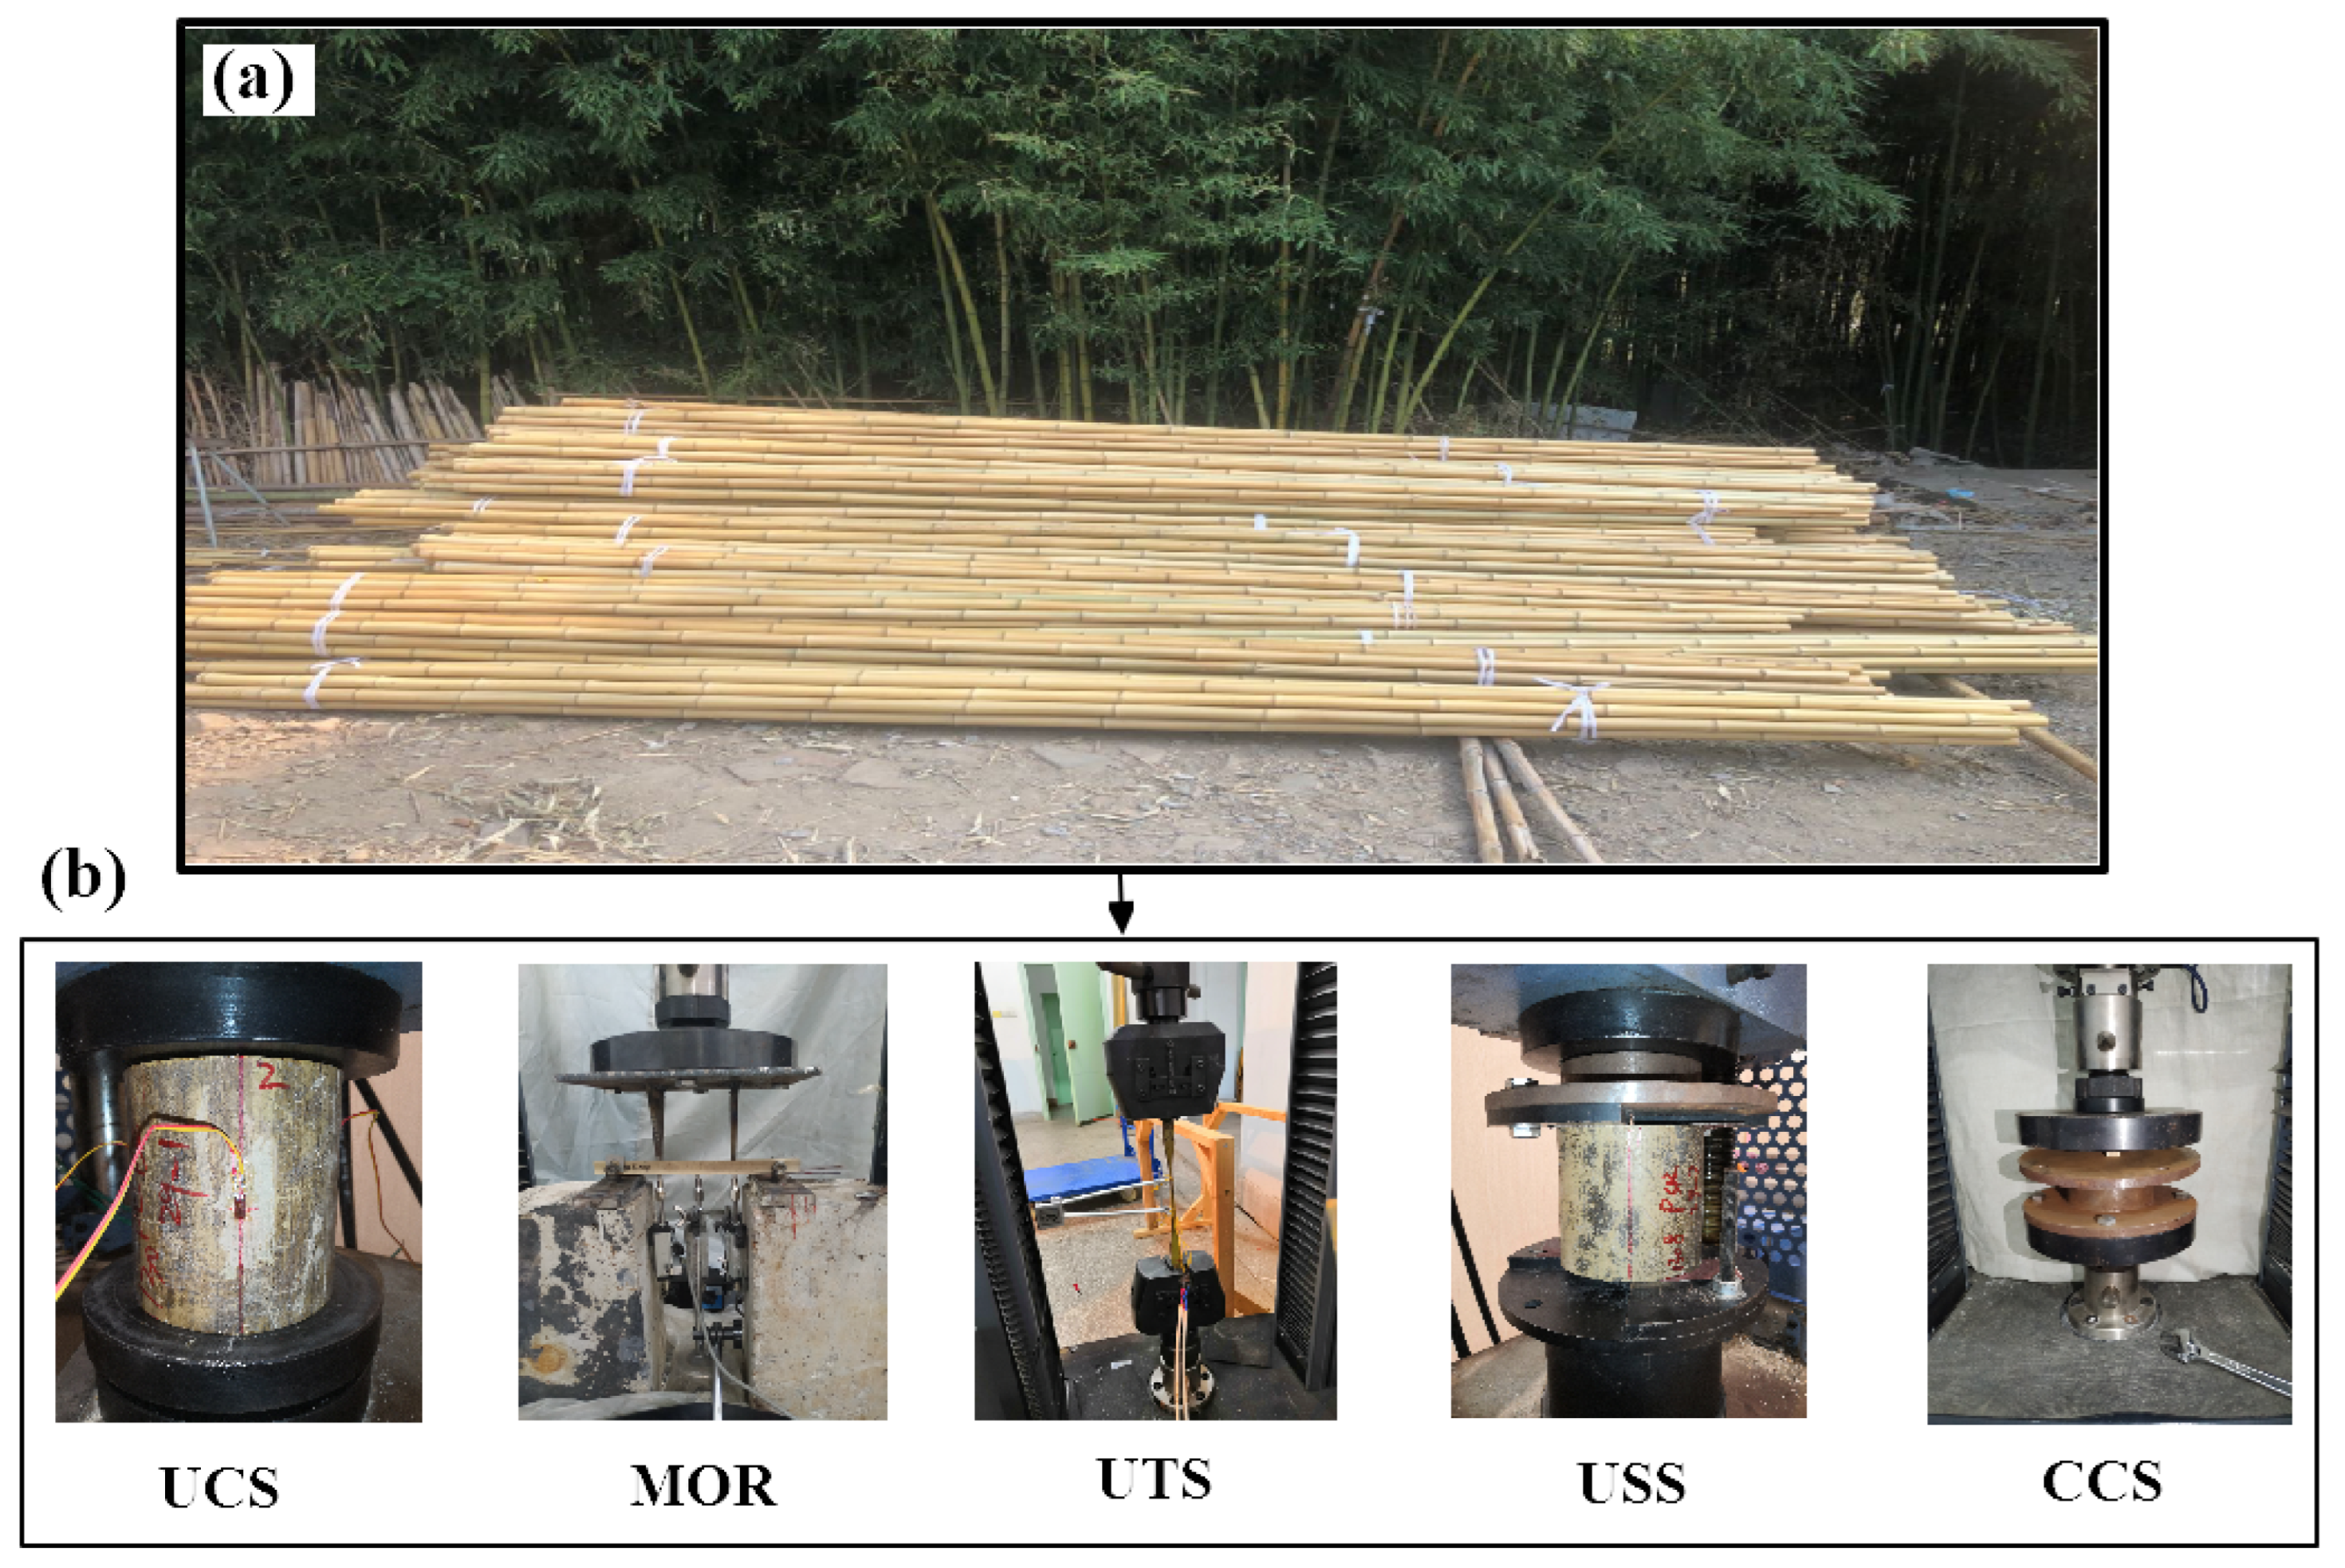
P. edulis bamboo, which was collected from Hunan Province of China and was about 4 years old. Bamboo poles with a diameter of breast height (DBH) of about 100 mm were cut down randomly in the bamboo forest (
Figure 1a). The length of the cut bamboo stalks were 6 m. The length of the components was cut to be 3 m from the bottom of bamboo poles. The material tests were carried out on the smaller specimens among all the three-meter long bamboo components. The material specimens for compression tests parallel to the grain and shear tests parallel to the grain were prepared with a height–diameter ratio of 1. The specimens for bending tests were prepared with a size of 220 mm × 15 mm × t mm. The dimensions of specimens are 330 mm × 15 mm × t mm for tension tests parallel to the grain, and 15 mm × 15 mm × t mm for compression tests perpendicular to the grain.
2.2. Mechanical Properties
According to the standards [
19,
20], a series of tests of the specimens, including compression strength parallel to the grain (
UCS), bending strength (
MOR), tensile strength parallel to the grain (
UTS), shear strength parallel to the grain (
USS), and compression strength perpendicular to the grain (
CCS), were conducted using an universal testing machine, as shown in
Figure 1b. In the formal loading stages,
UCS,
UTS, and
USS tests were loaded at the rate of 0.01 mm/s,
MOR tests were loaded at the rate of 1 N/s, and
CCS tests were loaded at the rate of 20 N/mm
2 per minute. The calculation formulas for the design strengths of
P. edulis bamboo are as follows [
19,
20]:
where
fm could be the compression strength parallel to the grain, tensile strength parallel to the grain, shear strength parallel to the grain, and the compression strength perpendicular to the grain (MPa), MOR is the bending strength,
Pmax is the maximum load (N), A is the corresponding stressed area (mm
2),
t is the thickness (mm) of the bending specimen, and
h is the height of the bending specimens (mm).
2.3. Moisture Content Adjustment
After completing the mechanical property tests, the moisture contents of the bamboo material were tested according to the standard JG/T199-2007 [
20], where the samples used to determine the moisture contents were immediately taken from the vicinity of the failure location. The moisture content calculation formula of
P. edulis bamboo is given below [
20]:
where
W is the moisture content (%),
m is the air-dry mass of the specimens (g), and
m0 is the absolutely dry mass of the specimens (g).
In order to calculate the design strengths of bamboo material from the obtained test results, the corresponding moisture content reference point should be determined initially (12% according to JG/T199-2007 [
20]); due to that, the moisture content has a significant effect on the test results of bamboo material [
21]. The modified formula of the mechanical property value is given below [
20]:
where
f12 (MPa) is the strength of the pecimens under the standard moisture content (12%),
fW (MPa) is the strength when the moisture content is
W, and
KW is the moisture content correction factor, which is related to the specific strength index and moisture content [
20]. The strength of the bamboo material in this research is based on the standard moisture content (12%).
2.4. Outlier Detection
Considering that it is difficult to avoid outliers in the test data, the
IQR criterion was adopted in this research to process the data and to eliminate the outliers. The
IQR criterion assumes that the data conform to normal distribution, and the detection interval is calculated by taking the quantile value
Q1 at 1/4 and
Q2 at 3/4 of the data array from small to large. The distance between two quantiles (
IQR) is calculated by the Formula (6), and the outlier detection interval is calculated by the Formula (7) [
22]:
2.5. Bootstrap Resampling Method
Given an original data sample with size k, of which the overall distribution type and statistical parameters are unknown, the Bootstrap sample can be obtained by randomly sampling k times from the original data sample (which can be put back). The mean value and the variance of the Bootstrap sample were statistically analyzed to infer the characteristics of the overall distribution type and statistical parameters. The original sample of a given variable is
X = {
x1,
x2,...,
xk}, after which random sampling was conducted on it, and each value represented by xi in the original sample has an equal probability of being selected and can be selected repeatedly. After sampling k times, Bootstrap samples were obtained as
Yj = {
y1j,
y2j,…,
ykj}. The mean a (
Yj) and variance
S2 (
Yj) of Bootstrap samples were calculated by the Formulas (8) and (9) [
23]:
The above operation were repeated p times to obtain the sample set B = {Y1, Y2,…, Yp}, containing p Bootstrap samples. The mean and the variance of p Bootstrap samples can be used to evaluate the overall sample characteristics of the variables.
2.6. Probability Distribution Model and Calculation of Standard Values of Material Strength
Normal distribution and Lognormal distribution are often used to fit the data in the statistics of material strength. The distribution functions
f(
x) of the two models are given below [
24]:
Lognormal distribution:
where
x is a random variable, representing the measured
UCS,
MOR,
UTS,
USS, and CCS in this study,
a and
S are the mean value and standard deviation, respectively,
b is the average value of ln
x, and
c is the standard deviation of ln
x.
The calculation formula for the standard value of strength conforming to normal distribution is shown in Formula (12), and the calculation formula for the standard value of strength conforming to Lognormal distribution is shown in Formula (13) [
25]:
where
fk is the standard value of strength (MPa),
a,
S, and
COV are the mean value (MPa), standard deviation (MPa), and coefficient of variation, respectively, and
η is the characteristic coefficient (1.645) [
25].
2.7. Reliability Analysis Method
The calculation formula of reliability
β is as follows [
26]:
where
KR is the uncertainty of resistance and
δR is the coefficient of resistance variation,
γR is the partial coefficient of resistance,
γG and
γQ are permanent load component coefficients and variable load component coefficients, respectively,
KG and
δG are the permanent load uncertainty coefficient and variation coefficient, respectively,
KB and
δB are the variable load uncertainty coefficient and variation coefficients, respectively, and
ρ is the ratio of the variable load to the standard value of the permanent load effect.
The design strengths of the bamboo material are calculated by Formula (15) [
27]:
where
fd is the design value of bamboo material (MPa),
fk is the standard strength value of bamboo material (MPa),
KP is the uncertainty coefficient of the calculation model,
KA is the indefinite coefficient of geometric parameters,
KQ is the reduction coefficient of the strength of the material converted into the strength of the component, and the calculation formula is shown in Formula (16) [
27]:
where
KQ1 is the coefficient considering the influence of natural defects,
KQ2 is the coefficient considering the influence of drying defects,
KQ3 is the influence coefficient considering long-term load, and
KQ4 is the coefficient considering the size effect.
3. Results
3.1. Standard Values of Material Strengths
The strength values of the bamboo material were taken as the average strengths of the small clear specimens at both ends of the bamboo components. Statistical parameters such as mean value (
a), standard deviation (
S), and coefficient of variation (
COV) were analyzed, and the results are shown in
Table 1, where n represents the number of components. It can be seen from
Table 1 that bamboo material has excellent tensile strength, compression strength parallel to the grain, and bending strength properties, and different strength values are ranked as
UTS >
MOR >
UCS >
CCS >
USS.
To analyze the influence of sample size on the statistical results of bamboo material strengths, taking the bending strength as an example, 10, 30, 50, 70, and 100 datapoints were randomly selected from 115 original samples after eliminating outliers according to the
IQR criterion. Each sample was repeated 100 times, and the error value was obtained by comparing the mean value of the 5th percentile value of the 100 samples with the 5th percentile value of the original sample. The statistical results of the error value are shown in
Table 2. As can be seen from
Table 2, the mean error between the 5th percentile value of bending strength obtained by conventional sampling and the 5th percentile value of the original sample under different sample quantities is 24.46%. The Bootstrap method was used to re-sample the data of different sample numbers randomly selected above, and the frequency of re-sampling was 10,000 times. It is shown that the mean value of the bending strength error is 5.26% using the Bootstrap method.
The above sampling process shows that the number of samples has significant influence on the standard value of material strength. The Bootstrap resampling method is used to calculate the standard value of material strength with small errors and can significantly reduce the influence of sample size. Moreover, the same influence of number of samples were found on other material strength indexes.
The Bootstrap method was used to process the data after removing the outliers through the
IQR criterion, and the number of resampling was 10,000 times. The characteristic values of the bamboo material strengths calculated by the Bootstrap method are shown in
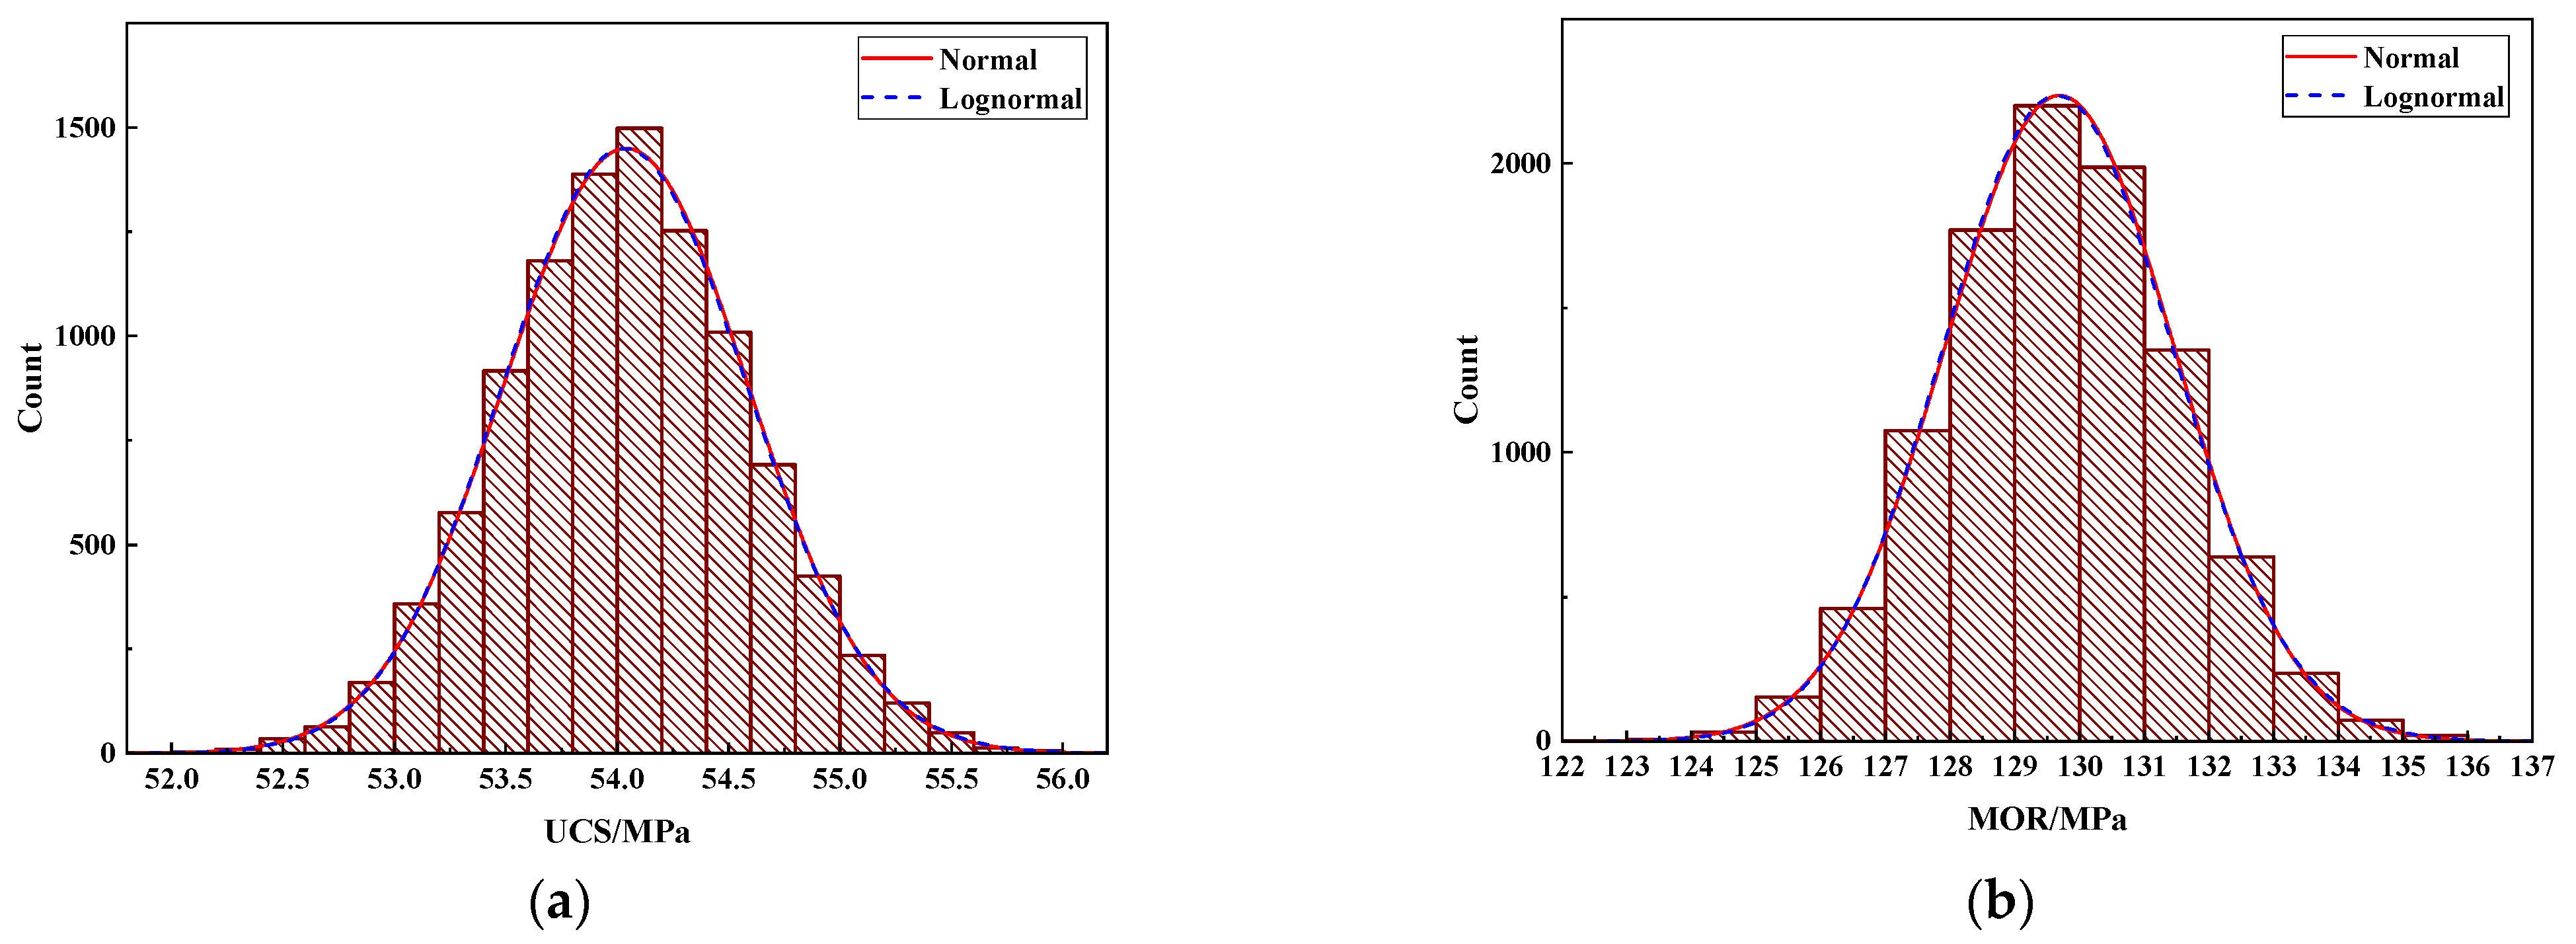
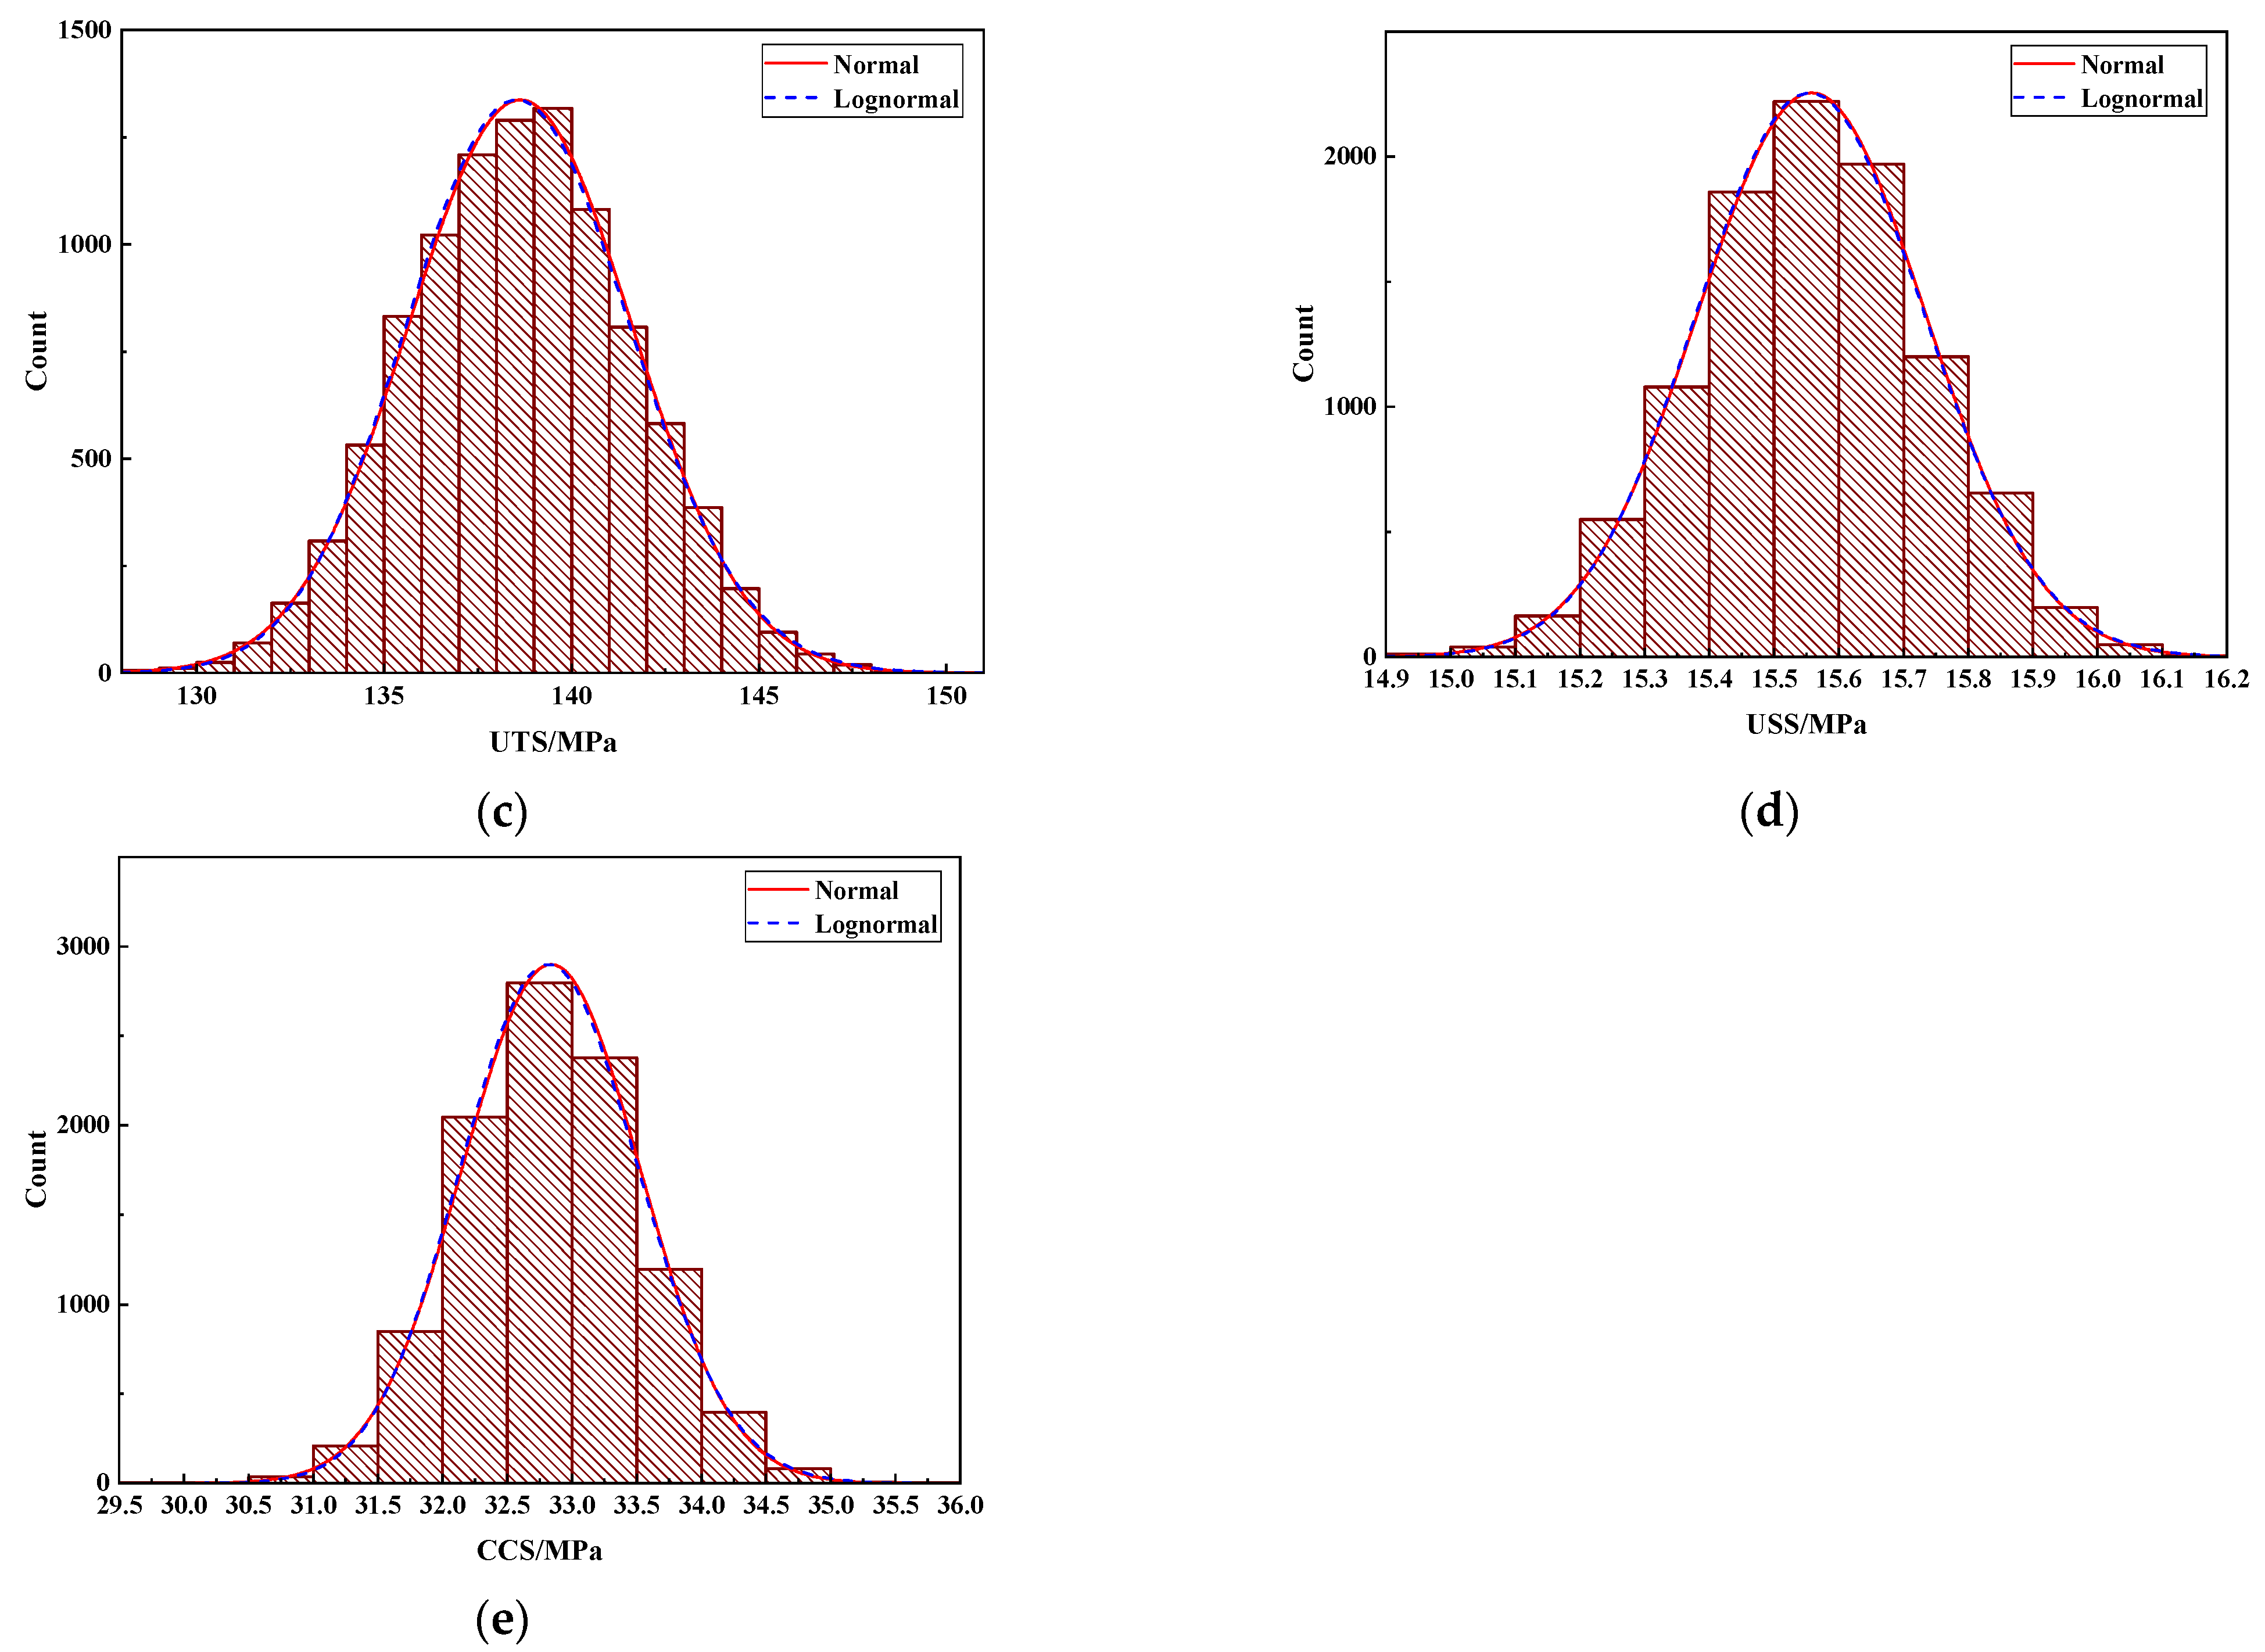
Table 1, where 10,000 bamboo material strength values obtained by the Bootstrap analysis were statistically analyzed to obtain the distribution histogram, as shown in
Figure 2. It can be seen from
Figure 2 that the distribution curves obtained by using the Normal function and Lognormal function to fit the bamboo material strength values are almost identical. Therefore, the standard values of the bamboo material strengths calculated by using the fitting results of Normal function and Lognormal function tended to be equal. In this research, Formula (10) is used to calculate the standard values of the bamboo material strengths, and the results are shown in
Table 1. The obtained standard values of
UCS,
MOR,
UTS,
USS, and
CCS are 53.14 MPa, 126.75 MPa, 133.72 MPa, 15.27 MPa, and 31.71 MPa, respectively.
3.2. Statistical Parameters of Load and Resistance
This research considered the influence of five different kinds of loads (dead load, live load of residential floor, live load of office floor, wind load with 30-year recurrence period, and snow load with 50-year recurrence period) and the statistical parameters of all kinds of loads shown in Standard for design of timber structures (GB 50005-2017) [
27]. Moreover, the composition of bamboo material is similar to that of wood material; the statistical parameters of resistance can be referred to the specification GB 50005-2017 [
27].
3.3. Reliability Indexes
According to the standards GBJ 68-1984 [
25] and GB 50153-2008 [
28], the reliability indexes under the ultimate bearing capacity of structural members within the design service life (50 years) should be determined according to the structural safety level and the failure type of structural members. This research considered the structural safety level as the second level.
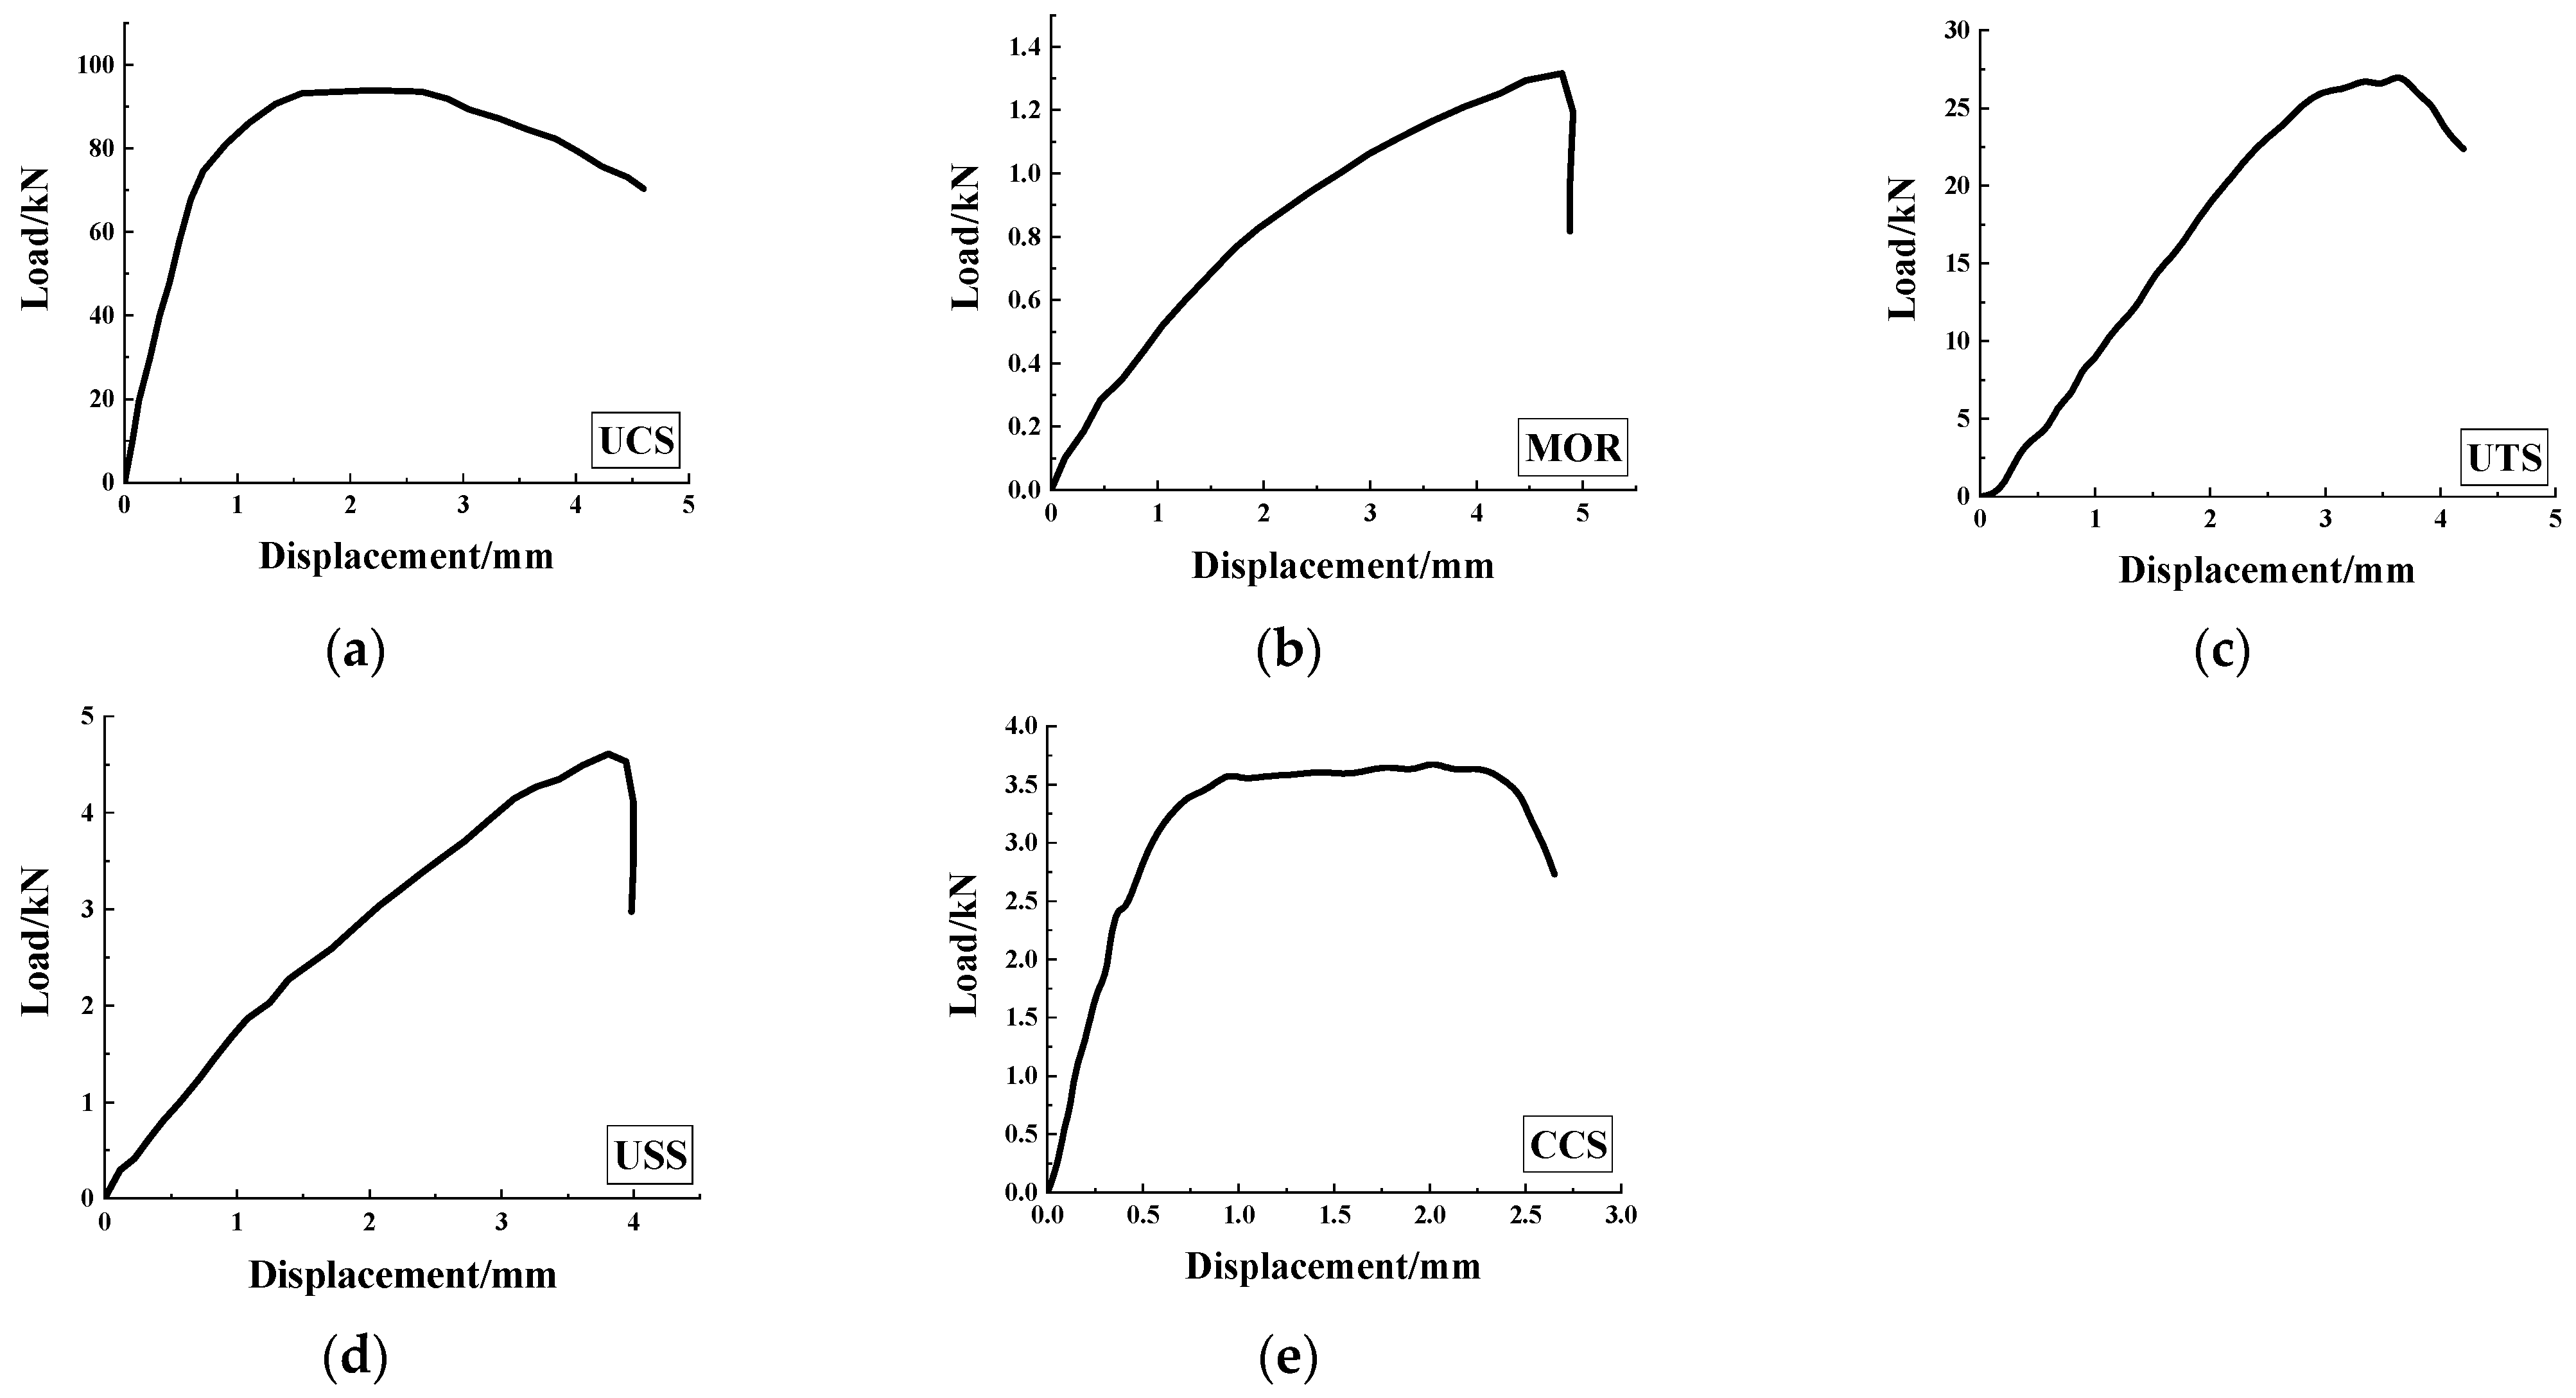
Figure 3 shows the typical load-displacement curves of the material properties tests. According to the test results shown in
Figure 3 together with the results of existing literature [
29,
30,
31,
32], the compression strength parallel to the grain and compression strength perpendicular to the grain of bamboo material display obvious ductility failure characteristics. Therefore, the target reliability
β0 of the compression strength parallel to the grain and compression strength perpendicular to the grain of bamboo material is set to 3.2. The tensile strength parallel to the grain and shear strength parallel to the grain show obvious brittle failure characteristics; therefore, the target reliability
β0 is 3.7.
The load-displacement curves obtained from the bending performance tests of bamboo material are similar [
33,
34]. At the initial stage of loading, specimens went through a long elastic stage, and at the later stage of loading, some specimens appeared a plastic stage, even though the plastic stage was relatively short. Therefore, this research considered it unsafe if the bending resistance of bamboo material is classified as a ductile failure (
β0 = 3.2), and moderate if it is classified as a brittle failure (
β0 = 3.7).
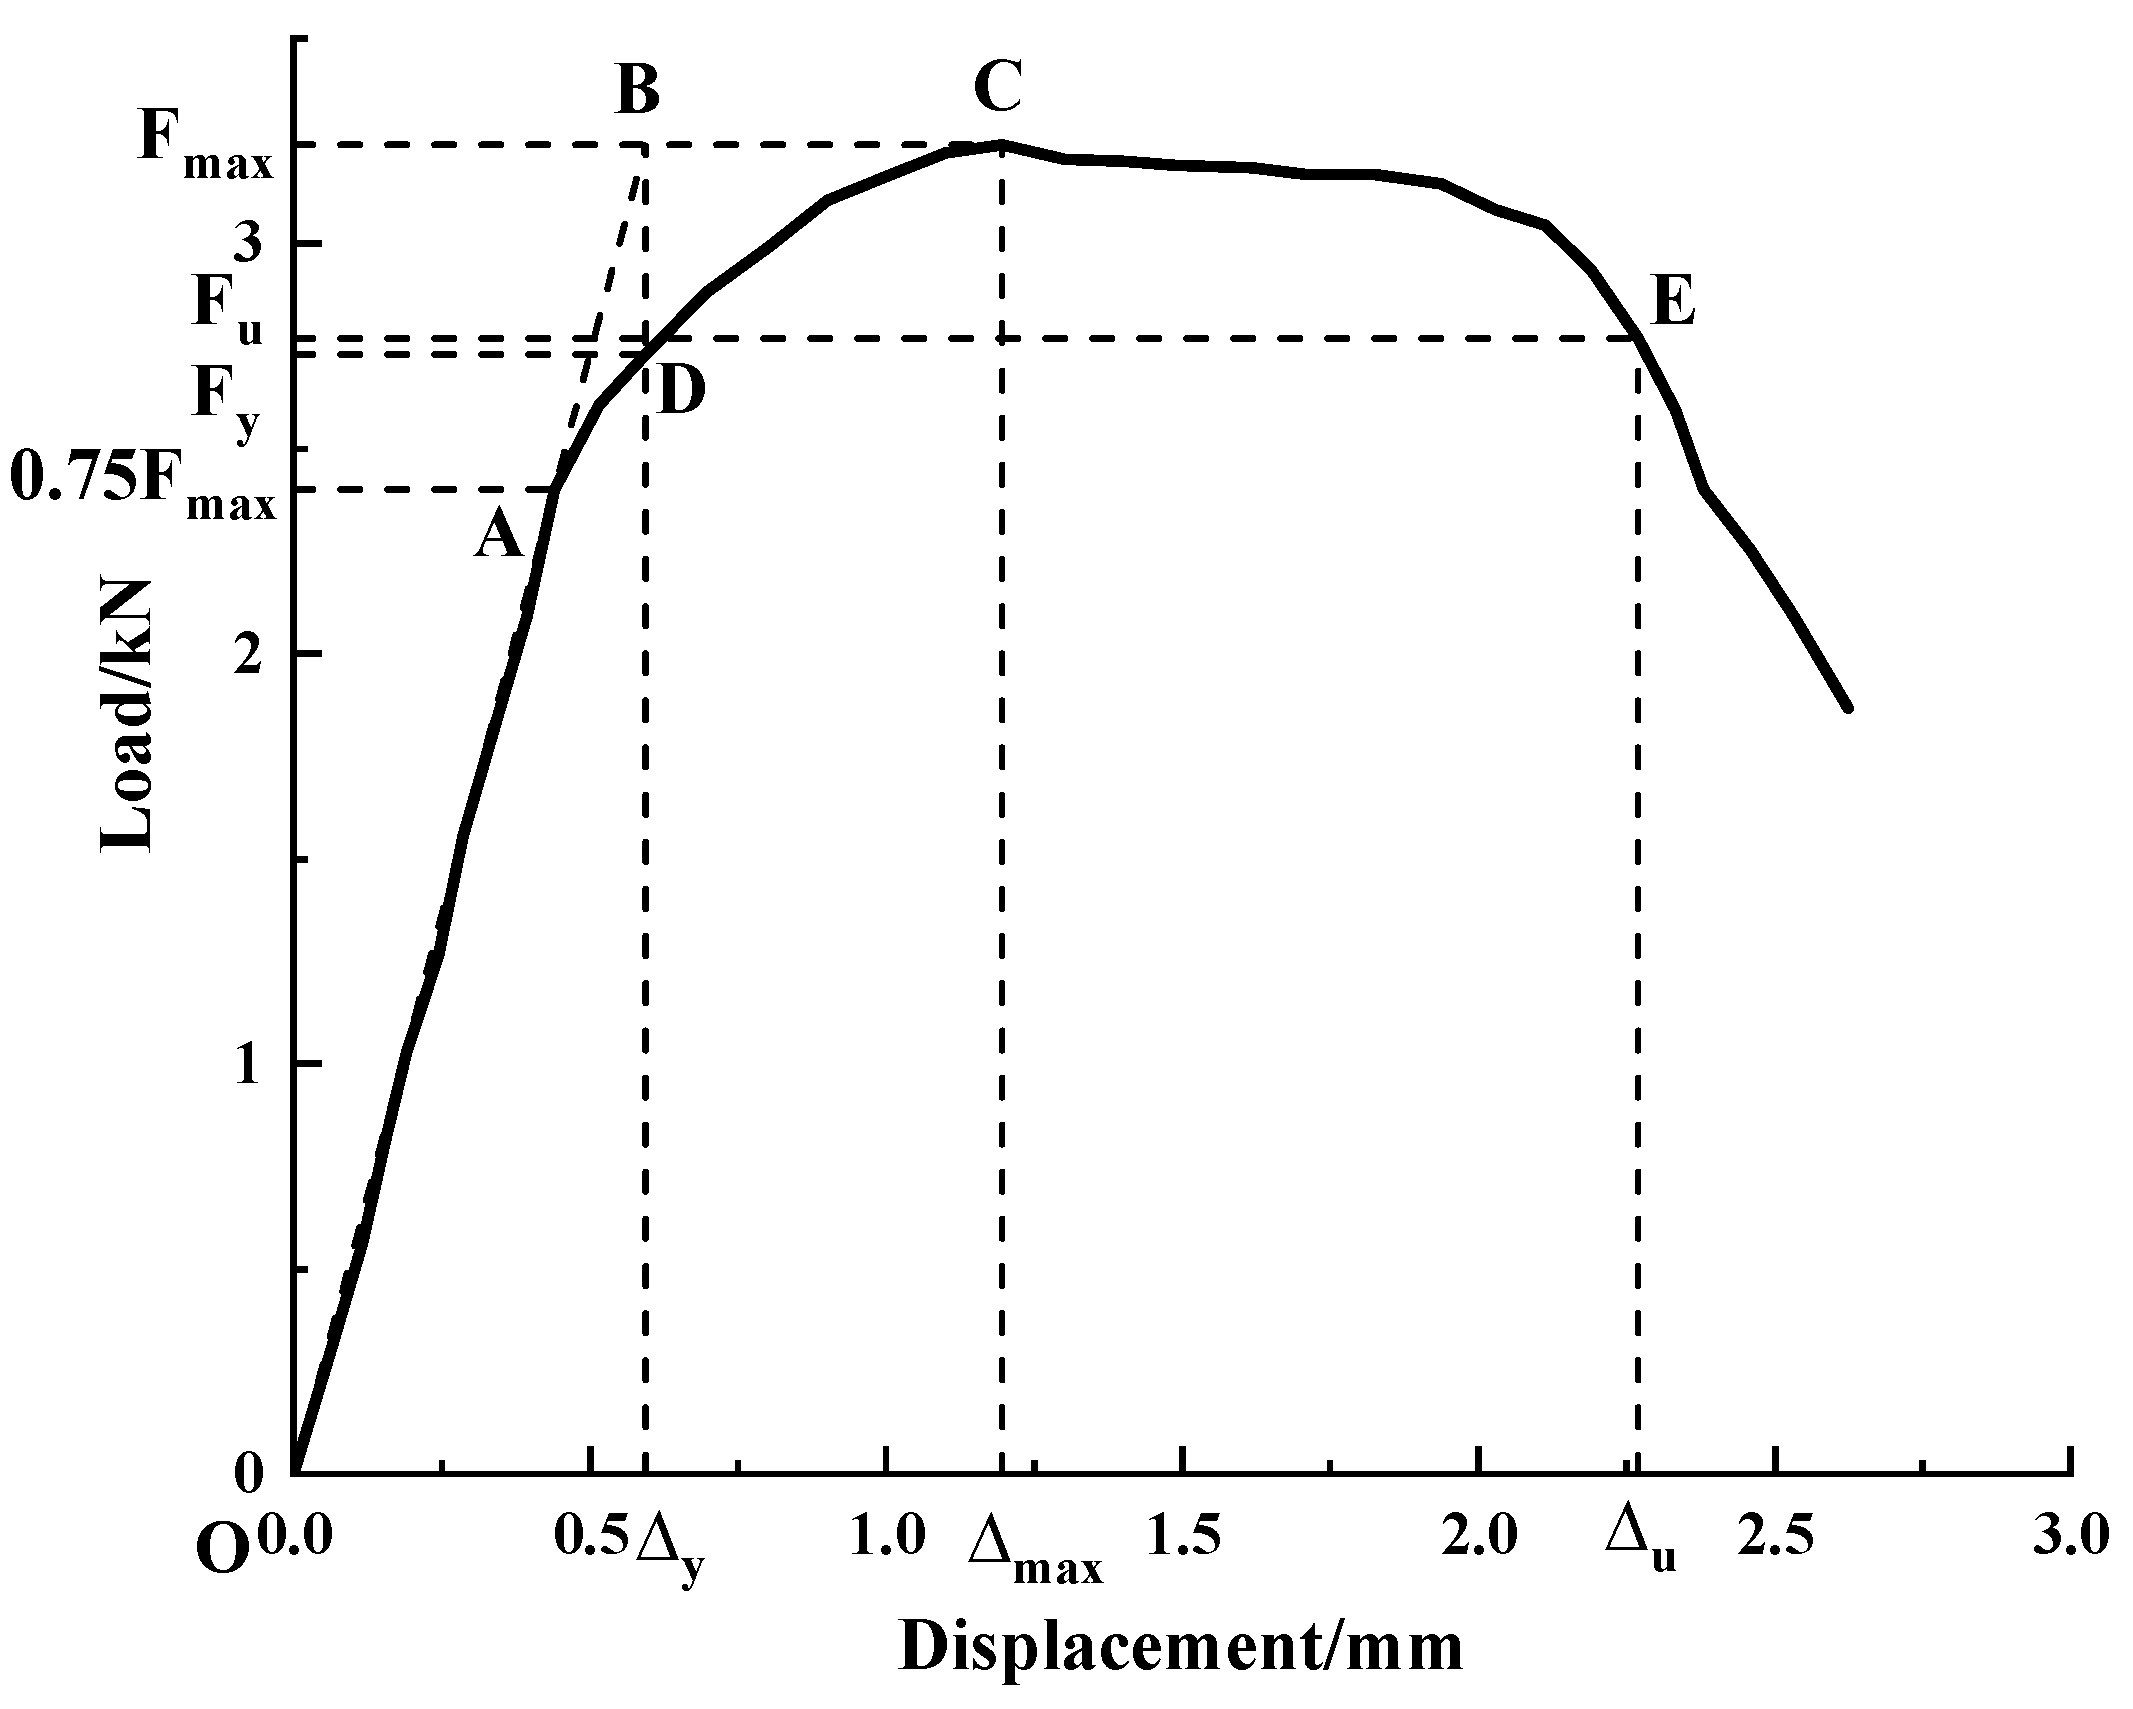
The ductility factor is a parameter to measure ductility, and the higher the ductility factor, the better the ductility is. It can be calculated according to Formula (17) [
35]:
where
μ is the ductility factor, ∆y is the yield displacement, and ∆u is the displacement corresponding to the ultimate load
Fu (0.85 times the maximum load
Fmax). The PARK method is used to locate ∆y (
Figure 4). Specifically, through the two points
Fmax and 0.75
Fmax on the curve, we can draw a perpendicular line to the vertical axis and intersect the curve at point A and Point C, respectively. Then, we can connect OA, intersect the horizontal line between point C and the vertical axis at point B, and make a vertical line crossing the horizontal axis through point B, and the displacement of point intersecting horizontal axis is the yield displacement ∆y.
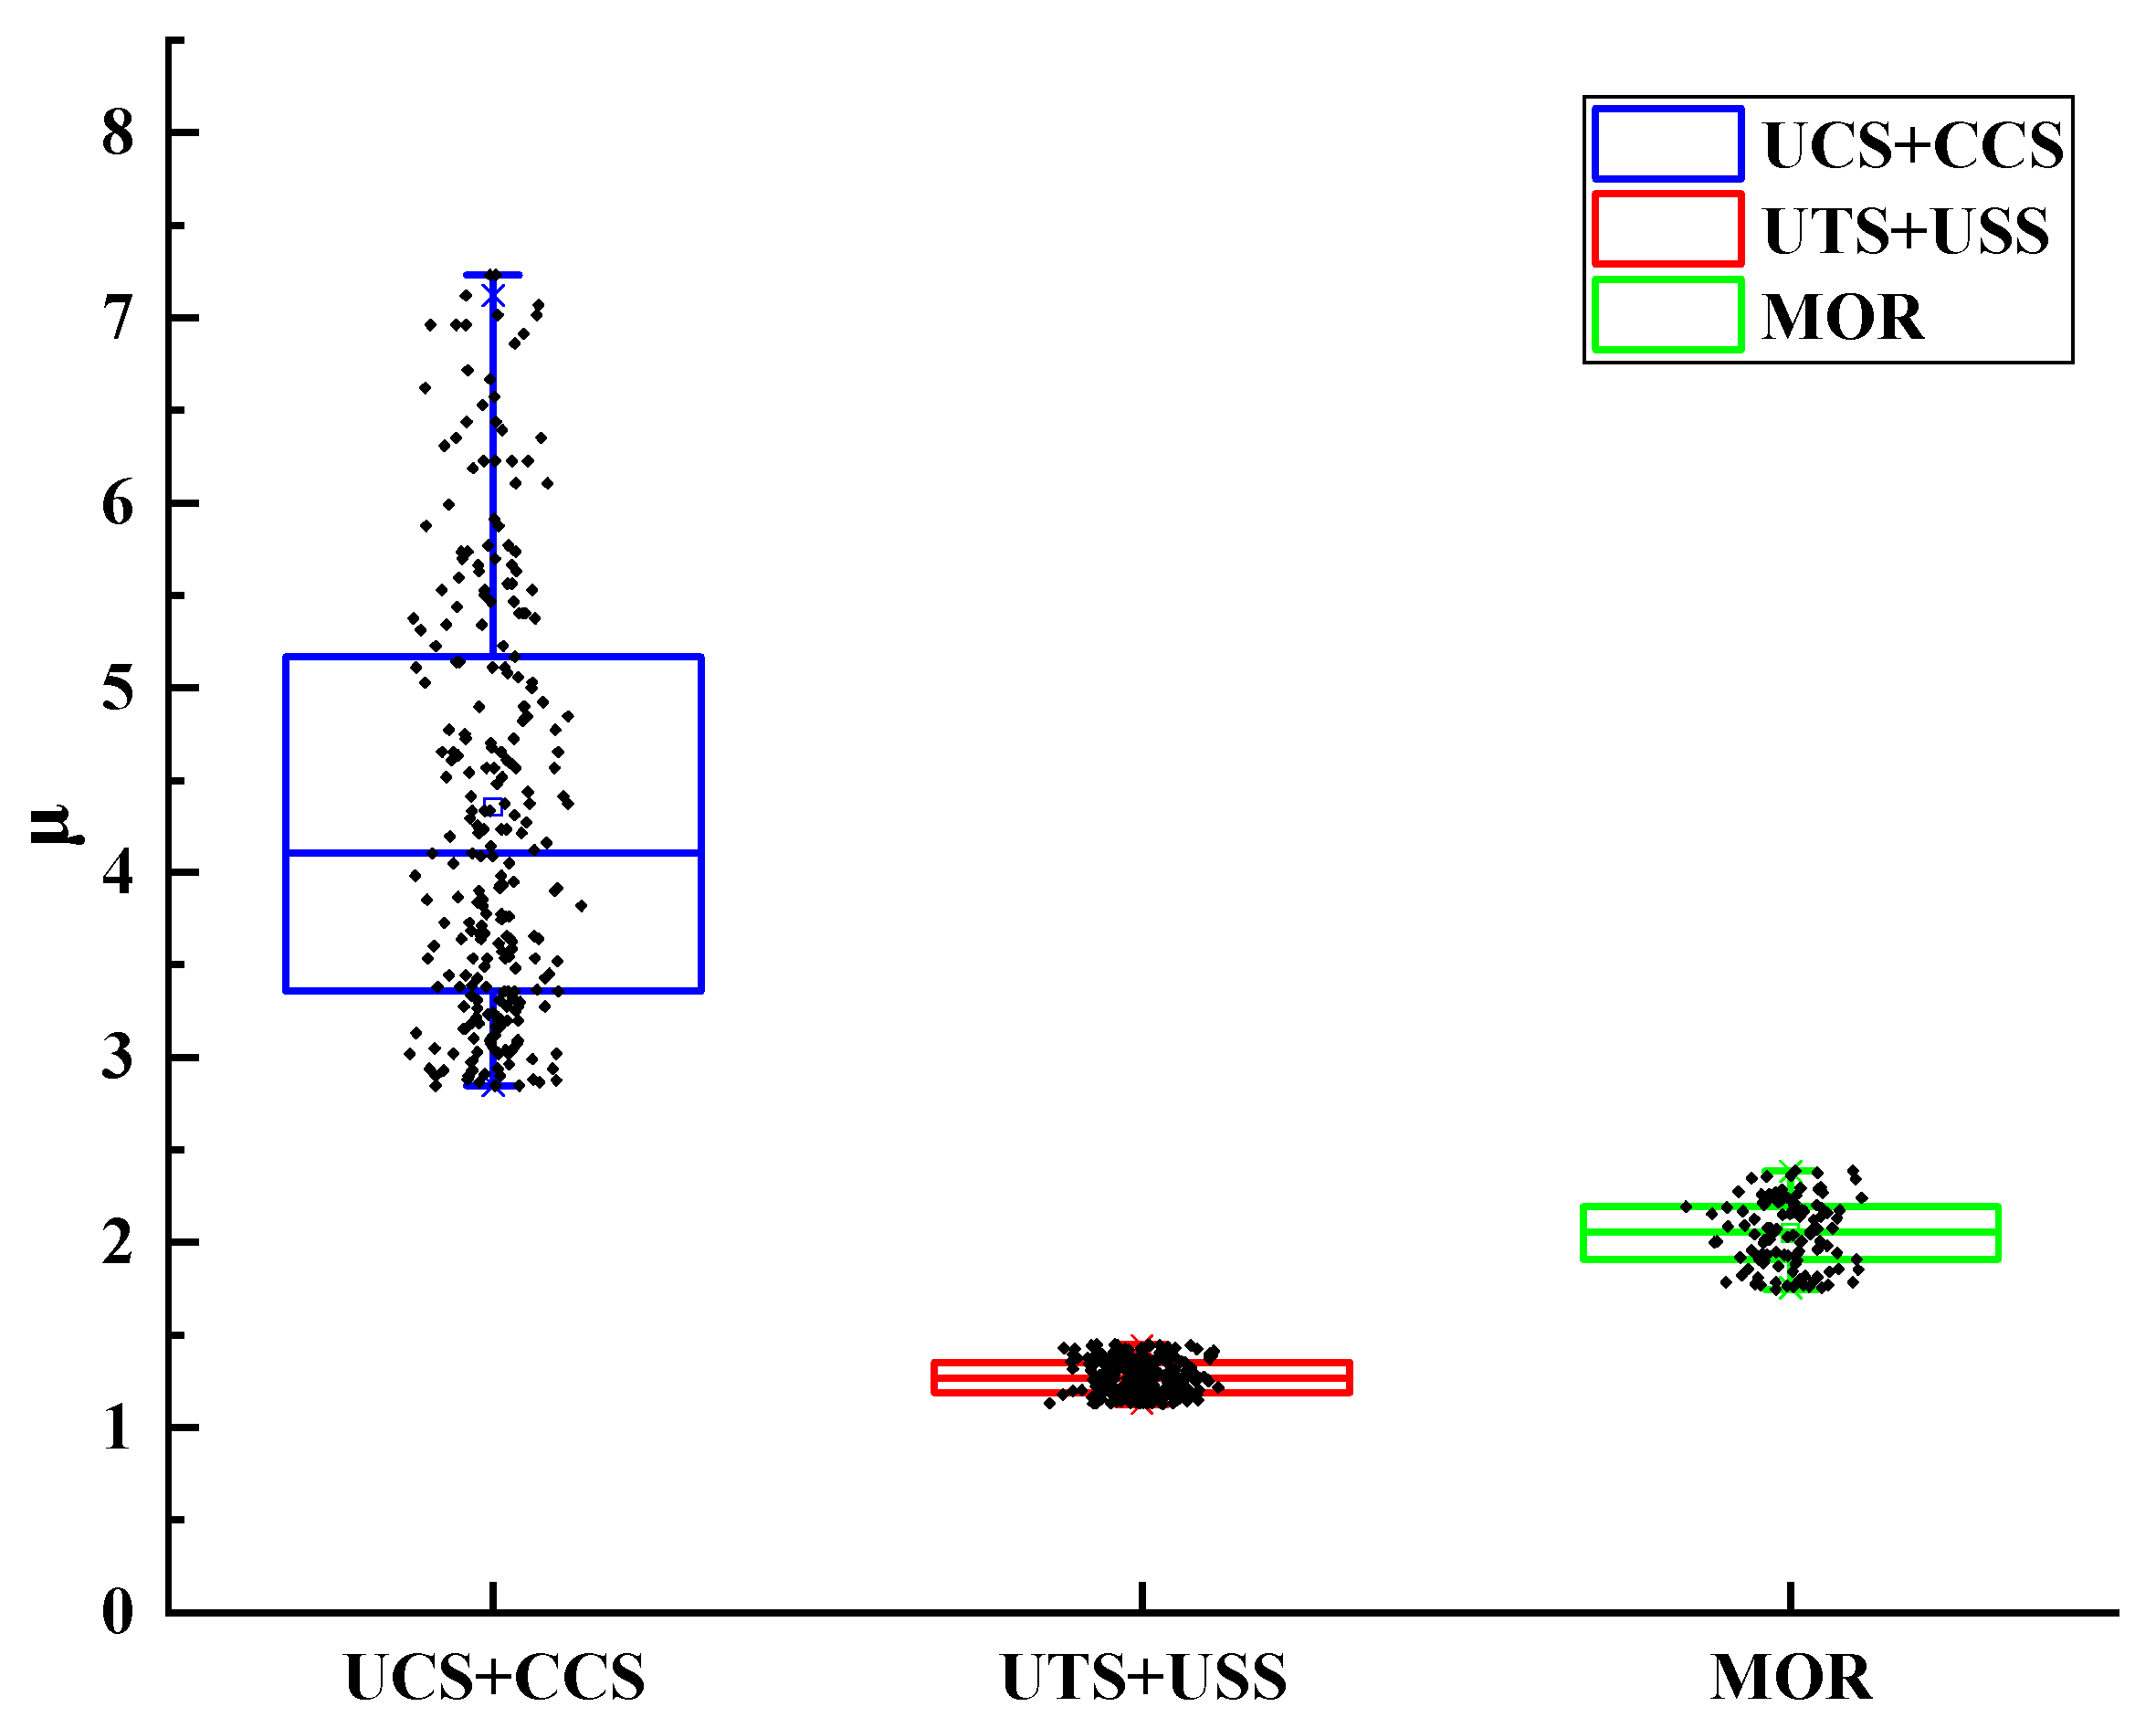
First, the combined statistical analysis of ductility factors of the compression strength tests parallel to the grain and compression strength tests perpendicular to the grain were carried out, and then the combined statistical analysis of ductility factors of the tensile strength tests parallel to the grain and shear strength tests parallel to the grain were carried out. Finally, the box diagram as shown in
Figure 5 was obtained. The average ductility factors of the two groups of data were calculated as μ
1 and μ
2, respectively. Similarly, the average ductility factor of the bending tests μ
3 was obtained, and the bending target reliability of bamboo material
β3 = 3.57 was obtained by the linear interpolation method (
Table 3).
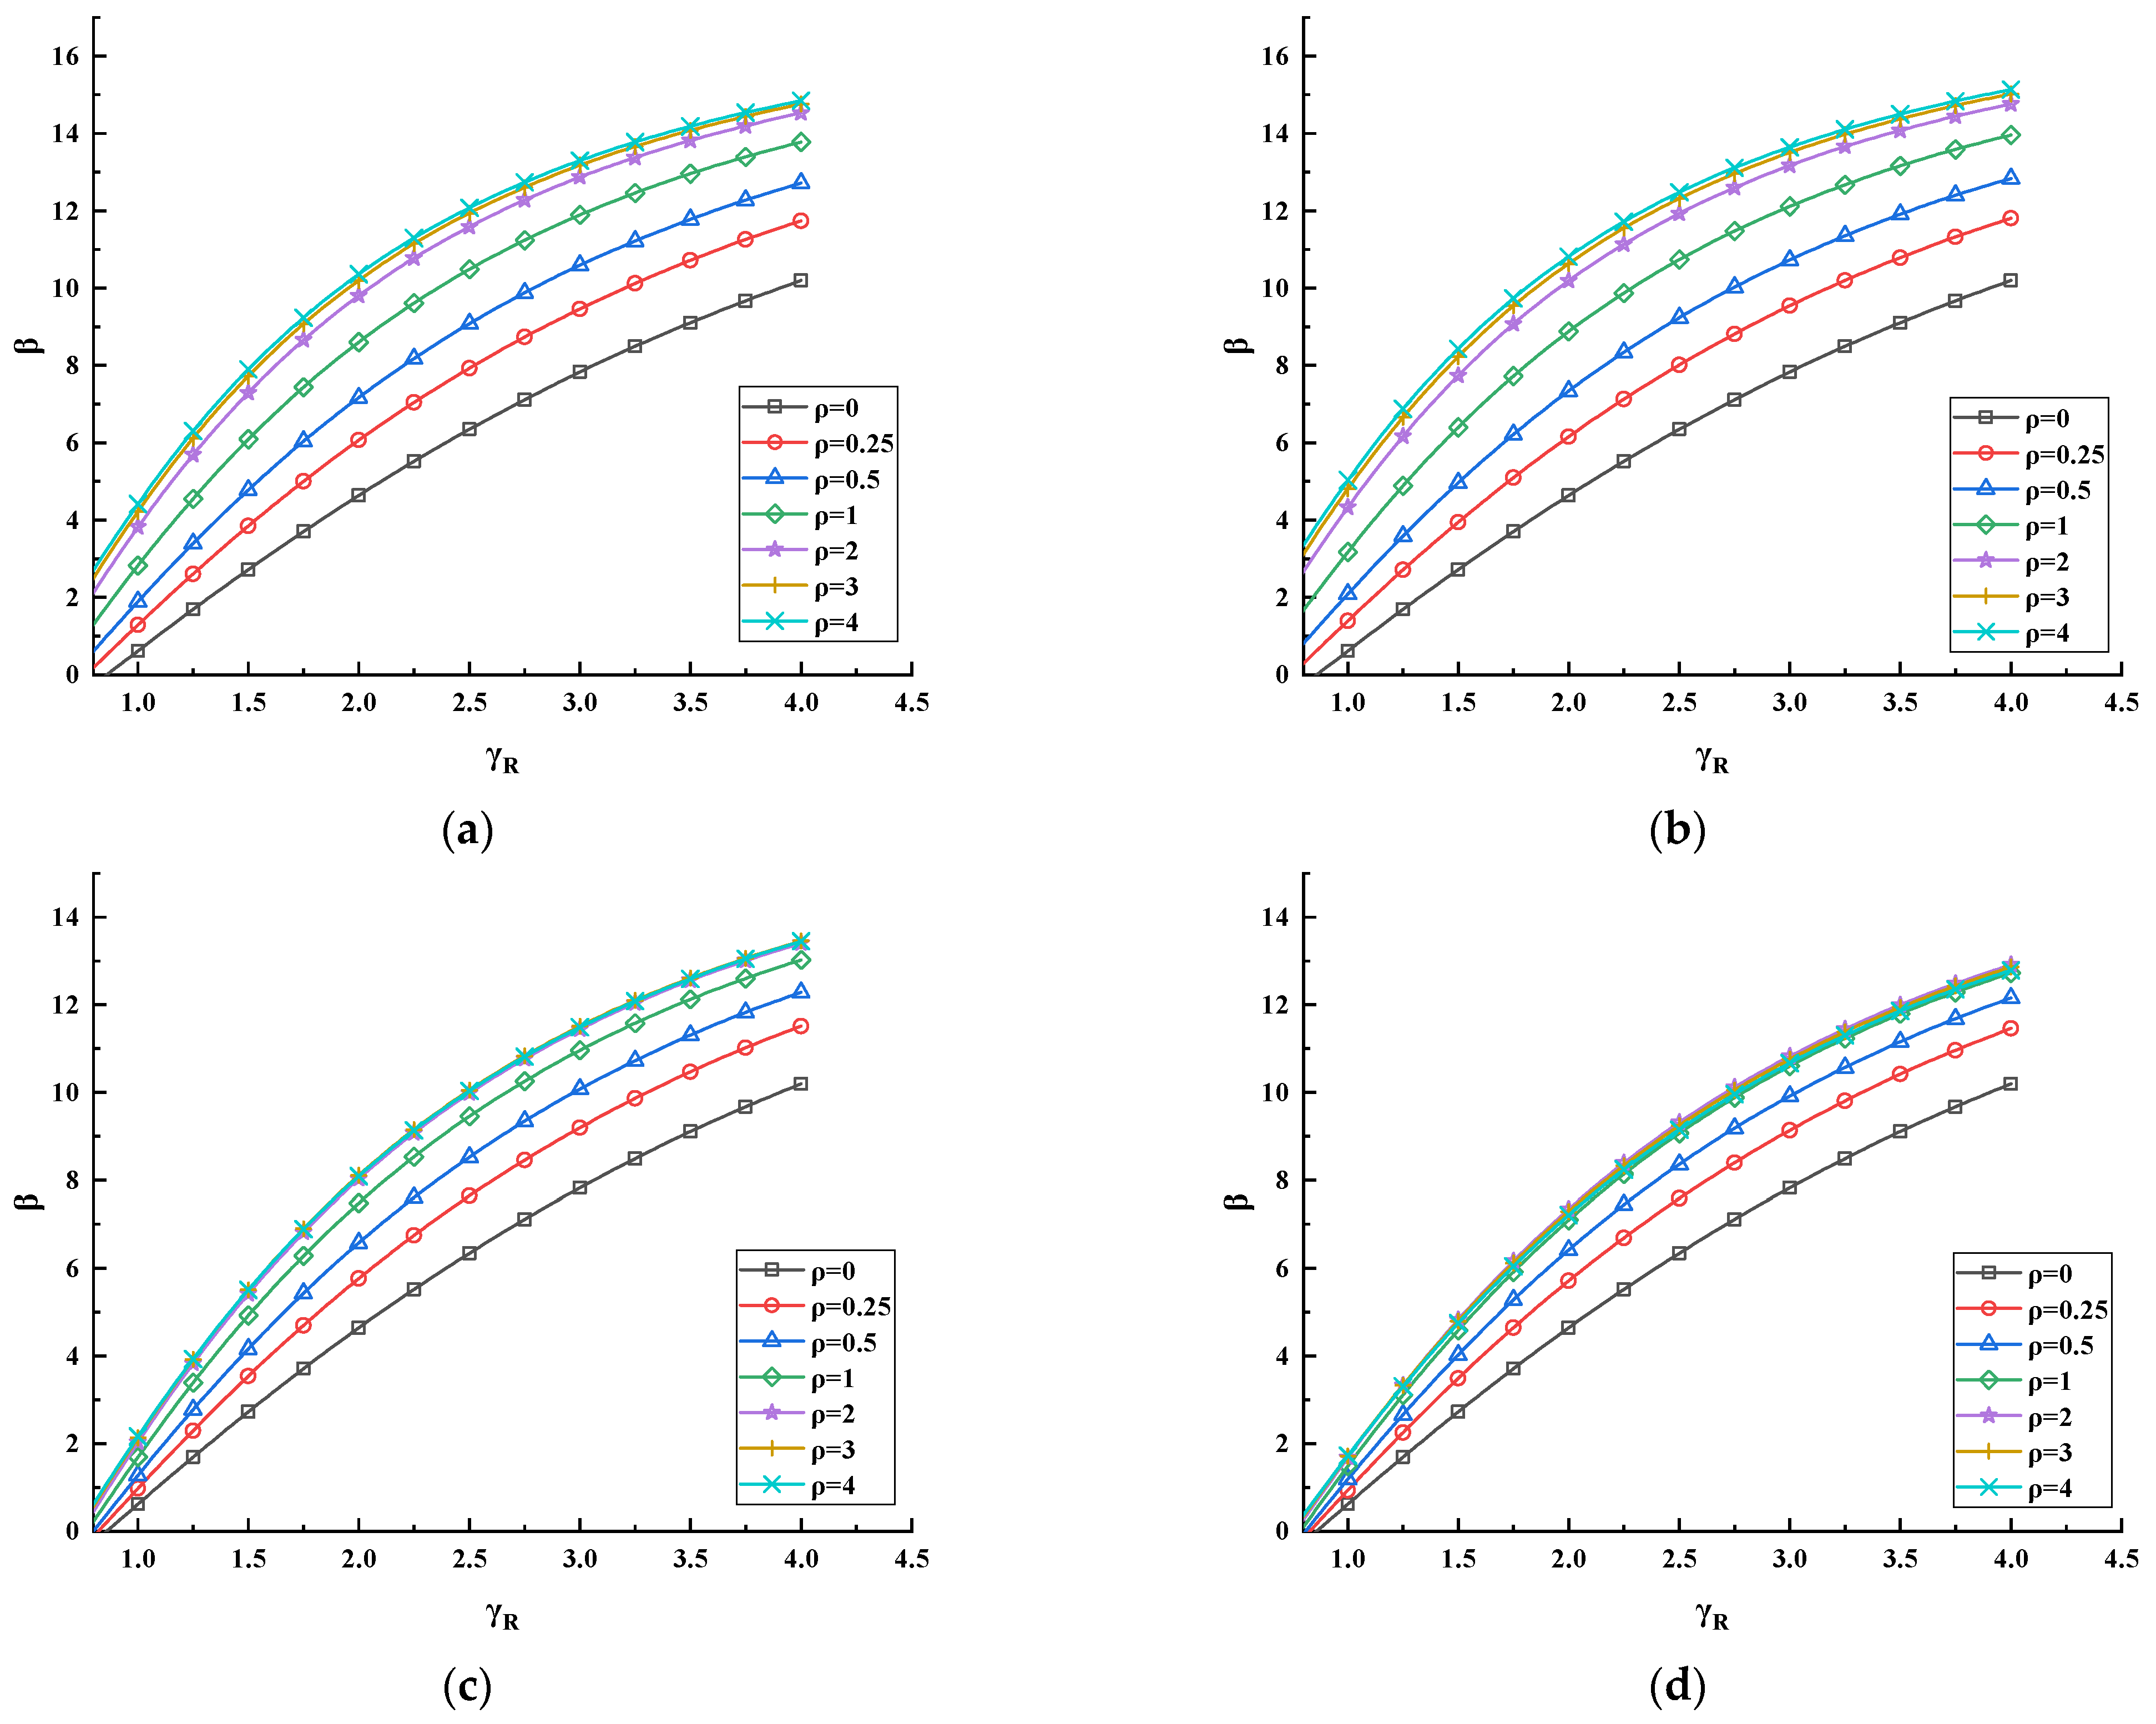
Four different load combinations (dead load + residential floor live load (D + R), dead load + office floor live load (D + O), dead load + wind load (D + W), and dead load + snow load (D + S)) were considered in this study. Seven different load effect ratios (0, 0.25, 0.5, 1.0, 2.0, 3.0, and 4.0) were calculated by the ratio of the variable load effect to the permanent load. The JC method was used for reliability analysis to obtain the relationship curves between the reliability indexes and the resistance factors. In this study, the results of compression strength parallel to the grain, bending strength, and tensile strength parallel to the grain tests are displayed in
Figure 6,
Figure 7 and
Figure 8. As can be seen from
Figure 6,
Figure 7 and
Figure 8, with the increase of the resistance factors, the reliability indexes show a trend of gradual increase. The load ratios have a significant influence on the reliability indexes, and for the same resistance factors, the reliability indexes show an increasing trend with the increase of the load ratios. With the increase of load ratios, the magnitude of the increase of reliability indexes decreases gradually. Under D + R and D + O load combinations, the magnitude of increase of reliability indexes with the increase of load ratios is greater than that of D + W and D + S load combinations.
3.4. Resistance Factors
The resistance factors of various mechanical properties of bamboo material under the target reliability are shown in
Table 4. It can be seen from the table that, with the same strength indexes, the resistance factor for D + S load combination is the largest, and the resistance factor for D + O load combination is the smallest when the load effect ratio ρ > 0. Under the same load combination and load effect ratio, the resistance factors of the shear strength parallel to the grain test are the largest, and the resistance factors of the compression strength parallel to the grain test are the smallest.
To fulfill the design strengths requirement of the target reliability, adopting the maximum of the resistance factors γ
R under different load combinations as the final resistance factor is safe but uneconomical. According to the functional use of the structure, the load combinations are divided into two groups: the first group is D + R and D + O, which is a more commonly used load combination, and the second group is D + W and D + S, which may be dominant in a few areas. When the load ratio under the first group of load combinations is equal to 1.0, relatively larger resistance factors were adopted to calculate the design strength [
15].
In the first group of load combinations, when
ρ > 1.0, the resistance factors can ensure the safety of the structure, so adjustment is not necessary in this case. When
ρ < 1.0, the design strengths shall be adjusted according to the resistance factors. The ratio of the reciprocal of the resistance factor when
ρ = 0 to the reciprocal of the resistance factor when
ρ = 1.0 was used as a reference value of the adjustment coefficient. The design strengths of various mechanical properties were adjusted by the formula in
Table 5, where
λ is the adjustment coefficient. Under the second group of load combinations, the design strengths were adjusted by the ratio of the larger resistance factors when
ρ = 1.0 and the corresponding resistance factors of the first group. With this adjustment, the design strengths of
UCS,
MOR,
UTS,
USS, and
CCS under the second group of load combinations need be multiplied by the reduction coefficient of 0.83 based on the first group.
3.5. Determination of Design Strengths
To sum up, the analysis method of design value of bending strength of bamboo is as follows. Firstly, the target reliability of bending resistance is determined based on the ductility coefficient. Then, according to the reliability calculation formula, reliability analysis is carried out and the partial coefficient of resistance under the target reliability is obtained. Finally, the design strength value of bamboo is calculated according to the calculation formula of the design strength value. The design strengths of the bamboo material obtained based on the study in this research are shown in
Table 6. The curves of the design strengths considering adjustment method proposed in this study are shown in
Figure 9, with a two-fold line shape.
4. Conclusions
(1) The P. edulis bamboo materials were tested for compression strength parallel to the grain, bending strength, tensile strength parallel to the grain, shear strength parallel to the grain, and compression strength perpendicular to the grain and the strength data were analyzed statistically. The bamboo material has an excellent compression strength parallel to the grain, bending strength, tensile strength parallel to the grain, and different material strengths are ranked as UTS > MOR > UCS > CCS > USS.
(2) The Bootstrap method was used to analyze the material strengths after removing all the outliers by IQR criteria and obtain the standard values of the P. edulis bamboo material strengths. The standard values of UCS, MOR, UTS, USS, and CCS are 53.14 MPa, 126.75 MPa, 133.72 MPa, 15.27 MPa, and 31.71 MPa, respectively. This method can significantly reduce the influence of sample size on the test results.
(3) The effects of load combinations, load effect ratio on the relationship between reliability index β, and resistance factor γR were analyzed, and β increases with the increase of γR. Under the same condition of β, the resistance factors under the combination of dead load + snow load (D + S) are the highest, while the resistance factors under the combination of dead load + live office floor load (D + O) are the lowest. Under the same load combinations and load effect ratios, the resistance factors of the shear strength parallel to the grain test are the largest, and the resistance factors of the compression strength parallel to the grain test are the smallest.
(4) Considering safety and economic factors, the design strengths of P. edulis bamboo material were determined by the larger resistance factors of load effect ratio = 1.0 under dead load + live load on the residential floor (D + R) and dead load + live load on office floor (D + O). The obtained design strengths of UCS, MOR, UTS, USS, and CCS are 15.26 MPa, 44.24 MPa, 49.34 MPa, 3.87 MPa, and 9.18 MPa, respectively, for the P. edulis bamboo material investigated in this study.
(5) The design strengths under the load ratio of dead load + live load on the residential floor (D + R) and dead load + live load on the office floor (D + O) were adjusted when the load ratios were less than 1.0. The adjustment coefficients increase linearly with the increase of the load ratios, and the adjustment curves under the total load ratio show a two-fold line shape. The design strengths under dead load + wind load (D + W) and dead load + snow load (D + S) are multiplied by a reduction factor of 0.83 based on the design strengths under dead load + live residential floor load (D + R) and dead load + live office floor load (D + O).
Author Contributions
Conceptualization, P.L. and Y.K.; methodology, Y.K.; software, P.L.; validation, P.L., F.F. and W.L.; formal analysis, P.L.; investigation, P.L.; resources, Q.Z.; data curation, P.L.; writing—original draft preparation, P.L.; writing—review and editing, P.L.; visualization, P.L.; supervision, P.L.; project administration, P.L.; funding acquisition, Q.Z. All authors have read and agreed to the published version of the manuscript.
Funding
This research received no external funding.
Data Availability Statement
No additional data is covered in this article.
Conflicts of Interest
The authors declare no conflict of interest.
References
- Park, H.; Ji, C.; Hong, T. Methodology for assessing human health impacts due to pollutants emitted from building materials. Build. Environ. 2016, 95, 133–144. [Google Scholar] [CrossRef]
- Gheibi, M.; Karrabi, M.; Shakerian, M.; Mirahmadi, M. Life cycle assessment of concrete production with a focus on air pollutants and the desired risk parameters using genetic algorithm. J. Environ. Health Sci. Eng. 2018, 16, 89–98. [Google Scholar] [CrossRef] [PubMed]
- Peng, Z.; Deng, W.; Hong, Y. Materials consumption, indoor thermal comfort and associated energy flows of urban residential buildings. Int. J. Build. Pathol. Adapt. 2019, 37, 579–596. [Google Scholar] [CrossRef]
- Tan, M.; Jiang, X.; Ke, H.; Wu, W.; Xia, R. Experimental Investigations on the Mechanical Properties of Bamboo Fiber and Fibril. Fibers Polym. 2020, 21, 1382–1386. [Google Scholar] [CrossRef]
- Huang, X.; Xie, J.; Qi, J.; De Hoop, C.; Xiao, H.; Chen, Y.; Li, F. Differences in physical–mechanical properties of bamboo scrimbers with response to bamboo maturing process. Eur. J. Wood Wood Prod. 2018, 76, 1137–1143. [Google Scholar] [CrossRef]
- Chung, M.; Wang, S. Mechanical properties of oriented bamboo scrimber boards made of Phyllostachys pubescens (moso bamboo) from Taiwan and China as a function of density. Holzforschung 2018, 72, 151–158. [Google Scholar] [CrossRef]
- Asif, M.; Rahman, K.; Faisal, M.; Islam, M. Comparative Study on Mechanical Properties of Bamboo Strip and Bamboo Strip-glass Fiber Reinforced Hybrid Composites. J. Eng. Adv. 2020, 1, 6–10. [Google Scholar] [CrossRef]
- Chen, M.; Ye, L.; Li, H.; Wang, G.; Chen, Q.; Fang, C.; Dai, C.; Fei, B. Flexural strength and ductility of moso bamboo. Constr. Build. Mater. 2020, 246, 118418. [Google Scholar] [CrossRef]
- Shih, Y. Mechanical and thermal properties of waste water bamboo husk fiber reinforced epoxy composites. Mater. Sci. Eng. A 2007, 445–446, 289–295. [Google Scholar] [CrossRef]
- Nayak, S.; Mohanty, S.; Samal, S. Influence of short bamboo/glass fiber on the thermal, dynamic mechanical and rheological properties of polypropylene hybrid composites. Mater. Sci. Eng. A 2009, 523, 32–38. [Google Scholar] [CrossRef]
- Jiao, J.; Tang, P. Application of bamboo in a design–build course: Lianhuadang Farm project. Front. Archit. Res. 2019, 8, 549–563. [Google Scholar] [CrossRef]
- Crolla, K. Building indeterminacy modelling—The ‘ZCB Bamboo Pavilion’ as a case study on nonstandard construction from natural materials. Vis. Eng. 2017, 5, 15. [Google Scholar] [CrossRef] [Green Version]
- Das, S.; Mukhopadhyay, P. Multi-hazard disaster resilient housing with bamboo-based system. Procedia Eng. 2018, 212, 937–945. [Google Scholar] [CrossRef]
- Xiao, G.; Li, X.; Zhong, Y. The flexural mechanical properties of restructured bamboo for structural use. J. Anhui Agric. Univ. 2017, 44, 60–64. (In Chinese) [Google Scholar]
- Zhong, Y.; Jiang, Z.; Shangguan, W.; Ren, H. Design Value of the Compressive Strength for Bamboo Fiber-Reinforced Composite Based on a Reliability Analysis. BioResources 2014, 9, 7737–7748. [Google Scholar] [CrossRef] [Green Version]
- Gong, Y.; Wu, G.; Luo, X.; Wang, Z.; Jiang, J.; Ren, H. Research on design value of compressive strength for Chinese fir dimension lumber based on full-size testing. J. Wood Sci. 2016, 63, 56–64. [Google Scholar] [CrossRef] [Green Version]
- Zhu, E.; Niu, S.; Qiao, L.; Pan, J. Reliability analysis of wood structure and determination method of wood strength design value. J. Build. Struct. 2017, 38, 28–36. (In Chinese) [Google Scholar]
- Liu, P.; Zhou, Q.; Zhang, H.; Tian, J. Design strengths of bamboo based on reliability analysis. Wood Mater. Sci. Eng. 2021, 1–11. [Google Scholar] [CrossRef]
- ISO 22157–1:2019; International Standards, Bamboo—Determination of Physical and Mechanical Properties—Part I: Requirements ISO 22157–1:2019 (E). International Organization for Standardization: Geneva, Switzerland, 2019; 25p. Available online: https://www.iso.org/standard/65950.html (accessed on 1 January 2019).
- JG/T199-2007; Testing Methods for Physical and Mechanical Properties of Bamboo Used in Building. Chinese Standards Agency (CSA): Beijing, China, 2007. Available online: https://www.chinesestandard.net/PDF/English.aspx/JGT199-2007 (accessed on 1 October 2007). (In Chinese)
- Wang, M.; Harries, K.; Zhao, Y.; Xu, Q.; Wang, Z.; Leng, Y. Variation of Mechanical Properties of P. edulis (Moso) Bamboo with Moisture Content. SSRN Electron. J. 2021, 324, 126629. [Google Scholar] [CrossRef]
- Shan, L. Calculation of standard IQR and application examples in laboratory ability verification. China New Technol. New Prod. 2012, 3, 41–42. (In Chinese) [Google Scholar]
- Rahman, M.; Patwary, M. A Note on Unequal Probability Sampling in Bootstrap Sampling. Adv. Appl. Stat. 2015, 44, 191–200. [Google Scholar]
- Zhong, Y.; Jiang, Z.; Ren, H. Reliability analysis of compression strength of dimension lumber of Northeast China Larch. Constr. Build. Mater. 2015, 84, 12–18. [Google Scholar] [CrossRef]
- GBJ 68-1984; Unified Standard for Building Structure Design. China Construction Industry Press: Beijing, China, 1985. (In Chinese)
- Wu, M.; Shan, Y.; Li, Y. Research on Design Values of ETFE Film Material Parameters. J. Build. Struct. 2014, 35, 114–119. (In Chinese) [Google Scholar]
- GB 50005; Code for Design of Timber Structures. Ministry of Housing and Urbanrural Construction of the People’s Republic of China: Beijing, China, 2017. (In Chinese)
- GB 50153-2008; Unified Standard for Reliability Design of Engineering Structure. China Construction Industry Press: Beijing, China, 2008. (In Chinese)
- Qiu, Z.; Wang, J.; Fan, H.; Li, T. Anisotropic mechanical properties and composite model of parallel bamboo strand lumbers. Mater. Today Commun. 2020, 24, 101250. [Google Scholar] [CrossRef]
- Gong, Y.; Zhang, C.; Zhao, R.; Xing, X.; Ren, H. Experimental Study on Tensile and Compressive Strength of Bamboo Scrimber. BioResources 2016, 11, 7334–7344. [Google Scholar] [CrossRef]
- Zhang, X.; Yu, Z.; Yu, Y.; Wang, H.; Li, J. Axial compressive behavior of Moso Bamboo and its components with respect to fiber-reinforced composite structure. J. For. Res. 2018, 30, 2371–2377. [Google Scholar] [CrossRef]
- Liu, P.; Zhou, Q.; Jiang, N.; Zhang, H.; Tian, J. Fundamental research on tensile properties of Phyllostachys bamboo. Results Mater. 2020, 7, 100076. [Google Scholar] [CrossRef]
- Chen, G.; Luo, H.; Wu, S.; Guan, J.; Luo, J.; Zhao, T. Flexural deformation and fracture behaviors of bamboo with gradient hierarchical fibrous structure and water content. Compos. Sci. Technol. 2018, 157, 126–133. [Google Scholar] [CrossRef]
- Zhang, T.; Wang, A.; Wang, Q.; Guan, F. Bending characteristics analysis and lightweight design of a bionic beam inspired by bamboo structures. Thin-Walled Struct. 2019, 142, 476–498. [Google Scholar] [CrossRef]
- Li, Z.; Wang, G.; Yang, S.; Ju, G. Experimental study on mechanical properties and stress-strain constitutive relations of desert sand concrete. Chin. J. Appl. Mech. 2019, 36, 1131–1137+1261. (In Chinese) [Google Scholar]
Figure 1.
Bamboo specimens and material tests for different strengths (UCS refers to compression strength parallel to the grain, MOR refers to bending strength, UTS refers to tensile strength parallel to the grain, USS refers to shear strength parallel to the grain, CCS refers to compression strength perpendicular to the grain): (a) selection of bamboo; (b) test.
Figure 2.
Histogram of a probability distribution of bamboo material strenghs processed by the Bootstrap method: (a) UCS; (b) MOR; (c) UTS; (d) USS; (e) CCS.
Figure 2.
Histogram of a probability distribution of bamboo material strenghs processed by the Bootstrap method: (a) UCS; (b) MOR; (c) UTS; (d) USS; (e) CCS.
Figure 3.
The typical load-displacement curves: (a) UCS; (b) MOR; (c) UTS; (d) USS; (e) CCS.
Figure 3.
The typical load-displacement curves: (a) UCS; (b) MOR; (c) UTS; (d) USS; (e) CCS.
Figure 4.
Schematic diagram of ductility factor calculation.
Figure 4.
Schematic diagram of ductility factor calculation.
Figure 5.
Ductility coefficient statistics.
Figure 5.
Ductility coefficient statistics.
Figure 6.
Compression strength parallel to the grain reliability curve (β refers to reliability index, γR refers to resistance factor): (a) D + R; (b) D + O; (c) D + W; (d) D + S.
Figure 6.
Compression strength parallel to the grain reliability curve (β refers to reliability index, γR refers to resistance factor): (a) D + R; (b) D + O; (c) D + W; (d) D + S.
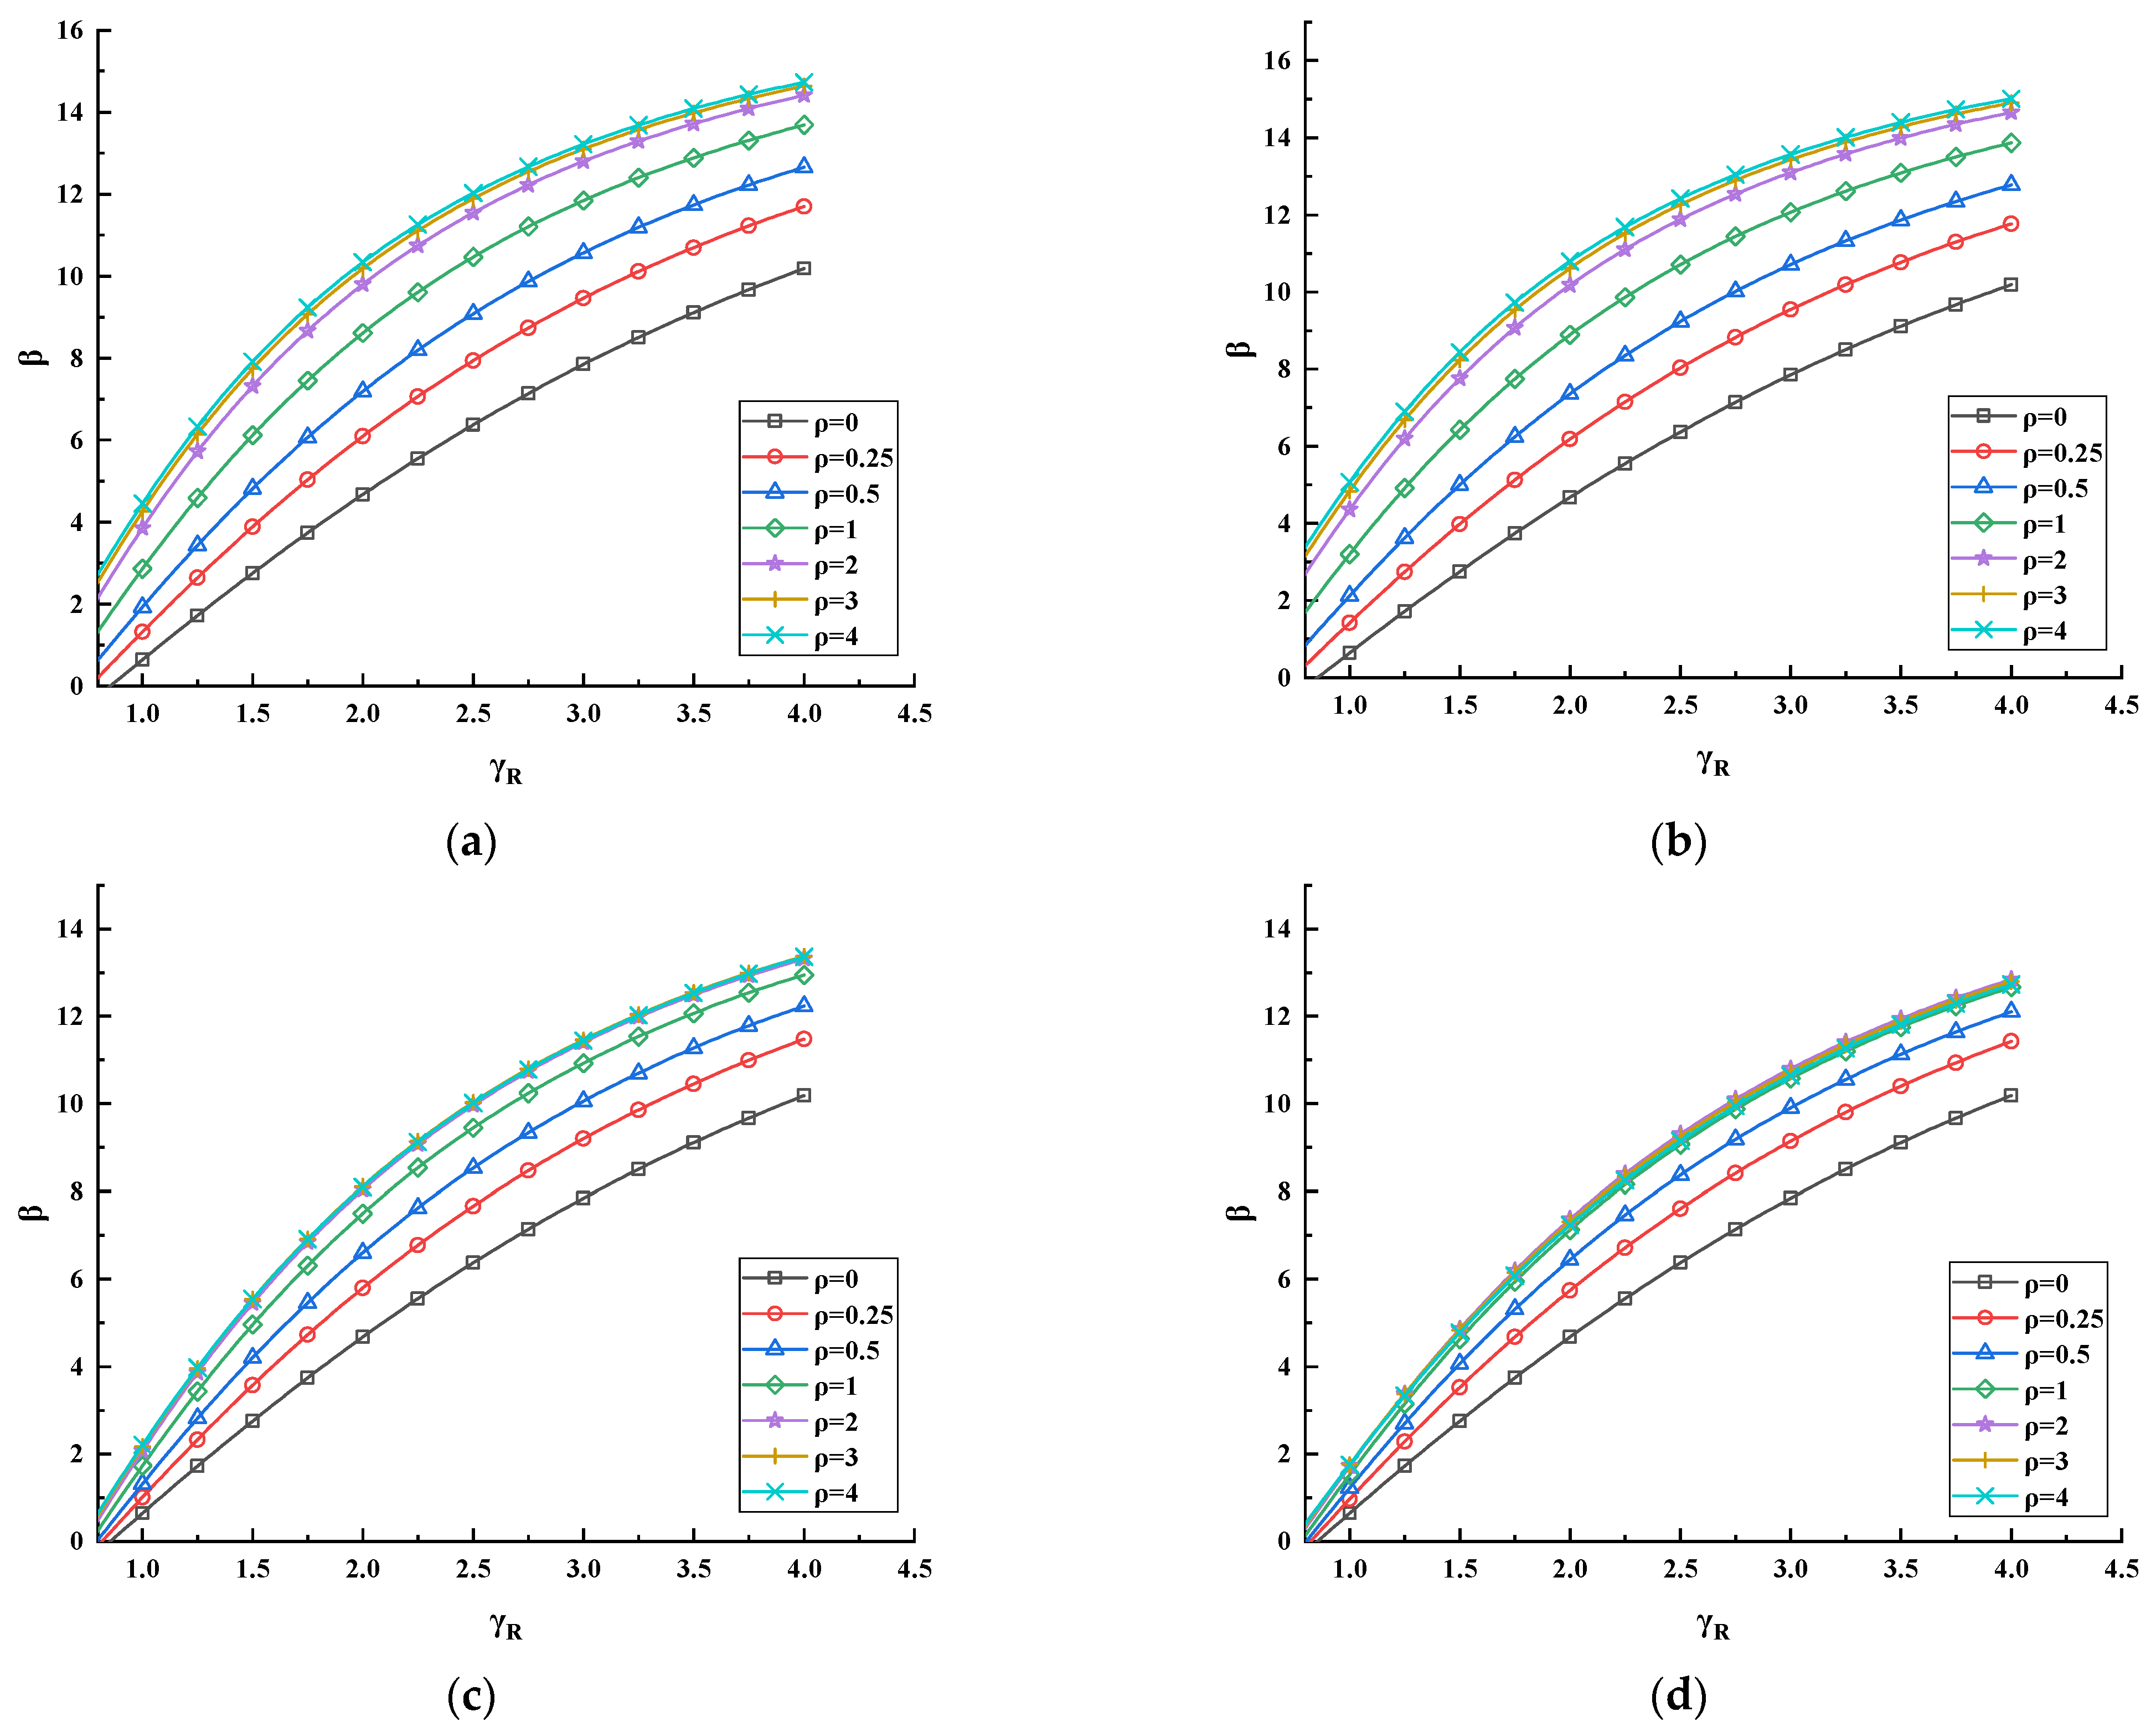
Figure 7.
Bending strength reliability curve (β refers to reliability index, γR refers to resistance factor): (a) D + R; (b) D + O; (c) D + W; (d) D + S.
Figure 7.
Bending strength reliability curve (β refers to reliability index, γR refers to resistance factor): (a) D + R; (b) D + O; (c) D + W; (d) D + S.
Figure 8.
Tensile strength parallel to the grain reliability curve (β refers to reliability index, γR refers to resistance factor): (a) D + R; (b) D + O; (c) D + W; (d) D + S.
Figure 8.
Tensile strength parallel to the grain reliability curve (β refers to reliability index, γR refers to resistance factor): (a) D + R; (b) D + O; (c) D + W; (d) D + S.
Figure 9.
Curves of design strengths considering the adjustment: (a) D + R and D + O; (b) D + W and D + S.
Figure 9.
Curves of design strengths considering the adjustment: (a) D + R and D + O; (b) D + W and D + S.
Table 1.
Eigenvalue statistics.
Table 1.
Eigenvalue statistics.
| Strength Indexes | UCS | MOR | UTS | USS | CCS |
|---|
| Original data | n | 154 | 116 | 128 | 145 | 109 |
| a/MPa | 54.04 | 130.02 | 139.36 | 15.57 | 33.38 |
| S/MPa | 6.83 | 19.49 | 34.88 | 2.26 | 9.07 |
| COV | 0.13 | 0.15 | 0.25 | 0.15 | 0.27 |
| After processing IQR criteria | n | 154 | 115 | 127 | 143 | 107 |
| a/MPa | 54.04 | 129.71 | 138.58 | 15.56 | 32.84 |
| S/MPa | 6.83 | 19.28 | 33.89 | 2.11 | 8.21 |
| COV | 0.13 | 0.15 | 0.25 | 0.14 | 0.25 |
| After processing the Bootstrap method | n | 54.04 | 129.69 | 138.63 | 15.56 | 32.84 |
| a/MPa | 0.55 | 1.79 | 2.98 | 0.18 | 0.69 |
| S/MPa | 0.01 | 0.01 | 0.02 | 0.01 | 0.02 |
| Standard values fk/MPa | 53.14 | 126.75 | 133.72 | 15.27 | 31.71 |
Table 2.
Deviation of bending strength 5% subdivision value under different sample size.
Table 2.
Deviation of bending strength 5% subdivision value under different sample size.
| Sample Size | 10 | 30 | 50 | 70 | 100 | Mean Values |
|---|
| Regular sampling | 28.94% | 26.53% | 23.44% | 23.49% | 19.90% | 24.46% |
| The Bootstrap sampling method | 5.20% | 5.36% | 5.22% | 5.22% | 5.30% | 5.26% |
Table 3.
Ductility coefficient and target reliability.
Table 3.
Ductility coefficient and target reliability.
| Parameters | μ1 | μ2 | μ3 | β1 | β2 | β3 |
|---|
| Values | 4.35 | 1.27 | 2.05 | 3.2 | 3.7 | 3.57 |
Table 4.
Resistance factors under target reliability.
Table 4.
Resistance factors under target reliability.
| Strength Indexes | Load Combination | ρ |
|---|
| 0 | 0.25 | 0.5 | 1 | 2 | 3 | 4 |
|---|
| UCS | D + R | 1.63 | 1.37 | 1.22 | 1.05 | 0.93 | 0.88 | 0.84 |
| D + O | 1.63 | 1.35 | 1.19 | 1.01 | 0.86 | 0.81 | 0.78 |
| D + W | 1.63 | 1.44 | 1.33 | 1.23 | 1.16 | 1.15 | 1.14 |
| D + S | 1.63 | 1.45 | 1.35 | 1.27 | 1.23 | 1.23 | 1.24 |
| MOR | D + R | 1.71 | 1.44 | 1.28 | 1.10 | 0.97 | 0.92 | 0.90 |
| D + O | 1.71 | 1.42 | 1.24 | 1.05 | 0.91 | 0.85 | 0.83 |
| D + W | 1.71 | 1.50 | 1.39 | 1.28 | 1.21 | 1.20 | 1.19 |
| D + S | 1.71 | 1.51 | 1.41 | 1.32 | 1.29 | 1.28 | 1.29 |
| UTS | D + R | 1.73 | 1.45 | 1.29 | 1.11 | 0.97 | 0.93 | 0.91 |
| D + O | 1.73 | 1.43 | 1.26 | 1.06 | 0.91 | 0.86 | 0.82 |
| D + W | 1.73 | 1.52 | 1.40 | 1.29 | 1.22 | 1.21 | 1.20 |
| D + S | 1.73 | 1.53 | 1.42 | 1.33 | 1.30 | 1.29 | 1.30 |
| USS | D + R | 1.93 | 1.64 | 1.46 | 1.26 | 1.11 | 1.05 | 1.03 |
| D + O | 1.93 | 1.61 | 1.42 | 1.20 | 1.03 | 0.97 | 0.94 |
| D + W | 1.93 | 1.71 | 1.58 | 1.46 | 1.39 | 1.37 | 1.36 |
| D + S | 1.93 | 1.72 | 1.61 | 1.51 | 1.47 | 1.47 | 1.46 |
| CCS | D + R | 1.67 | 1.41 | 1.26 | 1.09 | 0.96 | 0.91 | 0.89 |
| D + O | 1.67 | 1.39 | 1.22 | 1.04 | 0.89 | 0.84 | 0.81 |
| D + W | 1.67 | 1.48 | 1.37 | 1.27 | 1.21 | 1.19 | 1.18 |
| D + S | 1.67 | 1.49 | 1.39 | 1.31 | 1.28 | 1.27 | 1.28 |
Table 5.
Adjustment formula of design strength.
Table 5.
Adjustment formula of design strength.
| Strength Indexes | Adjustment Formulas |
|---|
| UCS, MOR, UTS, CCS | λ = 0.64 + 0.36ρ |
| USS | λ = 0.65 + 0.45ρ |
Table 6.
Design strengths of P. edulis bamboo material.
Table 6.
Design strengths of P. edulis bamboo material.
| Strength Indexes | UCS | MOR | UTS | USS | CCS |
|---|
| fd/MPa | 15.26 | 44.24 | 49.34 | 3.87 | 9.18 |
| Publisher’s Note: MDPI stays neutral with regard to jurisdictional claims in published maps and institutional affiliations. |
© 2022 by the authors. Licensee MDPI, Basel, Switzerland. This article is an open access article distributed under the terms and conditions of the Creative Commons Attribution (CC BY) license (https://creativecommons.org/licenses/by/4.0/).


