Article

The Functional Structure of Tropical Plant Communities and Soil Properties Enhance Ecosystem Functioning and Multifunctionality in Different Ecosystems in Ghana

by
Frederick Gyasi Damptey
1,*,
Klaus Birkhofer
1,
Imma Oliveras Menor
2,3 and
Enrique G. de la Riva
1
1
Department of Ecology, Brandenburg University of Technology Cottbus-Senftenberg, 03046 Cottbus, Germany
2
UMR AMAP: Botanique et Modélisation de l’Architecture des Plantes et des Végétations, Institute de Recherche pour de Développement (IRD), CNRS, INRAE CIRAD, Université Montpellier, 34090 Montpellier, France
3
Environmental Change Institute, School of Geography and the Environment, University of Oxford, Oxford OX1 2JD, UK
*
Author to whom correspondence should be addressed.
Forests 2022, 13(2), 297; https://doi.org/10.3390/f13020297
Submission received: 11 January 2022 / Revised: 31 January 2022 / Accepted: 7 February 2022 / Published: 12 February 2022
(This article belongs to the Special Issue Plant-Soil Interactions under Abiotic or Biotic Stresses)

Abstract

:
Plant functional traits are useful in tracking changes in the environment, and play an important role in determining ecosystem functioning. The relationship between plant functional traits and ecosystem functioning remains unclear, although there is growing evidence on this relationship. In this study, we tested whether the functional structure of vegetation has significant effects on the provision of ecosystem services. We analysed plant trait composition (specific leaf area, leaf carbon and nitrogen ratio, isotopic carbon fraction, stem dry matter content, seed mass and plant height), soil parameters (nutrients, pH, bulk density) and proxies of ecosystem services (carbon stock, decomposition rate, invertebrate activity) in twenty-four plots in three tropical ecosystems (active restored and natural forests and an agroforestry system) in Ghana. For each plot, we measured above-ground biomass, decomposition rates of leaves and invertebrate activity as proxies for the provision of ecosystem services to evaluate (i) whether there were differences in functional composition and soil properties and their magnitude between ecosystem types. We further aimed to (ii) determine whether the functional structure and/or soil parameters drove ecosystem functions and multifunctionality in the three ecosystem types. For functional composition, both the leaf economic spectrum and seed mass dimension clearly separated the ecosystem types. The natural forest was more dominated by acquisitive plants than the other two ecosystem types, while the non-natural forests (agroforest and restored forest) showed higher variation in the functional space. The natural forest had higher values of soil properties than the restored forest and the agroforestry system, with the differences between the restored and agroforestry systems driven by bulk density. Levels of ecosystem service proxies and multifunctionality were positively related to the functional richness of forest plots and were mainly explained by the differences in site conditions. Our study demonstrated the effects of functional forest structure on ecosystem services in different forest ecosystems located in the semi-deciduous forest zone of Ghana.

1. Introduction

The ability of an ecosystem to cope with and adapt to global change has been an emerging ecological research topic in the last decade [1,2]. Relevant advances are necessary to support ecosystem research that will inform policy or design land management or ecological restoration strategies [3]. Ecosystem services involve the functioning and properties of an ecosystem, usually driven by species diversity and composition [4,5,6]. Thus, approaches aiming to address the impacts of global changes require an understanding of how changes in biodiversity affect ecosystem functioning [7]. For instance, the relationship between species richness and ecosystem functioning has been discussed in numerous ecosystems [8,9,10]. However, there is a general agreement that the functional structure of the communities (the functional trait composition and diversity sensu Mouillot et al. [11]) is a better reflection of ecosystem functioning than species richness [12,13].
Different strategies are required by plants in the acquisition and utilisation of resources within their environment. These strategies are defined by traits related to fitness, affecting growth, reproduction, survival and mortality [14]. Functional traits are therefore used as proxies to explain species performance and their assembly within communities as well as their impact on ecosystem functioning [13,15,16]. In addition, trait components relate to above-ground biomass production [17,18,19,20,21,22] and provide initiative links to ecological mechanisms, especially for separating the selection and complementarity effects [23]. Furthermore, functional trait approaches have been used to explore the effects of soil, and topographic properties on variations in tree above-ground carbon stocks [24], with the impact of species composition on ecosystem function also evaluated using the same approach [12]. Traits hence offer a lens to assess how community composition and diversity define ecosystem functioning and service delivery [7].
Traits include the whole plant characteristics (e.g., leaves, stems, seeds) that reflect the strategies used by plants to acquire resources, reproduce and compete in an ecosystem [16,25,26]. These strategies used by plants in acquiring, processing and investing resources could vary between species characterising different ecosystems and could also affect the functioning of ecosystems [13,17,27]. These variations in traits (e.g., leaves or stems) could explain species strategies that influence their performance and ecosystem functioning [28,29]. For instance, traits related to plant structure and physiology, such as specific leaf area (SLA), stem dry matter content (SDMC), and leaf nutrient concentration, determine the quality and quantity of the litter produced, which could subsequently indirectly influence the carbon (C) storage and decomposition rate of leaves [30,31]. Another central issue is understanding the links between functional diversity and ecosystem functions [12,32]. The coexistence of functional strategies not only allows fuller resource exploitation by the plant community as a whole across time and space [31,33], but also seems to be a key determinant for other ecosystem services, such as soil organism diversity and biotic control by insects [3,34,35,36]. Functional trait approaches hence provide a window to evaluate the role of the functional structure of plant communities influencing ecosystem functions [12,30,31]. Most studies frequently quantified single or very few ecosystem services [7]. However, to address questions on the simultaneous provision of multiple services and the development of efficient management strategies, progress is needed to understand how functional structure and synergies within ecosystem functioning translate into interactions between ecosystem services [3,37,38].
Drivers of biodiversity change that influence ecosystem processes and functioning include land-use, climate change and deforestation [39,40]. In the tropics, deforestation is a known major threat to biodiversity that subsequently impacts societies and hinders the functioning of ecosystems and the services they provide [41,42,43]. Approaches to reversing and minimising deforestation impacts have revolved around agroforestry (food and tree production) and restoration activities (passive or active [44]). Restoration hence assists in the re-colonisation of plant species with diverse strategies in resource release, and helps to offset the losses from deforestation by reducing carbon emissions, while at the same time restoring vital ecosystem goods and services essential for human well-being [44,45,46,47].
This study used the functional trait approach to understand ecological processes in different ecosystem types (restored forest, agroforestry system and natural forest). To address this, studies have concluded that the intrinsic properties of each environment, such as edaphic factors, need to be incorporated in addition to functional traits to link community plant functional parameters and ecosystem processes [48]. Furthermore, previous evidence suggests that soil parameters and ecosystem properties may influence functional trait composition, and thus, these factors may not be independent of each other [49]. Thus, gaining knowledge of the dynamics of ecosystem processes in land management in relation to the functional traits of plant communities and their soil properties will provide critical information on ecosystem services. Specifically, we assessed: (i) whether there were differences in functional composition and soil properties and the magnitude of differences between the ecosystem types; and (ii) whether the functional structure and/or soil parameters drove ecosystem functions and multifunctionality in the three ecosystem types. To achieve the above aims, we analysed plant trait composition (SLA, C/N, δ13C, SDMC, Smass and Phg), soil parameters (nutrients, pH, BD), and other ecosystem functions related to services (based on proxies) across an actively restored forest, agroforestry system and a natural forest in the semi-deciduous forest zone of Ghana. We considered the methodological framework proposed by previous studies [3,12,31] for the design of experimental tests of the relative roles of community-weighted means (CWM) and functional diversity in ecosystem processes based on seven plant functional traits related to plant resource use and growth strategies. In addition, we relied on the carbon stock, decomposition rate of leaves, predators, and decomposing organism numbers as proxies to estimate the services derived from each ecosystem type.

2. Materials and Methods

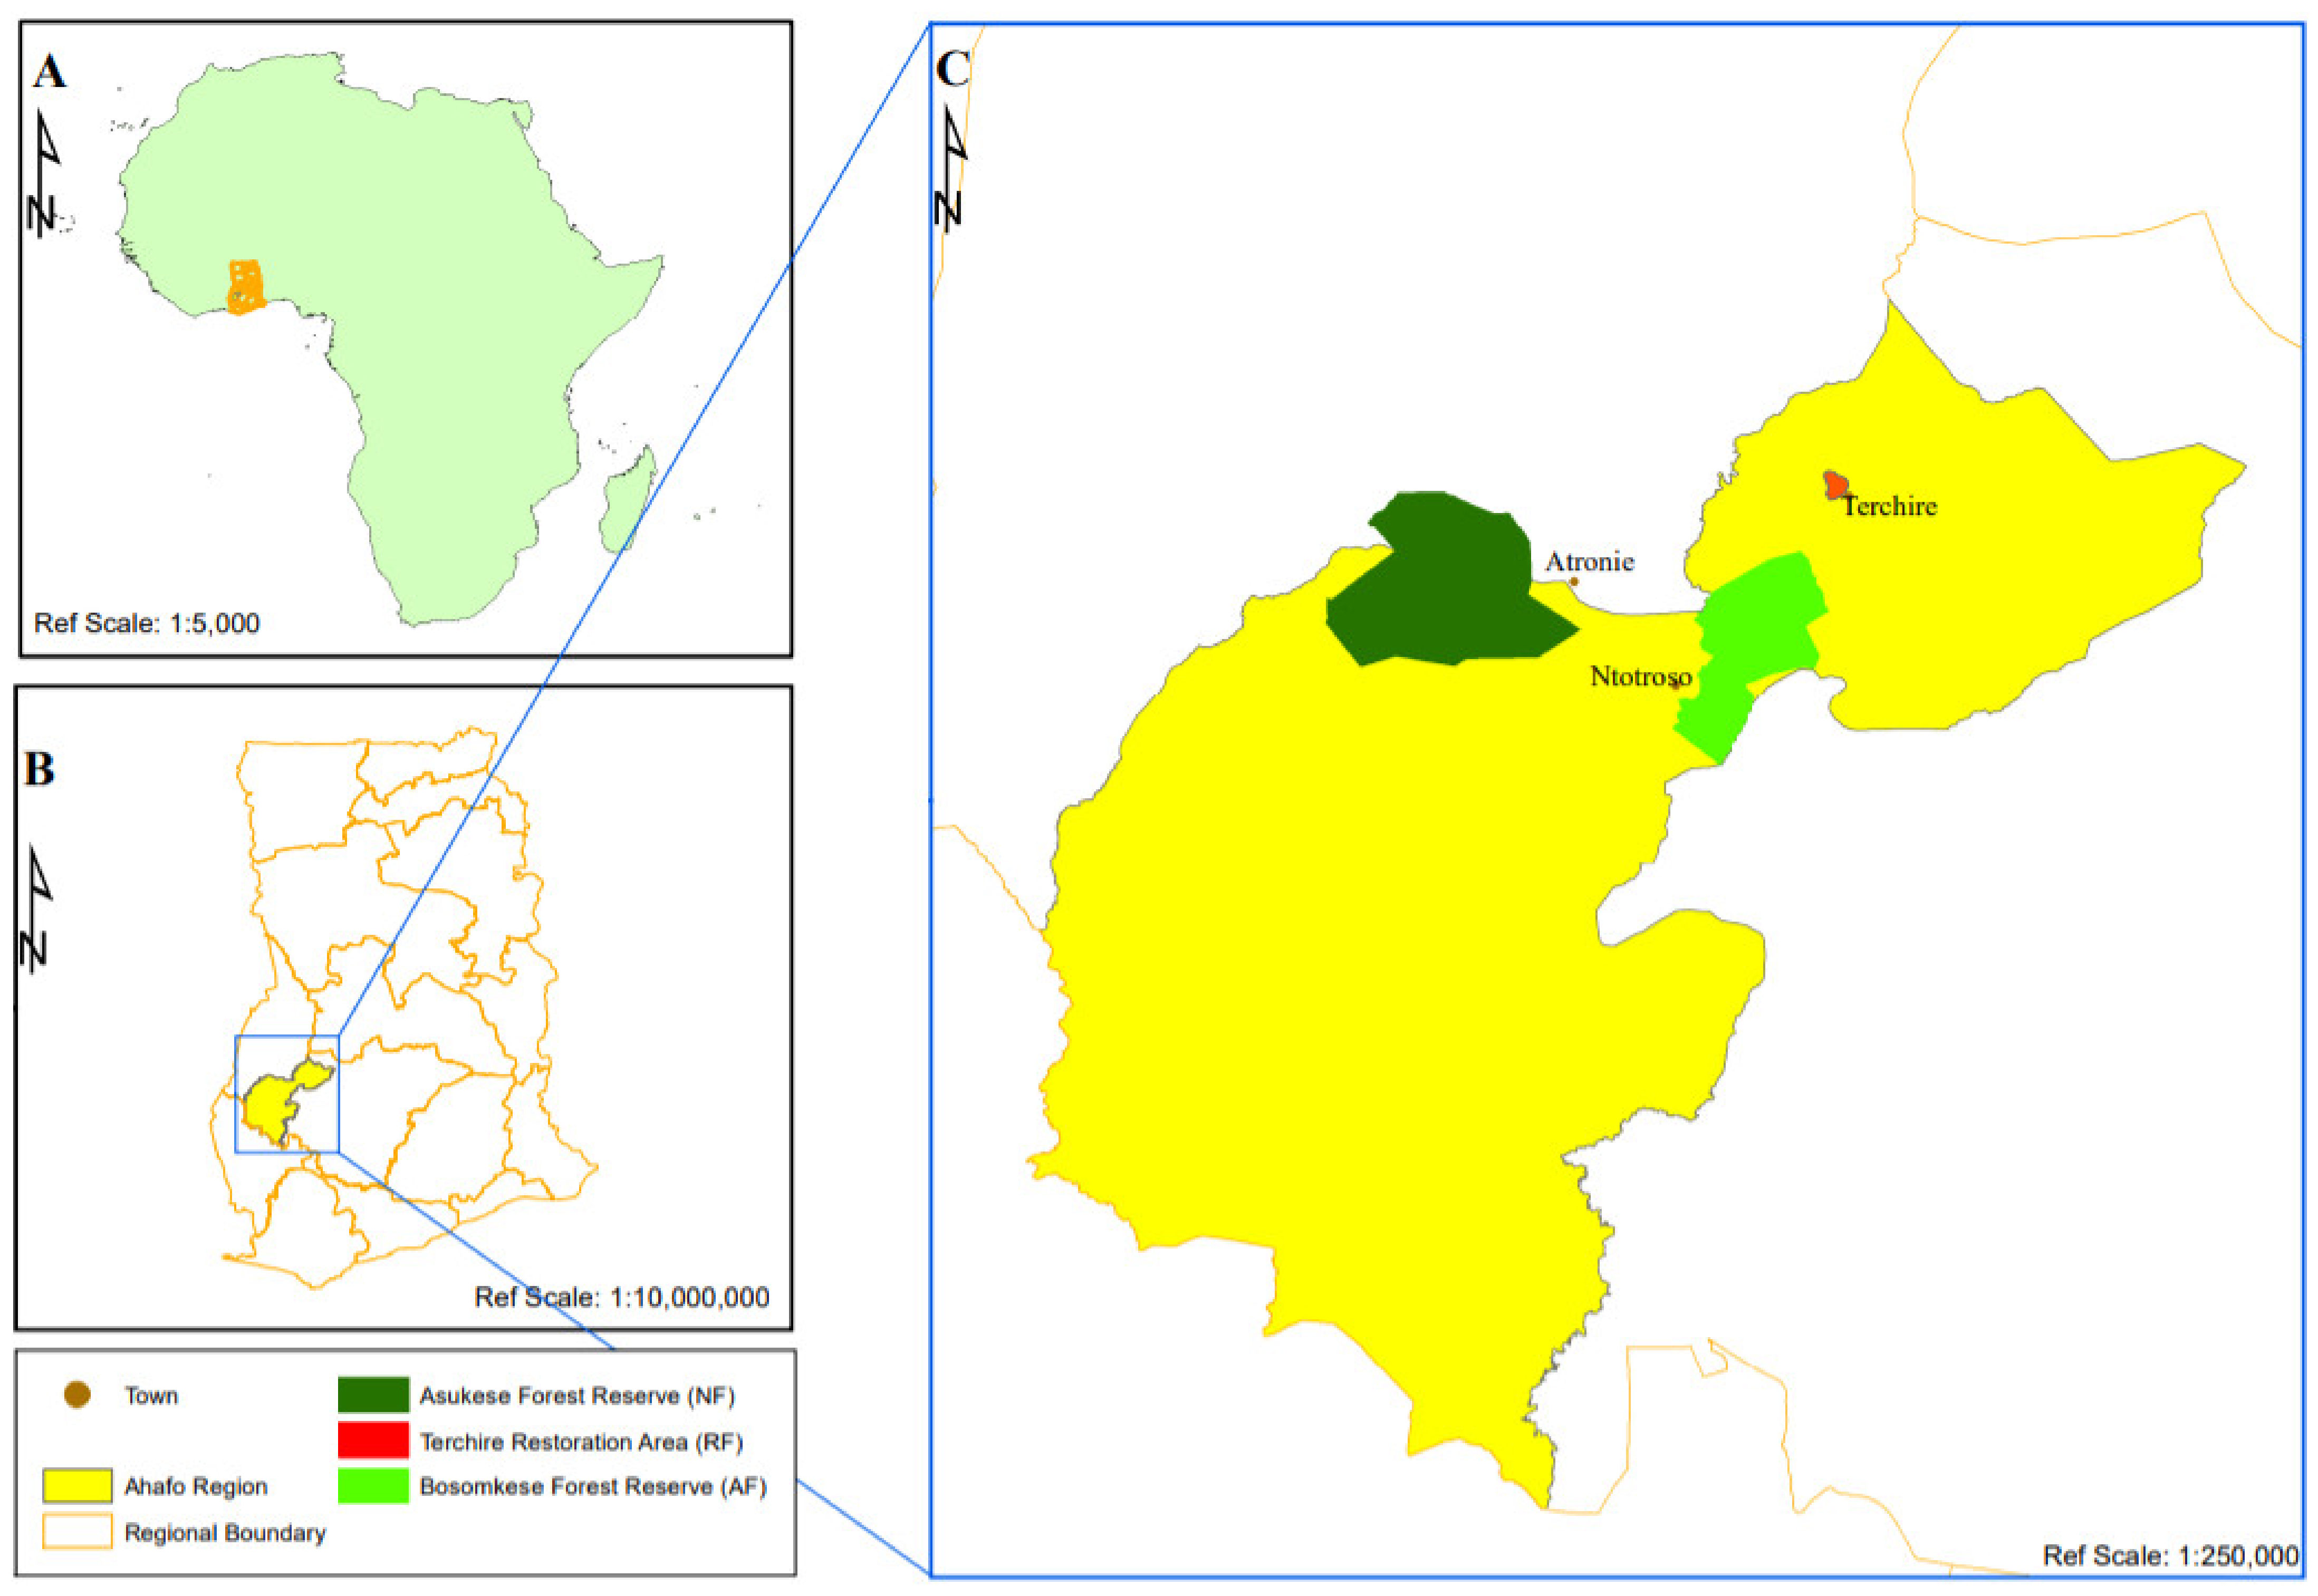
2.1. Study Site Description

We analysed plant trait composition, soil parameters and ecosystem services across three ecosystem types (actively “restored forest”, RF; “agroforestry system”, AF; and “natural forest”, NF) in a semi-deciduous forest zone (SDFZ), all located in the Ahafo and Bono regions of Ghana (Figure 1). The zone has a mean daily temperature of 20 °C, mean annual precipitation ranging between 900 and 1500 mm (rainfall peak between July and August [45]) and a soil classification according to the United States Department of Agriculture (USDA) Soil Taxonomy and the Food and Agriculture Organisation (FAO) World Reference Base as Ultisols (Acrisols and Nitisols) in the uplands and Fluvents (Fluvisols) and Inceptisols (Cambisols) in the lowlands [45].

2.2. Data Collection

We analysed plant trait composition, soil properties and ecosystem services across the three ecosystem types (actively “restored forest”, RF; “agroforestry system”, AF; and “natural forest”, NF). To this end, we demarcated eight plots of sizes 20 × 20 m in each of the three ecosystem types to sample ecosystem services using proxies, plant traits and soil attributes. To quantify the species abundance and composition of each woody species in the rainy season, we counted and identified all trees with a diameter ≥ 10 cm at breast height (dbh) to species level with a local botanist’s assistance and a field manual [50]. We chose a minimum dbh threshold ≥ 10 cm as this threshold encompasses the main diversity of tropical forest trees [51]. Then, we calculated each identified tree’s above-ground biomass using an improved allometric equation for the pantropical region In   AGB = α + β In   ( p × D 2   x   H + ε ; [52]] based on tree dbh, estimated height, and specific wood density values of trees obtained from the global wood density database [53].

2.3. Ecosystem Functions and Multifunctionality

We relied on the carbon stock, decomposition rate, pest regulation activities of predators, and decomposing organism numbers as proxies to estimate our study forest plots’ ecosystem services. In estimating carbon dioxide storage in tree tissues, the carbon stock was assumed to be 50% of the calculated above-ground biomass of each tree for each forest plot expressed per hectare [54]. Decomposition (the rate by which nutrients from plant tissues such as leaves are released back into the ecosystem through the activities of detritivores arthropods [55]) was estimated with a standardised method involving the use of tea bags as a proxy [56]. Regulating (control of pests) and supporting (organic matter decomposition) ecosystem services were also estimated using predators and decomposing organism numbers as proxies [44].
In sampling these organisms, we relied on five pitfall traps in each plot for each ecosystem type. Arthropod sampling was performed for ten weeks (June to August 2019) and was emptied weekly. Trapped samples were taxonomically grouped according to the available literature (order, suborder or family) and subsequently classified into major functional groups (decomposers as supporting services and predators as regulating service providers).

2.4. Functional Composition and Diversity

We ranked the species by their relative abundances for trait measurements and selected those species representing at least 90% of the total plant woody abundance measured in each plot. This resulted in a total of 38 different sampled species, many of which appeared in more than one sampling forest type (Appendix A, Table A1), from which 7 plant functional traits (Table 1) related to plant resource use (water, nutrient and light), reproductive effort and growth strategies were measured.
Trait attributes were collected in July 2020 (the peak biomass production period when rainfall was at its peak in the study region), except for seed mass compiled from seed databases available from the TRY Plant Trait Database [57] and the Royal Botanic Gardens, http://data.kew.org/sid/ (accessed on 28 August 2021). We selected 4 individuals of a species from each ecosystem type, constituting 152 individual trees per ecosystem type and 456 trees for the entire study. The chosen trees were canopy trees with leaves exposed to the sun and no visible damage. Therefore, we sampled 4 to 8 leaves from the 4 individual trees of each species. Fresh leaf and stem samples were first weighed and dried to a constant temperature of approximately 70 °C for 72 h. Before drying the leaf samples, their area was scanned (with Canon CanoScan LiDE 300 Flatbed Scanner; Canon Inc., Tokyo, Japan), images were uploaded onto ImageJ software [58], and leaf area was calculated following Glozer [59]. All trait measurements were carried out according to the criteria and methodology defined by Pérez-Harguindeguy et al. [60].
Table 1. Plant functional traits sampled and their respective functional roles in the ecosystem.
OrganTraitAbbUnitFunctional RoleReferences
LeafSpecific leaf areaSLAm2 kg−1Reflects whole-plant growth and photosynthetic efficiency of a species[61,62]
Leaf carbon and nitrogen ratioC/N It is an indicator of nitrogen-use efficiency reflecting the metabolic status of C and N in leaves[63,64]
Isotopic carbon fractionδ13CReflects gas exchange and water-use efficiency[65]
StemStem dry matter contentSDMCmg g−1Relates above-ground storage of carbon and stimulates plants’ resistance to physical hazards[33,66]
SeedSeed massSmassmgModerates a trade-off between plants’ rate of seed production per unit mass invested in reproduction and the mass of each offspring[67]
Whole plantPlant heightPhgmReflects a species ability to utilise light and above the ground competition[68,69]
SLA was calculated as leaf area divided by the leaf dry mass, while the SDMC was calculated by dividing the oven-dry weight of the stem by the fresh weight. Leaf chemical traits, including carbon, nitrogen and isotopic carbon (δ13C), were analysed at the Centre for Stable Isotope Research and Analysis (George August Universität, Göttingen, Germany). Seed mass for each species was obtained from the TRY Plant Trait Database [57] and the Royal Botanic Gardens (https://data.kew.org/sid/, accessed on 28 August 2021), while plant height (the vertical distance from the topmost living or dead part of the tree to the upslope side of the trunk base; [70]) for each tree was measured using Nikon Forestry pro II Laser Rangefinder/Hypsometer.
The functional composition of each community was obtained following Garnier et al. [71]. First, the traits were weighted by the relative abundance of their constitutive species to calculate the community weighted mean (CWM) in each plot. Then, we estimated the functional diversity per community based on functional richness (Frich) and Rao’s quadratic entropy (RaoQ [72,73,74,75,76]). Frich represents the amount of the functional space, where each trait is a dimension occupied by all the species present and characterises the change in functional space caused by the difference in the community structure [74,75]. RaoQ integrates the relative abundances of species with a measure of the pairwise functional differences between species [76,77].

2.5. Soil Properties Measurement

We took replicated soil samples (five samples combined into a composite sample) from each plot and ecosystem to analyse physical and chemical properties in the laboratory. The soil properties analysed included nutrient concentrations (nitrogen, phosphorus, magnesium, sodium, potassium and soil organic concentration—SOC), pH, and bulk density (BD). For the methodological details involved in sampling and analysis, see Damptey et al. [45].

2.6. Data Analysis

First, to identify major axes of attribute covariation and reduce the dataset to the same functional dimensions per component (soil parameters—SP; functional composition—FC; ecosystem services—ES), which is specially recommended for hypervolume analysis [78], we performed principal component analysis (PCA). We performed one PCA for each component with the mean value per plot of their attributes for ES (carbon stock, decomposition rate, pest control and decomposers) and SP (N, P, Mg, Na and K concentration, pH, BD and SOC) and the CWM for FC (SLA, SDMC, C/N, δ13C, Phg and Smass). We used the first three principal components for posterior analyses. To explore the distinctiveness between ecosystem types for soil properties and functional composition, we calculated the mean effect size (Hedges’d) and bias-corrected 95% bootstrap confidence intervals (effsize package [79]). The mean effect size was considered significantly different from zero when its confidence interval did not bracket zero.
Then, to assess the degree of similarity among the three ecosystem types for each study component independently (SP, FC and ES), we used the first three PCA axes to calculate each component’s hypervolume (SP, FC and ES) using a multidimensional kernel density estimation procedure. This approach quantified the magnitude of the occupied functional space by the n-dimensional space method [80]. First, we calculated the total amount of the multidimensional space occupied by each component independently. The estimation of the n-dimensional hypervolume calculated this multidimensional space for each component and ecosystem type. Then, we calculated the overlap between the hypervolumes among ecosystem types for each component with the correlation analysis of the “hypervolume” package, which compared the similarity between different hypervolumes using the Sørensen index [81].
To determine which attributes of the functional structure (functional trait composition and diversity) and soil parameters were best associated with each ecosystem service and multifunctionality, we conducted maximum likelihood techniques with a linear function using the likelihood package. We only fitted three-factor models to avoid overestimating the models with spurious parameters with very poor weights [82]. The factors were added either additively or multiplicatively. Due to the influence of ecosystem type on the functional composition and soil properties (as we observed in the effect size results), we also included the factor “ecosystem type” as a block factor. Then, models were ranked by their Akaike information criterion (AICc), and corrected for small sample size [83]. Models were considered to be equally supported if the difference in AIC was less than two units.
All statistical analyses were performed, producing all figures in the R 3.6.1 statistical platform [84].

3. Results

The first three components of the PCA accumulated 70.01%, 71.65% and 93.06% for SP, FC and ES, respectively (Table 2). The first principal component of the soil properties (explaining 32.30% of the variance) represented a gradient of soil nutrient availability (concentration of soil nitrogen, potassium, sodium and organic matter). In comparison, the second PCA axis (22.87%) was mainly associated with differences in the pH and concentration of soil phosphorus, and the third component (14.84%) was related to bulk density. With regard to the functional composition, the first principal component (34.27%) reflected coordination between SLA (specific leaf area) and δ13C (isotopic carbon fraction), which is representative of the leaf economics spectrum, and seed mass. The second principal component (20.70%) reflected a covariation in tissue resistance, as reflected by the gradient in SDMC (stem dry matter content) and C/N, while the third component (16.68%) was defined by plant height. The first component of the ecosystem services (39.69%) reflected invertebrate activity in both pest control and decomposition (higher abundance of predators and decomposers), while the second (30.34%) and third (23.03%) were linked to carbon stock and decomposition rate, respectively. Most functional traits values were higher in the natural forest than the other ecosystem types (Appendix A, Table A2).

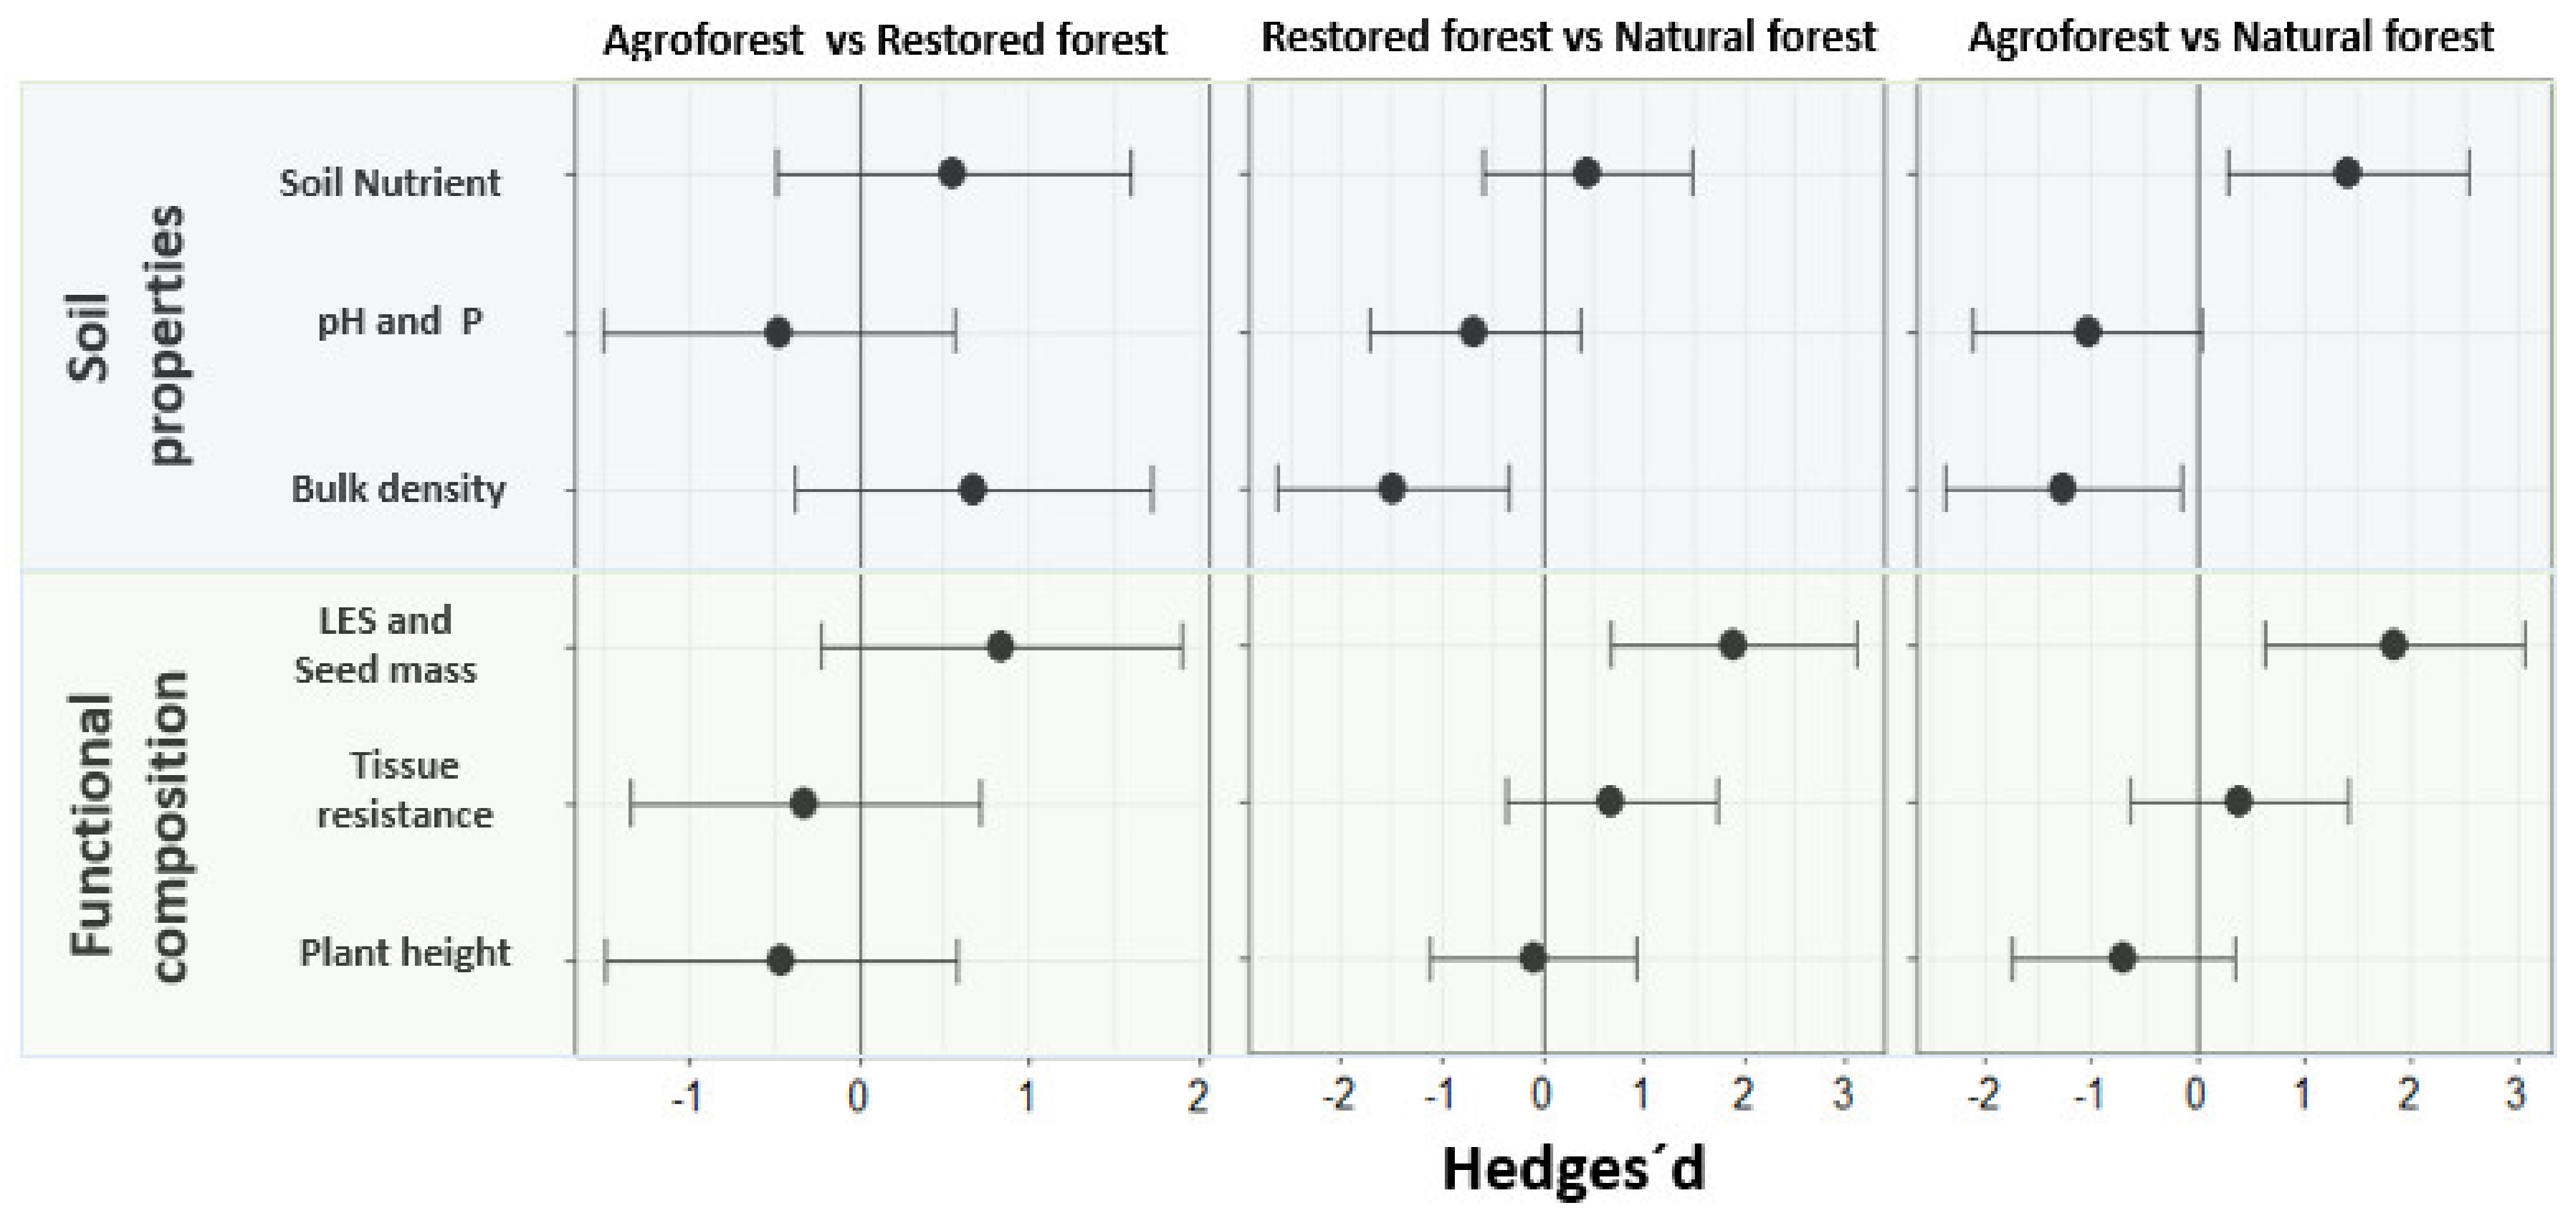
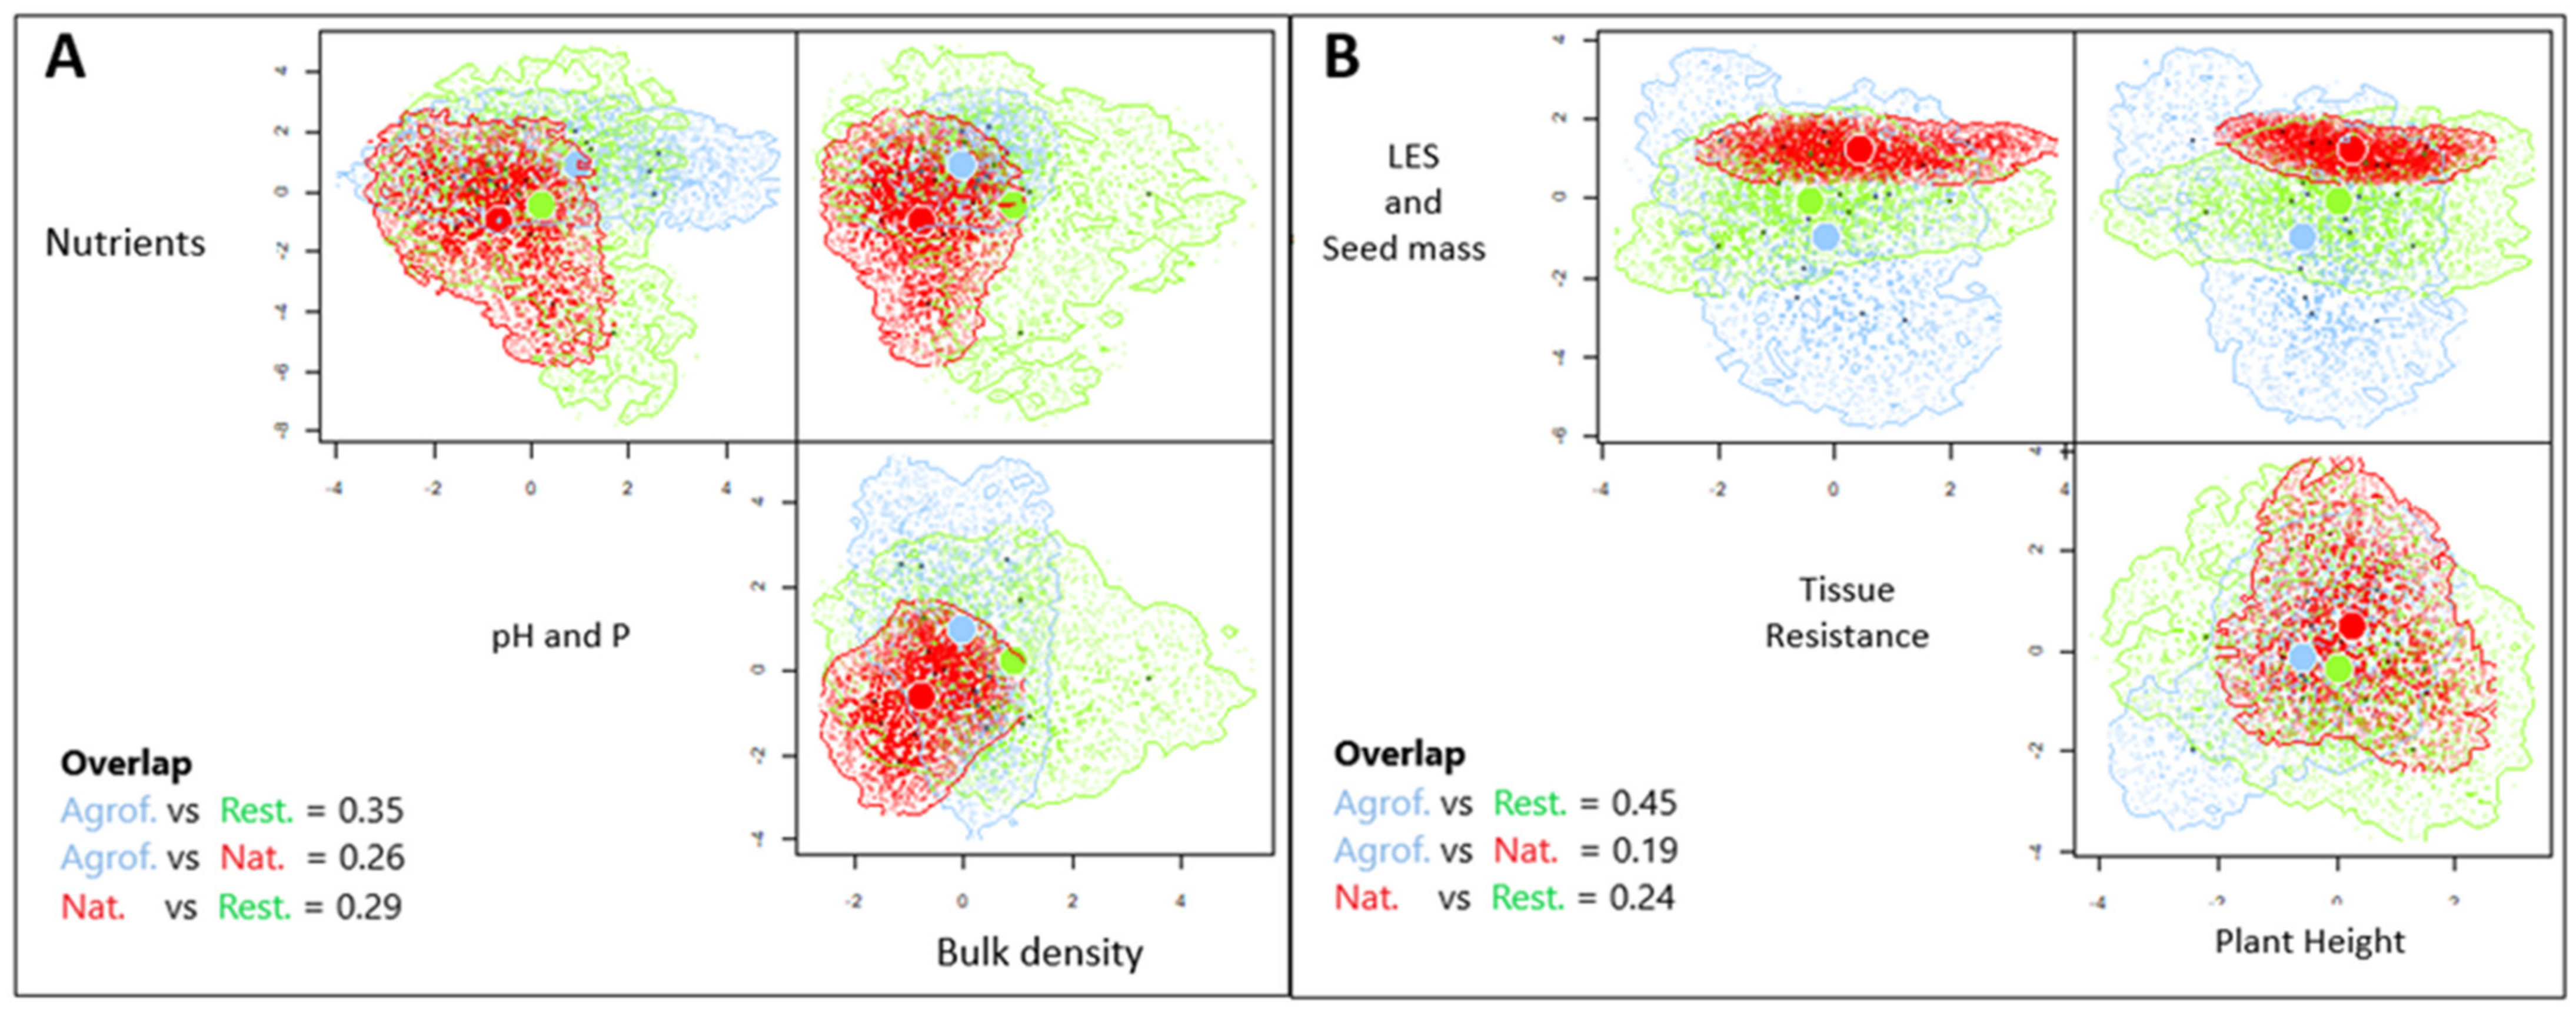
3.1. The Relationship of Ecosystem Types with Soil Parameters and Functional Composition

Overall, natural forest showed greater soil properties (higher nutrient concentration and lower bulk density) than non-natural forests (restored and agroforestry) (Figure 2), with the differences among restored and agroforestry systems determined by bulk density (Figure 2). The functional space was greatest for the restored forest (257.60 sd3) (Figure 3A), representing higher soil variability than the natural forest (65.67 sd3) and agroforest (77.49 sd3). The restored forest and agroforestry system showed a higher functional space overlap (35%) in terms of soil properties. However, the percentage of functional space overlap in the natural forest was higher than that in the restored forest (29%) and the agroforest (26%; Figure 3A).
In terms of functional structure, the main differences among the types of ecosystems were determined by the leaf economic spectrum (LES) and seed mass dimension, showing higher values in the natural forest than in the restored and agroforest (Figure 2), which suggests that the functional composition of the natural forest was dominated by acquisitive plants with higher seed mass, in contrast with the non-natural forests. With regard to the functional composition (Figure 3B), the natural forest showed the lowest functional space (21.45 sd3), while the non-natural forest showed higher variation (agroforest 140.19 sd3 and restored 109.40 sd3). However, for the functional space overlaps, the pattern was the same for soil properties, showing that the restored forest and agroforestry system had the highest overlap (45%), while the natural forest was more similar to the restored forest (24%) than the agroforest (19%; Figure 3B).

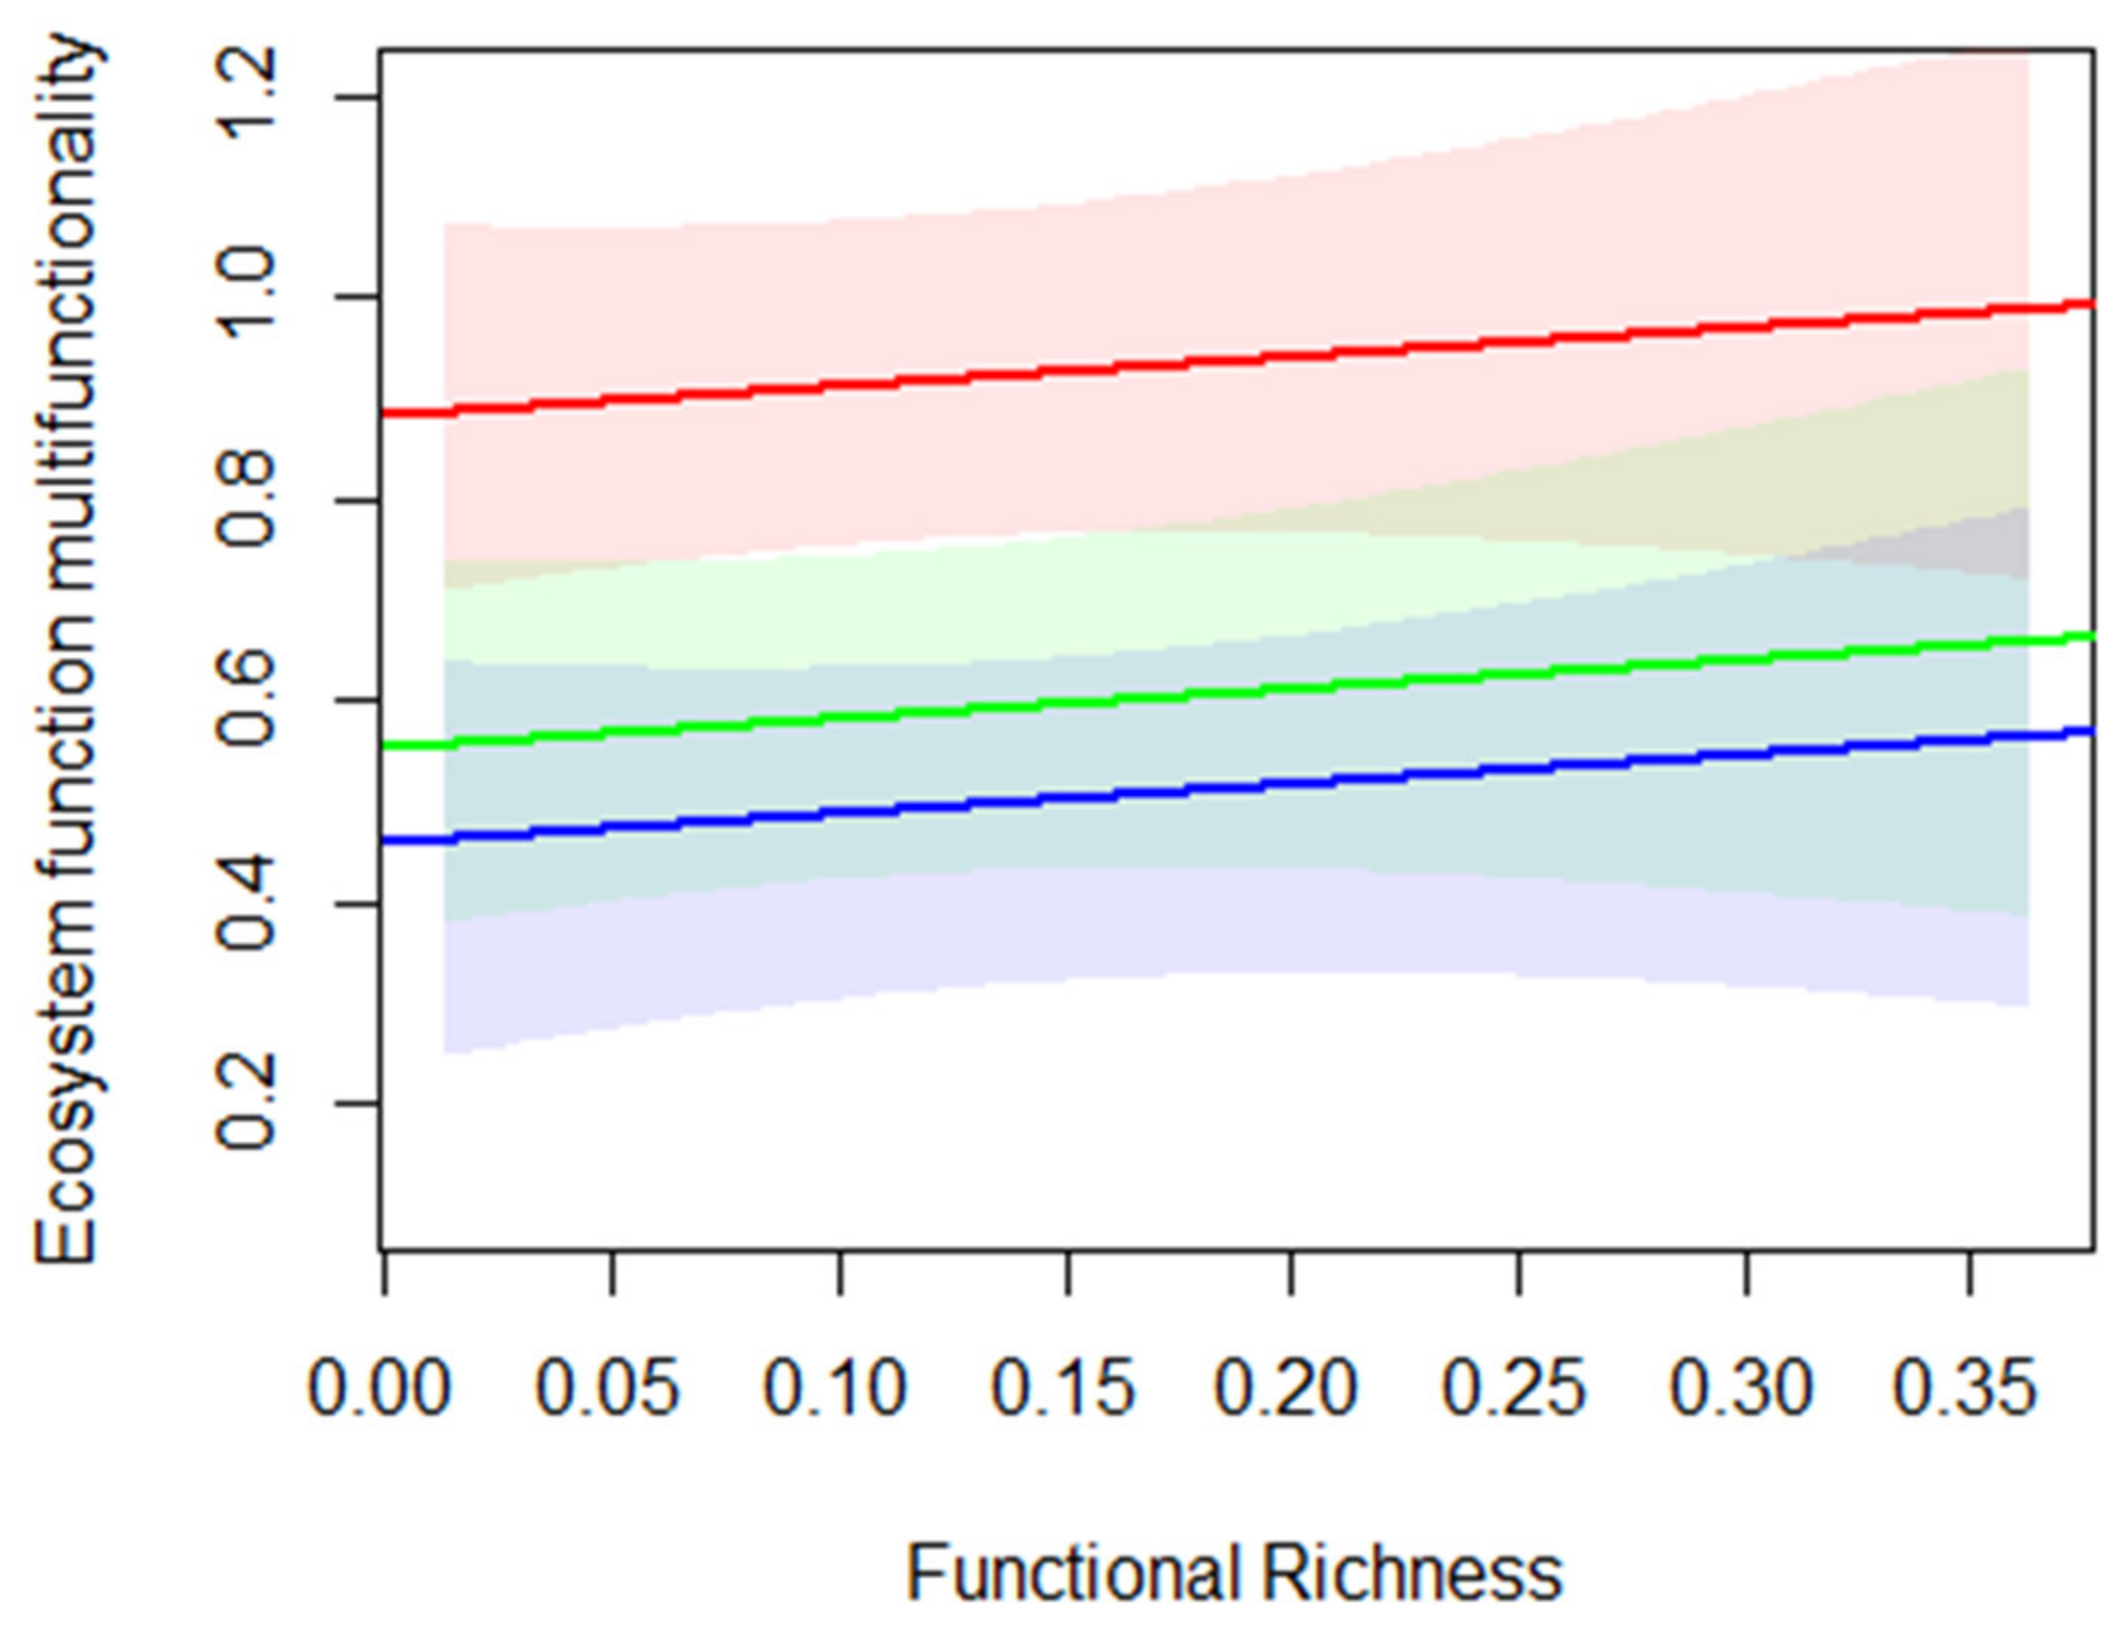
3.2. The Influence of Functional Structure and Soil Properties on Ecosystem Services and Multifunctionality across Ecosystems

The results from the n-dimensional hypervolume revealed similar variability among the three ecosystem types (63.55 sd3 for natural, 69.06 sd3 for restored and 58.70 sd3 for agroforest). In contrast with the previous dimensions (SP and FC), the restored and natural forests were more similar (45%) than the restored forest and agroforestry system (31%) and agroforestry system and natural forest (21%; Appendix A, Figure A1).
Our results showed that the ecosystem services and multifunctionality were explained mainly by the differences in site conditions of each ecosystem (except for decomposition rate), with FRic providing supplementary explanations independent of the selected ecosystem (additive interactions in all cases; Table 3). Hence, our model confirmed invertebrate activity, carbon stock and multifunctionality to be influenced by the differences in ecosystems and positively related to FRic (R2 = 0.52, R2 = 0.58, R2 = 0.47, respectively). Furthermore, pairwise comparison (Tukey post-hoc test) among ecosystem types showed the highest carbon stock (Appendix A, Figure A2) and multifunctionality (Figure 4) in the natural forest, rather than in the non-natural forests, while both the natural and restored forests showed higher invertebrate activity than agroforest (Appendix A, Figure A2). In contrast, the decomposition rate was mostly determined by a negative relationship with the soil bulk density dimension (R2 = 0.24; Table 3).

4. Discussion

In general, we observed differences in the functional space of soil properties, trait composition and ecosystem service proxies between the three ecosystem types. This study highlights the positive role of functional structure (mainly functional richness) of plant communities in driving ecosystem functioning and multifunctionality. The differences in the functional space of ecosystem services and trait compositions between ecosystem types resulted from different management decisions. Interestingly, the restored forest took an intermediate position between the natural forest and the agroforestry system for the studied dimensions. That is, the restored forest showed higher similarity for all the study dimensions with the natural forest than the agroforestry system, indicating a successful trajectory of the post-mining area under restoration over time.

4.1. Ecosystem Type Relationship with Soil Parameters and Functional Composition

In terms of soil properties, we observed the natural forest to have overall better soil attributes than the other ecosystem types, which was quite expected because of the natural forest age, level of protection, and plant species pool. Nevertheless, lower nutrient concentrations but higher pH and phosphorus levels were observed for the agroforestry system. This phosphorus concentration might have been caused by the excessive use of fertilisers (both organic and inorganic) for crop farming in the agroforestry system. In an agroforestry system, farmers inter-planting food crops with trees rely on fertilisers when natural remedies are insufficient to yield optimal results within the shortest possible time. This might have subsequently led to an increase in soil pH because of the alkaline nature of some applied fertilisers [85]. In contrast, soil fertility and pH in the restored forest did not differ significantly from those in the natural forest. Nevertheless, this did not imply a high similarity in the soil properties of either type of ecosystem, which is explained by the highest bulk density value in the restored forest. The high bulk density in the restored forest is due to the historical use of heavy machinery during the mining era. Although the restored forest seems to be on a recovery trajectory in soil development [45], its higher bulk density is due to some compaction issues that could improve with time.
This study also detected a consistent variation in the functional trait composition among the natural and non-natural forests (restored forest and agroforestry system). That is, the hypervolumes of the natural forest showed low overlap in terms of functional composition with regard to the others. This is not surprising because, in a previous study, we observed strong differences in terms of plant composition among these three ecosystems [45]. The strong role of species turnover as the main driver of functional trait variation is in accordance with previous studies at the local scale in tropical (e.g., Oliveras et al. [86]) and temperate forests (e.g., de la Riva et al. [87]). Indeed, Oliveras et al. [86] reported a high species replacement along an elevational gradient in a tropical forest from Ghana, reflecting the strengths of local filtering in each type of ecosystem. However, the non-natural forests showed higher functional overlap among them in terms of species composition (see also Damptey et al. [45]). One of the main reasons could be the use of exotic tree species with similar traits, such as Cedrela odorata L., which increases the functional similarity of both non-natural forests compared with the natural forest. We found that the differences in the functional composition of the natural forest with regard to the non-natural forests were mainly determined by the dimension related to leaf economics spectrum theory (sensu Wright et al. [88]) and seed mass. Therefore, communities from the natural forest were dominated by fast-growing, acquisitive species with high resource uptake and low water and nutrient use efficiency (higher values of SLA and lower δ13C; [88,89]), and higher seed mass. This general pattern is consistent with previous studies where neotropical forests show higher values of SLA than less productive environments [90,91,92] because, in these productive habitats, competition for light may promote the selection of resource-acquisitive species, where it is better to grow faster and compete for light [89,92]. Indeed, as the climatic variables (primarily temperature and precipitation) set broadly similar conditions among the three ecosystems, our observations suggest that the intrinsic properties of each environment, such as edaphic factors, determine the functional composition of the communities. For instance, the highest soil fertility enhances the acquisitive strategies of the natural forest, while the lower water (high BD) and nutrient availability promoted by land-use management over soil productivity, seem to favour species with long-term investment and nutrient retention in the non-natural forests. In addition, the faster resource acquisition strategy was also positively related to higher values of seed mass.
Similarly, Cornelissen [93] reported a positive relationship between leaf area and seed size in woody species. Overall, higher seed mass may enhance seedling success [94,95] at the expense of producing fewer seeds per unit of reproductive effort and reducing dispersal capability [96,97]. In a previous study, we also observed a higher biomass of food and fodder trees in the natural forest [44]. Since the size of the seeds in tropical trees is related to fruit size [98], this is probably a pattern resulting from historical selection by the local population that has favoured tree species with specific traits. Overall, our results provide novel insight into the effects of anthropogenic activity as the main driver of plant community assembly in tropical forests, pointing out that there is a strong pressure of certain functional strategies in non-natural management ecosystems.

4.2. Functional Structure and Soil Properties Influence Ecosystem Services and Multifunctionality across Ecosystems

We observed that invertebrate activity, carbon stock and multifunctionality were mainly driven by the specific properties of each ecosystem type, probably determined by the respective management focus (protection, convalescence or agroforestry). For instance, the natural forest had the highest carbon stock, which is not surprising because mature tropical forests are frequently dominated by old trees with a high diameter [99,100]. We have previously identified higher above-ground biomass, root organic carbon content, and tree species richness in natural forest [44,45].
In addition, the observed association of invertebrates (predators and decomposers) could be a response of these groups to diverse vegetation and complexity of the stand structure, which probably results in the availability of various food resources and habitat niches [101,102]. However, the restored forest is mostly dominated by trees in younger stands with smaller diameters and above-ground biomass compared with the agroforestry system. Hence, the high number of invertebrates in the restored forest compared with the agroforestry system may result from different factors. The complex topsoil and soil surface structure in the restored forest [45] may enhance invertebrate activity. This complex topsoil serves as a habitat for numerous invertebrates providing shelter, protection, and food resources, as well as serving as breeding grounds [103]. On the other hand, the lower activity of invertebrates in the agroforestry system could be related to agricultural management practices in the area. For instance, the application of pesticides reduces many non-target invertebrate numbers [104]. Independent of the major driver, land-use intensification seems to result in a shift towards lower invertebrate activity in tropical tree-dominated ecosystems, supporting previous studies in the tropics [105], and globally [106,107].
The natural and restored forests shared the highest functional space for ecosystem services driven by carbon storage, regulating invertebrate activities (decomposers and pest control) and decomposition rates. A higher functional space overlap between the natural and restored forest ecosystem services could be related to both ecosystems sharing an almost similar volume of above-ground biomass, organic root carbon, and soil properties (see Damptey et al. [45]) emanating from the previous restoration interventions. This indicates successful ongoing ecological development of the restored forest, which improves with better management options. Accordingly, available soil nutrients should help plants grow faster and increase biomass productivity [108,109]. Fertile soils in the natural and restored forests may have translated into higher tree species diversity and their functional attributes, thereby enhancing their carbon storage potentials (productivity [110,111,112]).
We also observed that functional richness and/or soil properties drive ecosystem functions and multifunctionality across ecosystem types [23,113,114]. The ability of each forest (ecosystem) to simultaneously perform multiple ecosystem functions (multifunctionality [115]), such as carbon storage, increasing decomposer abundance and pest control, is influenced positively by the functional richness of the particular ecosystem in question. Usually, diverse trees with multiple traits lead to efficient resource utilisation and subsequent improvement in ecosystem functioning, such as productivity [116,117], which may explain the positive relationship between functional richness and carbon stock. The role of functional diversity in carbon storage has been discussed extensively. For instance, a study by Mensah et al. [118] revealed a positive relationship between functional diversity (richness and evenness) and carbon storage. Similarly, Shen et al. [116] discussed the role of functional diversity in influencing carbon storage, which reflects the relative importance of complementarity effects [119]. Furthermore, invertebrate numbers (a proxy for pollinators, decomposers and pest regulators) also correlated positively with functional richness, in agreement with several studies [120,121]. This relationship resulted from the fact that diverse tree richness offered various ecological niches that supported the activities of most invertebrates, providing several ecosystem functions [122,123]. For instance, higher functional richness may provide suitable foraging and nesting resources, favor food web interactions, and support the survival and activities of invertebrates [124], thereby influencing ecosystem multifunctionality [125].
In addition, our results show negative feedback between decomposition rates and soil bulk density. The decomposition rate is strongly influenced by soil bulk density [126] because soil compaction strongly promotes water limitations [127,128], reduces oxygen and limits nutrient transportation through soil constraining indigenous flora, plant root systems and soil organic matter [129]. Therefore, reduced aeration, characterizing soils with higher bulk density, has been postulated as a driver limiting the activities of soil-decomposing microbes [130]. In fact, in a previous study [45], we observed that bulk density also accounts for the variation in root organic carbon in these areas. Thus, variation in microbiota, soil invertebrates and root morphology due to varying soil BD may affect decomposition rates [129,131,132].

5. Conclusions

Our study highlights that tropical tree-dominated ecosystems with higher functional diversity are superior in providing multiple ESs, compared to less functionally diverse forests [133,134,135]. Higher functional richness of tree communities holds the potential to enhance ecosystem multifunctionality, independent of the ecosystem type. From the results of this study, it is evident that it is crucial to preserve natural and restored forests as key reservoirs of ecosystem services, especially in tropical countries such as Ghana, where deforestation continues to threaten the livelihoods of local human communities and biodiversity per se. It is also essential to develop appropriate restoration protocols and management strategies that could favor functional diversity and soil properties in tropical forests to enhance the provision of ecosystem services.

Author Contributions

All authors contributed to the study conception and design. F.G.D. wrote the first draft of the manuscript and all authors commented on previous versions. All authors have read and agreed to the published version of the manuscript.

Funding

This research received no external funding.

Institutional Review Board Statement

Not applicable.

Informed Consent Statement

Not applicable.

Data Availability Statement

The data that support the findings of this study are openly available in figshare. Available online: https://figshare.com/s/30cd2df0f3db5b96e135.

Acknowledgments

We are grateful to the Newmont Gold Ghana Limited, Forest Service Division of Ghana and the Terchire community for making the study sites available. We would like to thank the reviewers and the editor for their comments on a previous version. We appreciate the contributions of Daniel Kwame Debrah, Prince Pascal Agro, and Clement Wulnye during the fieldwork. We are grateful to the Centre for Stable Isotope Research and Analysis (George August Universität, Göttingen, Germany) for helping with the nitrogen and isotopic carbon analysis. Scholarship support from the Catholic Academic Exchange Service (KAAD) to FGD is greatly appreciated.

Conflicts of Interest

On behalf of all authors, the corresponding author states no conflict of interest.

Appendix A

Table A1. Tree species considered for trait measurement. Family names of species adopted from The Plant List [136].
SpeciesFamily
Antrocaryon micraster A. Chev. & GuillauminAnacardiaceae
Alstonia boonei De Wild.Apocynaceae
Funtumia elastica (Preuss) Stapf Apocynaceae
Holarrhena floribunda (G. Don) T. Durand & SchinzApocynaceae
Rauvolfia vomitoria Afzel.Apocynaceae
Spathodea campanulata P. Beauv.Bignoniaceae
Distemonanthus benthamianus Baill.Leguminosae
Terminalia ivorensis A. Chev.Combretaceae
Terminalia suberba Engl. & DielsCombretaceae
Antidesma laciniatum Müll. Arg.Phyllanthaceae
Macaranga barteri Müll. ArgEuphorbiaceae
Ricinodendron heudelotii (Baill.) HeckelEuphorbiaceae
Albizia zygia (DC.) J. F. Macbr.Leguminosae
Anthocleista nobilis G. DonGentianaceae
Amphimas pterocarpoides HarmsLeguminosae
Bombax buonopozense P. Beauv.Malvaceae
Ceiba pentandra (L.) Gaertn.Malvaceae
Cola gigantea A. Chev.Malvaceae
Mansonia altissima (A Chev.) A Chev.Malvaceae
Pterygota macrocarpa K. Schum.Malvaceae
Triplochiton scleroxylon K. Schum.Malvaceae
Azadirachta indica A. Juss.Meliaceae
Entandrophragma angolense (Welw.) C. DC.Meliaceae
Entandrophragma utile (Dawe & Sprague) SpragueMeliaceae
Khaya anthotheca (Welw.) C. DC.Meliaceae
Piptadeniastrum africanum (Hook.f.) BrenanLeguminosae
Antiaris toxicaria (Lesch.)Moraceae
Ficus exasperata VahlMoraceae
Milicia excelsa (Welw.) C. C. BergMoraceae
Morus mesozygia StapfMoraceae
Pycnanthus angolensis (Welw.) Warb.Myristicaceae
Margaritaria discoidea (Baill.) G. L. WebsterPhyllanthaceae
Morinda lucida Benth.Rubiaceae
Blighia sapida K.D. KoenigSapindaceae
Chrysophyllum albidum G. DonSapotaceae
Sterculia rhinopetala K. Schum.Malvaceae
Celtis adolfi-friderici Engl.Cannabaceae
Celtis mildbraedii Engl.Cannabaceae
Figure A1. Estimated three-dimensional hypervolumes for the three study sites (see Table 2). Each plant dimension was based on the first PCA axis of the different attributes belonging to ecosystem services dimensions. Overlap among each type of forest based on Sørensen similarity index is shown.
Forests 13 00297 g0a1
Figure A2. Boxplot between ecosystem types and ecosystem services dimensions (PC1—invertebrate activity; PC2—carbon stock dimensions) (see Table 2). The line inside the box represents the median value, the box limits are the 25th and 75th percentiles, error bars show 10th and 90th percentiles.
Forests 13 00297 g0a2
Table A2. Functional trait values (averages) for ecosystem types.
Plant Abundance and
Measured Functional Traits
Natural ForestRestored ForestAgroforestry System
Plant abundance (n/ha)157119153
Specific leaf area (m/kg2)80.64666.32647.018
Leaf carbon and nitrogen ratio13.29212.19212.480
Isotopic carbon fraction (‰)31.11731.17430.523
Stem dry matter content (mg/g)0.4230.4110.418
Seed mass (mg)0.9070.5690.666
Plant height (m)14.53214.65516.120

References

  1. Malhi, Y.; Franklin, J.; Seddon, N.; Solan, M.; Turner, M.G.; Field, C.B.; Knowlton, N. Climate change and ecosystems: Threats, opportunities and solutions. Philos. Trans. R. Soc. B Biol. Sci. 2020, 375, 1794. [Google Scholar] [CrossRef] [PubMed] [Green Version]
  2. Van der Geest, K.; de Sherbinin, A.; Kienberger, S.; Zommers, Z.; Sitati, A.; Roberts, E.; James, R. The impacts of climate change on ecosystem services and resulting losses and damages to people and society. In Loss and Damage from Climate Change; Mechler, R., Bouwer, L.M., Schinko, T., Surminski, S., Linnerooth-Bayer, J., Eds.; Springer: Cham, Swtizerland, 2019; pp. 221–236. [Google Scholar]
  3. Lavorel, S. Plant functional effects on ecosystem services. J. Ecol. 2013, 101, 4–8. [Google Scholar] [CrossRef]
  4. Hillman, J.R.; Lundquist, C.J.; Thrush, S.F. The challenges associated with connectivity in ecosystem processes. Front. Mar. Sci. 2018, 5, 364. [Google Scholar] [CrossRef] [Green Version]
  5. Balvanera, P.; Pfisterer, A.B.; Buchmann, N.; He, J.S.; Nakashizuka, T.; Raffaelli, D.; Schmid, B. Quantifying the evidence for biodiversity effects on ecosystem functioning and services. Ecol. Lett. 2006, 9, 1146–1156. [Google Scholar] [CrossRef] [PubMed] [Green Version]
  6. Loreau, M.; Naeem, S.; Inchausti, P.; Bengtsson, J.; Grime, J.P.; Hector, A.; Wardle, D.A. Biodiversity and ecosystem functioning: Current knowledge and future challenges. Science 2001, 294, 804–808. [Google Scholar] [CrossRef] [Green Version]
  7. Hanisch, M.; Schweiger, O.; Cord, A.F.; Volk, M.; Knapp, S. Plant functional traits shape multiple ecosystem services, their trade-offs and synergies in grasslands. J. Appl. Ecol. 2020, 57, 1535–1550. [Google Scholar] [CrossRef]
  8. Birkhofer, K.; Andersson, G.K.; Bengtsson, J.; Bommarco, R.; Dänhardt, J.; Ekbom, B.; Ekroos, J.; Hahn, T.; Hedlund, K.; Jönsson, A.M.; et al. Relationships between multiple biodiversity components and ecosystem services along a landscape complexity gradient. Biol. Conserv. 2018, 218, 247–253. [Google Scholar] [CrossRef]
  9. Maestre, F.T.; Castillo-Monroy, A.P.; Bowker, M.A.; Ochoa-Hueso, R. Species richness effects on ecosystem multifunctionality depend on evenness, composition and spatial pattern. J. Ecol. 2012, 100, 317–330. [Google Scholar] [CrossRef]
  10. Gamfeldt, L.; Hillebrand, H.; Jonsson, P.R. Multiple functions increase the importance of biodiversity for overall ecosystem functioning. Ecology 2008, 89, 1223–1231. [Google Scholar] [CrossRef]
  11. Mouillot, D.; Villéger, S.; Scherer-Lorenzen, M.; Mason, N.W. Functional structure of biological communities predicts ecosystem multifunctionality. PLoS ONE 2011, 6, e17476. [Google Scholar] [CrossRef] [Green Version]
  12. Luo, Y.H.; Cadotte, M.W.; Burgess, K.S.; Liu, J.; Tan, S.L.; Zou, J.Y.; Xu, K.; Li, D.Z.; Gao, L.M. Greater than the sum of the parts: How the species composition in different forest strata influence ecosystem function. Ecol. Lett. 2019, 22, 1449–1461. [Google Scholar] [CrossRef]
  13. Gross, N.; Bagousse-Pinguet, Y.L.; Liancourt, P.; Berdugo, M.; Gotelli, N.J.; Maestre, F.T. Functional trait diversity maximizes ecosystem multifunctionality. Nat. Ecol. Evol. 2017, 1, 0132. [Google Scholar] [CrossRef] [PubMed]
  14. Violle, C.; Navas, M.L.; Vile, D.; Kazakou, E.; Fortunel, C.; Hummel, I.; Garnier, E. Let the concept of trait be functional! Oikos 2007, 116, 882–892. [Google Scholar] [CrossRef]
  15. Nock, C.A.; Vogt, R.J.; Beisner, B.E. Functional traits. In eLS; John Wiley & Sons, Ltd.: Chichester, UK, 2016; pp. 1–8. [Google Scholar] [CrossRef]
  16. Adler, P.B.; Salguero-Gómez, R.; Compagnoni, A.; Hsu, J.S.; Ray-Mukherjee, J.; Mbeau-Ache, C.; Franco, M. Functional traits explain variation in plant life history strategies. Proc. Natl. Acad. Sci. USA 2014, 111, 740–745. [Google Scholar] [CrossRef] [PubMed] [Green Version]
  17. Chaturvedi, R.K.; Tripathi, A.; Raghubanshi, A.S.; Singh, J.S. Functional traits indicate a continuum of tree drought strategies across a soil water availability gradient in a tropical dry forest. For. Ecol. Manag. 2021, 482, 118740. [Google Scholar] [CrossRef]
  18. Feizabadi, M.F.; Tahmasebi, P.; Broujeni, E.A.; Ebrahimi, A.; Omidipour, R. Functional diversity, functional composition and functional β diversity drive aboveground biomass across different bioclimatic rangelands. Basic Appl. Ecol. 2021, 52, 68–81. [Google Scholar] [CrossRef]
  19. Vargas-Hernández, J.G.; Zdunek-Wielgołaska, J. Urban green infrastructure as a tool for controlling the resilience of urban sprawl. Environ. Dev. Sustain. 2021, 23, 1335–1354. [Google Scholar] [CrossRef] [Green Version]
  20. Hanif, M.; Yu, Q.; Rao, X.; Shen, W. Disentangling the contributions of plant taxonomic and functional diversities in shaping aboveground biomass of a restored forest landscape in Southern China. Plants 2019, 8, 612. [Google Scholar] [CrossRef] [Green Version]
  21. Zhu, J.; Jiang, L.; Zhang, Y. Relationships between functional diversity and aboveground biomass production in the Northern Tibetan alpine grasslands. Sci. Rep. 2016, 6, 34105. [Google Scholar] [CrossRef] [Green Version]
  22. Finegan, B.; Peña-Claros, M.; de Oliveira, A.; Ascarrunz, N.; Bret-Harte, M.S.; Carreño-Rocabado, G.; Casanoves, F.; Dıaz, S.; Velepucha, P.E.; Fernandez, F.; et al. Does functional trait diversity predict above-ground biomass and productivity of tropical forests? Testing three alternative hypotheses. J. Ecol. 2015, 103, 191–201. [Google Scholar] [CrossRef] [Green Version]
  23. Huang, X.; Su, J.; Li, S.; Liu, W.; Lang, X. Functional diversity drives ecosystem multifunctionality in a Pinus yunnanensis natural secondary forest. Sci. Rep. 2019, 9, 6979. [Google Scholar] [CrossRef] [PubMed] [Green Version]
  24. Bu, W.; Huang, J.; Xu, H.; Zang, R.; Ding, Y.; Li, Y.; Li, Y.; Lin, M.; Wang, J.; Zhang, C. Plant functional traits are the mediators in regulating effects of abiotic site conditions on aboveground carbon stock-evidence from a 30 ha tropical forest plot. Front. Plant Sci. 2019, 9, 1958. [Google Scholar] [CrossRef] [PubMed]
  25. Fyllas, N.M.; Michelaki, C.; Galanidis, A.; Evangelou, E.; Zaragoza-Castells, J.; Dimitrakopoulos, P.G.; Tsadilas, C.; Arianoutsou, M.; Lloyd, J. Functional trait variation among and within species and plant functional types in mountainous mediterranean forests. Front. Plant Sci. 2020, 11, 212. [Google Scholar] [CrossRef] [Green Version]
  26. Westoby, M.; Falster, D.S.; Moles, A.T.; Vesk, P.A.; Wright, I.J. Plant ecological strategies: Some leading dimensions of variation between species. Annu. Rev. Ecol. Syst. 2002, 33, 125–159. [Google Scholar] [CrossRef] [Green Version]
  27. Díaz, S.; Kattge, J.; Cornelissen, J.H.; Wright, I.J.; Lavorel, S.; Dray, S.; Reu, B.; Kleyer, M.; Wirth, C.; Prentice, I.C.; et al. The global spectrum of plant form and function. Nature 2016, 529, 167–171. [Google Scholar] [CrossRef]
  28. Dıaz, S.; Cabido, M. Vive la différence: Plant functional diversity matters to ecosystem processes. Trends Ecol. Evol. 2001, 16, 646–655. [Google Scholar] [CrossRef]
  29. Reich, P.B. The world-wide ‘fast–slow’plant economics spectrum: A traits manifesto. J. Ecol. 2014, 102, 275–301. [Google Scholar] [CrossRef]
  30. De la Riva, E.G.; Prieto, I.; Villar, R. The leaf economic spectrum drives leaf litter decomposition in Mediterranean forests. Plant Soil 2019, 435, 353–366. [Google Scholar] [CrossRef]
  31. Conti, G.; Díaz, S. Plant functional diversity and carbon storage–an empirical test in semi-arid forest ecosystems. J. Ecol. 2013, 101, 18–28. [Google Scholar] [CrossRef]
  32. Laureto, L.M.O.; Cianciaruso, M.V.; Samia, D.S.M. Functional diversity: An overview of its history and applicability. Nat. Conserv. 2015, 13, 112–116. [Google Scholar] [CrossRef] [Green Version]
  33. De la Riva, E.G.; Marañón, T.; Violle, C.; Villar, R.; Pérez-Ramos, I.M. Biogeochemical and ecomorphological niche segregation of Mediterranean woody species along a local gradient. Front. Plant Sci. 2017, 8, 1242. [Google Scholar] [CrossRef] [PubMed]
  34. Lazarova, S.; Coyne, D.; Rodríguez, M.G.; Peteira, B.; Ciancio, A. Functional diversity of soil nematodes in relation to the impact of agriculture—A review. Diversity 2021, 13, 64. [Google Scholar] [CrossRef]
  35. Valladares, F.; Bastias, C.C.; Godoy, O.; Granda, E.; Escudero, A. Species coexistence in a changing world. Front. Plant Sci. 2015, 6, 866. [Google Scholar] [CrossRef] [PubMed]
  36. De Bello, F.; Lavorel, S.; Díaz, S.; Harrington, R.; Cornelissen, J.H.; Bardgett, R.D.; Matty, P.B.; Cipriotti, P.; Feld, C.K.; Hering, D.; et al. Towards an assessment of multiple ecosystem processes and services via functional traits. Biodivers. Conserv. 2010, 19, 2873–2893. [Google Scholar] [CrossRef]
  37. Birkhofer, K.; Fliessbach, A.; Gavín-Centol, M.P.; Hedlund, K.; Ingimarsdóttir, M.; Jørgensen, H.B.; Kozjek, K.; Meyer, S.; Montserrat, M.; Moreno, S.S. Conventional agriculture and not drought alters relationships between soil biota and functions. Sci. Rep. 2021, 11, 23975. [Google Scholar] [CrossRef]
  38. Birkhofer, K.; Smith, H.G.; Weisser, W.W.; Wolters, V.; Gossner, M.M. Land-use effects on the functional distinctness of arthropod communities. Ecography 2015, 38, 889–900. [Google Scholar] [CrossRef]
  39. Jayathilake, H.M.; Prescott, G.W.; Carrasco, L.R.; Rao, M.; Symes, W.S. Drivers of deforestation and degradation for 28 tropical conservation landscapes. Ambio 2021, 50, 215–228. [Google Scholar] [CrossRef]
  40. Jung, M.; Rowhani, P.; Scharlemann, J.P. Impacts of past abrupt land change on local biodiversity globally. Nat. Commun. 2019, 10, 5474. [Google Scholar] [CrossRef] [Green Version]
  41. Acheampong, E.O.; Macgregor, C.J.; Sloan, S.; Sayer, J. Deforestation is driven by agricultural expansion in Ghana’s forest reserves. Sci. Afr. 2019, 5, e00146. [Google Scholar] [CrossRef]
  42. Symes, W.S.; Edwards, D.P.; Miettinen, J.; Rheindt, F.E.; Carrasco, L.R. Combined impacts of deforestation and wildlife trade on tropical biodiversity are severely underestimated. Nat. Commun. 2018, 9, 4052. [Google Scholar] [CrossRef] [Green Version]
  43. Oduro, K.A.; Mohren, G.M.J.; Pena-Claros, M.; Kyereh, B.; Arts, B. Tracing forest resource development in Ghana through forest transition pathways. Land Use Policy 2015, 48, 63–72. [Google Scholar] [CrossRef]
  44. Damptey, F.G.; de la Riva, E.G.; Birkhofer, K. Trade-offs and synergies between food and fodder production and other ecosystem services in an actively restored forest, natural forest and an agroforestry system in Ghana. Front. For. Glob. Chang. 2021, 4, 47. [Google Scholar] [CrossRef]
  45. Damptey, F.G.; Birkhofer, K.; Nsiah, P.K.; de la Riva, E.G. Soil properties and biomass attributes in a former gravel mine area after two decades of forest restoration. Land 2020, 9, 209. [Google Scholar] [CrossRef]
  46. Sharma, S.; MacKenzie, R.A.; Tieng, T.; Soben, K.; Tulyasuwan, N.; Resanond, A.; Blate, G.; Litton, C.M. The impacts of degradation, deforestation and restoration on mangrove ecosystem carbon stocks across Cambodia. Sci. Total Environ. 2020, 706, 135416. [Google Scholar] [CrossRef] [PubMed]
  47. Bernal, B.; Murray, L.T.; Pearson, T.R. Global carbon dioxide removal rates from forest landscape restoration activities. Carbon Balance Manag. 2018, 13, 22. [Google Scholar] [CrossRef] [PubMed]
  48. Aponte, C.; García, L.V.; Marañón, T. Tree species effects on nutrient cycling and soil biota: A feedback mechanism favouring species coexistence. For. Ecol. Manag. 2013, 309, 36–46. [Google Scholar] [CrossRef] [Green Version]
  49. Pérez-Ramos, I.M.; Roumet, C.; Cruz, P.; Blanchard, A.; Autran, P.; Garnier, E. Evidence for a ‘plant community economics spectrum’ driven by nutrient and water limitations in a Mediterranean rangeland of southern France. J. Ecol. 2012, 100, 1315–1327. [Google Scholar] [CrossRef] [Green Version]
  50. Hawthorne, W.D.N.; Gyakari, N. Photoguide for the Forest Trees of Ghana: A Tree-Spotter’s Field Guide for Identifying the Largest Trees; Oxford Forestry Institute—Department of Plant Sciences: Oxford, UK, 2006. [Google Scholar]
  51. Gatti, R.C.; Castaldi, S.; Lindsell, J.A.; Coomes, D.A.; Marchetti, M.; Maesano, M.; Di Paola, A.; Paparella, F.; Valentini, R. The impact of selective logging and clearcutting on forest structure, tree diversity and above-ground biomass of African tropical forests. Ecol. Res. 2015, 30, 119–132. [Google Scholar] [CrossRef]
  52. Chave, J.; Réjou-Méchain, M.; Búrquez, A.; Chidumayo, E.; Colgan, M.S.; Delitti, W.B.; Duque, A.; Eid, T.; Fearnside, P.M.; Goodman, R.C.; et al. Improved allometric models to estimate the aboveground biomass of tropical trees. Glob. Chang. Biol. 2014, 20, 3177–3190. [Google Scholar] [CrossRef]
  53. Zanne, A.E.; Lopez-Gonzalez, G.; Coomes, D.A.; Ilic, J.; Jansen, S.; Lewis, S.L.; Miller, R.B.; Swenson, N.G.; Wiemann, M.C.; Chave, J. Global Wood Density Database. Dryad Digital Repository. 2009. Available online: https://datadryad.org/stash/dataset/doi:10.5061/dryad.234 (accessed on 28 August 2021).
  54. Lewis, S.L.; Sonké, B.; Sunderland, T.; Begne, S.K.; Lopez-Gonzalez, G.; van der Heijden, G.M.; Philips, O.L.; Affum-Baffoe, K.; Baker, T.R.; Banin, L.; et al. Above-ground biomass and structure of 260 African tropical forests. Philos. Trans. R. Soc. B Biol. Sci. 2013, 368, 20120295. [Google Scholar] [CrossRef] [Green Version]
  55. Brockerhoff, E.G.; Barbaro, L.; Castagneyrol, B.; Forrester, D.I.; Gardiner, B.; González-Olabarria, J.R.; Lyver, P.O.; Meurisse, N.; Oxbrough, A.; Taki, H.; et al. Forest biodiversity, ecosystem functioning and the provision of ecosystem services. Biodivers. Conserv. 2017, 26, 3005–3035. [Google Scholar] [CrossRef] [Green Version]
  56. Keuskamp, J.A.; Dingemans, B.J.; Lehtinen, T.; Sarneel, J.M.; Hefting, M.M. Tea Bag Index: A novel approach to collect uniform decomposition data across ecosystems. Methods Ecol. Evol. 2013, 4, 1070–1075. [Google Scholar] [CrossRef]
  57. Kattge, J.; Diaz, S.; Lavorel, S.; Prentice, I.C.; Leadley, P.; Bönisch, G.; Garnier, E.; Westoby, M.; Reich, P.B.; Wright, I.J.; et al. TRY—A global database of plant traits. Glob. Chang. Biol. 2011, 17, 2905–2935. [Google Scholar] [CrossRef]
  58. Rueden, C.T.; Schindelin, J.; Hiner, M.C.; DeZonia, B.E.; Walter, A.E.; Arena, E.T.; Eliceiri, K.W. ImageJ2: ImageJ for the next generation of scientific image data. BMC Bioinform. 2017, 18, 529. [Google Scholar] [CrossRef]
  59. Glozer, K. Protocol for Leaf Image Analysis—Surface Area. 2008. Available online: http://ucanr.edu/sites/fruittree/files/49325.pdf (accessed on 17 September 2021).
  60. Perez-Harguindeguy, N.; Diaz, S.; Garnier, E.; Lavorel, S.; Poorter, H.; Jaureguiberry, P.; Bret-Harte, S.; Cornwell, W.K.; Craine, J.M.; Gurvich, D.E.; et al. Corrigendum to: New handbook for standardised measurement of plant functional traits worldwide. Aust. J. Bot. 2016, 64, 715–716. [Google Scholar] [CrossRef] [Green Version]
  61. Liu, M.; Wang, Z.; Li, S.; Lü, X.; Wang, X.; Han, X. Changes in specific leaf area of dominant plants in temperate grasslands along a 2500-km transect in northern China. Sci. Rep. 2017, 7, 10780. [Google Scholar] [CrossRef] [PubMed]
  62. Prado, J.; Schiavini, I.; Vale, V.; Lopes, S.; Arantes, C.; Oliveira, A.P. Functional leaf traits of understory species: Strategies to different disturbance severities. Braz. J. Biol. 2015, 75, 339–346. [Google Scholar] [CrossRef] [Green Version]
  63. Zhang, J.; He, N.; Liu, C.; Xu, L.; Chen, Z.; Li, Y.; Wang, R.; Yu, G.; Sun, W.; Xiao, C.; et al. Variation and evolution of C:N ratio among different organs enable plants to adapt to N-limited environments. Glob. Chang. Biol. 2020, 26, 2534–2543. [Google Scholar] [CrossRef] [PubMed]
  64. Xu, X.; Yang, G.; Yang, X.; Li, Z.; Feng, H.; Xu, B.; Zhao, X. Monitoring ratio of carbon to nitrogen (C/N) in wheat and barley leaves by using spectral slope features with branch-and-bound algorithm. Sci. Rep. 2018, 8, 10034. [Google Scholar] [CrossRef] [PubMed]
  65. Zou, Y.; Sang, W.; Bai, F.; Brennan, E.; Diekman, M.; Liu, Y.; Li, L.; Marples, A.; Shi, H.; Sui, Z.; et al. Large-scale α-diversity patterns in plants and ground beetles (Coleoptera: Carabidae) indicate a high biodiversity conservation value of China’s restored temperate forest landscapes. Divers. Distrib. 2019, 25, 1613–1624. [Google Scholar] [CrossRef] [Green Version]
  66. Cornelissen, J.H.C.; Lavorel, S.; Garnier, E.; Díaz, S.; Buchmann, N.; Gurvich, D.E.; Reich, P.B.; ter Steege, H.; Morgan, H.D.; van der Heijiden, M.G.A.; et al. A handbook of protocols for standardised and easy measurement of plant functional traits worldwide. Aust. J. Bot. 2003, 51, 335–380. [Google Scholar] [CrossRef] [Green Version]
  67. Moles, A.T.; Westoby, M. Seed size and plant strategy across the whole life cycle. Oikos 2006, 113, 91–105. [Google Scholar] [CrossRef]
  68. Galán Díaz, J.; de la Riva, E.G.; Funk, J.L.; Vilà, M. Functional segregation of resource-use strategies of native and invasive plants across Mediterranean biome communities. Biol. Invasions 2021, 23, 253–266. [Google Scholar] [CrossRef]
  69. Moles, A.T.; Warton, D.I.; Warman, L.; Swenson, N.G.; Laffan, S.W.; Zanne, A.E.; Pitman, A.; Hemmings, F.A.; Leishman, M.R. Global patterns in plant height. J. Ecol. 2009, 97, 923–932. [Google Scholar] [CrossRef]
  70. Larjavaara, M.; Muller-Landau, H.C. Measuring tree height: A quantitative comparison of two common field methods in a moist tropical forest. Methods Ecol. Evol. 2013, 4, 793–801. [Google Scholar] [CrossRef]
  71. Garnier, E.; Cortez, J.; Billès, G.; Navas, M.L.; Roumet, C.; Debussche, M.; Laurent, G.; Blanchard, A.; Aubry, D.; Bellmann, A.; et al. Plant functional markers capture ecosystem properties during secondary succession. Ecology 2004, 85, 2630–2637. [Google Scholar] [CrossRef]
  72. De Bello, F.; Carmona, C.P.; Lepš, J.; Szava-Kovats, R.; Pärtel, M. Functional diversity through the mean trait dissimilarity: Resolving shortcomings with existing paradigms and algorithms. Oecologia 2016, 180, 933–940. [Google Scholar] [CrossRef]
  73. Karadimou, E.K.; Kallimanis, A.S.; Tsiripidis, I.; Dimopoulos, P. Functional diversity exhibits a diverse relationship with area, even a decreasing one. Sci. Rep. 2016, 6, 35420. [Google Scholar] [CrossRef] [Green Version]
  74. Laliberté, E.; Legendre, P. A distance-based framework for measuring from multiple traits functional diversity. Ecology 2010, 91, 299–305. [Google Scholar] [CrossRef]
  75. Villéger, S.; Mason, N.W.; Mouillot, D. New multidimensional functional diversity indices for a multifaceted framework in functional ecology. Ecology 2008, 89, 2290–2301. [Google Scholar] [CrossRef] [Green Version]
  76. Rao, C.R. Diversity and dissimilarity coefficients: A unified approach. Theor. Popul. Biol. 1982, 21, 24–43. [Google Scholar] [CrossRef]
  77. Botta-Dukát, Z. Rao’s quadratic entropy as a measure of functional diversity based on multiple traits. J. Veg. Sci. 2005, 16, 533–540. [Google Scholar] [CrossRef]
  78. Laughlin, D.C. The intrinsic dimensionality of plant traits and its relevance to community assembly. J. Ecol. 2014, 102, 186–193. [Google Scholar] [CrossRef]
  79. Torchiano, M. Effsize: Efficient Effect Size Computation (R Package); R Foundation for Statistical Computing: Vienna, Austria, 2016. [Google Scholar]
  80. Blonder, B. Hypervolume concepts in niche-and trait-based ecology. Ecography 2018, 41, 1441–1455. [Google Scholar] [CrossRef]
  81. Blonder, B.; Nogués-Bravo, D.; Borregaard, M.K.; Donoghue II, J.C.; Jørgensen, P.M.; Kraft, N.J.; Lessard, J.P.; Morueta-Holme, N.; Sandel, B.; Svenning, J.C.; et al. Linking environmental filtering and disequilibrium to biogeography with a community climate framework. Ecology 2015, 96, 972–985. [Google Scholar] [CrossRef] [Green Version]
  82. Grueber, C.E.; Nakagawa, S.; Laws, R.J.; Jamieson, I.G. Multimodel inference in ecology and evolution: Challenges and solutions. J. Evol. Biol. 2011, 24, 699–711. [Google Scholar] [CrossRef]
  83. Barton, K.; Barton, M.K. Package ‘Mumin’; Version 1. 2015. Available online: https://cran.r-project.org/package/MuMIn/MuMIn.pdf (accessed on 17 September 2021).
  84. R Core Team. R: A Language and Environment for Statistical Computing; R Foundation for Statistical Computing: Vienna, Austria, 2019; ISBN 3-900051-07-0. [Google Scholar]
  85. Moir, J.; Jordan, P.; Moot, D.; Lucas, R. Phosphorus response and optimum pH ranges of twelve pasture legumes grown in an acid upland New Zealand soil under glasshouse conditions. J. Soil Sci. Plant Nutr. 2016, 16, 438–460. [Google Scholar] [CrossRef] [Green Version]
  86. Oliveras, I.; Bentley, L.; Fyllas, N.M.; Gvozdevaite, A.; Shenkin, A.F.; Peprah, T.; Morandi, P.; Peixoto, K.S.; Boakye, M.; Adu-Bredu, S.; et al. The influence of taxonomy and environment on leaf trait variation along tropical abiotic gradients. Front. For. Glob. Chang. 2020, 3, 18. [Google Scholar] [CrossRef] [Green Version]
  87. De la Riva, E.G.; Pérez-Ramos, I.M.; Tosto, A.; Navarro-Fernández, C.M.; Olmo, M.; Marañón, T.; Villar, R. Disentangling the relative importance of species occurrence, abundance and intraspecific variability in community assembly: A trait-based approach at the whole-plant level in Mediterranean forests. Oikos 2016, 125, 354–363. [Google Scholar] [CrossRef] [Green Version]
  88. Wright, I.J.; Reich, P.B.; Westoby, M.; Ackerly, D.D.; Baruch, Z.; Bongers, F.; Cavender-Bares, J.; Chapin, T.; Cornelissen, J.H.C.; Diemer, M.; et al. The worldwide leaf economics spectrum. Nature 2004, 428, 821–827. [Google Scholar] [CrossRef] [PubMed]
  89. De la Riva, E.G.; Violle, C.; Pérez-Ramos, I.M.; Marañón, T.; Navarro-Fernández, C.M.; Olmo, M.; Villar, R. A multidimensional functional trait approach reveals the imprint of environmental stress in Mediterranean woody communities. Ecosystems 2018, 21, 248–262. [Google Scholar] [CrossRef] [Green Version]
  90. Gvozdevaite, A.; Oliveras, I.; Domingues, T.F.; Peprah, T.; Boakye, M.; Afriyie, L.; Peixoto, K.S.; de Farias, J.; de Oliveira, E.A.; Farias, C.C.A.; et al. Leaf-level photosynthetic capacity dynamics in relation to soil and foliar nutrients along forest–Savanna boundaries in Ghana and Brazil. Tree Physiol. 2018, 38, 1912–1925. [Google Scholar] [CrossRef] [PubMed]
  91. Neyret, M.; Bentley, L.P.; Oliveras, I.; Marimon, B.S.; Marimon-Junior, B.H.; Almeida de Oliveira, E.; Passos, F.B.; Ccoscco, R.C.; dos Santos, J.; Reis, S.M.; et al. Examining variation in the leaf mass per area of dominant species across two contrasting tropical gradients in light of community assembly. Ecol. Evol. 2016, 6, 5674–5689. [Google Scholar] [CrossRef] [Green Version]
  92. Sterck, F.; Markesteijn, L.; Schieving, F.; Poorter, L. Functional traits determine trade-offs and niches in a tropical forest community. Proc. Natl. Acad. Sci. USA 2011, 108, 20627–20632. [Google Scholar] [CrossRef] [PubMed] [Green Version]
  93. Cornelissen, J.H.C. A triangular relationship between leaf size and seed size among woody species: Allometry, ontogeny, ecology and taxonomy. Oecologia 1999, 118, 248–255. [Google Scholar] [CrossRef]
  94. Pérez-Ramos, I.M.; Gómez-Aparicio, L.; Villar, R.; García, L.V.; Maranon, T. Seedling growth and morphology of three oak species along field resource gradients and seed mass variation: A seedling age-dependent response. J. Veg. Sci. 2010, 21, 419–437. [Google Scholar] [CrossRef] [Green Version]
  95. Quero, J.L.; Villar, R.; Marañón, T.; Zamora, R.; Poorter, L. Seed-mass effects in four Mediterranean Quercus species (Fagaceae) growing in contrasting light environments. Am. J. Bot. 2007, 94, 1795–1803. [Google Scholar] [CrossRef] [Green Version]
  96. Moles, A.T.; Falster, D.S.; Leishman, M.R.; Westoby, M. Small-seeded species produce more seeds per square metre of canopy per year, but not per individual per lifetime. J. Ecol. 2004, 92, 384–396. [Google Scholar] [CrossRef]
  97. Moles, A.T.; Westoby, M. Seedling survival and seed size: A synthesis of the literature. J. Ecol. 2004, 92, 372–383. [Google Scholar] [CrossRef]
  98. Wright, S.J.; Stoner, K.E.; Beckman, N.; Corlett, R.T.; Dirzo, R.; Muller-Landau, H.C.; Nunez-Iturri, G.; Peres, C.A.; Wang, B.C. The plight of large animals in tropical forests and the consequences for plant regeneration. Biotropica 2007, 39, 289–291. [Google Scholar] [CrossRef]
  99. Opuni-Frimpong, E.; Gabienu, E.; Adusu, D.; Opuni-Frimpong, N.Y.; Damptey, F.G. Plant diversity, conservation significance, and community structure of two protected areas under different governance. Trees For. People 2021, 4, 100082. [Google Scholar] [CrossRef]
  100. Padmakumar, B.; Sreekanth, N.P.; Shanthiprabha, V.; Paul, J.; Sreedharan, K.; Augustine, T.; Jayasooryan, K.K.; Rameshan, M.; Mohan, M.; Ramasamy, E.V.; et al. Tree biomass and carbon density estimation in the tropical dry forest of Southern Western Ghats, India. iForest-Biogeosci. For. 2018, 11, 534. [Google Scholar] [CrossRef] [Green Version]
  101. Schuldt, A.; Ebeling, A.; Kunz, M.; Staab, M.; Guimarães-Steinicke, C.; Bachmann, D.; Buchmann, N.; Durka, W.; Fichtner, A.; Fornoff, F.; et al. Multiple plant diversity components drive consumer communities across ecosystems. Nat. Commun. 2019, 10, 65. [Google Scholar] [CrossRef] [PubMed] [Green Version]
  102. Wenninger, E.J.; Inouye, R.S. Insect community response to plant diversity and productivity in a sagebrush–steppe ecosystem. J. Arid Environ. 2008, 72, 24–33. [Google Scholar] [CrossRef]
  103. McColloch, J.W. The reciprocal relation of soil and insects. Ecology 1922, 3, 288–301. [Google Scholar] [CrossRef]
  104. Gunstone, T.; Cornelisse, T.; Klein, K.; Dubey, A.; Donley, N. Pesticides and Soil Invertebrates: A Hazard Assessment. Front. Environ. Sci. 2021, 9, 122. [Google Scholar] [CrossRef]
  105. Amprako, L.; Stenchly, K.; Wiehle, M.; Nyarko, G.; Buerkert, A. Arthropod Communities in Urban Agricultural Production Systems under Different Irrigation Sources in the Northern Region of Ghana. Insects 2020, 11, 488. [Google Scholar] [CrossRef]
  106. Raven, P.H.; Wagner, D.L. Agricultural intensification and climate change are rapidly decreasing insect biodiversity. Proc. Natl. Acad. Sci. USA 2021, 118, e2002548117. [Google Scholar] [CrossRef]
  107. Zhao, Z.H.; Hui, C.; He, D.H.; Li, B.L. Effects of agricultural intensification on ability of natural enemies to control aphids. Sci. Rep. 2015, 5, 8024. [Google Scholar] [CrossRef] [Green Version]
  108. Schjoerring, J.K.; Cakmak, I.; White, P.J. Plant nutrition and soil fertility: Synergies for acquiring global green growth and sustainable development. Plant Soil 2019, 434, 1–6. [Google Scholar] [CrossRef] [Green Version]
  109. Chatzistathis, T.; Therios, I. How soil nutrient availability influences plant biomass and how biomass stimulation alleviates heavy metal toxicity in soils: The cases of nutrient use efficient genotypes and phytoremediators, respectively. In Biomass Now-Cultivation and Utilization; Matovic, D.M., Ed.; IntechOpen: Rijeka, Croatia, 2013; pp. 427–448. [Google Scholar]
  110. Måren, I.E.; Sharma, L.N. Seeing the wood for the trees: Carbon storage and conservation in temperate forests of the Himalayas. For. Ecol. Manag. 2021, 487, 119010. [Google Scholar] [CrossRef]
  111. Kothandaraman, S.; Dar, J.A.; Sundarapandian, S.; Dayanandan, S.; Khan, M.L. Ecosystem-level carbon storage and its links to diversity, structural and environmental drivers in tropical forests of Western Ghats, India. Sci. Rep. 2020, 10, 13444. [Google Scholar] [CrossRef] [PubMed]
  112. Liu, C.L.; Kuchma, O.; Krutovsky, K.V. Mixed-species versus monocultures in plantation forestry: Development, benefits, ecosystem services and perspectives for the future. Glob. Ecol. Conserv. 2018, 1, e00419. [Google Scholar] [CrossRef]
  113. Heilpern, S.A.; Anujan, K.; Osuri, A.; Naeem, S. Positive correlations in species functional contributions drive the response of multifunctionality to biodiversity loss. Proc. R. Soc. B 2020, 287, 20192501. [Google Scholar] [CrossRef]
  114. Zirbel, C.R.; Bassett, T.; Grman, E.; Brudvig, L.A. Plant functional traits and environmental conditions shape community assembly and ecosystem functioning during restoration. J. Appl. Ecol. 2017, 54, 1070–1079. [Google Scholar] [CrossRef] [Green Version]
  115. Manning, P.; van der Plas, F.; Soliveres, S.; Allan, E.; Maestre, F.T.; Mace, G.; Whittingham, M.J.; Fischer, M. Redefining ecosystem multifunctionality. Nat. Ecol. Evol. 2018, 2, 427–436. [Google Scholar] [CrossRef]
  116. Shen, Y.; Yu, S.; Lian, J.; Shen, H.; Cao, H.; Lu, H.; Ye, W. Tree aboveground carbon storage correlates with environmental gradients and functional diversity in a tropical forest. Sci. Rep. 2016, 6, 25304. [Google Scholar] [CrossRef] [Green Version]
  117. Cavanaugh, K.C.; Gosnell, J.S.; Davis, S.L.; Ahumada, J.; Boundja, P.; Clark, D.B.; Mugerwa, B.; Jansen, P.A.; O’Brien, T.G.; Rovero, F.; et al. Carbon storage in tropical forests correlates with taxonomic diversity and functional dominance on a global scale. Glob. Ecol. Biogeogr. 2014, 23, 563–573. [Google Scholar] [CrossRef]
  118. Mensah, S.; Veldtman, R.; Assogbadjo, A.E.; Glèlè Kakaï, R.; Seifert, T. Tree species diversity promotes aboveground carbon storage through functional diversity and functional dominance. Ecol. Evol. 2016, 6, 7546–7557. [Google Scholar] [CrossRef]
  119. Tilman, D.; Isbell, F.; Cowles, J.M. Biodiversity and ecosystem functioning. Annu. Rev. Ecol. Evol. Syst. 2014, 45, 471–493. [Google Scholar] [CrossRef]
  120. Campos, R.I.; Vasconcelos, H.L.; Ribeiro, S.P.; Neves, F.S.; Soares, J.P. Relationship between tree size and insect assemblages associated with Anadenanthera macrocarpa. Ecography 2006, 29, 442–450. [Google Scholar] [CrossRef]
  121. Marques, E.S.D.A.; Price, P.W.; Cobb, N.S. Resource abundance and insect herbivore diversity on woody fabaceous desert plants. Environ. Entomol. 2000, 29, 696–703. [Google Scholar] [CrossRef] [Green Version]
  122. Damptey, F.G.; Frimpong, B.F.; Debrah, D.K.; Agro, P.P.; Wiafe, E.D. Vegetation attributes drive the taxonomic richness and functional composition of beetles and spiders in mountainous urban green spaces. Energy Ecol. Environ. 2022, 7, 1–13. [Google Scholar] [CrossRef]
  123. Wein, A.; Bauhus, J.; Bilodeau-Gauthier, S.; Scherer-Lorenzen, M.; Nock, C.; Staab, M. Tree species richness promotes invertebrate herbivory on congeneric native and exotic tree saplings in a young diversity experiment. PLoS ONE 2016, 11, e0168751. [Google Scholar] [CrossRef] [PubMed] [Green Version]
  124. Goulnik, J.; Plantureux, S.; Thery, M.; Baude, M.; Delattre, M.; van Reeth, C.; Villerd, J.; Michelot-Antalik, A. Floral trait functional diversity is related to soil characteristics and positively influences pollination function in semi-natural grasslands. Agric. Ecosyst. Environ. 2020, 301, 107033. [Google Scholar] [CrossRef]
  125. Cadotte, M.W.; Carscadden, K.; Mirotchnick, N. Beyond species: Functional diversity and the maintenance of ecological processes and services. J. Appl. Ecol. 2011, 48, 1079–1087. [Google Scholar] [CrossRef]
  126. Ola, A.; Lovelock, C.E. Decomposition of mangrove roots depends on the bulk density they grew in. Plant Soil 2021, 460, 177–187. [Google Scholar] [CrossRef]
  127. Nosalewicz, A.; Lipiec, J. The effect of compacted soil layers on vertical root distribution and water uptake by wheat. Plant Soil 2014, 375, 229–240. [Google Scholar] [CrossRef]
  128. Kozlowski, T.T. Soil compaction and growth of woody plants. Scand. J. For. Res. 1999, 14, 596–619. [Google Scholar] [CrossRef]
  129. Blakely, J.K.; Neher, D.A.; Spongberg, A.L. Soil invertebrate and microbial communities, and decomposition as indicators of polycyclic aromatic hydrocarbon contamination. Appl. Soil Ecol. 2002, 21, 71–88. [Google Scholar] [CrossRef]
  130. Dissanayaka, D.M.; Dhananjaya, V.P.; Kosgollegedara, E.J.; Karthigayini, S. Impact of Improved Aeration on Decomposition Rate of Enriched Compost. Int. J. Trend Sci. Res. Dev. 2021, 5, 852–857. [Google Scholar]
  131. Ola, A.; Gauthier, A.R.; Xiong, Y.; Lovelock, C.E. The roots of blue carbon: Responses of mangrove stilt roots to variation in soil bulk density. Biol. Lett. 2019, 15, 20180866. [Google Scholar] [CrossRef] [PubMed] [Green Version]
  132. Herrick, J.E.; Lal, R. Soil physical property changes during dung decomposition in a tropical pasture. Soil Sci. Soc. Am. J. 1995, 59, 908–912. [Google Scholar] [CrossRef]
  133. Mensah, S.; van der Plas, F.; Noulèkoun, F. Do functional identity and divergence promote aboveground carbon differently in tropical semi-arid forests and savannas? Ecosphere 2021, 12, e03563. [Google Scholar] [CrossRef]
  134. Le Bagousse-Pinguet, Y.; Soliveres, S.; Gross, N.; Torices, R.; Berdugo, M.; Maestre, F.T. Phylogenetic, functional, and taxonomic richness have both positive and negative effects on ecosystem multifunctionality. Proc. Natl. Acad. Sci. USA 2019, 116, 8419–8424. [Google Scholar] [CrossRef] [Green Version]
  135. Grman, E.; Zirbel, C.R.; Bassett, T.; Brudvig, L.A. Ecosystem multifunctionality increases with beta diversity in restored prairies. Oecologia 2018, 188, 837–848. [Google Scholar] [CrossRef]
  136. The Plant List. Version 1.1. 2013. Available online: http://www.theplantlist.org/ (accessed on 1 January 2022).
Figure 1. Map of the study region with the various ecosystem types. (A) Africa, (B) Ghana and (C) Bono regionThe RF located in Terchire (7°14′4.78″ N, 2°10′49.88″ W) is a post mine area that has been actively restored with both indigenous and exotic tree species (e.g., Morinda lucida Benth, Terminalia suberba Engl. & Diels, Albizia zygia (DC.) J. F. Machr., Cedrela odorata L., Mangifera indica L.) after soil improvement to provide essential ecosystem goods and services to society. On the other hand, AF (7°6′20.76″ N, 2°15′22.64″ W) is a forest reserve experiencing massive degradation. Because of its degraded nature, it has been subjected to agroforestry programs (food crops interplant with trees) to supply both food and energy needs as well as environmental benefits to fringe communities. In contrast, NF (7°9′13.72″ N, 2°31′4.96″ W) is a protected forest reserve under strict restrictions against anthropogenic activities [44].
Forests 13 00297 g001
Figure 2. Mean effect size (Hedges’d) and bias-corrected 95% bootstrap confidence intervals for differences between the ecosystem types for each PC dimension of the functional composition and soil parameters (see Table 2).
Forests 13 00297 g002
Figure 3. Estimated three-dimensional hypervolumes for the three ecosystem types (see Table 2). Each plant dimension was based on the first PCA axis of the different attributes belonging to soil properties (A) and functional trait (B) dimensions. Overlap among each type of ecosystem based on the Sørensen similarity index is shown.
Forests 13 00297 g003
Figure 4. Relationship between ecosystem multifunctionality and functional richness per site (natural forest in red, restored forest in green and agroforestry system in blue). The shaded area shows 95% confidence intervals.
Forests 13 00297 g004
Table 2. Variance partitioning of trait attributes for the three ecosystem types.
Soil PropertiesSource of Variance
PC1PC2PC3
pH4.061.07.0
N50.014.023.0
P15.062.015.0
K55.02.04.0
Na47.014.08.0
Mg14.017.038.0
SOC42.021.049.0
BD4.037.072.0
% variance32.322.914.8
Functional composition
SLA53.024.012.0
SDMC2.064.044.0
Seed mass46.033.033.0
C:N37.056.023.0
δ13C52.030.036.0
Plant height29.013.071.0
% variance34.320.716.7
Ecosystem service proxies
Carbon stock10.078.046.0
Predator no.68.027.026.0
Decomposer no.72.013.020.0
Decomposition rate2.055.083.0
% variance39.730.323.0
Table 3. Summary of the best-fitted models analysing ecosystem services in response to functional structure (composition and diversity) and soil factors. AICc = Akaike information criterion for small samples; ΔAICc = difference between the AICc of a null model and the best model (ΔAIC < 2 in all cases).
Ecosystem ServicesFactorsRelationR2AICcΔAICc
Invertebrate
activity
Null Model
Site+Frich

+

0.52
80.36
71.42

0.00
Carbon stock

Null Model
Site+Frich

+

0.58
72.28
60.94

0.00
Decomposition
Rate
Null Model
Soil BD

-

0.24
67.97
64.38

0.00
Multifunctionality

Null Model
Site+Frich

+

0.47
10.57
3.82

0.00
Publisher’s Note: MDPI stays neutral with regard to jurisdictional claims in published maps and institutional affiliations.

