Article

Investigations of the Chemical Distribution in Sorbitol and Citric Acid (SorCA) Treated Wood—Development of a Quality Control Method on the Basis of Electromagnetic Radiation

Wood Biology and Wood Products, University of Goettingen, Buesgenweg 4, 37077 Goettingen, Germany
*
Author to whom correspondence should be addressed.
Forests 2022, 13(2), 151; https://doi.org/10.3390/f13020151
Submission received: 23 December 2021 / Revised: 12 January 2022 / Accepted: 18 January 2022 / Published: 20 January 2022

Abstract

:
Recent studies showed treatments with sorbitol and citric acid (SorCA) to significantly improve the dimensional stability and biological durability of wood. The industrialization of this process requires a quality control (QC) method to determine if the fixated chemicals are homogenously distributed within the piece of wood, which is essential for uniform material performance. Therefore, the objective of this work was to evaluate the use of common electromagnetic radiation-based methods to determine the degree of modification in SorCA-treated wood. Both Fourier transform infrared (FTIR) spectroscopy and near-infrared (NIR) spectroscopy have been used to create rough calibrations for the weight percent gain (WPG) prediction models. The FTIR measurements resulted in a high linear correlation between the band area ratio (BAR) and the WPG (R2 = 0.93). Additionally, a partial least square (PLS) regression of NIR spectroscopic data resulted in a model with a high prediction power (R2 = 0.83). Furthermore, X-ray density profiling emerged as a simple alternative for the QC by showing a gradient of modification chemicals inside the sample and differences in chemical uptake between earlywood and latewood. Overall, it can be concluded that the results from FTIR, NIR and X-ray densitometry can serve as indicators of impregnation chemical distribution in SorCA-modified wood.

1. Introduction

Chemical wood modification based on citric acid (CA) and polyols has recently emerged as a promising alternative to existing wood modification methods [1,2,3], such as acetylation and furfurylation. Sorbitol, one of the studied polyols, is a common humectant and sweetener [4], whereas CA is primarily used as a natural preservative and flavour enhancer in food and beverages [5]. Their commercial production utilizes modern biotechnological approaches based on feedstock such as corn starch [6], beet and sugarcane molasses [7]. In previous studies, wood treatment with sorbitol and CA (SorCA) resulted in improved dimensional stability [3,8] and biological durability [9,10,11]. Therefore, considering the affordability of impregnation chemicals, an absence of toxic and odorous gases during the production and service life of the product, as well as general requirements regarding the impregnation facilities, SorCA-wood modification has commercialization potential.
Along with the expansion of the modified wood and wood products sector, the necessity of developing adequate quality control (QC) methods has become inevitable. Otherwise, inhomogeneously treated material easily deteriorates upon outdoor exposure. Such methods should allow rapid, cost-efficient and accurate analysis. However, since each type of treatment results in different changes of the chemical wood structure, the QC methods are process-specific, and performing them interchangeably between different treatments is not always feasible. Currently, the largest chemical modification process running on an industrial scale is acetylation [12], commercially available under the trade name ACCOYA. Since acetylation is a single addition reaction, the modification efficiency can be precisely determined by measuring the content of acetyl groups via HPLC with a prior saponification or roughly estimated based on the peak absorbance ratios obtained from FTIR spectra [13]. However, the mode of action of SorCA is more complex, as there are many ways in which esters can be formed in wood. One of them is a single covalent bond formation between CA and wood polymers, which, under favourable conditions (right molar ratio, curing temperature), might lead to cross-linking, where two wood polymer chains are linked via SorCA esters. It has not been verified which wood components participate in the reaction, but a rough determination of wood structural polymers indicated hemicellulose as a primary reactant based on the highest relative increase in mass after the wood polymers separation procedure [14]. On the other hand, CA can in situ condensate with sorbitol and act just as a bulking agent without reacting with wood polymers. Overall, these reactions result in an increased amount of ester bonds in the wood structure. Their analysis by traditional wet-chemistry methods, besides being laborious and expensive, has not been successfully performed yet for solid materials such as wood. Therefore, spectroscopic methods, such as near-IR and mid-IR or X-ray densitometry, appear as affordable, user-friendly alternatives and are hence presently considered.
NIR spectroscopy has been recently recognized as a powerful technique for the assessment of trees, wood and wood-based products. It has been extensively used to characterize their chemical composition, e.g., cellulose [15], lignin [16] and extractive content [17,18]. It has also been shown to be a useful tool for estimating the acetyl group content in acetylated wood [19,20]. Moreover, properties such as moisture content (MC) [21], density [22,23,24] and mechanical behaviour [25,26] have been investigated. In principle, NIR spectra consist of overtones and combination bands, which result from the absorption of near-IR light by molecules with specific vibrational frequencies [27]. A light scattering effect introduces non-linearities and baseline shift to spectra, which require pre-processing prior to multivariate analysis [28]. On the industrial scale, the NIR in-line system is used to measure the polyphenol content of oak wood in the production of wine barrels [29]. Moreover, Stefke et al. [20] showed NIR as a great opportunity for an online QC method of acetylated wood due to the need for minimal sample preparation and a high prediction value of both weight percent gain (WPG) and acetyl content. Recently, the development of miniaturized, portable NIR equipment has appeared as a promising solution for online QC monitoring [30]. Additionally, since in-line measurements accurately predicted the mass loss of wood after a thermal treatment [26], the NIR spectroscopy seems to be the future of QC in the wood sector.
On the other hand, when the presence of a certain chemical has to be rapidly determined, middle-IR spectroscopy provides immediate results, especially if carbonyl groups are of interest (as in the case of SorCA treatment). Since mid-IR radiation bears less energy than near-IR, it results in a smaller penetration depth; hence, light scattering and related effects may be minimized. This enables reading meaningful information directly from the spectra without cumbersome pre-processing. In this research, we have decided to use ATR-FTIR (attenuated total reflection Fourier-transform infrared) spectroscopy, which is based on the total internal reflectance [31] and thus allows for measurement with minimal sample preparation. The measurement technique is based on the presence of particular chemical bonds, which vibrate if the frequency of the fundamental molecular vibration correlates with the frequency of the IR radiation [32]. It has been successfully used to distinguish between wood species and their geographical origin [33], detect the growth of decay fungi and mould in wood [34] or establish a relationship between extractive content and the natural durability of wood [35].
Radiation densitometry based on the β-ray or X-ray systems is a well-known method that has been used for over 50 years to assess the density characteristics of wood [36]. The technological progress over the years has resulted in a rapid, fully automatized determination of wood’s structural integrity [37,38] and distribution of modification chemicals [39] in wood and wood-based composites by X-ray density profiling. The measurements are done at high resolution, and no sample preparation is required. The X-ray radiation penetrates the specimen, and the transmitted radiation is registered by a detector. Using the transmission values and the gravimetric weight/density, the density profiler can calculate the density distribution over the plane. X-ray density profiling was previously used to model the vertical density profile formation in wood composites during the pressing processes [40] or to evaluate the effectiveness of different wood modifications [38,41]. Therefore, in light of the past successful integrations of X-ray density profiling in data modelling and evaluation, the application in QC of modified wood is of high interest.
Despite attracting much attention, no one has suggested a QC method for sorbitol and citric acid modified wood or, in that regard, any CA-based modified wood in general. Thus, the aim of this study was to establish whether NIR, FTIR and X-ray densitometry can be used to determine the WPG, which can serve as a rapid distribution indicator for QC. Therefore, the prediction models were developed based on linear regression, PLS regression and statistical multiple integration modelling. The chances for online industrial applications have been discussed based on the model performance and difficulties encountered upon measurement conduction and data analysis.

2. Materials and Methods

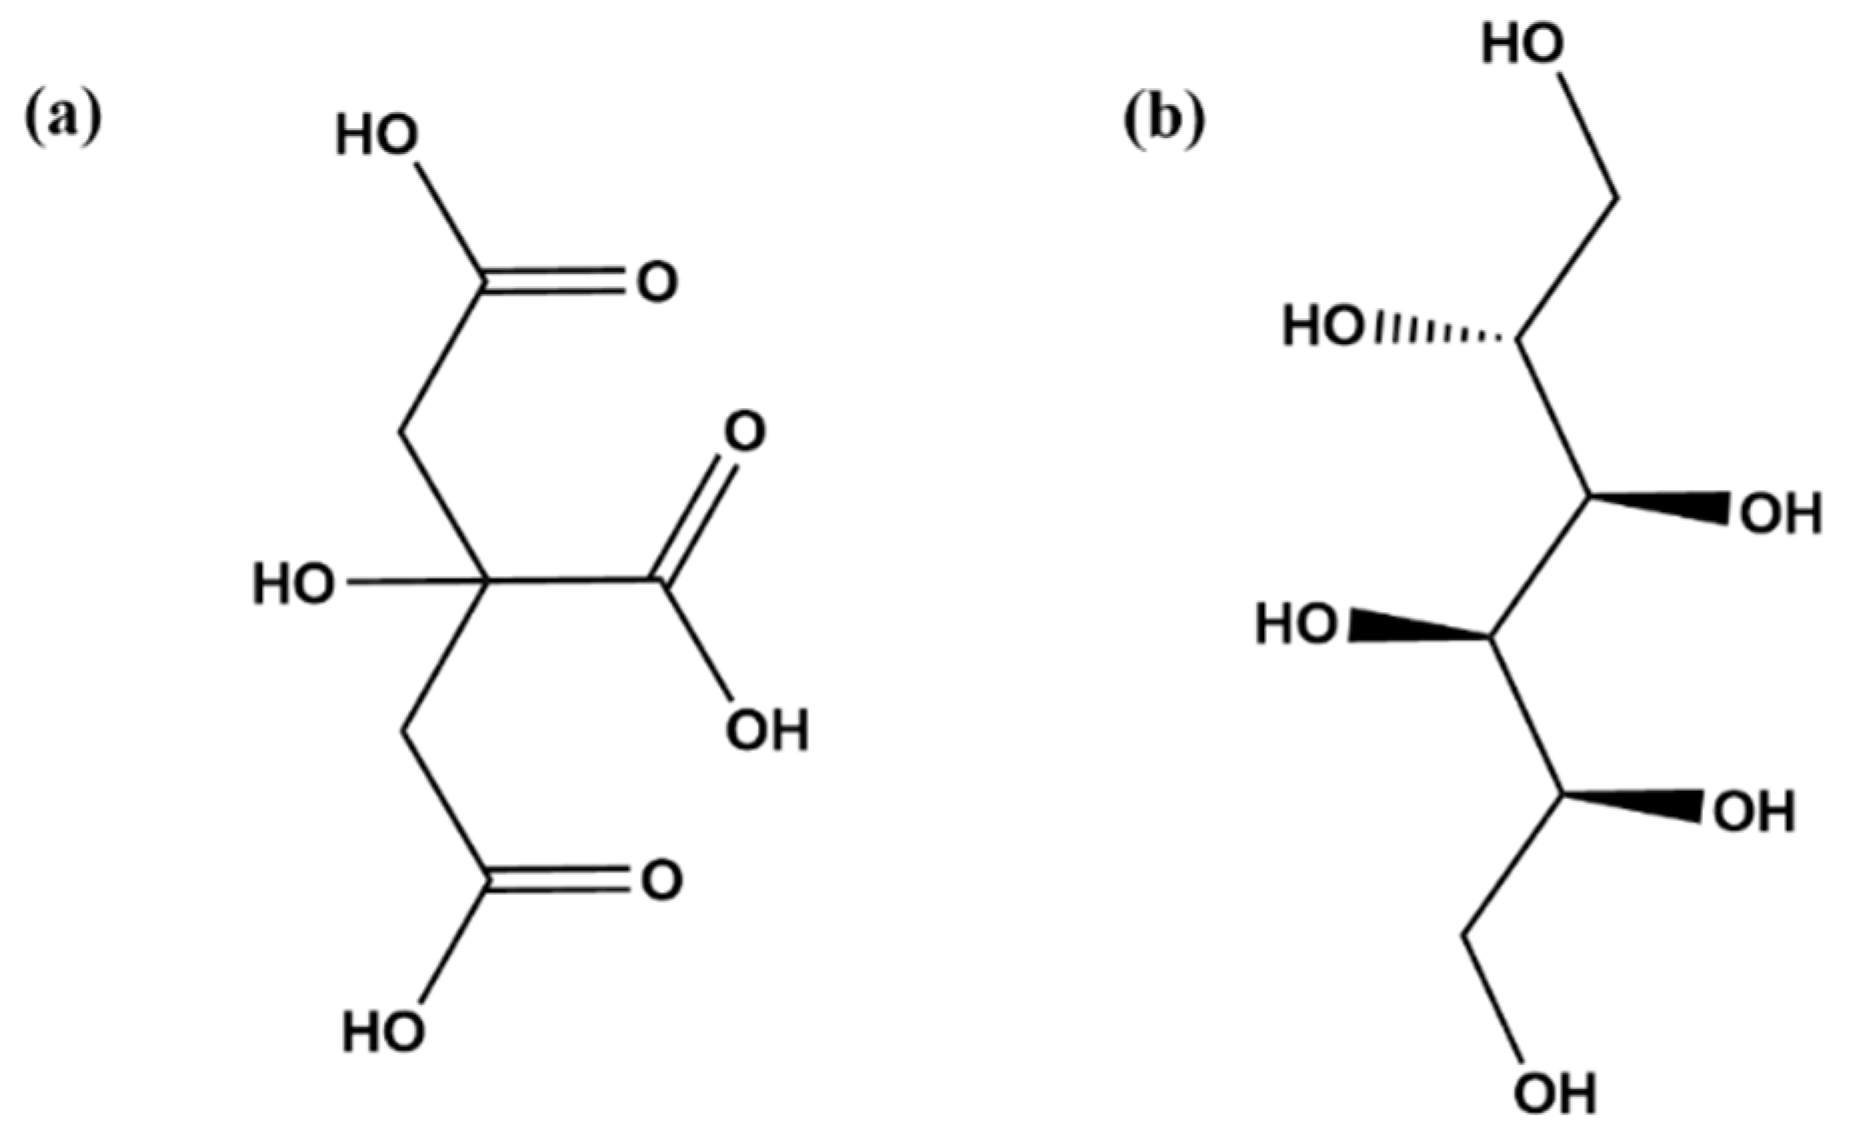
2.1. Materials and Wood Modification Process

The specimens used in this study were cut from technically dried boards of Scots pine sapwood (Pinus sylvestris L.) from sustainably managed forests in northern Germany. All tested specimens had dimensions of 50 × 50 × 50 mm3 and annual ring orientation parallel to the specimen’s edges.
Food-grade CA monohydrate (approx. 97% purity, Figure 1a) was purchased from BÜFA Chemikalien GmbH & Co. KG (Oldenburg, Germany), and technical grade sorbitol (pprox. 98% purity, Figure 1b) was purchased from Ecogreen Oleochemicals GmbH (Dessau-Roßlau, Germany).
Prior to the treatment, all specimens were dried in the following steps: 40 °C (48 h), 60 °C (24 h), 80 °C (24 h) and 103 °C (24 h) to determine the initial oven-dry mass and dimensions (MC = 0%). The oven-dried specimens (5 per treatment level) were impregnated in an autoclave under vacuum conditions (0.98 bar, 1 h), followed by an over-pressure phase (1200 kPa, 3 h). The aqueous impregnation solution of sorbitol and citric acid (SorCA) at a molar ratio of 1:3 was prepared at 2.5% solid content intervals between 2.5 and 50%. Impregnated specimens and untreated controls were dried at room temperature for 168 h, followed by step-wise drying at 40 °C (24 h), 60 °C (24 h), 80 °C (24 h), 103 °C (24 h) and dry-curing at 140 °C (24 h).
Weight percent gain (WPG, in %) and cell wall bulking (CWB, in %) were calculated based on the oven-dry weights and cross-sectional dimensions before (M1, A1) and after treatment (M2, A2) according to Equations (1) and (2). Additionally, pH values of the impregnation solutions at room temperature were measured with a pH meter (WTW InoLab pH Level 2, Xylem Analytics Germany Sales GmbH & Co. KG, Weilheim, Germany), equipped with a WTW SenTix 81 electrode from the same manufacturer.
W P G = ( M 2 M 1 M 1 ) · 100
C W B = ( A 2 A 1 A 1 ) · 100

2.2. ATR-FTIR Measurements and Data Processing

Fourier-transform infrared (FTIR) spectra were recorded with the Alpha spectrometer (Bruker, Germany) equipped with the attenuated total reflection (ATR) unit in a range of 4000–400 cm−1 at a spectral resolution of 4 cm−1 and 64 scans per sample. All samples were oven-dried at 80 °C for 24 h to avoid water band interference and kept in a desiccator for 1 h to cool down prior to the measurement. At least three absorption spectra from three different points per specimen (one from each collective) were collected for one treatment level to ensure sufficient contact between the sample and ATR crystal. The corners of the specimen were cut; hence, the measurement surface was located up to 1 cm deep inside the sample. Background spectra were collected using an empty ATR unit.
The wood spectra were baseline-corrected using the rubber-band method in the OPUS 7.5 software (Bruker, Germany) and normalized (0, 1 normalization) in the OriginPro 8.5 software.
The calculation of the baseline-corrected band heights (maximum value in the range) and band areas (area under the curve in the selected range) in the wavenumber ranges between 177–689 cm−1 and 1186–1138 cm−1 and 1139–914 cm−1 have been performed in the OriginPro 8.5 software. The area or height of the first two bands was divided by the latter one, giving the band area ratio (BAR) and the band height ratio (BHR) for all treatment levels. Subsequently, a linear regression model of those ratios has been constructed in RStudio version 4.0.3.

2.3. NIR Measurements and Data Processing

Near-infrared measurements are highly sensitive to the moisture content (MC) of the test material [18]. Thus, all samples (50 × 50 × 50 mm3) were oven-dried (103 °C, 24 h) before the measurement and kept in a desiccator over silica gel. NIR spectra were recorded using a PSS 1720 spectrometer (Polytec GmbH, Waldbronn, Germany). From each measurement point (19 mm diameter, including both early- and latewood in the radial plane), 10 scans were collected at a spectral resolution of 8 cm−1 in a diffuse reflection mode, i.e., light penetrated the sample, scattered within it and returned to the surface, where the absorption was calculated based on a diffused reflection. The scans were averaged and saved as the absorbance log(1/R) in the laboratory software PSS-S-AXC 1.7 (Polytec GmbH, Waldbronn, Germany). The spectral range used for the measurements was 850–1650 nm, which was the maximum wavelength range allowed by the spectrometer.
Each treatment level had five replicates, and each replicate was measured in the six corresponding positions, with three in the radial section and three in the tangential section (Figure 2), resulting in the electromagnetic radiation going through the tangential and radial axes, respectively.
Spectral data (312 spectra) were split randomly into two subsets: (1) a calibration set for training and a ten-fold cross-validation set (comprised of 75% of the spectral data) and (2) a test set for prediction of the model performance (25% of all spectra).
Python’s scikit-learn library [42] was used to analyse the spectra, applying three standard pre-processing methods and comparing their absorption bands detectability and model performance before building partial least-square regression (PLS-R) models. The following pre-treatments were used: second derivative (17-point filter and a second-order polynomial using the Savitzky–Golay (S-G) algorithm [43]), multiplicative scatter correction (MSC) and standard vector normalization (SNV). The PLS rank was established based on the mean square error (MSE) of the calibration and the cross-validation (CV) set.

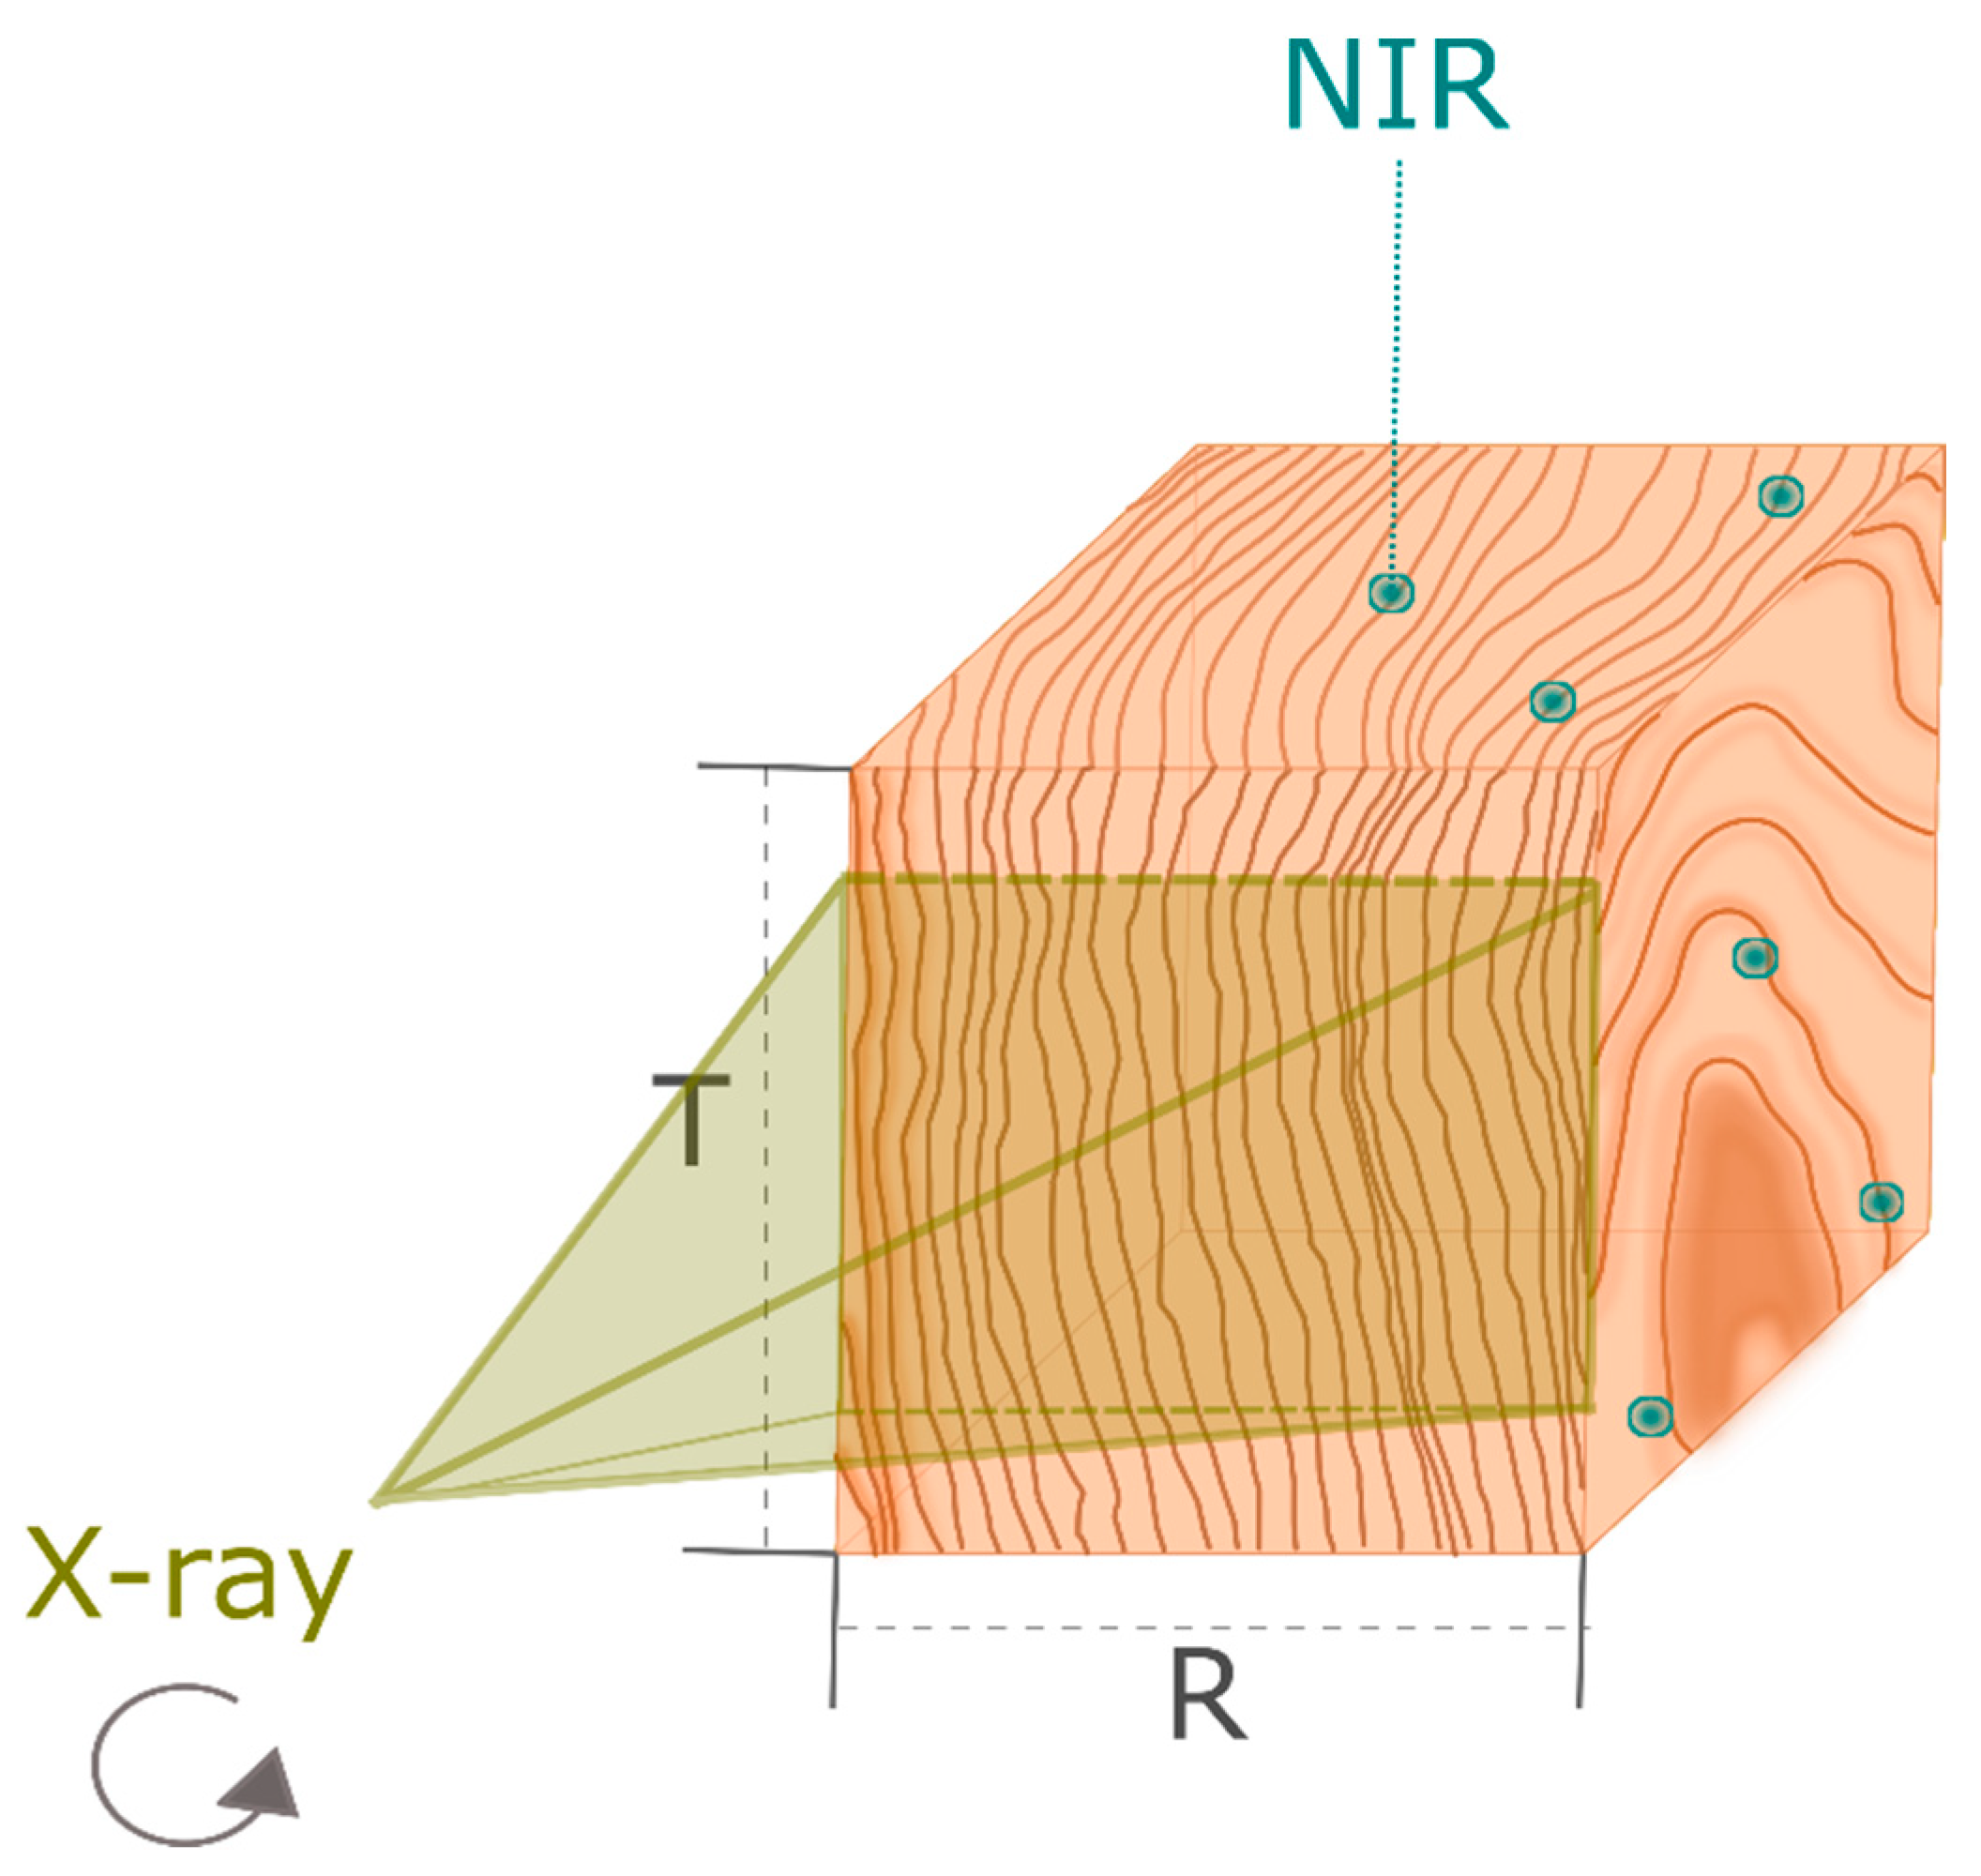
2.4. X-ray Density Profiling and Data Processing

A DAX 6000 X-ray densitometer (GreCon GmbH, Alfeld, Germany) was used to measure the density profiles of all samples prior to and after impregnation. All samples (50 × 50 × 50 mm3) were oven-dried at 103 °C for 24 h before each measurement. The specimens were inserted in the machine in a way that the X-ray ran longitudinally through the sample, and the density profile was displayed in the radial direction (Figure 2). The X-ray is not a beam but rather a plane with a vertical height of 35 mm and a width of 100 µm. The density value is a mean value over this vertical plane. The density was recorded at a resolution (measuring intervals) of 0.05 mm and using a voltage of 33 kV.
Preliminary tests were conducted to identify the homogeneity of the SorCA distribution in the radial direction of the samples. It became evident that for every treatment, the specimens showed a higher amount of chemicals nearer to the surfaces of the specimens than in the middle. To verify this observation, one randomly selected specimen of every treatment was turned 90° and the density profile was measured in the longitudinal direction.
Because of the high correlation between the overall WPG and the WPG of peaks and dips, no further transformation of the model was needed, and a simple projection was sufficient.
To be able to project the graph of the untreated specimens to the treated specimens, the following graphical and mathematical analysis steps were conducted. At first, the graphs of the non-treated and treated specimens were merged. Afterward, the overexposed regions on the edges were subtracted from the treated graph. Additionally, the bulking effect was considered by transforming the untreated graph by the bulking factor (the ratio of specimen’s oven-dry dimensions before and after curing) of the radial axis.
To calculate the virtual weight percent gain (vWPG), the following formula was used:
v W P G = W P G × ( T r e a t ÷ T r e a t C u t )
This vWPG was then used to project the graph of the untreated sample.

3. Results and Discussion

3.1. Modification Efficiency

Weight percent gain (WPG) and cell wall bulking (CWB) are two parameters which can serve as tools to reflect the efficiency of the wood modification process. WPG corresponds to the amount of chemicals deposited inside the wood structure, whereas CWB indicates the cell wall penetration of the impregnation chemicals. Therefore, wood specimens have been treated with 20 different concentrations of an aqueous SorCA solution and their WPG after curing has been measured and shown in Table 1. The heat-treated reference was included in the trial to eliminate the influence of the curing temperature (140 °C) on the wood structural polymers. However, this collective had to be excluded upon the prediction model development since it was recognized as an outlier and significantly worsened the prediction power. Moreover, it has to be noted that the given WPG values are the averaged, global values for the specimens in each collective, but they do not consider the distribution of chemicals within the sample. Therefore, local WPGs may differ for inhomogeneously modified material.
A positive correlation has been found between the solid content of the impregnation solution and both WPG and CBW. The negative values of heat-treated control resulted from the degradation of wood polymer constituents at elevated temperatures. The high acidity of the impregnation solution, especially for the specimens treated at higher solid content levels (pH values as low as 0.81), may have interfered with the reaction and/or caused the excessive deterioration of wood polymers, mainly hemicelluloses.

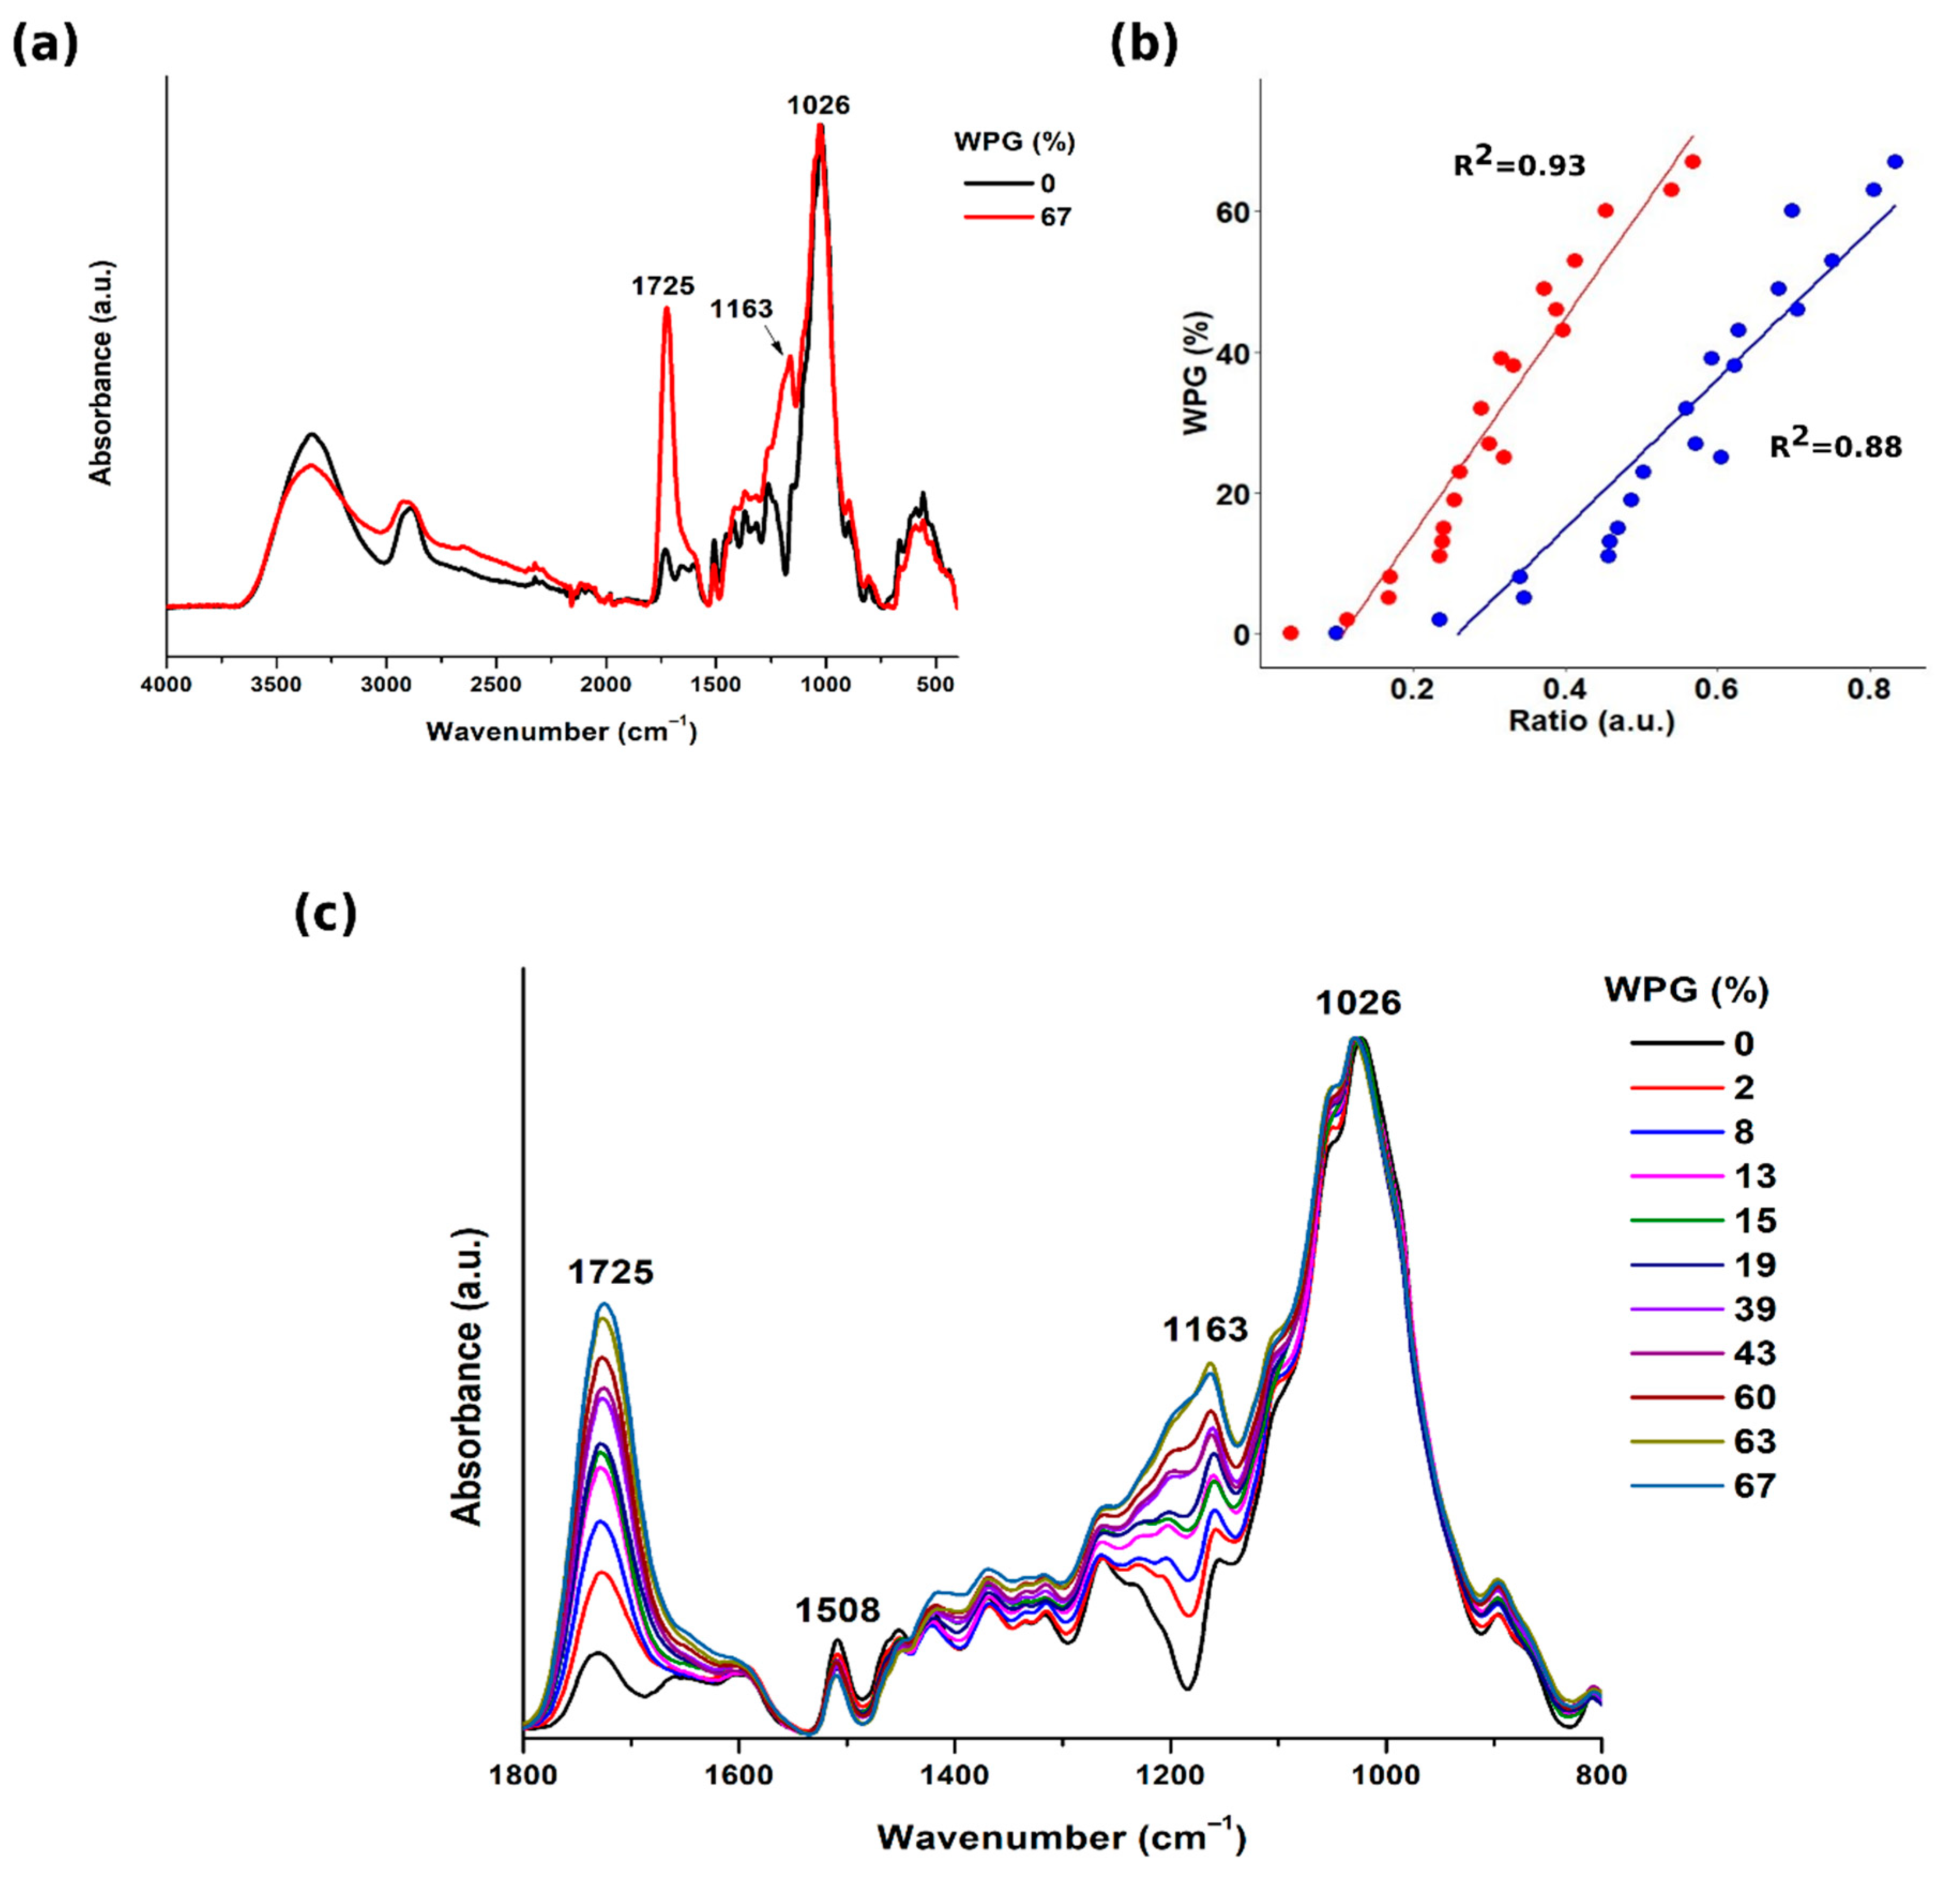
3.2. ATR-FTIR Measurements

The esterification reaction was confirmed by FTIR-ATR spectroscopy, which is designed to detect even minor differences in the chemical composition of the material [44]. For each sample, spectra at several different locations have been registered to ensure sufficient contact between the wood sample and the diamond.
As shown in Figure 3a, two peaks that exhibited the most significant increase after the SorCA-treatment are located at 1725 cm−1 and 1163 cm−1. Both result from the presence of ester groups in the treated material. The absorbance at ca. 1725 cm−1 can be assigned to C=O stretching in esters [45], e.g., sorbitol citrates and/or between SorCA and wood-polymer constituents, and proves the in situ esterification in wood. The peak at 1731 cm−1 in untreated wood corresponds to the C=O fundamental vibration in ester and acetyl groups in xylans [33]. This band, as presented in Figure 3c, continuously increased and shifted to lower wavenumbers (up to 1725 cm−1) as the WPG value increased. In general, all modified specimens have a shoulder at this absorption band, which has been observed for another CA-polyol modification system of wood [46]. It was presumably caused by a conversion of C=O stretching bands of carboxylic acid (i.e., CA), as already shown in the previous research [14]. Moreover, another absorption band ascribed to esters in cellulose and hemicellulose [47,48] at 1154 cm−1 increased and shifted to higher wavenumbers (1163 cm−1) after the treatment due to C-O-C symmetric stretching vibrations in newly-formed esters [49]. Additionally, a decrease in the absorption band of an aromatic skeleton in lignin [50] at ca. 1508 cm−1 has been noted (Figure 3a). Presumably, this has been caused by the reaction of lignin or a slight change of its structure upon polyesterification.
The stretching bond in primary alcohols in cellulose, which absorbs at ca. 1026 cm−1 [51], did not change after SorCA-treatment. Thus, this peak (located in a range of 1139–914 cm−1) has been chosen as a reference for model development. The correlation between the WPG (in a range 0–67%) and both the band area ratio (BAR) and the band height ratio (BHR) of peaks ascribed to ester groups have been used to develop a prediction model based on linear regression. The absorption areas between the wavenumbers of 1774–1689 cm−1 and 1186–1138 cm−1 have been chosen, which correspond to C=O and C-O-C stretching vibrations, respectively. The predictive power was evaluated by the correlation (R2) values.
For ester carbonyl (ca. 1725 cm−1), the correlation between WPG and both BAR and BHR was high and equal to 0.93 and 0.88, respectively (Figure 3b), whereas for C-O-C vibrations in esters (absorption at ca. 1163 cm−1), the correlation was significantly lower (0.20 for BAR and 0.59 for BHR); hence, it is not presented here.
These results indicate that the WPG of SorCA-treated wood can be estimated with a satisfying precision by quantifying the progress of an esterification reaction via C=O stretching absorption in the mid-IR range at ca. 1774–1689 cm−1. However, due to the hardness of the testing material such as wood, the presence of air bubbles between the measuring surface and the diamond may decrease the absorption [34], thus negatively influencing qualitative analysis. Moreover, as long as the reference samples are not homogenously cured, the accuracy of the calibration is doubtful.

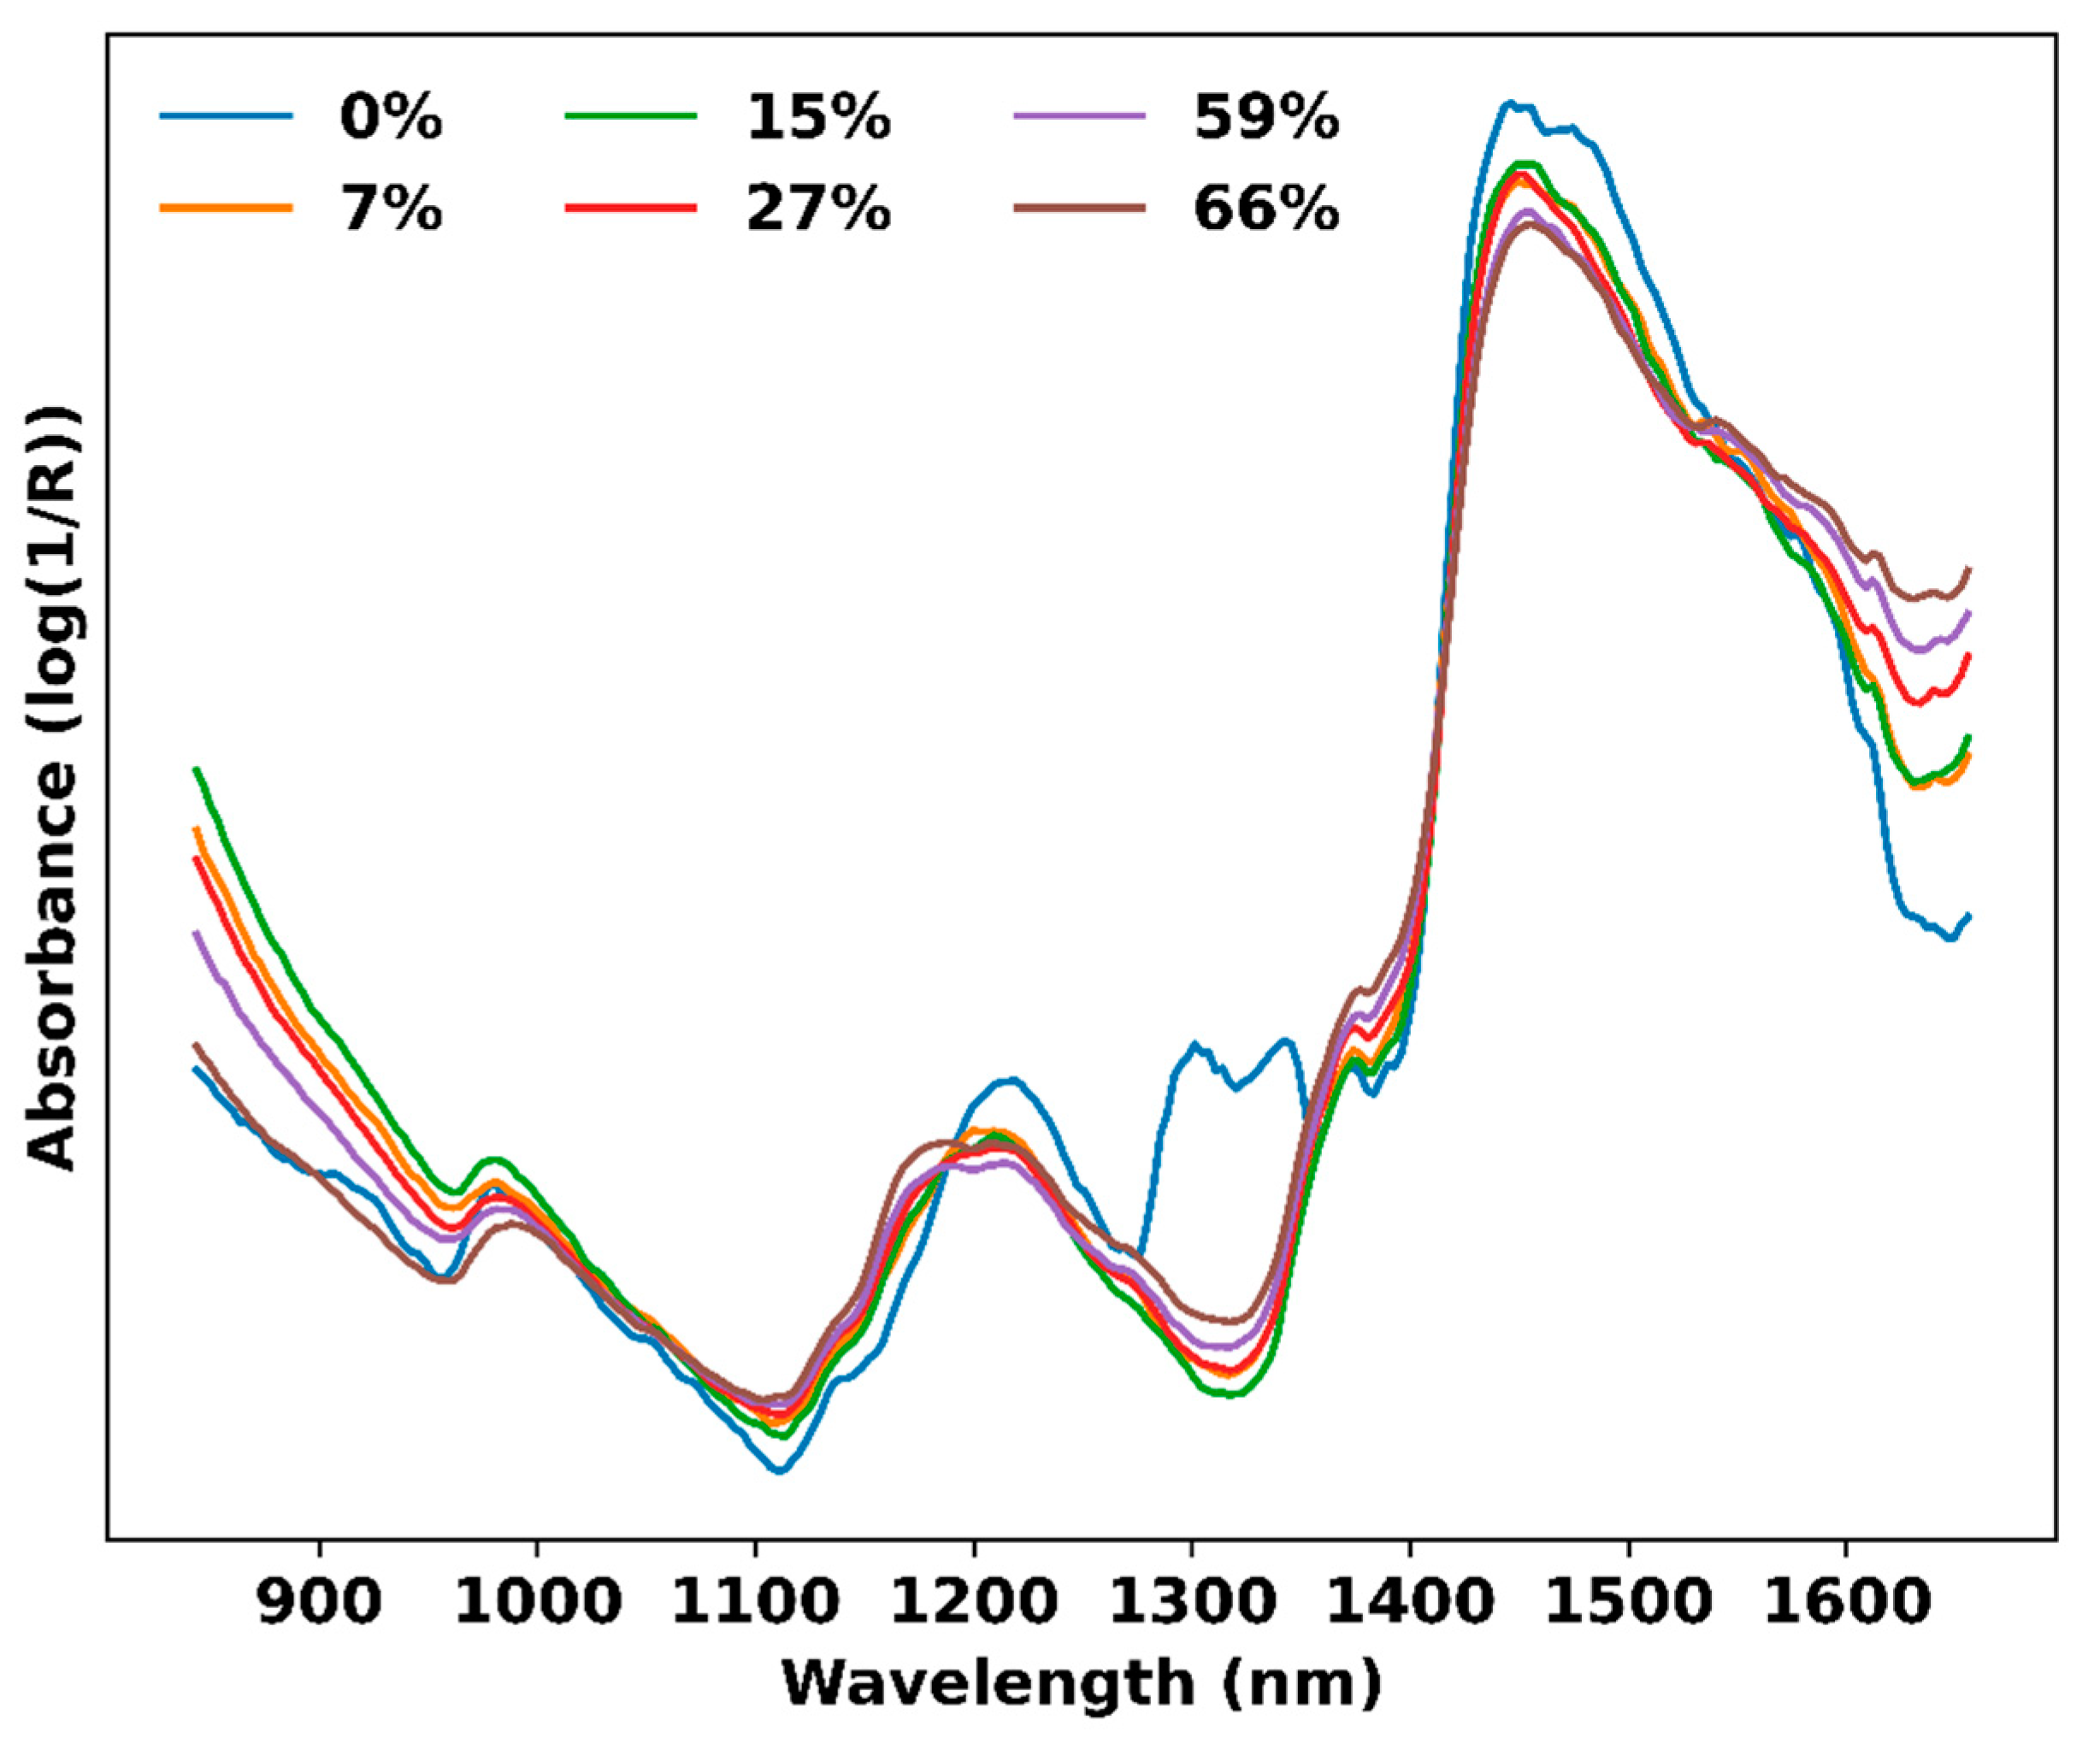
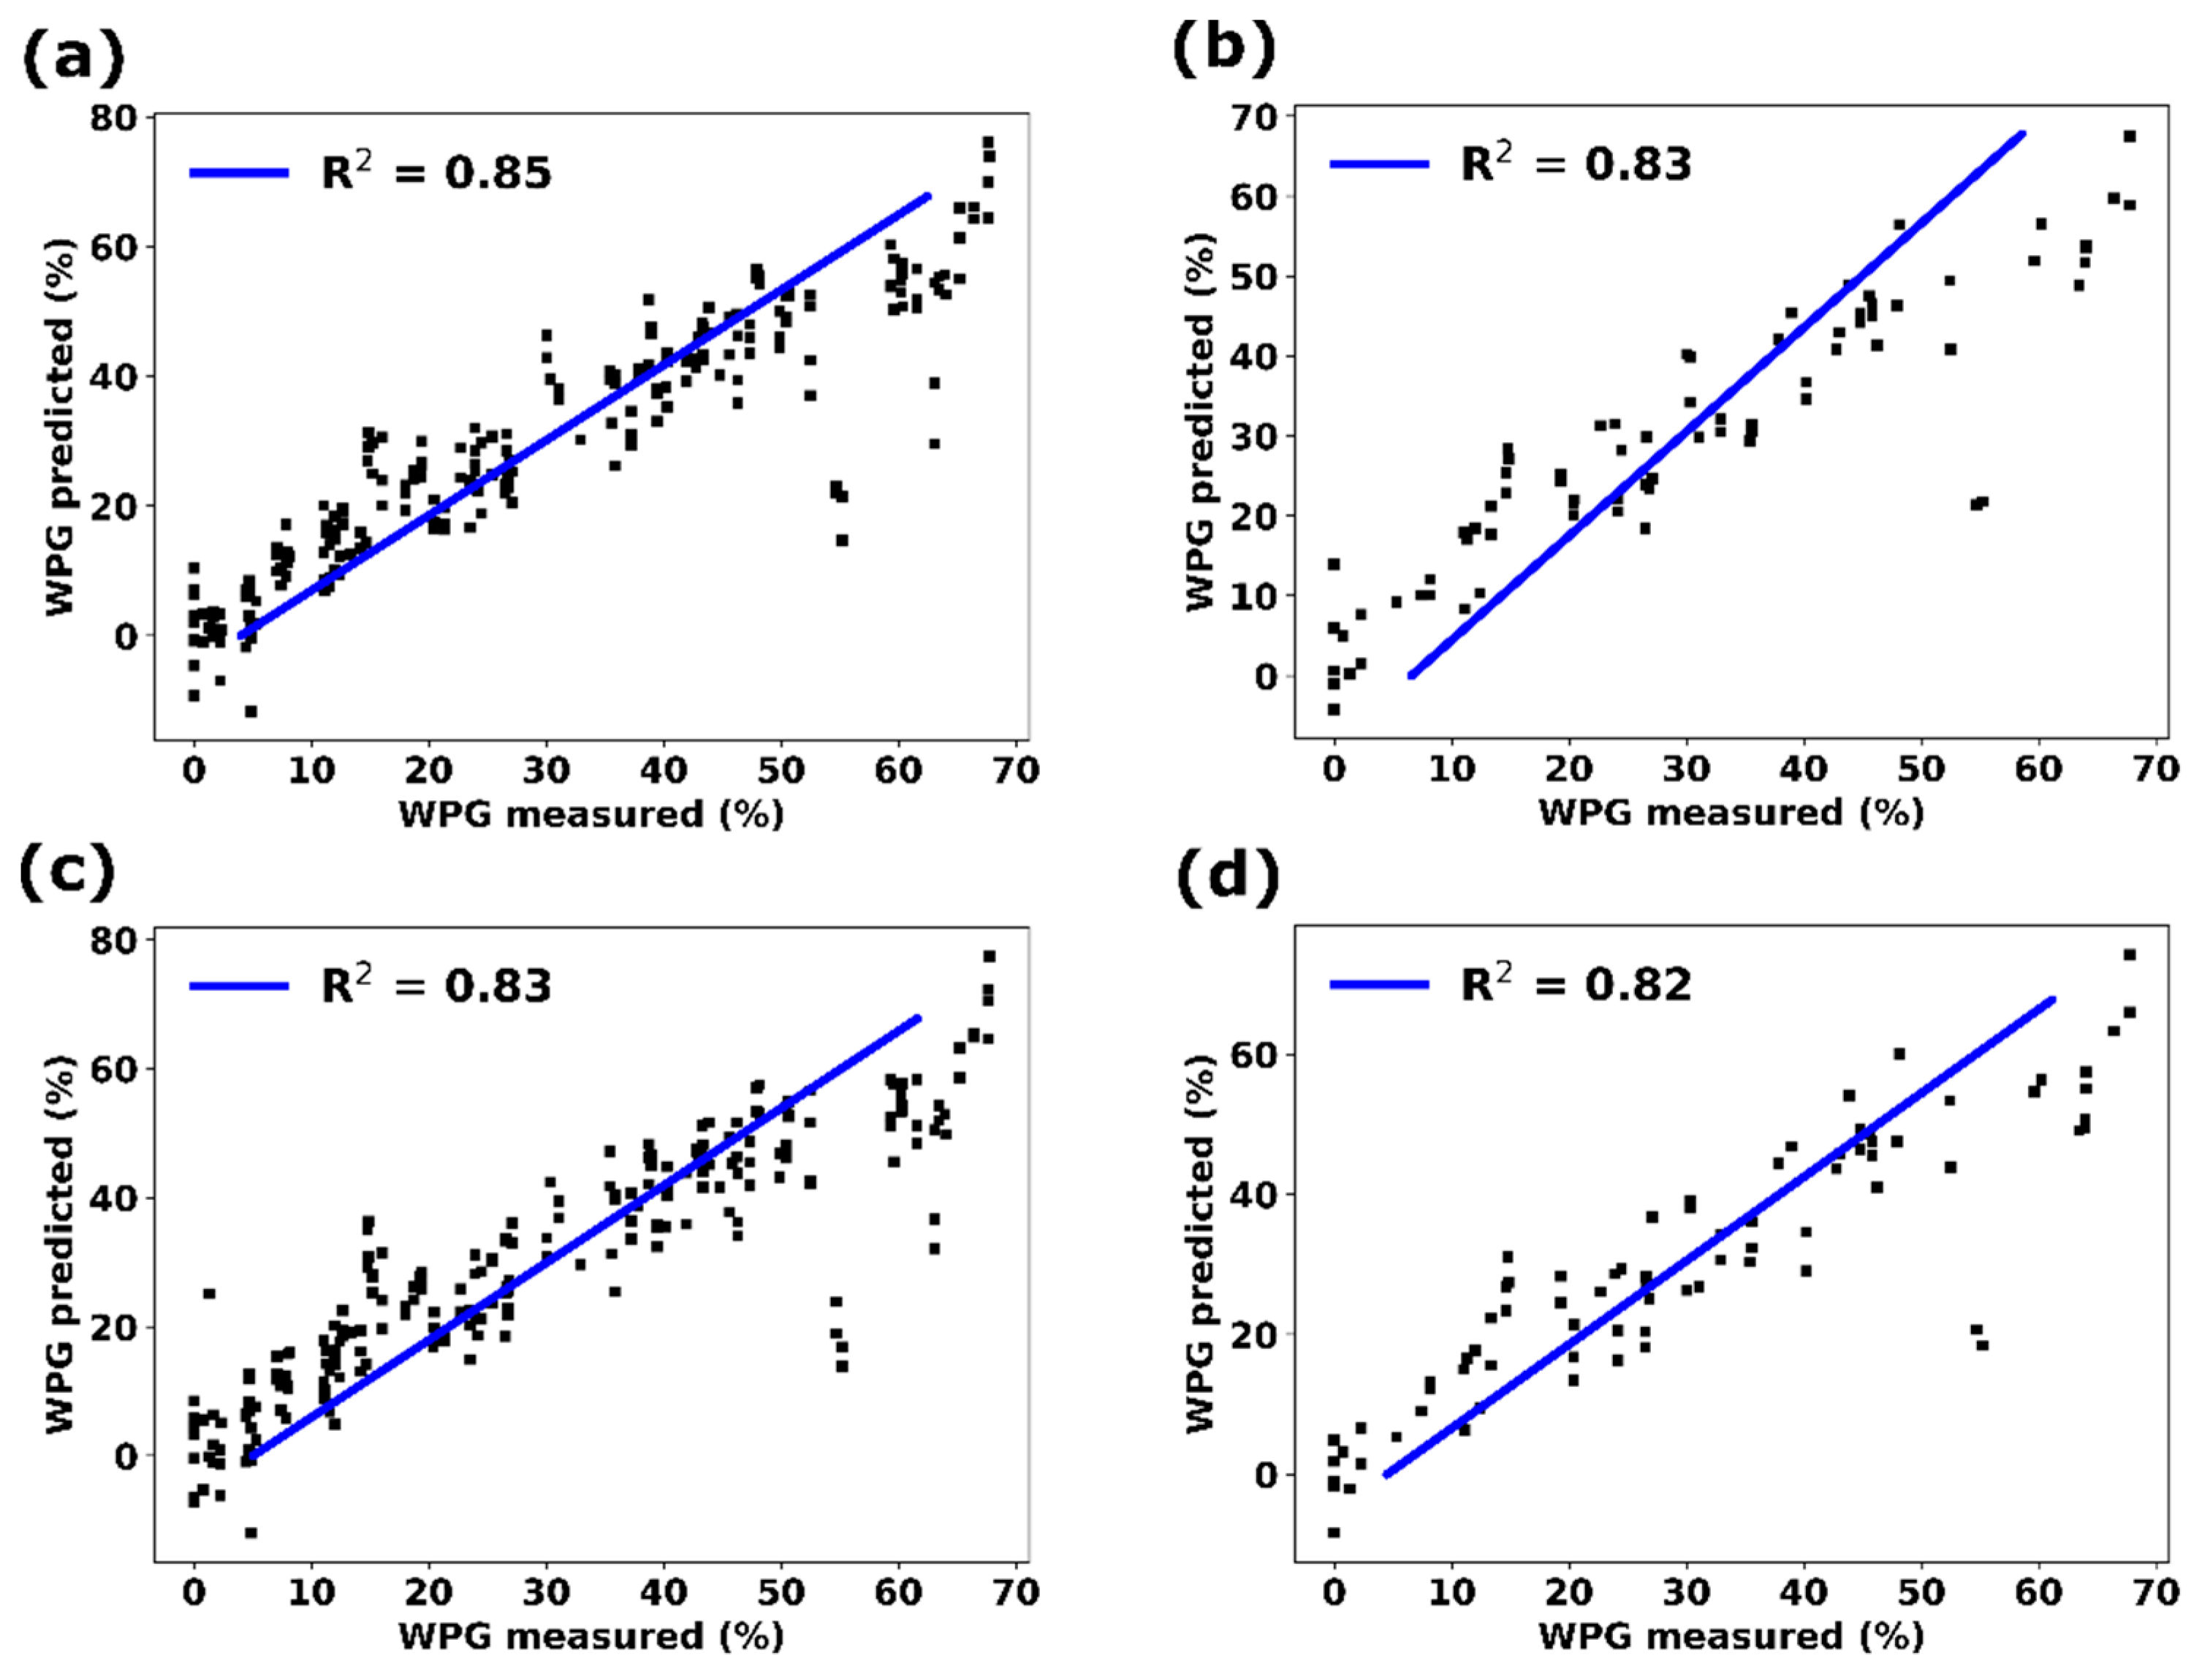
3.3. NIR Measurements

The analysis of NIR spectra is not as straightforward as of mid-IR spectra since they consist of broad and highly overlapping peaks of overtones (OT) and combination bands. The collected raw spectra (data not shown) looked similar, and the differences between various treatment levels were barely visible, whereas the pre-processed spectra differed in several wavelength regions, as presented in Figure 4. There was an overall decrease after the treatment in the region 1143–1225 nm, which is assigned to the second OT of C-H stretching vibration in lignin, cellulose and hemicellulose [52]. That could be explained by the degradation of the wood polymer upon impregnation in the acidic solution and subsequent drying at elevated temperatures. Additionally, this band has slightly broadened as the WPG increased and shifted towards lower wavelengths.
As expected, the peak ascribed to the first OT of -OH groups of all wood constituents at ca. 1430 nm decreased after modification, especially for the highest treatment levels (WPG of 59% and 66%), which was also observed for the acetylated wood [20,52]. It is, however, interesting that the overlapping peaks of untreated wood in the range 1280–1380 nm were not present in the spectra after the treatment (regardless of the WPG). These peaks resulted from the first and second OT of C-H stretching and C-H deformation vibrations [52]. That would confirm that wood polymers have degraded to some extent upon modification.
Based on the preliminary qualitative assessment of the spectra, prediction models were developed using PLS-R. The most common pre-processing techniques in chemometrics, such as vector normalization (SNV), multiplicative scatter correction (MSC), and second derivative (S-G), as well as the combination of these methods, were used to facilitate subsequent multivariate analysis. In order to exclude the region of the spectra which may not carry any relevant information, the particular wavelength ranges were selected, and the model development was based on them.
Both radial and tangential planes have been tested, as there is no agreement in the literature regarding which one gives better results for the determination of wood properties with NIR [24,53]. It has been found that, at the same wavelength range and pre-treatment method used, in most cases, the prediction power was better when the radial plane was tested to obtain data for the multivariate analysis. Therefore, all wavelength ranges and pre-processing methods which have been investigated in the radial plane are listed in Table 2.
The model performance was evaluated by the coefficient of determination (R2) and root-mean-square error (RMSE) of both the cross-validation (RMSE-CV) and test set (RMSE-TS). In general, developing a model based on the entire tested wavelength range (844–1656 nm), independently of the tested plane or pre-processing method used, resulted in the highest predictive power, i.e., the highest R2 and the lowest RMSE for both CV and TS. This would indicate that the entire tested wavelength range carries meaningful information for the WPG prediction. Therefore, based on the wavelength range 844–1656 nm, two models have been selected as the most robust ones: one with no pre-treatment prior to model building (R2 of 83%) and the other after the second derivative has been applied (R2 of 82%), as can be seen in Figure 5. It is surprising that even with no pre-treatment, it was possible to obtain a high prediction of the WPG. Moreover, as expected, prediction is poorly suited to close the boundary values, which is a common phenomenon.
From the industrial point of view, the ratio of prediction to deviation (RPD) is a crucial parameter which determines the feasibility of the process for QC. Since RPD was first mentioned in the peer-review journal in 1993 for grains and seeds analysis [54], it has become an important parameter, frequently appearing in wood science publications [20,22,23,55]. It is calculated by dividing the standard error of the reference samples by the standard error of the test set specimens [56]. Williams [56] classified the RPD value in the range of 2.4–3.0 as suitable for a rough screening. The WPG prediction models developed in this study were very close to that range, and one of the models even achieved the required RPD. Therefore, it is highly probable that increasing the number of treatment levels used for the calibration set and assuring a more uniform distribution of impregnation chemicals in wood would certainly improve the model prediction and, hence, increase the RPD value. However, the sole aim of this study was to see if the NIR technique is promising for the QC of SorCA-treated wood and, in case of a positive outcome, to continue with a wider range of calibration samples.

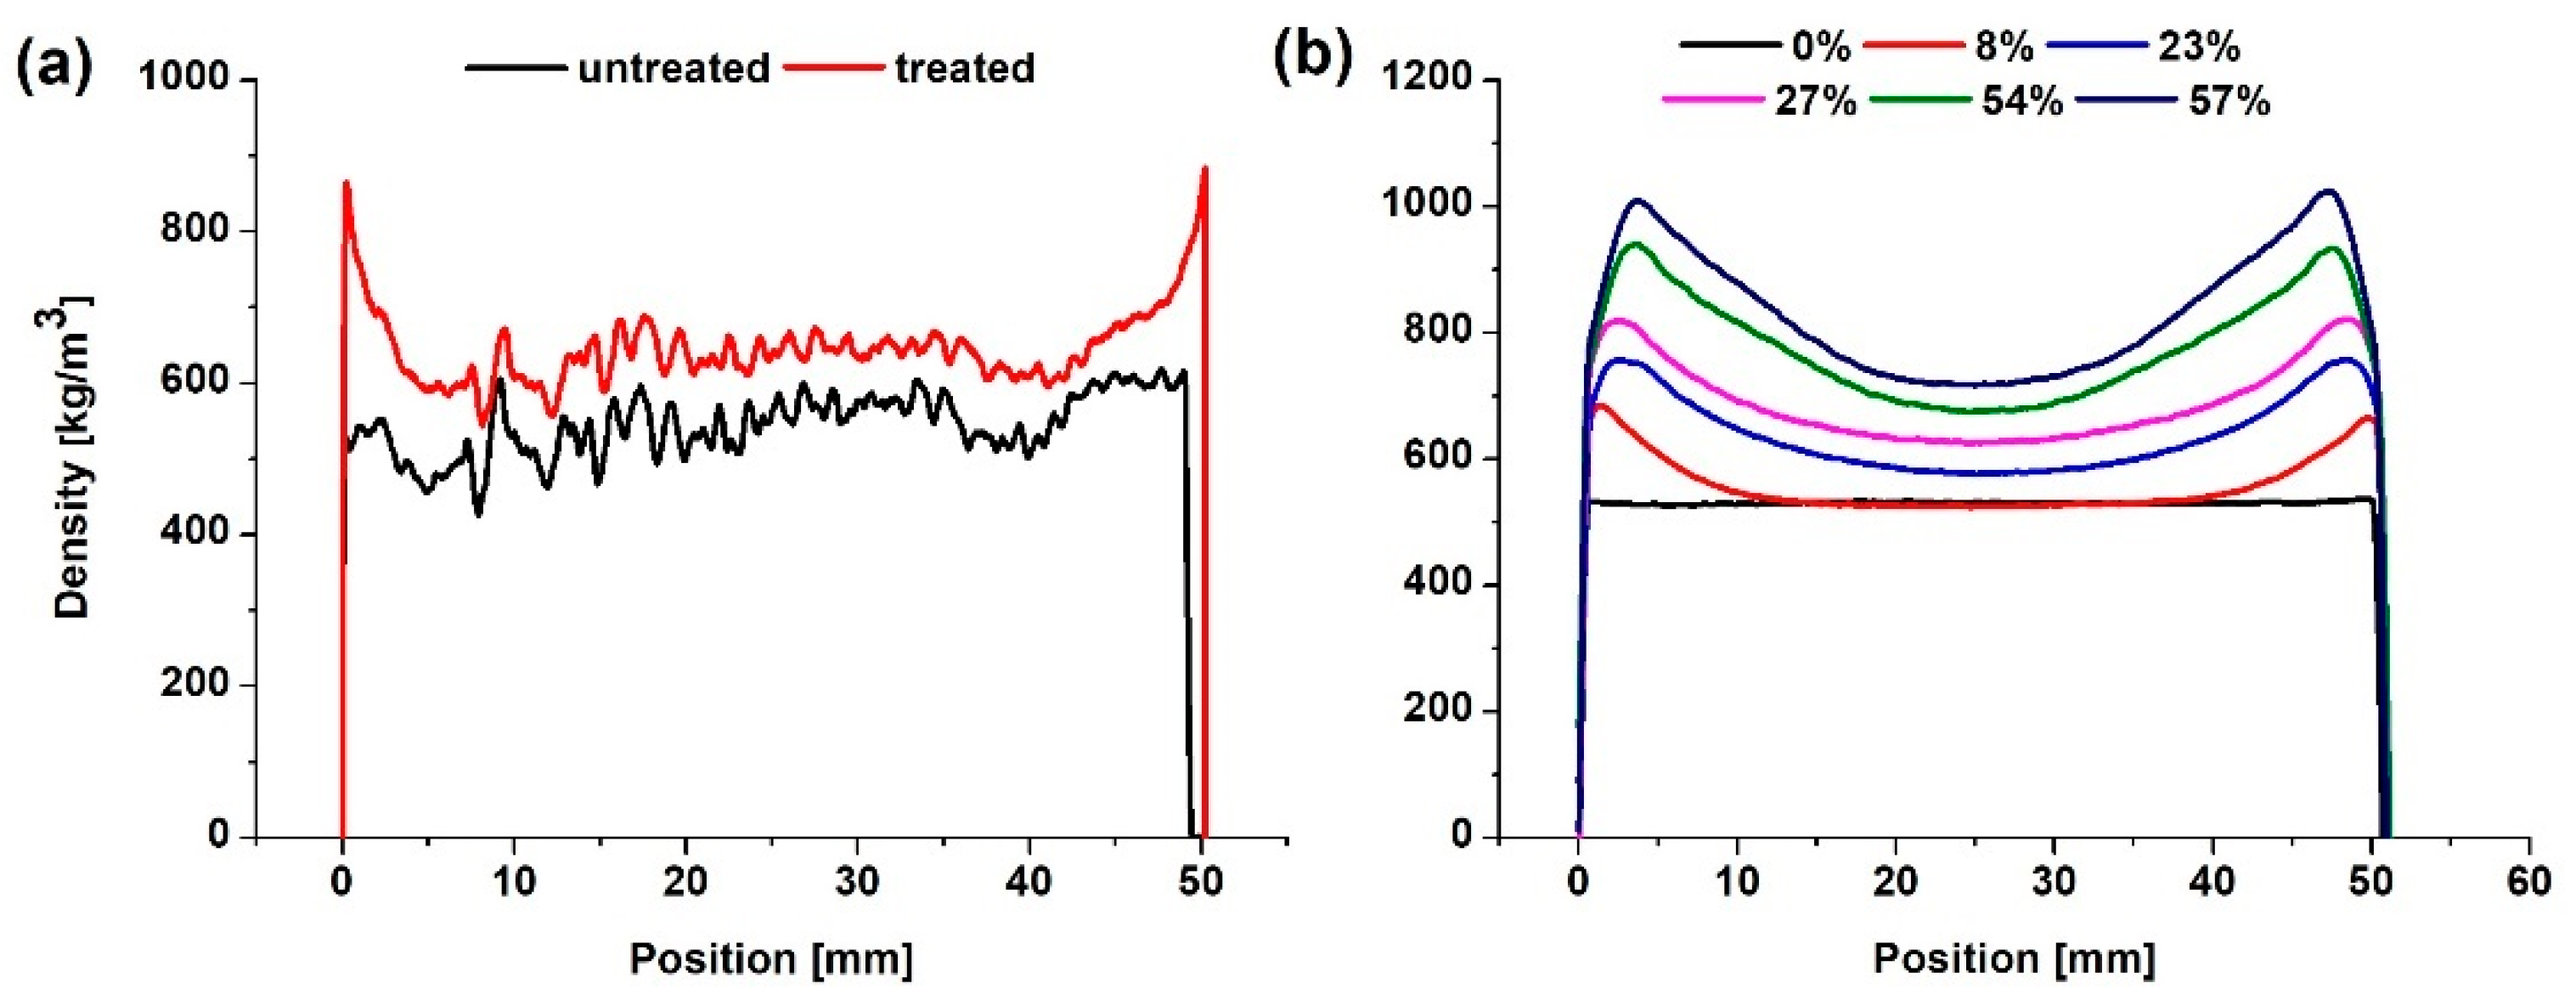
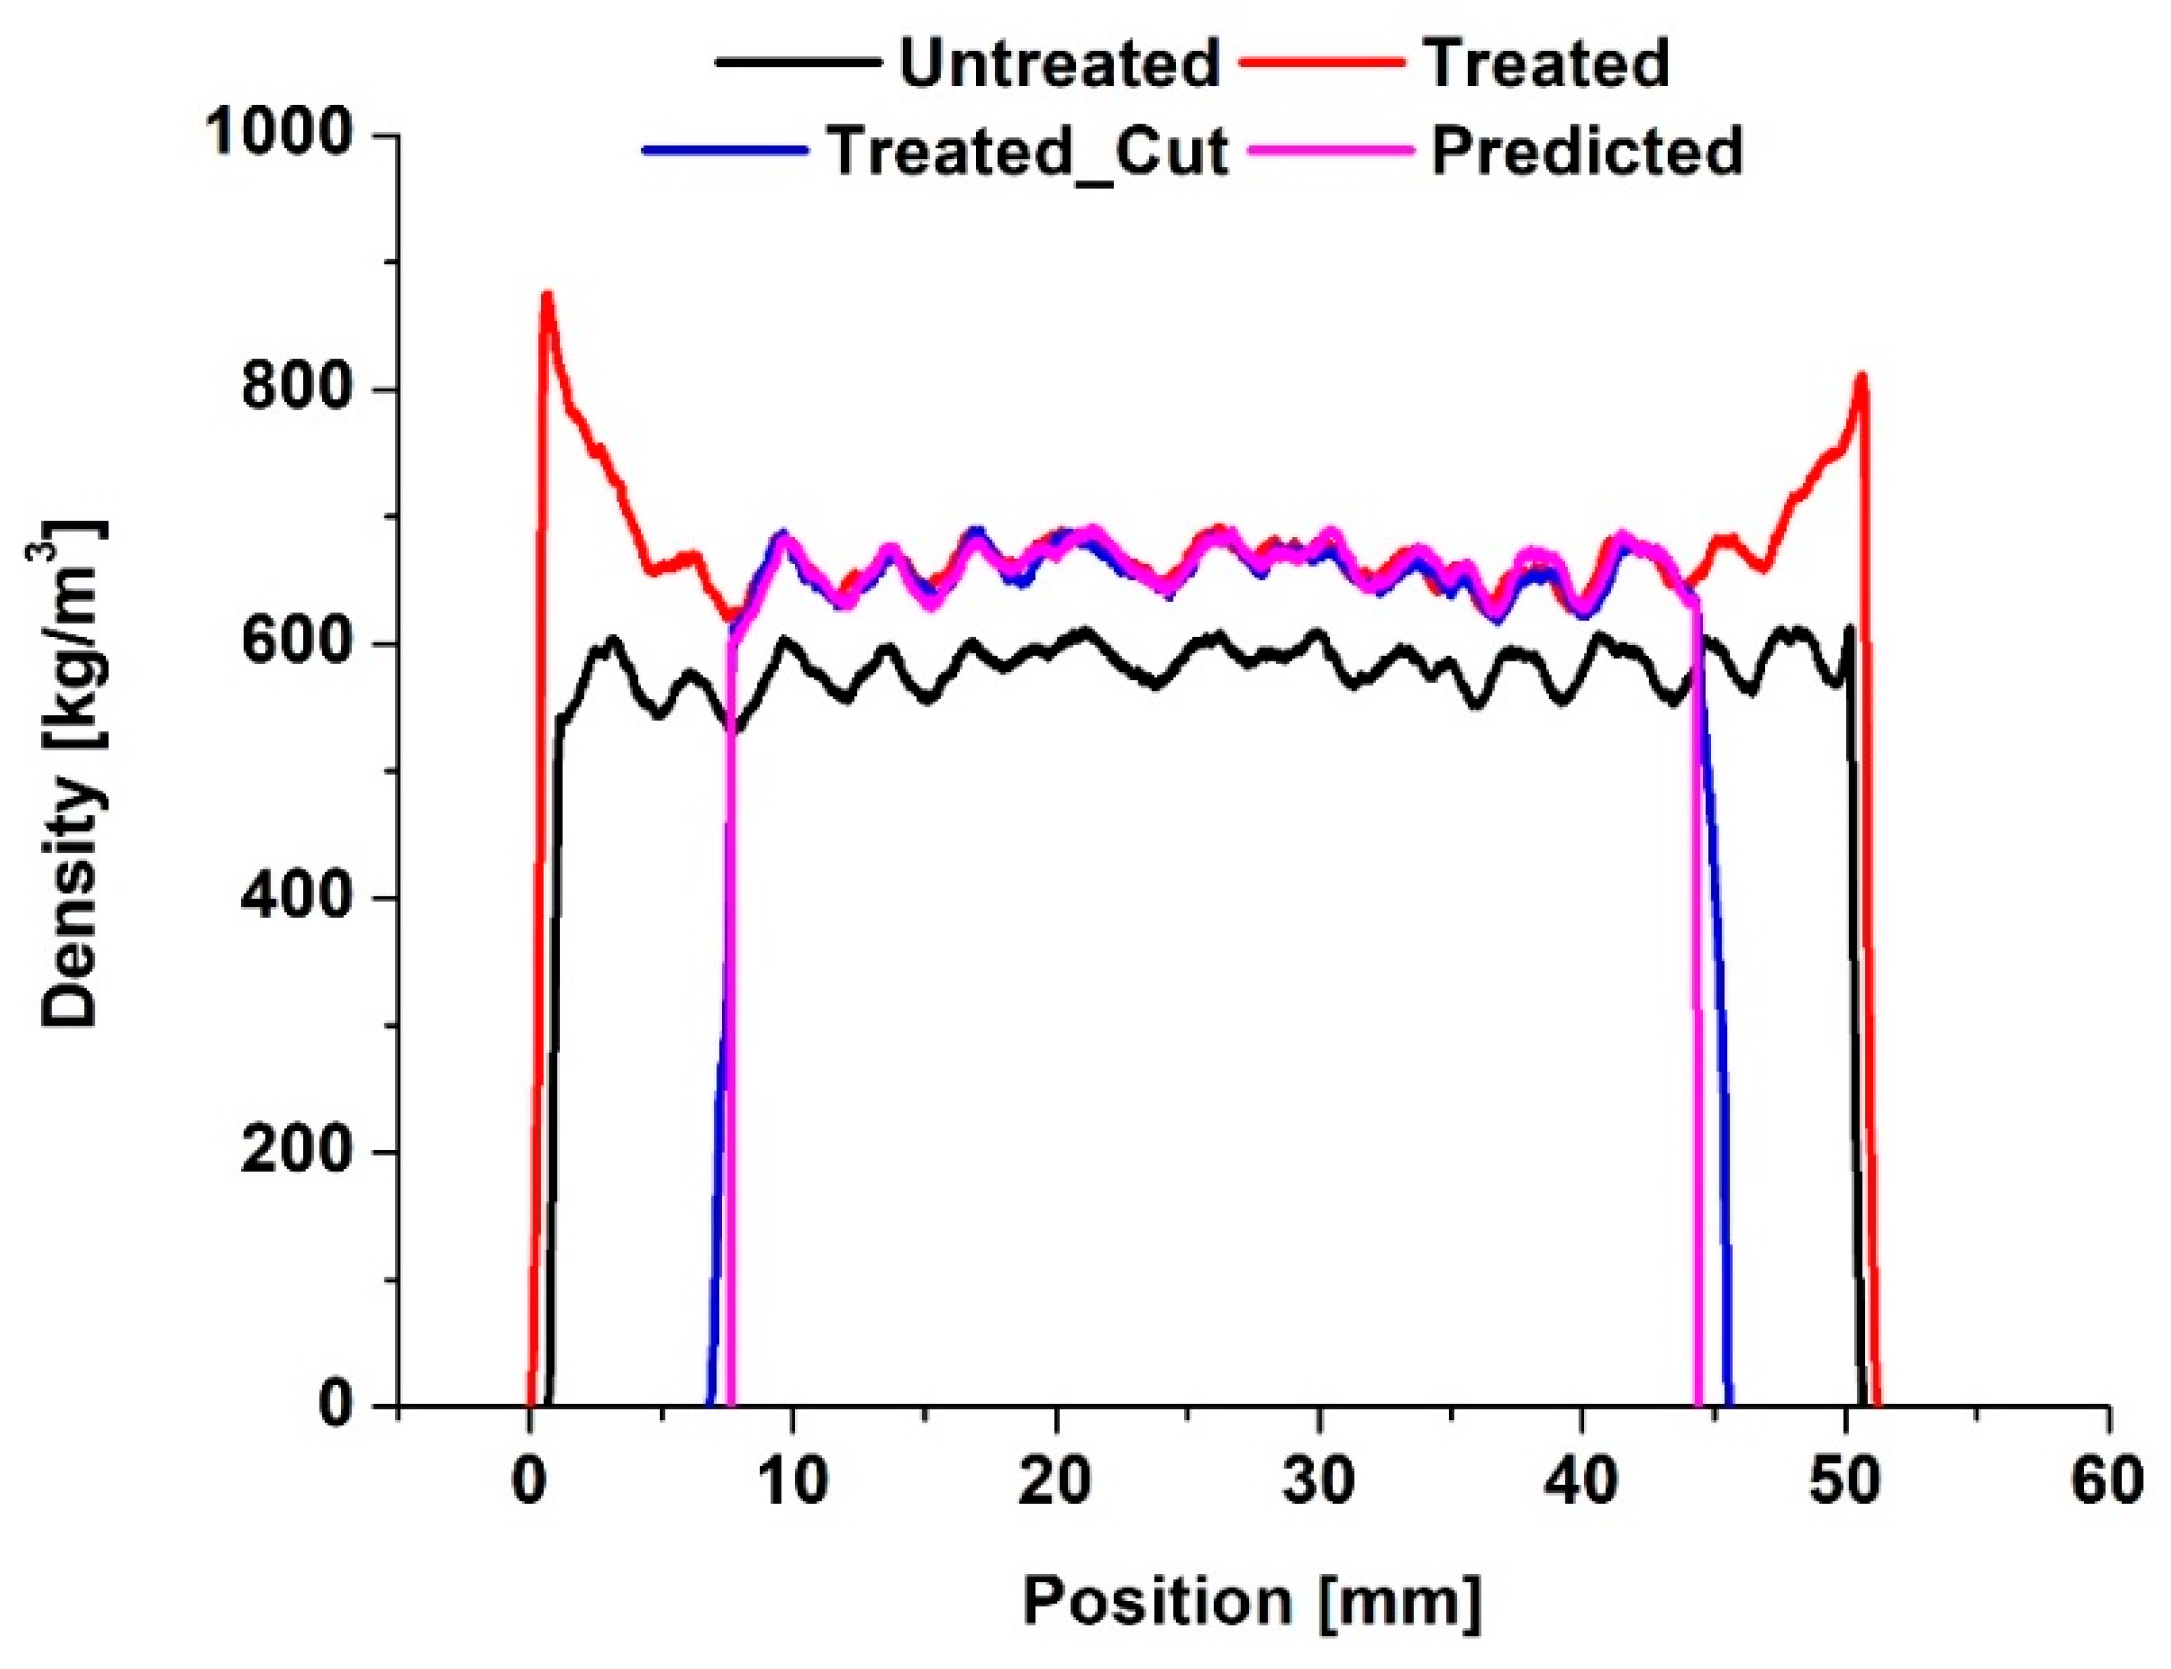
3.4. X-ray Density Profiling Measurements

The X-ray density profiler registered a year ring structure of untreated wood, as shown in Figure 6a. The density distribution of this specimen after SorCA modification followed exactly the same pattern, with the only difference of high-density regions at the edges. These peaks resulted from a high concentration of the impregnation chemicals. This illustrates a common issue faced upon dry-curing impregnated wood, which is an outdoor movement of a reaction medium resulting in the migration of impregnation chemicals towards the specimen’s surface. This phenomenon has already been observed for other modification systems [38], wood preservative treatments [57] and particleboards [58]. The assumption of this study was that a small specimen size and free end-grains would assure an almost perfectly uniform distribution of impregnation chemicals after treatment; hence, the problem would have been mitigated. It also appears that the solution uptake was higher for earlywood (dips) than for latewood (peaks), as indicated by a higher shift of the density profile’s curve in the y-axis direction. Since the earlywood is characterized by a higher porosity than latewood [59], it facilitates higher volume uptake, which could explain the higher deposition of the impregnation chemicals. A similar observation has been made for a linseed oil-treated wood [39]. However, for a better understanding, the density profiles of the specimens directly after impregnation in a wet stay should be measured.
The main goal of the densitometry measurements was to create a calibration set consisting of uniformly impregnated specimens with increasing WPG. However, performing any kind of prediction requires the even distribution of chemicals within the sample. Having observed a density gradient in the radial direction, it was necessary to heck whether such gradient was also present in other directions. Therefore, the specimens were turned by 90°, and the density profile was registered along the grain, as presented in Figure 6b. It was observed that with higher WPG values, the distance between the curves increased uniformly; however, the course of the curve remained constant. Again, as for the radial direction, a U-shaped density profile has been observed, which disturbs any kind of modelling and prediction analysis on the sample. The highest discrepancy between the core of the specimen and the edges was observed for the highest WPG and measures 31% (based on the peak’s height).
To enable the prediction of a density profile after the treatment based on the profile of the same specimen before the impregnation, the edges with high concentrations of SorCA had to be cut. Otherwise, these regions of high density led to wrong assumptions for the model development. The initial goal was to assign each WPG value to the difference between the untreated and treated density profile areas. Therefore, as part of the QC process, pieces from different parts of the wood boards would be measured before and after the treatment to assign the WPG values to the respective sections of the boards. A simple illustration of this idea can be found in Figure 7, which shows a density profile of a specimen with 16% WPG. The specimen was first measured before the treatment and then after curing, when it turned out that the edges had to be cut. Then, another density measurement was taken after cutting both high-density edges. Based on the estimated density profile of the cut specimens before the modification, the density profile of a treated sample has been predicted and compared with the actual measurement from the calibration set. Since the density profile of a reference sample measured in a laboratory and the predicted density profile of the same sample are almost identical, this method shows a huge potential for QC purposes. However, for now, the main challenge is to prepare a calibration set of uniformly modified wood specimens that do not require further cutting.

4. Conclusions

In this study, selected electromagnetic radiation-based methods commonly used in wood science have been evaluated for their ability to investigate the distribution of chemicals in SorCA-modified wood. The results showed that spectroscopic techniques such as ATR-FTIR and NIR may predict the WPG with a high accuracy, based on the absorption in the mid-IR and diffuse reflectance in the near-IR range, respectively. Therefore, both methods can be used for the quantitative analysis of the chemicals inside the treated wood. Overall, FTIR results showed a high linear correlation between the band area ratio (BAR) and the band height ratio (BHR) of ester carbonyl and cellulose hydroxyl groups. Similarly, the PLS regression of NIR spectra was successfully applied to illustrate SorCA distribution after the treatment. In addition, X-ray density profiling has been successfully applied for the WPG determination; however, this technique might need some improvements. Nevertheless, due to the uneven distribution of the impregnation chemicals detected by the X-ray density profiling, the accuracy of the WPG prediction of the developed models might be questioned. Therefore, even though all tested methods appear promising for analysing the chemical distribution within the sample, further research in the area is required, especially regarding the sample set used for the model calibration. Future research should focus on providing a more homogenous distribution of the impregnation chemicals for the calibration set, so the WPG assigned for the specimens would reflect the WPG measured at any point on the sample via one of the studied techniques. Thus, the reference data used for the model development would be more accurate than the data used in this study. Additionally, more treatment levels should be included for calibration to enhance the robustness of the model. The examination of a wet chemistry reference method could also be considered, as such a method could be used to acquire more precise reference values, such as the number of the formed ester bonds.

Author Contributions

K.K., together with L.E. and H.M., were mainly responsible for the conceptualization and methodology. All authors contributed to the data evaluation. K.K. and A.K.M. were mainly responsible for the data validation and formal analysis. Investigations and data curation were conducted by K.K. The original draft of this article was prepared by K.K., who was also responsible for the review and editing process of this article. All authors oversaw the visualization. H.M. supervised the project. All authors have read and agreed to the published version of the manuscript.

Funding

The authors acknowledge support by the Open Access Publication Funds of the Göttingen University.

Data Availability Statement

Not applicable.

Acknowledgments

The authors would like to acknowledge Jimmy-John Hoste (CERFACS, France) for the statistical consulting, Christoph Lenth (Institut für Nanophotonik Göttingen, Germany) for the NIR spectroscopy guidance and Christian Simmering for the assistance in treating the samples and performing the NIR measurements.

Conflicts of Interest

The authors declare no conflict of interest.

References

  1. Guo, W.; Xiao, Z.; Wentzel, M.; Emmerich, L.; Xie, Y.; Militz, H. Modification of scots pine with activated glucose and citric acid: Physical and mechanical properties. BioResources 2019, 14, 3445–3458. [Google Scholar]
  2. L’Hostis, C.; Thévenon, M.-F.; Fredon, E.; Gérardin, P. Improvement of beech wood properties by in situ formation of polyesters of citric and tartaric acid in combination with glycerol. Holzforschung 2017, 72, 291–299. [Google Scholar]
  3. Mubarok, M.; Militz, H.; Dumarçay, S.; Gérardin, P. Beech wood modification based on in situ esterification with sorbitol and citric acid. Wood Sci. Technol. 2020, 54, 479–502. [Google Scholar]
  4. Silveira, M.M.; Jonas, R. The biotechnological production of sorbitol. Appl. Microbiol. Biotechnol. 2002, 59, 400–408. [Google Scholar]
  5. Ciriminna, R.; Meneguzzo, F.; Delisi, R.; Pagliaro, M. Citric Acid: Emerging applications of key biotechnology industrial product. Chem. Cent. J. 2017, 11, 22. [Google Scholar]
  6. Marques, C.; Tarek, R.; Sara, M.; Brar, S.K. Sorbitol production from biomass and its global market. In Platform Chemical Biorefinery; Elsevier: Amsterdam, The Netherlands, 2016; pp. 217–227. [Google Scholar]
  7. Berovic, M.; Legisa, M. Citric acid production. Biotechnol. Annu. Rev. 2007, 13, 303–343. [Google Scholar]
  8. Beck, G. Leachability and decay resistance of wood polyesterified with sorbitol and citric acid. Forests 2020, 11, 650. [Google Scholar]
  9. Alfredsen, G.; Larnøy, E.; Beck, G.; Biørnstad, J.; Gobakken, L.R.; Treu, A. A Summary of decay performance with citric acid and sorbitol modification. In Proceedings of the the International Research Group on Wood Protection, IRG/WP/20-40898, Online Webinar, 10–11 June 2020. [Google Scholar]
  10. Larnøy, E.; Karaca, A.; Gobakken, L.R.; Hill, C.A.S. Polyesterification of wood using sorbitol and citric acid under aqueous conditions. Int. Wood Prod. J. 2018, 9, 66–73. [Google Scholar]
  11. Treu, A.; Nunes, L.; Larnøy, E. Macrobiological degradation of esterified wood with sorbitol and citric acid. Forests 2020, 11, 776. [Google Scholar]
  12. Jones, D.; Sandberg, D.; Goli, G.; Todaro, L. (Eds.) Wood Modification in Europe: A State-of-Art about Process, Products and Applications, 1st ed.; Proceedings e Report; Firenze University Press: Florence, Italy, 2020; Volume 124, p. 10. [Google Scholar]
  13. Beckers, E.P.J.; Bongers, H.P.M. Acetyl content determination using different analytical techniques. In Proceedings of the 3rd European Conference on Wood Modification (ECWM3), Cardiff, UK, 15–16 October 2007; p. 22. [Google Scholar]
  14. Kurkowiak, K.; Emmerich, L.; Militz, H. Sorption behavior and swelling of citric acid and sorbitol (SorCA) treated wood. Holzforschung 2021, 75, 1136–1149. [Google Scholar]
  15. Li, X.; Sun, C.; Zhou, B.; He, Y. Determination of hemicellulose, cellulose and lignin in moso bamboo by near infrared spectroscopy. Sci. Rep. 2015, 5, 17210. [Google Scholar]
  16. Schwanninger, M.; Rodrigues, J.C.; Gierlinger, N.; Hinterstoisser, B. Determination of lignin content in norway spruce wood by fourier transformed near infrared spectroscopy and partial least squares regression. Part 1: Wavenumber selection and evaluation of the selected range. J. Infrared Spectrosc. 2011, 19, 319–329. [Google Scholar]
  17. Alves, A.M.M.; Simões, R.F.S.; Santos, C.A.; Potts, B.M.; Rodrigues, J.; Schwanninger, M. Determination of Eucalyptus globulus wood extractives content by near infrared-based partial least squares regression models: Comparison between extraction procedures. J. Infrared Spectrosc. 2012, 20, 275–285. [Google Scholar]
  18. Giordanengo, T.; Charpentier, J.-P.; Roger, J.-M.; Roussel, S.; Brancheriau, L.; Chaix, G.; Baillères, H. Correction of moisture effects on near infrared calibration for the analysis of phenol content in eucalyptus wood extracts. Ann. For. Sci. 2008, 65, 803. [Google Scholar]
  19. Schwanninger, M.; Stefke, B.; Hinterstoisser, B. Qualitative assessment of acetylated wood with infrared spectroscopic methods. J. Infrared Spectrosc. 2011, 19, 349–357. [Google Scholar]
  20. Stefke, B.; Windeisen, E.; Schwanninger, M.; Hinterstoisser, B. Determination of the weight percentage gain and of the acetyl group content of acetylated wood by means of different infrared spectroscopic methods. Anal. Chem. 2008, 80, 1272–1279. [Google Scholar]
  21. dos Santos, L.M.; Amaral, E.A.; Nieri, E.M.; Costa, E.V.S.; Trugilho, P.F.; Calegário, N.; Hein, P.R.G. Estimating wood moisture by near infrared spectroscopy: Testing acquisition methods and wood surfaces qualities. Wood Mater. Sci. Eng. 2020, 16, 336–343. [Google Scholar]
  22. Alves, A.; Santos, A.; Rozenberg, P.; Pâques, L.E.; Charpentier, J.-P.; Schwanninger, M.; Rodrigues, J. A Common near infrared—based partial least squares regression model for the prediction of wood density of Pinus pinaster and Larix × Eurolepis. Wood Sci. Technol. 2012, 46, 157–175. [Google Scholar]
  23. Arriel, T.G.; Ramalho, F.M.G.; Lima, R.A.B.; de Sousa, K.I.R.; Hein, P.R.G.; Trugilho, P.F. Developing near infrared spetroscopic models for predicting density of eucalyptus wood based on indirect measurement. Cerne 2019, 25, 294–300. [Google Scholar]
  24. Fujimoto, T.; Kobori, H.; Tsuchikawa, S. Prediction of wood density independently of moisture conditions using near infrared spectroscopy. J. Infrared Spectrosc. 2012, 20, 353–359. [Google Scholar]
  25. Schimleck, L.R.; Matos, J.L.M.; Trianoski, R.; Prata, J.G. Comparison of methods for estimating mechanical properties of wood by NIR spectroscopy. J. Spectrosc. 2018, 2018, 1–10. [Google Scholar]
  26. Zimmer, B.; Bächle, H. Qualitäts- und Produktionskontrolle von TMT mit Farbmessung und NIR-Spektroskopie. In Proceedings of the Europäischer TMT-Workshop 2010, Dresden, Germany, 6–7 May 2010; p. 9. [Google Scholar]
  27. Agelet, L.E.; Hurburgh, C.R. A Tutorial on near infrared spectroscopy and its calibration. Crit. Rev. Anal. Chem. 2010, 40, 246–260. [Google Scholar]
  28. Rinnan, Å.; vad den Berg, F.; Engelsen, S.B. Review of the most common pre-processing techniques for near-infrared spectra. TrAC Trends Anal. Chem. 2009, 28, 1201–1222. [Google Scholar]
  29. Stevanovic, T. Chemistry of Lignocellulosics: Current Trends, 1st ed.; CRC Press: Boca Raton, FL, USA, 2018. [Google Scholar]
  30. Beć, K.B.; Grabska, J.; Huck, C.W. Principles and applications of miniaturized near-infrared (NIR) spectrometers. Chem.—Eur. J. 2020, 26, 1514. [Google Scholar]
  31. Stuart, B.H. Infrared Spectroscopy: Fundamentals and Applications; John Wiley & Sons, Ltd.: New York, NY, USA, 2004. [Google Scholar]
  32. Naumann, A.; Peddireddi, S.; Kües, U.; Polle, A. Fourier transform infrared microscopy in wood analysis. In Wood Production, Wood Technology, and Biotechnological Impacts; Universitätsverlag Göttingen: Göttingen, Germany, 2007; p. 19. [Google Scholar]
  33. Traoré, M.; Kaal, J.; Martínez Cortizas, A. Differentiation between pine woods according to species and growing location using FTIR-ATR. Wood Sci. Technol. 2018, 52, 487–504. [Google Scholar]
  34. Jelle, B.P.; Hovde, P.J. Fourier transform infrared radiation spectroscopy applied for wood rot decay and mould fungi growth detection. Adv. Mater. Sci. Eng. 2012, 2012, 969360. [Google Scholar]
  35. Lipeh, S.; Schimleck, L.R.; Mankowski, M.E.; McDonald, A.G.; Morrell, J.J. Relationship between attenuated total reflectance Fourier transform infrared spectroscopy of western juniper and natural resistance to fungal and termite attack. Holzforschung 2019, 74, 246–259. [Google Scholar]
  36. Cown, D.J.; Clement, B.C. A wood densitometer using direct scanning with X-rays. Wood Sci. Technol. 1983, 17, 91–99. [Google Scholar]
  37. Gaitan-Alvarez, J.; Moya, R.; Berrocal, A. The use of X-ray densitometry to evaluate the wood density profile of tectona grandis trees growing in fast-growth plantations. Dendrochronologia 2019, 55, 71–79. [Google Scholar]
  38. Klüppel, A.; Mai, C. The influence of curing conditions on the chemical distribution in wood modified with thermosetting resins. Wood Sci. Technol. 2013, 47, 643–658. [Google Scholar]
  39. Olsson, T.; Megnis, M.; Varna, J.; Lindberg, H. Measurement of the uptake of linseed oil in pine by the use of an X-ray microdensitometry technique. J. Wood Sci. 2001, 47, 275–281. [Google Scholar]
  40. Zhou, C.; Dai, C.; Smith, G.D. Modeling vertical density profile formation for strand-based wood composites during hot pressing: Part 2. Experimental Investigations and Model Validation. Compos. Part B Eng. 2011, 42, 1357–1365. [Google Scholar]
  41. Biziks, V.; Van Acker, J.; Militz, H.; Grinins, J.; Van den Bulcke, J. Density and density profile changes in birch and spruce caused by thermo-hydro treatment measured by X-ray computed tomography. Wood Sci. Technol. 2019, 53, 491–504. [Google Scholar]
  42. Pedregosa, F. Machine Learning in Python. J. Mach. Learn. Res. 2011, 12, 2825–2830. [Google Scholar]
  43. Savitzky, A.; Golay, M.J.E. Smoothing and differentiation of data by simplified least squares procedures. Anal. Chem. 1964, 36, 13. [Google Scholar]
  44. Funda, T.; Fundova, I.; Gorzsás, A.; Fries, A.; Wu, H.X. Predicting the chemical composition of juvenile and mature woods in scots pine (Pinus Sylvestris L.) using FTIR spectroscopy. Wood Sci. Technol. 2020, 54, 289–311. [Google Scholar]
  45. Coates, J. Interpretation of infrared spectra, a practical approach. In Encyclopedia of Analytical Chemistry; Meyers, R.A., Ed.; John Wiley Sons Ltd.: Chichester, UK, 2000; pp. 10815–10837. [Google Scholar]
  46. Berube, M.A.; Schorr, D.; Ball, R.J.; Landry, V.; Blanchet, P. Determination of in situ esterification parameters of citric acid-glycerol based polymers for wood impregnation. J. Polym. Environ. 2018, 26, 970–979. [Google Scholar]
  47. Pandey, K.K.; Pitman, A.J. FTIR Studies of the changes in wood chemistry following decay by brown-rot and white-rot fungi. Int. Biodeterior. Biodegrad. 2003, 52, 151–160. [Google Scholar]
  48. Shi, J.; Xing, D.; Lia, J. FTIR studies of the changes in wood chemistry from wood forming tissue under inclined treatment. Energy Procedia 2012, 16, 758–762. [Google Scholar]
  49. Silverstein, R.M.; Bassler, G.C.; Morrill, T.C. Spectrometric Identification of Organic Compounds; John Wiley & Sons, Ltd.: New York, NY, USA, 1981. [Google Scholar]
  50. Li, G.-Y.; Huang, L.-H.; Hse, C.-Y.; Qin, T.-F. Chemical compositions, infrared spectroscopy, and X-ray diffractometry study on Brown-Rotted Woods. Carbohydr. Polym. 2011, 85, 560–564. [Google Scholar]
  51. Popescu, C.-M.; Popescu, M.-C.; Singurel, G.; Vasile, C.; Argyropoulos, D.S.; Willfor, S. Spectral characterization of eucalyptus wood. Appl. Spectrosc. 2007, 61, 1168–1177. [Google Scholar]
  52. Schwanninger, M.; Rodrigues, J.C.; Fackler, K. A Review of band assignments in near infrared spectra of wood and wood components. J. Infrared Spectrosc. 2011, 19, 287–308. [Google Scholar]
  53. Thumm, A.; Meder, R. Stiffness Prediction of radiata pine clearwood test pieces using near infrared spectroscopy. J. Infrared Spectrosc. 2001, 9, 117–122. [Google Scholar]
  54. Williams, P.C.; Sobering, D.C. Comparison of commercial near infrared transmittance and reflectance instruments for analysis of whole grains and seeds. J. Infrared Spectrosc. 1993, 1, 25–32. [Google Scholar]
  55. Schwanninger, M.; Rodrigues, J.C.; Gierlinger, N.; Hinterstoisser, B. Determination of lignin content in norway spruce wood by fourier transformed near infrared spectroscopy and partial least squares regression analysis. Part 2: Development and evaluation of the final model. J. Infrared Spectrosc. 2011, 19, 331–341. [Google Scholar]
  56. Williams, P. The RPD statistic: A tutorial note. NIR News 2014, 25, 22–26. [Google Scholar]
  57. Smith, D.; Cockcroft, R. A method of obtaining uniform distribution of wood preservatives in toxicity test blocks. Nature 1961, 189, 163–164. [Google Scholar]
  58. Amini, E.; Tajvidi, M.; Gardner, D.J.; Bousfield, D.W. Utilization of cellulose nanofibrils as a binder for particleboard manufacture. BioResources 2017, 12, 4093–4110. [Google Scholar]
  59. Kutnar, A.; O’Dell, J.; Hunt, C.; Frihart, C.; Kamke, F.; Schwarzkopf, M. Viscoelastic properties of thermo-hydro-mechanically treated beech (Fagus Sylvatica L.) determined using dynamic mechanical analysis. Eur. J. Wood Wood Prod. 2021, 79, 263–271. [Google Scholar]
Figure 1. Chemical structure of (a) citric acid and (b) sorbitol.
Forests 13 00151 g001
Figure 2. NIR and DAX measurement areas depicted on the wood specimen with the marked axis: tangential (T), radial (R).
Forests 13 00151 g002
Figure 3. ATR-FTIR spectra of (a) untreated (black curve) and SorCA-treated (red curve) wood; (b) correlation between the WPG and the band area ratio (BAR, red line) and band height ratio (BHR, blue line) in the wavenumber range 1774–1689 cm–1/1139–914 cm–1, calculated from ATR-FTIR spectra of SorCA-treated wood; (c) overlay of the selected ATR-FTIR spectra of SorCA-treated wood with increasing WPG.
Forests 13 00151 g003
Figure 4. Overlay of selected NIR spectra of SorCA-treated wood after MSC pre-treatment, measured in the tangential direction. Each curve corresponds to one WPG value.
Forests 13 00151 g004
Figure 5. WPG of SorCA-treated wood collected from the radial plane and based on the PLS-R model prediction with no pre-treatment for the (a) cross-validation and (b) test set; after second derivative for the (c) cross-validation and (d) test set.
Forests 13 00151 g005
Figure 6. The density profiles (a) of a specimen with the WPG of 23% measured in a radial direction; (b) the overlay of the density profiles of selected specimens measured in the tangential direction.
Forests 13 00151 g006
Figure 7. The density profiles of untreated (black), treated (red), treated with cut-off edges (blue) and predicted (pink) wood specimens (WPG = 16%).
Forests 13 00151 g007
Table 1. Concentration (in %) and pH of the impregnation solutions measured at ca. 20 °C, together with the weight percent gain (WPG, in %) and cell wall bulking (CWB, in %) of the specimens modified with respective solutions and subsequently dry-cured.
Concentration (%)pHWPG (%)CWB (%)
Untreated reference---
Heat-treated reference-−0.80 ± 0.07−1.09 ± 0.77
2.52.171.65 ± 0.65−0.90 ± 2.06
5.01.884.78 ± 0.332.26 ± 0.64
7.51.797.70 ± 0.452.86 ± 0.67
10.01.7411.40 ± 0.405.45 ± 0.42
12.51.6512.95 ± 0.864.58 ± 0.59
15.01.5915.10 ± 0.555.23 ± 0.79
17.51.5119.16 ± 0.906.41 ± 0.73
20.01.4822.62 ± 1.766.97 ± 0.40
22.51.4224.66 ± 1.267.33 ± 0.70
25.01.3626.77 ± 0.237.39 ± 0.27
27.51.4031.99 ± 2.318.57 ± 0.26
30.01.3537.81 ± 2.349.57 ± 0.54
32.51.2939.38 ± 1.559.78 ± 0.80
35.01.2343.27 ± 0.4110.70 ± 0.25
37.51.1745.76 ± 0.6110.80 ± 0.30
40.01.1248.76 ± 1.3311.21 ± 0.20
42.51.0753.11 ± 1.8711.31 ± 0.45
45.01.0160.24 ± 0.8611.23 ± 0.34
47.50.9562.97 ± 1.5711.51 ± 0.42
50.00.8166.67 ± 1.0612.39 ± 0.77
Table 2. The summary statistics for the best predictive models (tested wood plane: radial).
Wavelength Range (nm)Mathematical
Pre-Processing
RankR2 -CVRMSE-CV (%)R2-TSRMSE-TS (%)RPD
844–1656No pretreatment80.8527.8040.8318.1672.430
No pretreatment140.8428.1030.8128.6152.307
MSC30.56813.3410.69311.0121.805
MSC70.7689.7740.7689.5532.080
SNV50.56413.3960.7609.7422.040
SNV90.8048.9790.8088.7032.283
2nd derivative S-G40.8268.4690.8208.9692.319
2nd derivative S-G130.7619.9160.8058.7812.263
2950–1030No pretreatment60.75610.020.73110.311.927
No pretreatment90.7679.800.71610.601.875
MSC80.74210.310.65911.611.711
MSC110.74310.280.66211.551.720
SNV50.72410.660.68411.171.778
SNV90.73810.380.66811.461.734
2nd derivative S-G70.74310.290.70610.771.844
2nd derivative S-G100.74210.300.71110.691.859
1400–1600No pretreatment50.7919.270.7739.472.098
No pretreatment120.75310.090.7619.712.046
MSC50.7869.390.74110.111.966
MSC140.75210.110.71810.561.882
SNV40.7869.350.7529.892.008
SNV140.75010.140.71210.671.862
2nd derivative S-G70.7629.910.7569.822.023
2nd derivative S-G150.75610.020.72710.391.913
Selected wavelengths *No pretreatment60.82983.960.8088.702.285
No pretreatment100.8248.510.8118.642.301
* Selected wavelengths: 988, 1139, 1174, 1206, 1235, 1342, 1365, 1437, 1553 and 1590 nm.
Publisher’s Note: MDPI stays neutral with regard to jurisdictional claims in published maps and institutional affiliations.

