Article

A Predictive Model of Leaf Flammability Using Leaf Traits and Radiant Heat Flux for Plants of Fire-Prone Dry Sclerophyll Forest

School of Life Sciences, University of Technology Sydney, P.O. Box 123, Ultimo, NSW 2007, Australia
*
Author to whom correspondence should be addressed.
Forests 2022, 13(2), 152; https://doi.org/10.3390/f13020152
Submission received: 11 December 2021 / Revised: 18 January 2022 / Accepted: 19 January 2022 / Published: 20 January 2022

Abstract

:
The differential flammability of individual plant species in landscape-scale fire behaviour is an important consideration, but one that is often overlooked. This is in part due to a relative dearth in the availability of plant flammability data. Here, we present a highly accurate predictive model of the likelihood of plant leaves entering flaming combustion as a function of leaf mass per area (LMA), leaf area (LA) and radiant heat flux using species of fire-prone dry sclerophyll forests of south-eastern Australia. We validated the performance of the model on two separate datasets, and on plant species not included in the model building process. Our model gives accurate predictions (75–84%) of leaf flaming with potential application in the next generation of fire behaviour models. Given the global wealth of species’ data for LMA and LA, in stark contrast to leaf flammability data, our model has the potential to improve understanding of forest flammability in the absence of leaf flammability information.

1. Introduction

Climate change has resulted in long-term weather effects that create conditions favouring more frequent and intense wildfires [1,2,3,4,5,6,7]. Increases in the frequency and intensity of wildfires have led to extensive impacts across natural and built environments [8,9]. There is a pressing need to improve our ability to predict fire behaviour to reduce the impacts of wildfires on biodiversity, ecosystem functioning and human lives and infrastructure [10,11]. Living plant leaves provide critical fuel for wildfires, so understanding differences in leaf flammability among species, and how leaf flammability is affected by fire intensity, is key to improving our predictive models of fire behaviour [12,13,14].
Leaves play critical roles in plant physiological processes and variation in leaf traits is shaped by abiotic and biotic environmental conditions [15,16]. Leaf traits reflect environmental adaptation, where water, light and nutrient availability affect leaf morphology [15,17]. Two of the more widely investigated leaf traits in this context, leaf mass per area (LMA) and leaf area (LA), also appear to show consistent correlations with leaf flammability [18,19,20,21]. These two leaf traits influence leaf flammability as they represent the mass of leaf material available for combustion per unit area and overall leaf area available to intercept radiant heat flux from fire. Considering recent large and destructive wildfires across the world, there is an emerging possibility that the wealth of existing global data on these two leaf traits could be used to predict plant leaf flammability. Such predictive capacity would have important ramifications for models that use the traits and flammability of leaves as informative parameters for predicting wildfire behaviour [12,22,23,24,25].
Predictive modelling of leaf flammability based on leaf traits could provide a cost-effective alternative to more intensive laboratory-based flammability tests. Flammability testing can become more time-consuming and resource intensive when large numbers of species need to be investigated. In contrast, leaf trait data can be much more readily obtained. For instance, the leaf traits LMA and LA are commonly collected in and available from a wide range of ecological studies [15,26,27,28,29,30], and there are now large online repositories of data for these leaf traits (e.g., TRY Plant Database [31]). The potential applications of predictive models of leaf flammability are varied, with possible use in broad-scale fire modelling (where relative flammability for differing vegetation types might need to be quantified); preferential selection of ornamental plant species at the wildland-urban interface as a fire mitigation strategy [32]; and to provide fire-risk assessments of plant species through relative ranking schemes.
In the present study, we present a predictive model of leaf flammability as a function of the leaf traits LMA and LA. We also include leaf water content (LWC) and radiant heat flux in our modelling as previous work has shown their strong associations with leaf flammability [20,21]. Radiant heat flux and the leaf traits are both included in the models to provide a method to estimate how fire severity and leaf traits interact to determine interspecific variation in leaf flammability. The experimental work to provide data to build the predictive models uses a range of temperatures that are equivalent to moderate to extreme wildfire events [33]. The performance of the model is then demonstrated on the dataset the model was built on and the importance of the modelling steps, and the value of inclusion of leaf traits as predictors, is also demonstrated. The accuracy of the model predictions is then tested with two independent datasets not used in the model building process, in order to give an indication of the predictive value of the models when applied to new data. Our predictive modelling fits within the context of recent suggestions by [34] that more research is needed to investigate leaf flammability in standardized laboratory conditions to improve the integration of plant flammability parameters in full-scale fire simulations and wildfire modelling.

2. Materials and Methods

To provide empirical data to build the predictive model, we selected 10 plant species that are widespread and abundant in fire-prone vegetation of the Blue Mountains region of New South Wales in south-eastern Australia, 75 km west of Sydney (−33°39′31″ N, 150°32′45″ E). The study species are Acacia myrtifolia, Acacia suaveolens, Banksia serrata, Banksia spinulosa, Callistemon citrinus, Corymbia gummifera, Eucalyptus oblonga, Grevillea phylicoides, Lambertia formosa and Persoonia mollis. The inter-fire interval experienced by vegetation in the region is usually between 10 and 30 years [35]. The vegetation is predominantly comprised of sclerophyllous shrub and tree species in the families Myrtaceae, Proteaceae and Fabaceae, many of which are characterised by fire survival adaptations (e.g., possession of a lignotuber, resprouting via epicormic growth). Our study species included native shrubs and trees with interspecific variation in LMA and LA representing typical leaf trait variation observed among common species of fire-prone Blue Mountains vegetation.
We collected a replicate branch section with 15 or more healthy, fully expanded leaves from 10 individuals of each of the 10 study species from the field, situated in typical habitat for a given species, and showing typical growth form. Branch sections were cut from the outer canopy of each plant. Each individual of a species was sampled at a different location from the other individuals of the species. Locations were selected from among 50 previously identified locations in the region (approximately 20 km2; described in [21]). Branch sections were wrapped in moist cloth and sealed in air-tight plastic bags immediately following collection to preserve the water content of the samples. Samples were refrigerated overnight (to lessen dehydration and leaf wilting) before trait measurement and burning the following day. Branch sections were collected after more than seven days without rainfall to avoid this potentially influencing water content of the leaves collected. Five leaves were detached from each section of branch, and their collective leaf area was scanned and measured using ImageJ [36]. Each group of five leaves (from an individual section of branch) was weighed prior to drying for at least 48 h at 80 °C, after which it was reweighed to calculate the dry mass of the leaves. Leaf mass per area was then calculated as leaf dry mass (gm−2) per leaf area (cm2) for each replicate branch (following the protocols in [37]).
We used a fan-forced muffle furnace (Nabertherm LT 15/11HA) to measure the flammability of ten individual leaves of each species following the procedure used in previous studies [18,19,21]. In this procedure, a single leaf (chosen haphazardly from the branch section) was detached from each replicate branch section and clamped by its petiole to a wheeled stand that was used to place the leaf consistently in the centre of the furnace without coming into contact with the furnace walls. Prior to burning in the furnace, each leaf was scanned to obtain its area. We performed this procedure at four temperature settings of the muffle furnace (600, 700, 800 and 900 °C) to give a total of 400 hundred individual leaf burns (four temperatures × ten species × ten branch sections). We recorded whether or not leaves entered flaming combustion. The radiant heat flux in the furnace interior at each of the four temperatures was calculated as
RHF = ε · σ · T 4
where RHF is radiant heat flux (W), ε is the emissivity of the hot object (the proportional emission of infrared energy of the material compared to a blackbody), σ is the Stefan-Boltzmann constant (5.670−8) and T is the temperature in degrees Kelvin. The value for emissivity was set to 0.90 for white ceramic (the material of the furnace interior [38]) and assumed to be in thermal equilibrium with the air inside the furnace. The radiant heat flux values calculated for each of the increasing furnace temperatures were 29.6, 45.7, 67.6, and 96.6 kWm−2.
We used logistic regression (binomial error structure with a logit link) to model the probability of leaf flaming (1 for leaves that flamed and 0 for non-flaming leaves) as a function of increasing RHF, the leaf traits LA, LMA and LWC, including an interaction term with RHF (all continuous numeric predictors), using individual leaves as replicates. To avoid overfitting, we simplified the model on the basis of improvement in the model’s Bayesian information criterion (BIC) when sequentially removing terms, starting with terms whose removal resulted in the largest drop in BIC. First, interaction terms were removed, followed by the main effect terms (Figure 1A). This procedure identified the main effect of RHF, LA and LMA as important predictors of flaming, along with the interaction between RHF and LMA. Model BIC overall was improved with the sequential removal of the interactions between RHF and LA, and RHF and LWC, and the main effect of LWC. This gave the model:
2.46620 + RHF · 0.03109 + LA · 0.10470 + LMA · 0.02177 + RHF · LMA · 0.000684
where RHF is radiant heat flux in kWm−2, LA is leaf area in cm2, and LMA is leaf mass per area in gm−2, from which the estimated probability of flaming was calculated by applying the logit link function to the linear predictor:
P = exp l i n e a r   p r e d i c t o r 1 + exp l i n e a r   p r e d i c t o r
To assess the predictive power of this model, we calculated the proportion of correct predictions of flaming (i.e., the sensitivity as true positive rate [TPR]) and the proportion of correct predictions of non-flaming (i.e., specificity as true negative rate [TNR]) across a series of decision values from zero to one in steps of 0.005 to produce a receiver operator characteristic curve. The resultant curve showed the model to have good predictive power (area under the curve = 0.93). However, the traditional approach of using a decision value of P = 0.50 to interpret the binomial outcome across the radiant heat flux gradient here gave a rising false positive rate (i.e., non-flaming samples predicted as flaming) and falling false negative rate (i.e., flaming samples predicted as non-flaming) with increasing radiant heat flux. In order to determine the most balanced decision values across the gradient of radiant heat flux, we calculated the TPR and TNR within each level of radiant heat flux. The decision value at the point where TPR and TNR intersect gives the decision value which best balances the TPR and TNR, which in this case rose non-linearly with increasing radiant heat flux. To provide a method to interpolate decision values between the experimental radiant heat flux levels, and extend the utility of the model, a four-parameter Weibull function was then fitted to these values:
P f l a m i n g = 0.133 + 1.101 0.133 · exp exp 2.769 · l n RHF 4.209
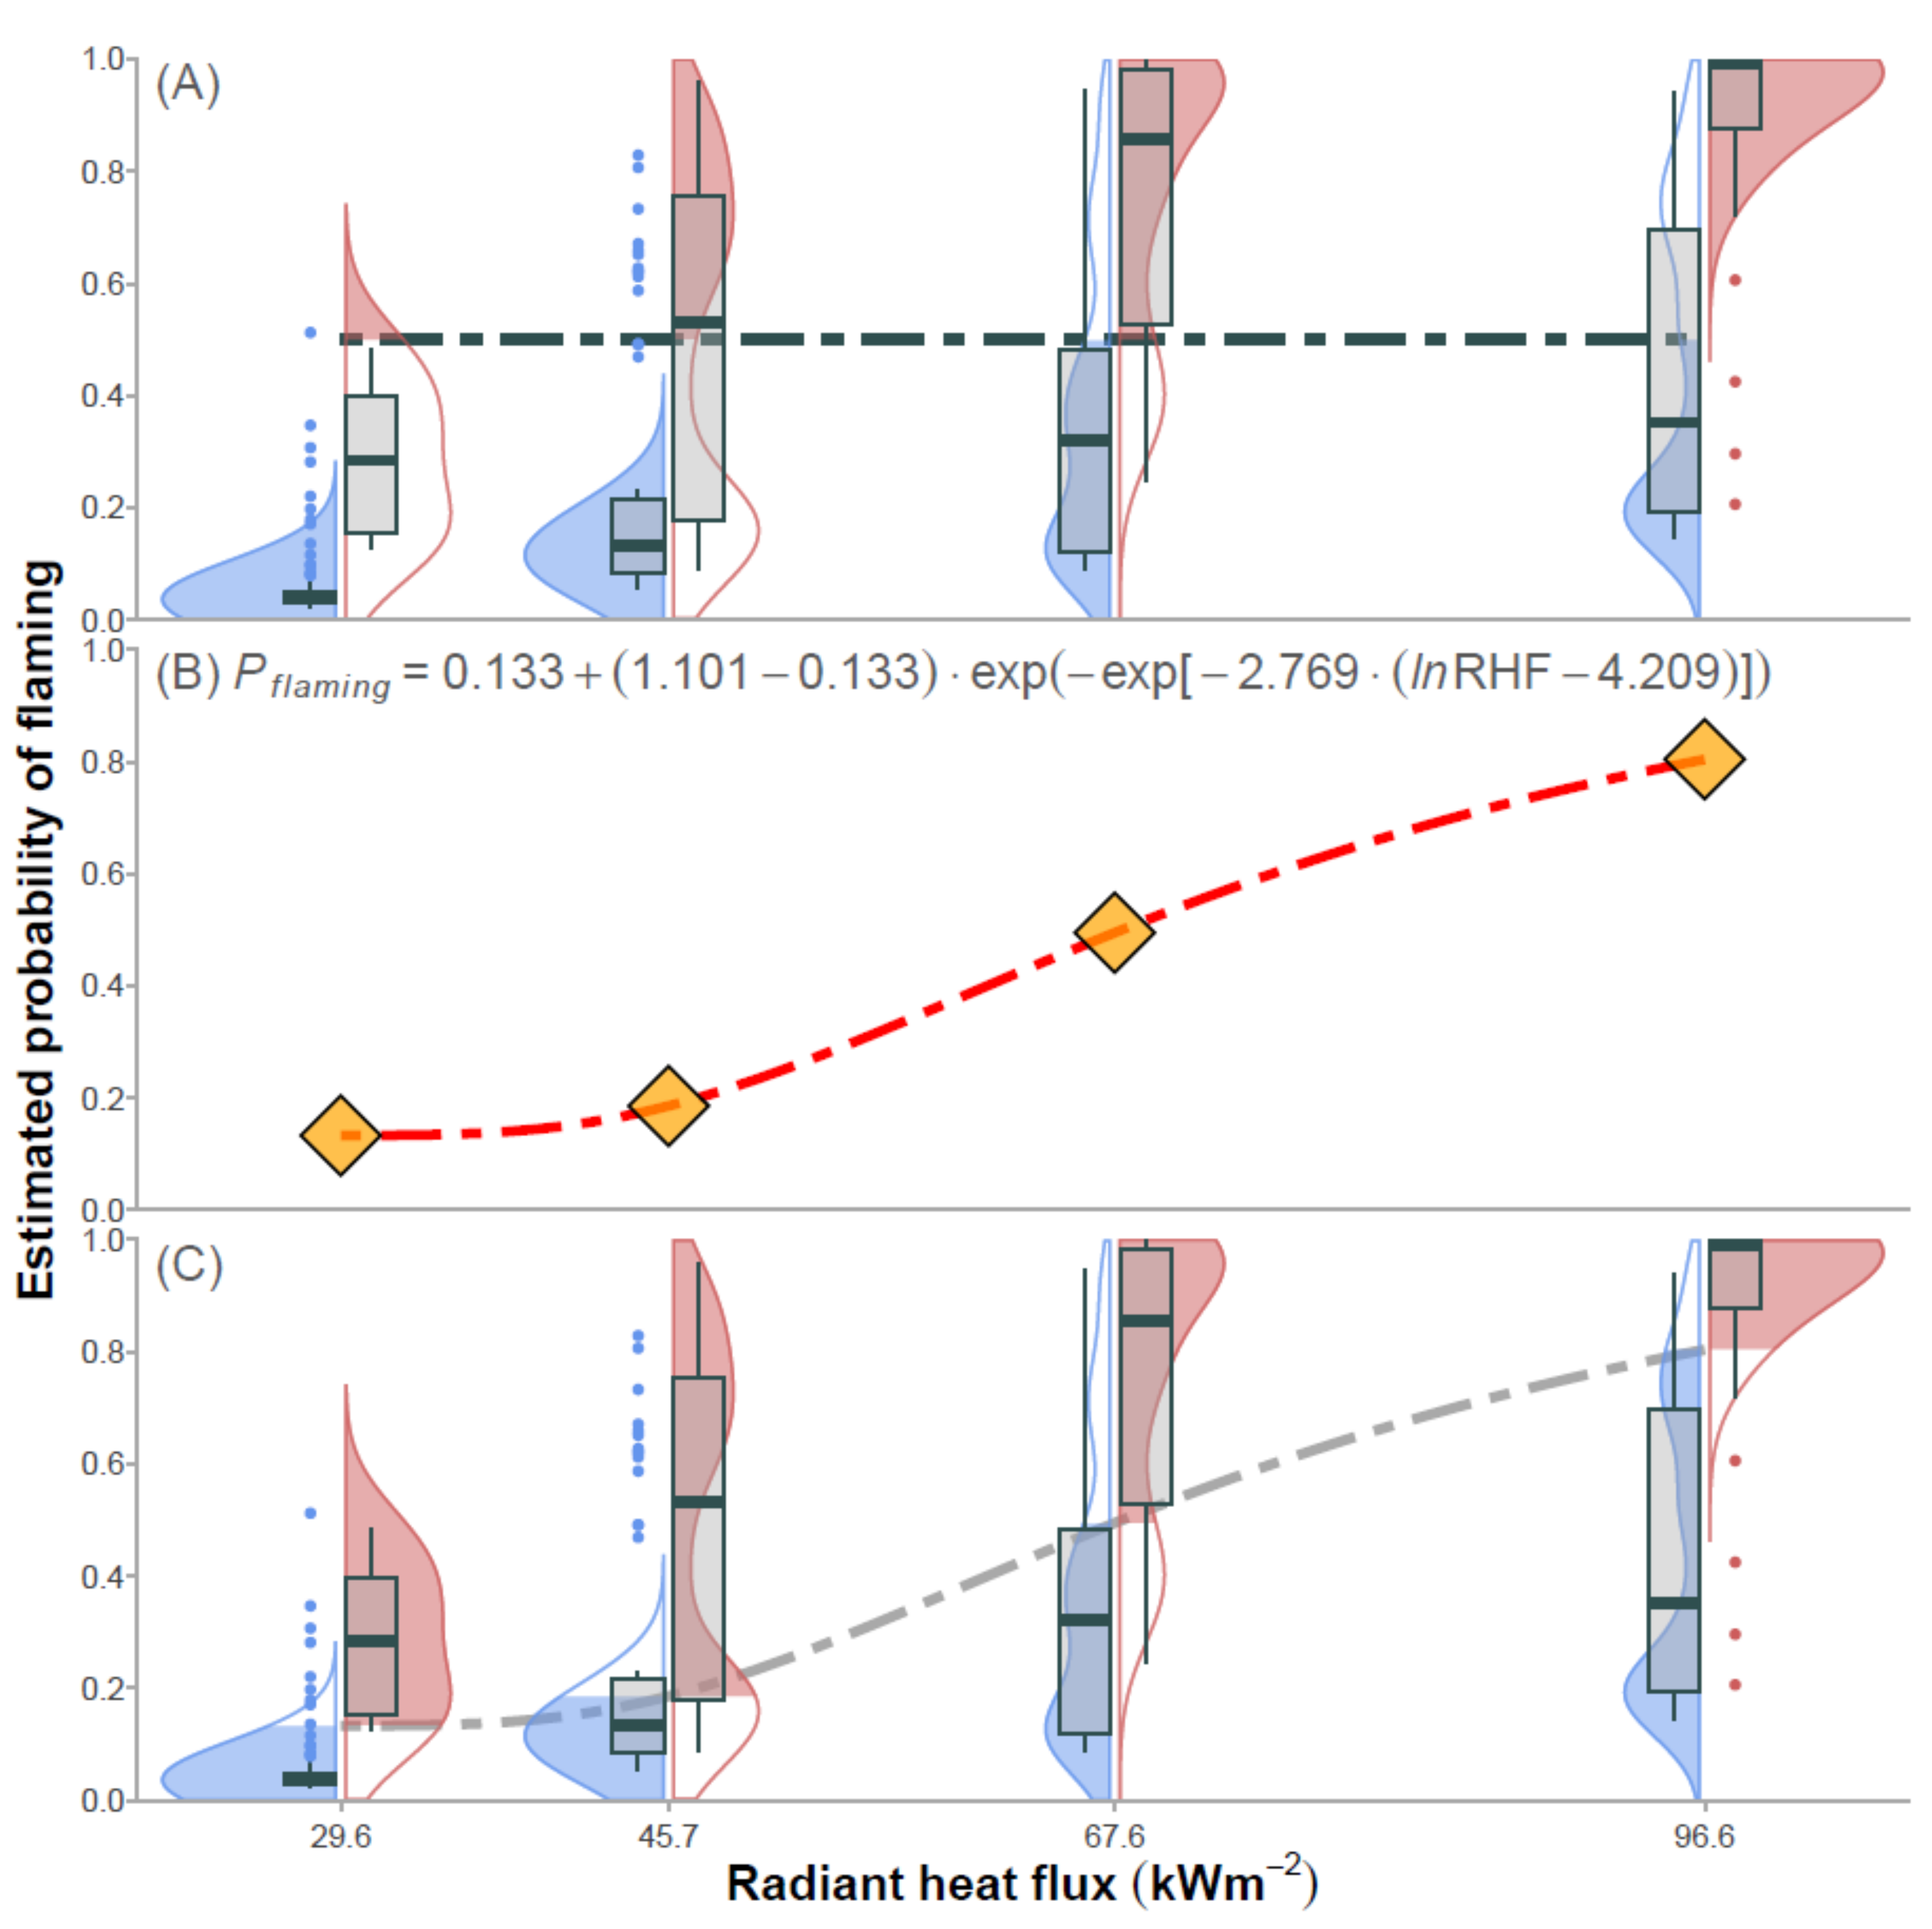
where values of P larger than the P f l a m i n g value were then taken as predictions of flaming, substantially improving model accuracy over use of a P = 0.50 decision value (Figure 2A), with the Weibull function (Figure 2B) providing a close fit to the points and good discrimination between flaming and non-flaming samples (Figure 2C). These three equations (the model providing the linear predictor, the logit link function, and P f l a m i n g ) were then applied to our empirical leaf trait and radiant heat flux data to make predictions of the flaming behaviour of all replicates in the dataset.
We tested the predictive model’s accuracy using two datasets not included in building the predictive model, with leaf flammability and leaf traits collected using the same methods. The first validation dataset included 10 species, burned at increments of 50 °C between 600 and 900 °C, to give increasing radiant heat flux of 29.6, 37.0, 45.7, 55.9, 67.6, 81.2, and 96.6 kWm−2. Three replicate leaf samples per species were burned at each level of radiant heat flux using the same method of flammability data collection as in the model building dataset (105 replicates total). The 10 species used in this dataset included five species that were not represented in the predictive dataset (Brachyloma daphnoides, Hakea dactyloides, Isopogon anemonifolius, Philotheca hispidula and Woollsia pungens) and five species that were represented in the predictive dataset (A. myrtifolia, B. serrata, B. spinulosa, G. phylicoides and L. formosa) but for which we used data from a different set of leaves not used in building the predictive model. The second validation dataset was a subset of the species (excluding non-vascular plant species and those with long strap like leaves) analysed in [21], burned at a single radiant heat flux of 45.7 kWm−2. This dataset included five replicates each of 63 species (315 replicates) not included in either the model building or the other validation datasets.
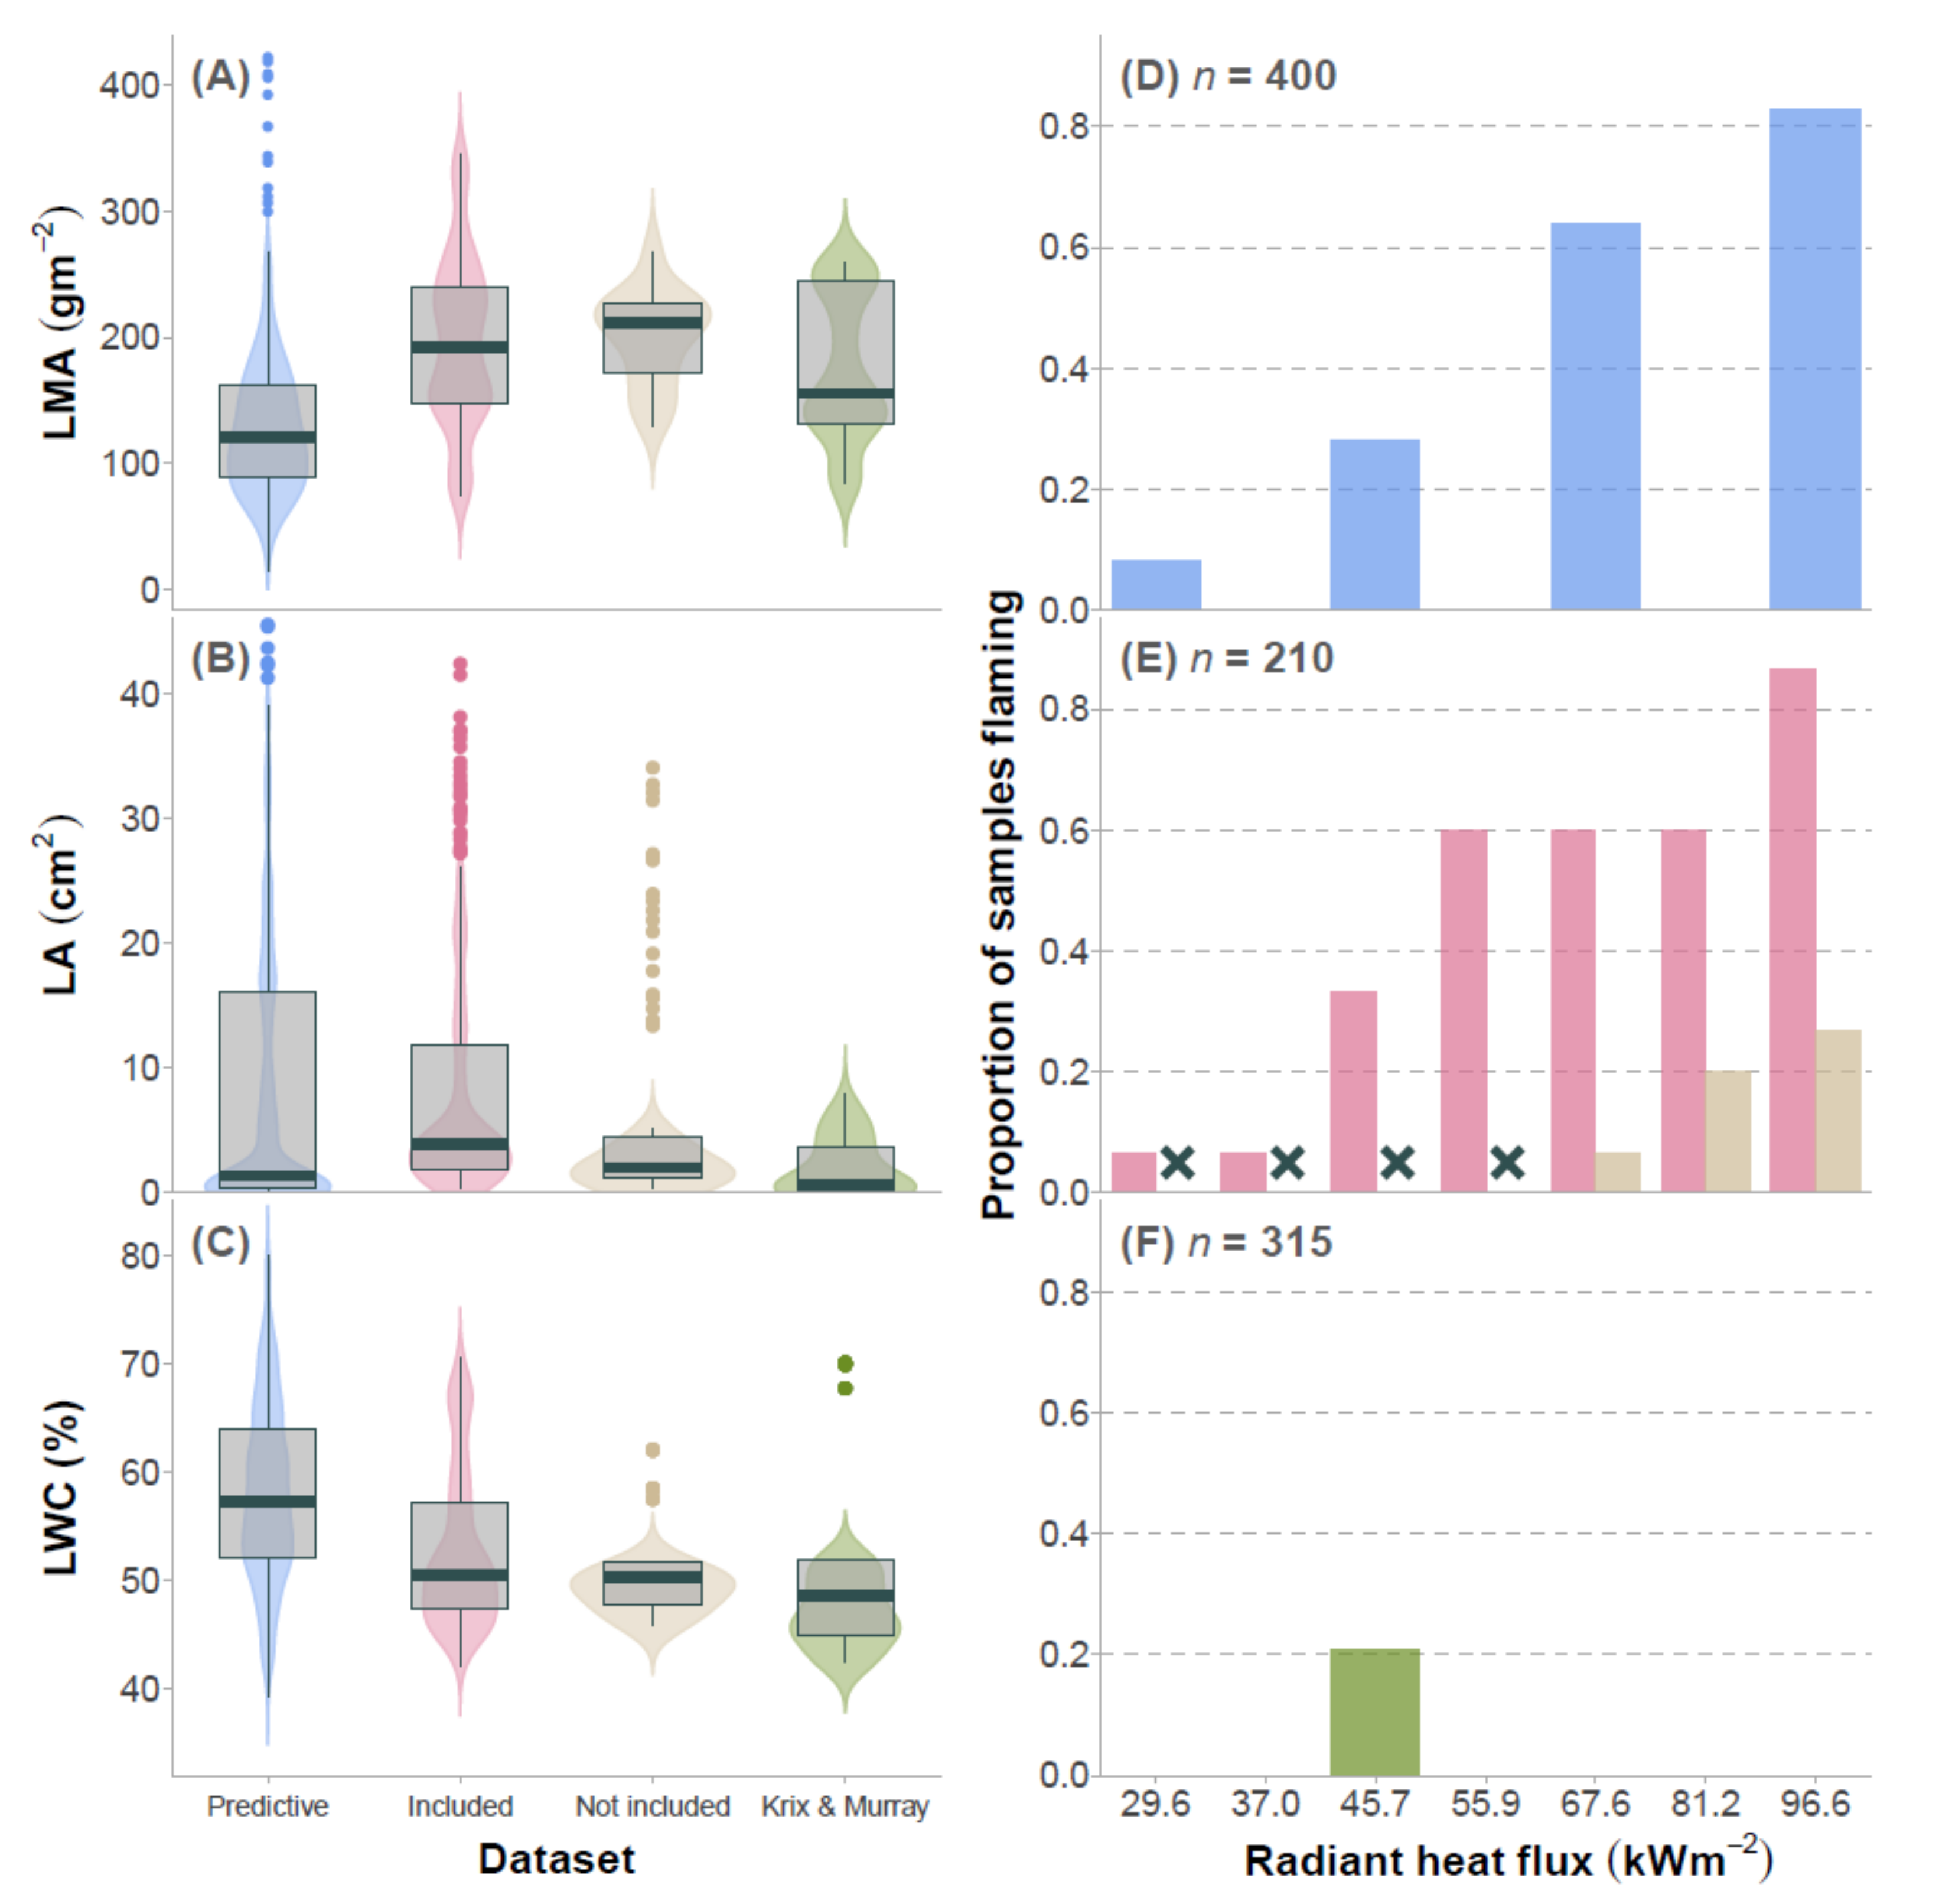
Leaf traits (LMA and LA) were broadly comparable across all datasets (model building and validation datasets; Figure 3). Patterns in the proportions of samples flaming were similar across the radiant heat flux gradient for the modelling data (Figure 3C), the species included in the modelling data in the validation data (Figure 3D), and the Krix and Murray dataset (Figure 3E), while the species not included in the modelling in the validation dataset did not flame at lower radiant heat flux levels, and flamed in lower proportion at higher radiant heat flux levels (Figure 3D). Using the leaf traits for the validation datasets, the coefficients from the logistic flaming model, and the P f l a m i n g equation were used to make predictions of leaf flaming.
Accuracy in the predictions of leaf flaming was then compared across the datasets by fitting a logistic regression model using the calculated binary accuracy of predictions as the response (one for an accurate prediction, zero for an inaccurate prediction). Terms for the dataset (four-level fixed categorical factor: modelled data, validation species included in modelling, validation species not included in modelling, Krix and Murray dataset), sample flaming behaviour (two-level fixed categorical factor: flaming present, flaming absent), and a dataset × flaming behaviour interaction term. This allowed us to test if accuracy differed among datasets, if accuracy in identification of samples which flamed or did not flame differed (true positive and true negative rates), or if there were differences among the datasets in their discriminatory value for flaming and non-flaming samples. These tests were not extended to the levels of radiant heat flux due to the small sample sizes for flaming/non-flaming replicates within levels of radiant heat flux in the validation dataset, and separation issues (where the model is unable to calculate standard errors due to all observations for a factor level being either zero or one). Differences in accuracy within radiant heat flux levels were instead compared qualitatively. Overall, this approach allowed us to test (1) the relative accuracy of the model; (2) the accuracy of the model when applied to new samples of a subset of the same species used to build the model; (3) the accuracy of the model predictions when applied to species which were not used in the modelling process; and (4) the accuracy of the model when interpolation was performed.
All analyses and graphical presentation were performed with R 4.1.0 [39].

3. Results

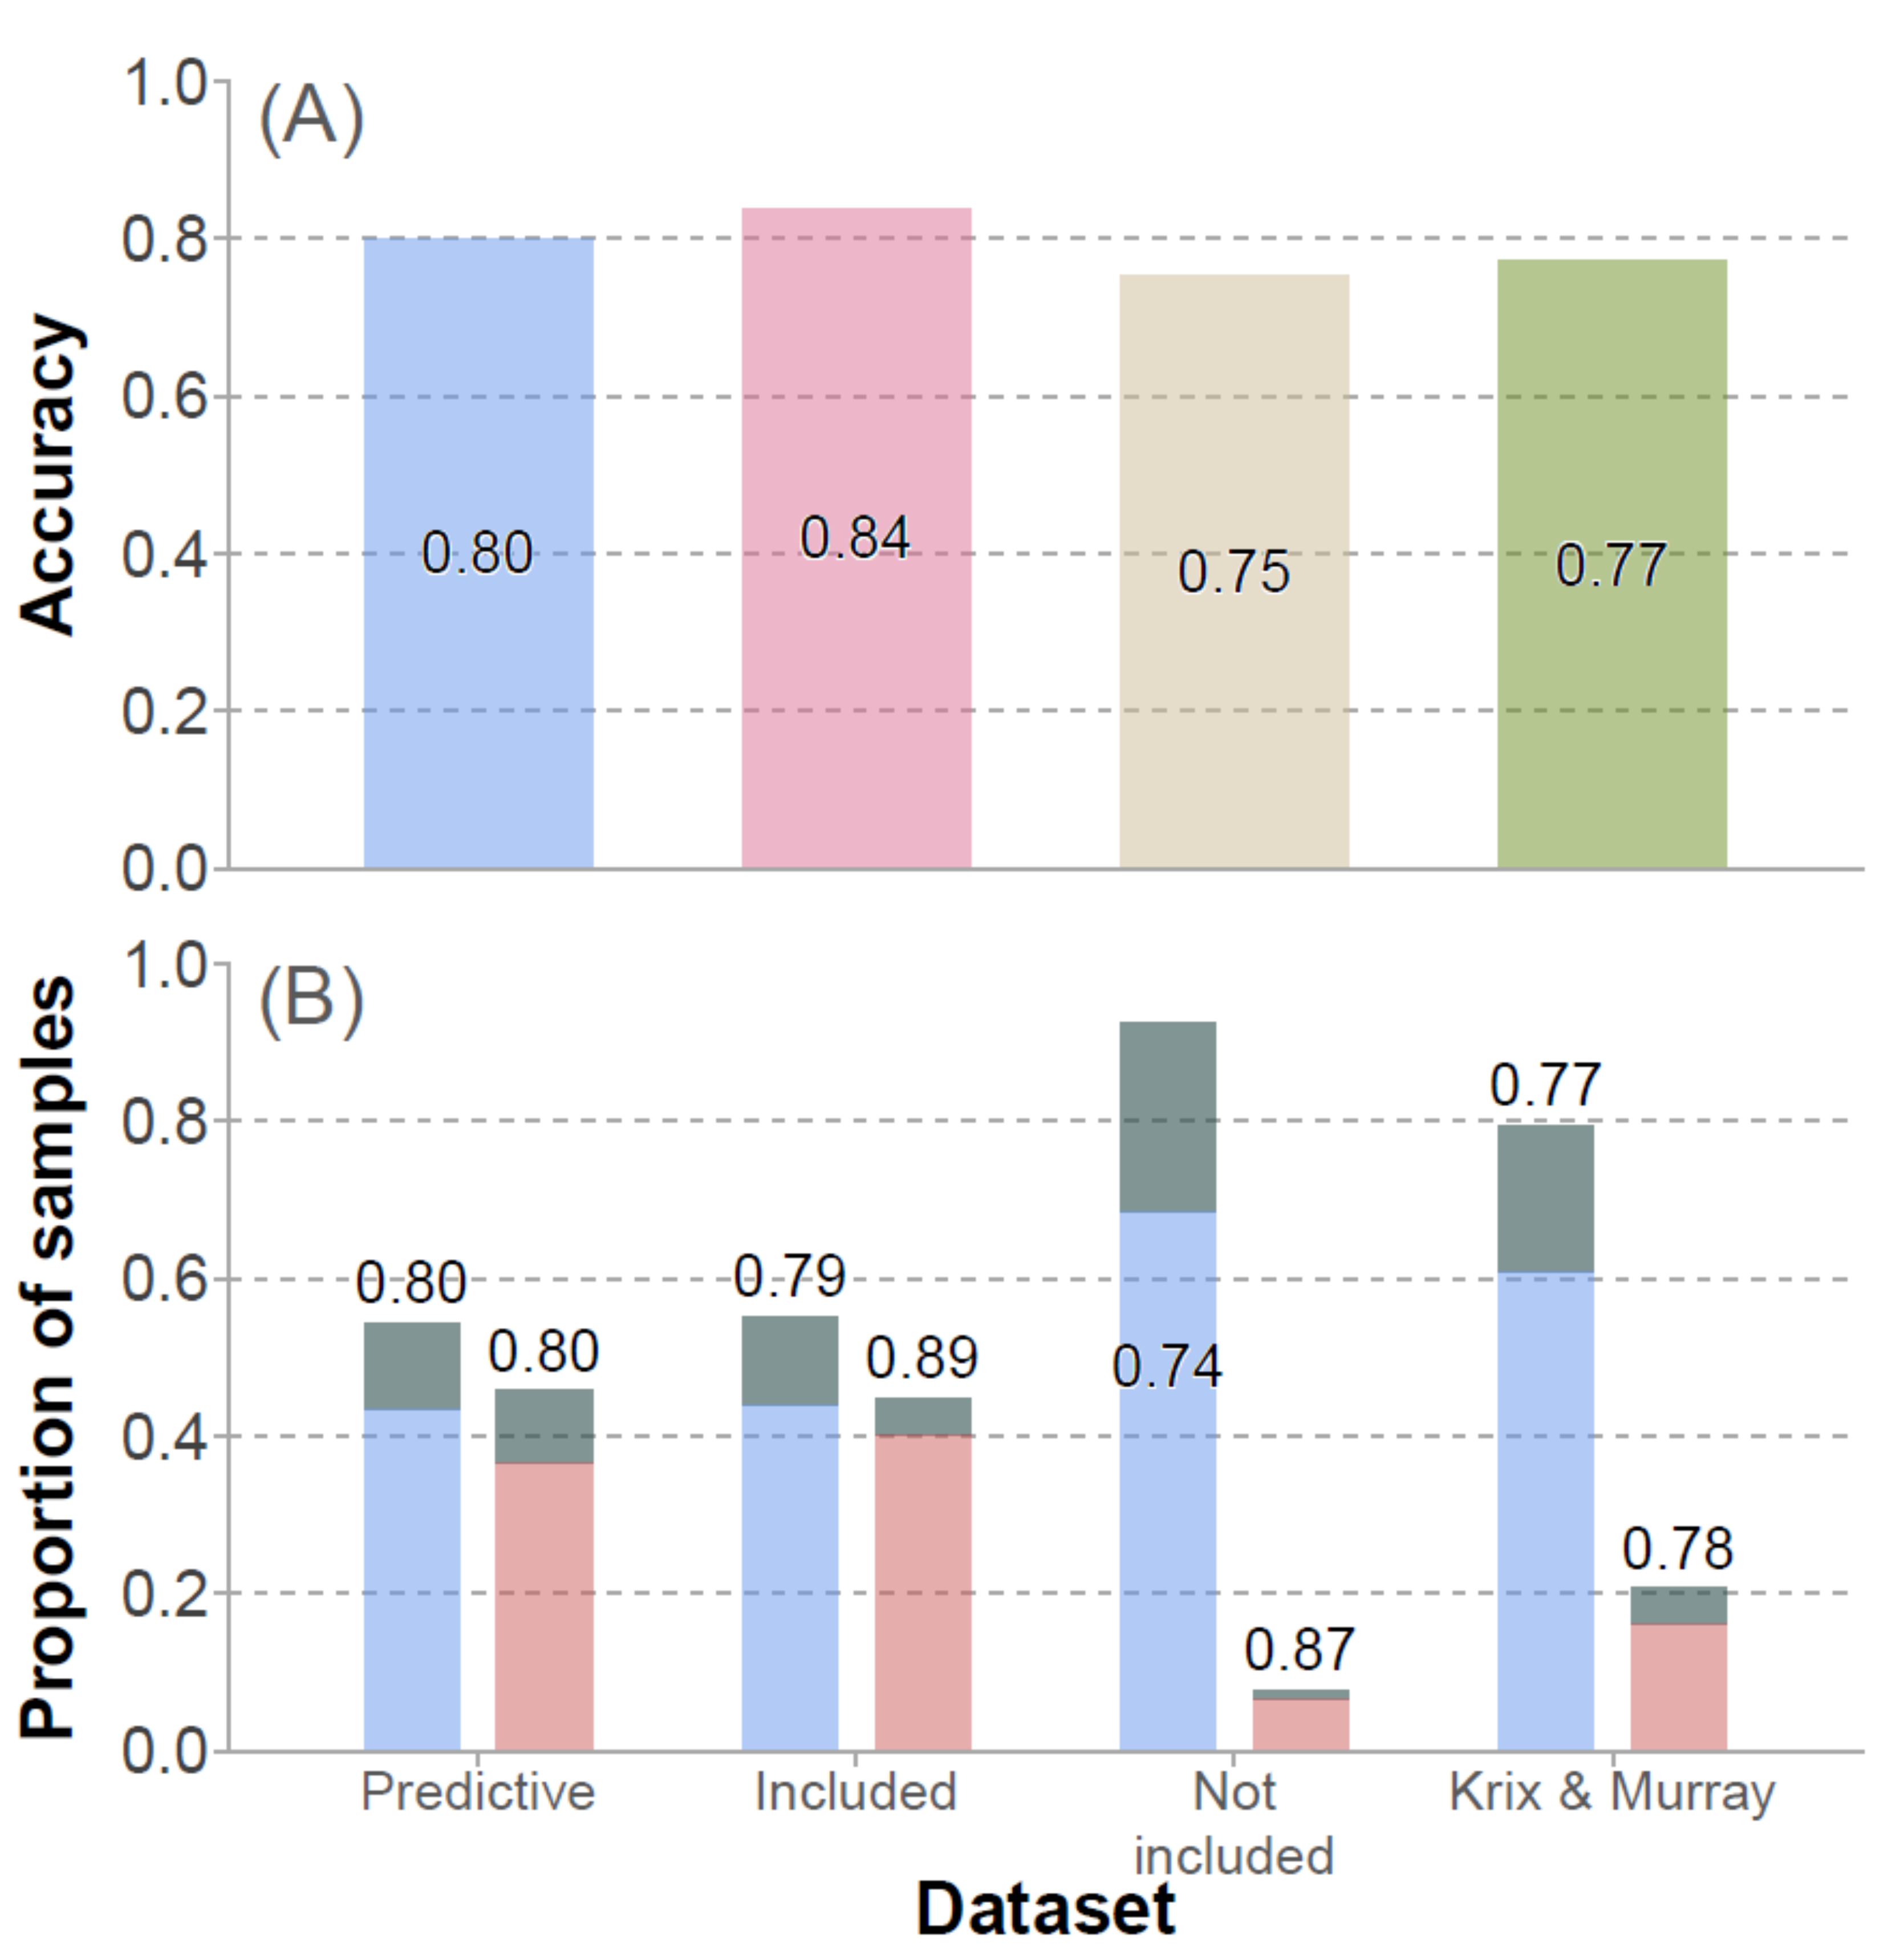
Overall accuracy for prediction of leaf flaming did not differ significantly among the datasets (χ23,921 = 2.437, P = 0.5; Figure 4A), and was balanced across the datasets in predicting both flaming and non-flaming samples (χ21,920 = 0.552, P = 0.5). No significant dataset x flaming behaviour effect was found (χ23,917 = 2.336, P = 0.5; Figure 4B), with accuracy for predicting non-flaming samples and flaming samples not differing significantly across the datasets. The largest divergence from the modelled data accuracy was for non-flaming samples in the species not included in the predictive dataset (0.74 of samples correctly predicted as non-flaming vs. 0.80 in the modelled data; Figure 4B).
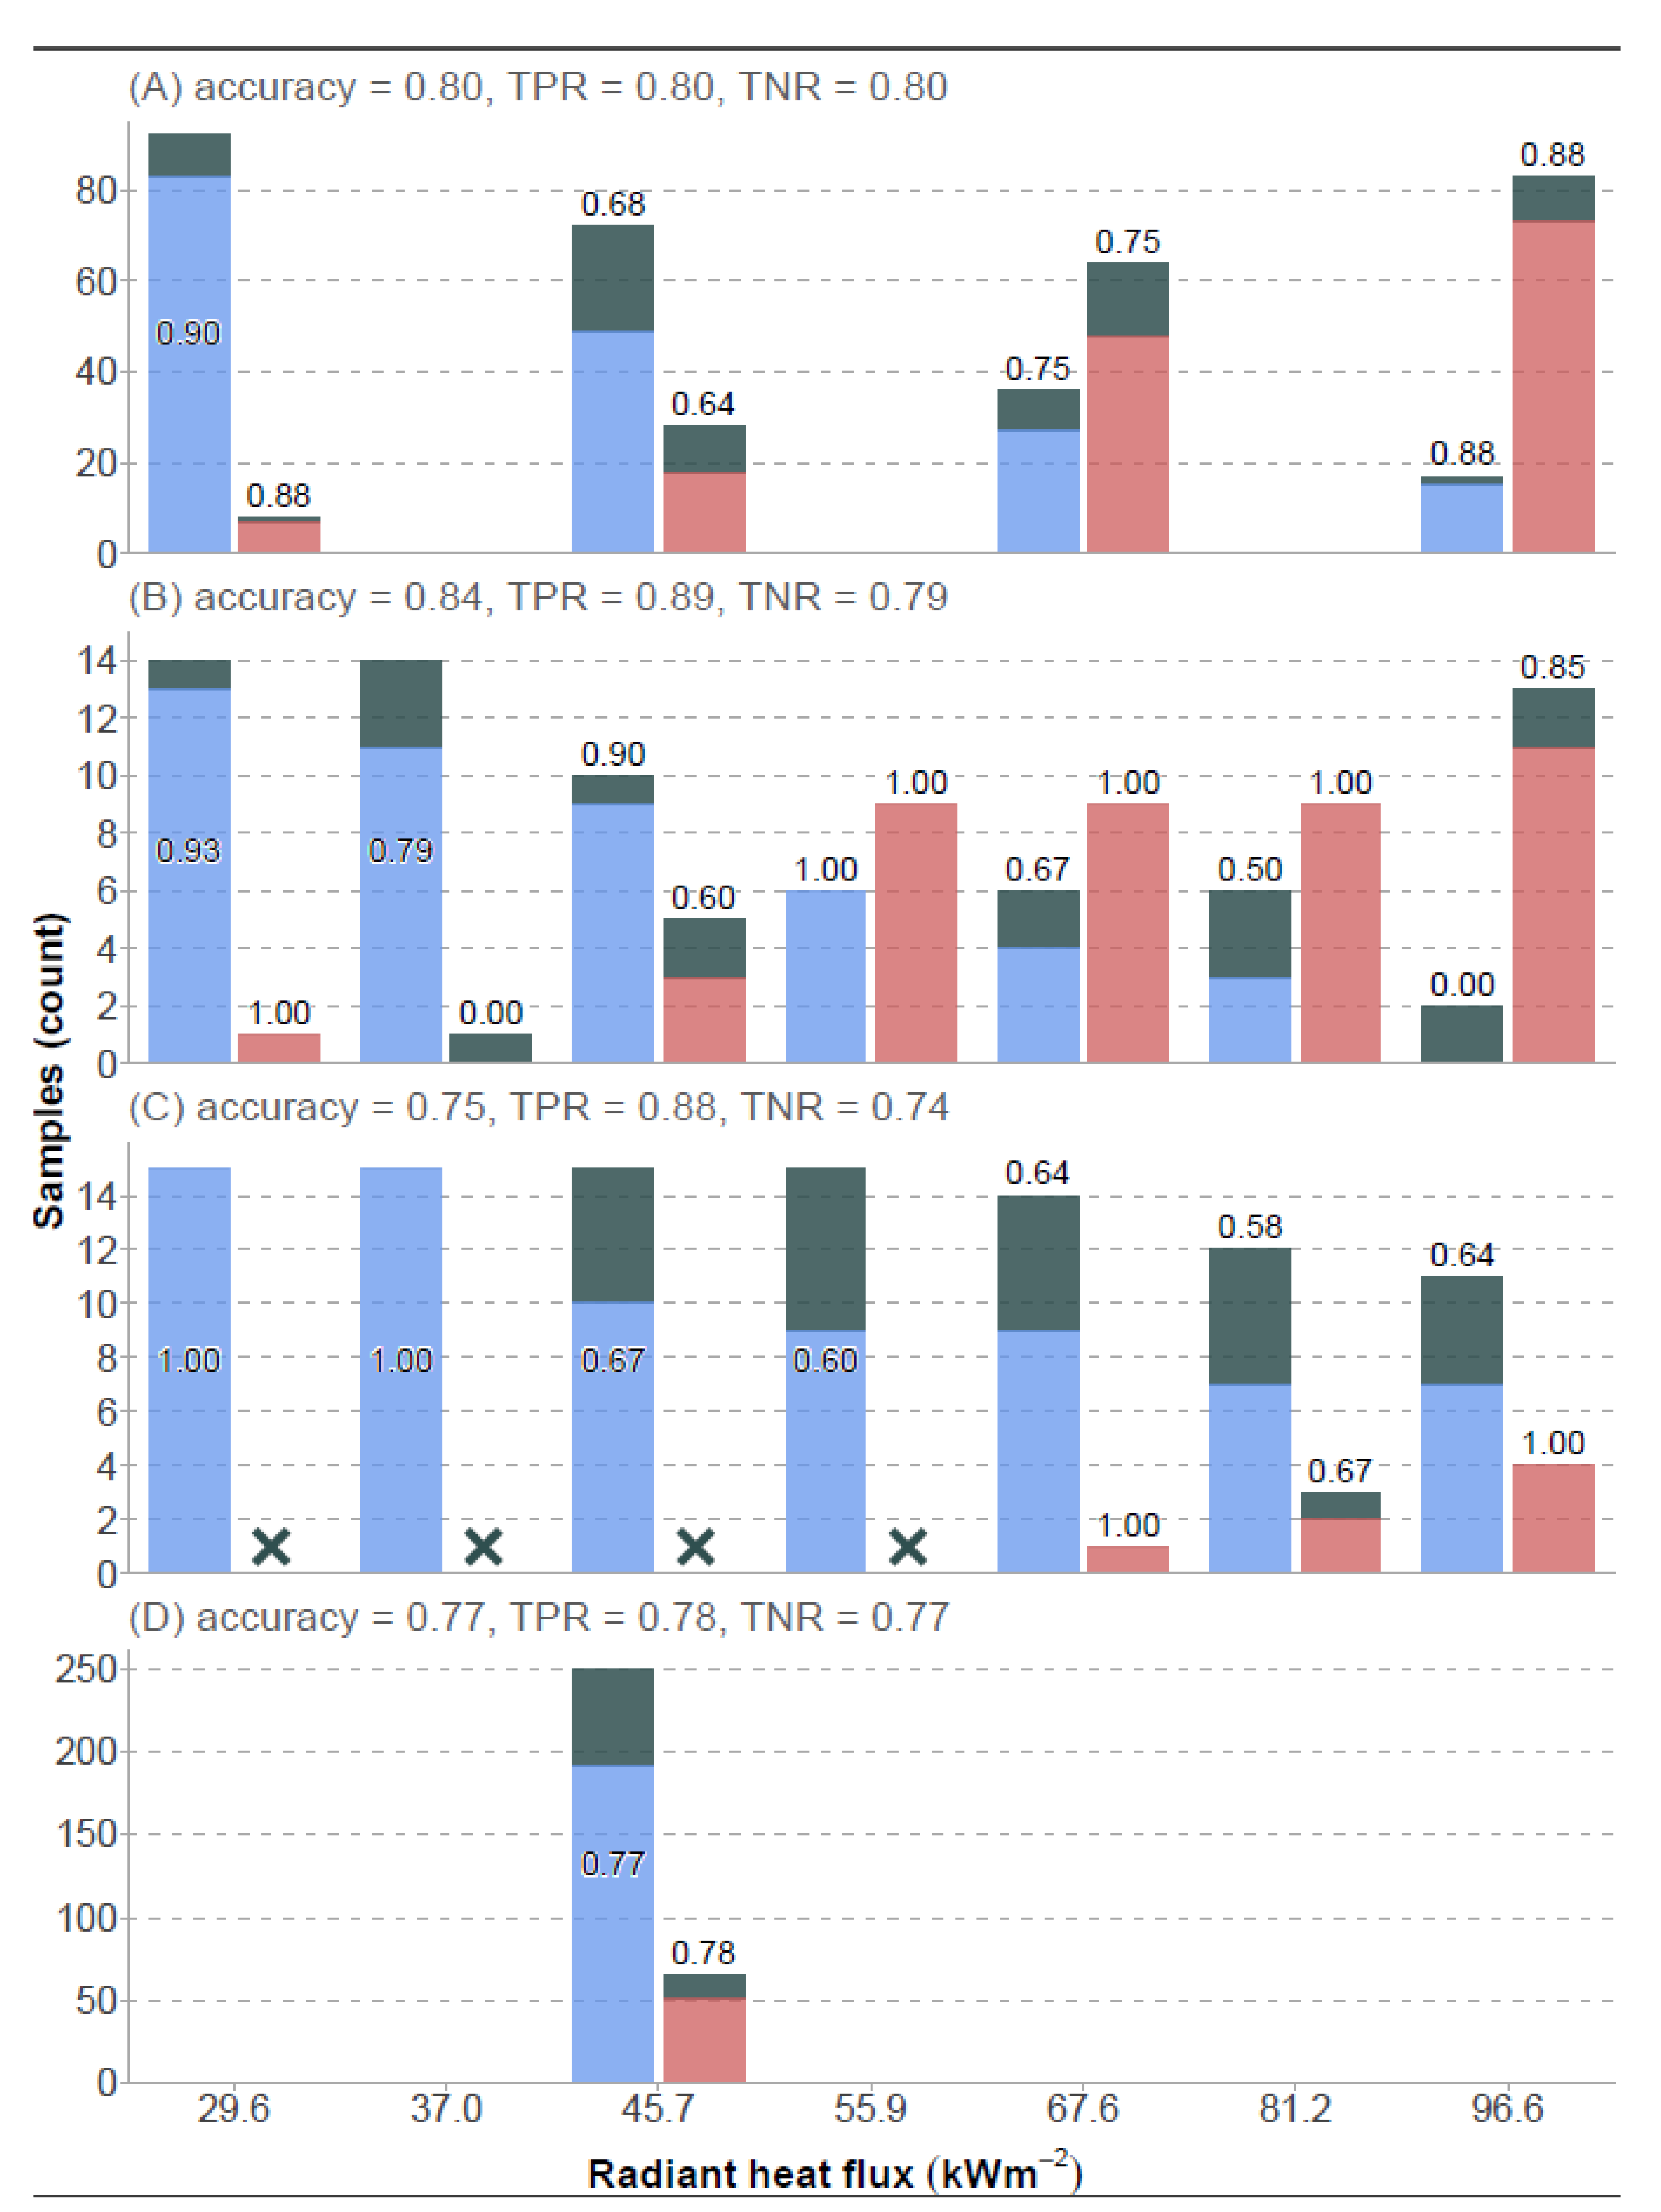
Accuracy for the predictive dataset was well above that expected by chance (Figure 5A), with the higher TPR and TNR at the extremes of the radiant heat flux gradient, and lowest at 45.7 kWm−2. Across levels of radiant heat flux, accuracy in the validation data model predictions was broadly similar to those for the predictive dataset (Figure 5B,C). Only the classification of flaming samples at 37.0 and 96.6 kWm−2 (misclassifying one and two flaming samples), falling below 50% accuracy, and identification of non-flaming samples returning 50% accuracy at 81.2 kWm−2 (representing model accuracy no better than chance; Figure 5B). The model maintained discriminatory power to identify non-flaming samples of species not included in the predictive dataset at higher temperatures (Figure 5C), and high accuracy in identifying flaming samples above 55.9 kWm−2 in the validation dataset species (Figure 5B). Interestingly, in the Krix and Murray dataset including 63 species not included in the modelling (Figure 5D), classification accuracy for both flaming and non-flaming samples was higher than that for the predictive dataset at 45.7 kWm−2 (Figure 5A).

4. Discussion

Our predictive model of leaf flaming showed a high level of performance on the validation datasets, on species not included in the modelling, and also where interpolating to radiant energy levels was not modelled directly. The two leaf traits LMA and LA were shown to be an important dimension in the prediction of leaf flaming, with their inclusion in modelling allowing discrimination among samples in prediction of leaf flaming. Taken together, LMA, LA and the interaction between radiant heat flux and LMA explained approximately the same amount of variation as did radiant heat flux overall (Figure 1). This underlines the importance of these traits, and allows the model to make accurate predictions of flaming, particularly at relatively high or low radiant heat flux. As other authors have demonstrated, strong relationships exist between leaf traits and flammability attributes [18,19,20], which supports our finding. Addition of the P f l a m i n g approach improved accuracy of the model predictions, important in correctly classifying flaming leaves at low radiant heat flux, and non-flaming leaves at high radiant heat flux. This is a crucial consideration, given that identification of non-flaming leaves at higher radiant heat flux, and flaming leaves at low radiant heat flux is the property of the model with the greatest utility, e.g., if applied to identify low-leaf-flammability plant species, or as a predictor of fire behaviour in a larger model.
Interpolation between the levels of radiant heat flux used in the predictive dataset also showed similar TPR and TNR relative to the adjacent levels of radiant heat flux in the predictive dataset. The accuracy of this model might be improved further with data on the presence of biogenic volatile organic compounds [40] in species leaves, although laboratory determination of this is likely to be time consuming [41,42,43], with direct flammability testing possibly a faster alternative to this method. A further consideration, not captured in this experimental approach, is how the flaming response of leaves within the flame plume of adjacent leaves, or leaves undergoing ember attack may be affected. If the underlying leaf trait and leaf flaming relationship found here for spontaneous flaming due to radiant heat flux hold, these differences may be minor. However, leaf volatiles in the case of leaves within the flame plume, or leaf traits such as cuticle thickness which may act as a buffer to heating of the leaf at a point source during ember attack may play a larger role in these circumstances. Further validation of this model may also be made wherever flammability testing of leaves is conducted, new data would also aid in determining other predictors which might be usefully added to the model, or groups of species whose flammability is relatively poorly modelled.
The leaf trait databases could be used to generate relative flammability ratings for both wild occurring and decorative plant species. In selection of ‘green firebreak’ species [13,32], these models could be applied to select for low-leaf-flammability species, with results from the models possibly passed on to a compound flammability rating [37]. In this application it may be most useful to score plant species on the lowest radiant heat flux that they are predicted to flame. Fire movement, particularly at lower intensities might be most affected by leaves flaming and spreading fire to adjacent leaves [12,44], or neighbouring plants. As these models may be applied for any fire intensity within the range of radiant heat flux that was tested experimentally, there may be applications in fire behaviour models which explicitly include fire intensity. Accurate predictions of which plant species leaves are likely to flame at a given fire intensity might be incorporated into current models to provide more accurate predictions of fire spread.
Application of this model to leaf trait data for plant communities will allow relative community leaf flammability at varying spatial scales to be compared. Where comprehensive data of leaf traits are available at community level, the flammability of individual canopy layers might also be estimated, and give an indication of the risk of fire moving vertically (e.g., where highly flammable shrub layers might allow low intensity surface fire to move to the canopy). As both LMA and LA are related to landscape variation in light and water availability, mapping spatial relationships between abiotic topographic factors and flammability is a further possible use of this model. Continental- or global-scale spatial analyses of patterns in leaf flammability are also possible, although defining species ranges may prove difficult.

5. Conclusions

The model we present in this paper accurately predicts whether a given leaf will flame based on two principal leaf traits (LMA, LA) and incoming radiant heat flux. Prediction accuracy was comparable between data not used in model building (75–80%) and data used to fit the model (80%). Importantly, the model accurately predicts which leaves are likely to flame at relatively low radiant heat flux and also those that are unlikely to flame at high radiant heat flux. Our model provides for the first time the ability to identify accurately high-flammability and low-flammability species on the basis of two leaf traits, which has enormous potential for increasing our understanding of plant flammability in many different systems around the world through the use of widely available databases of plant leaf traits.

Author Contributions

Conceptualization, D.W.K. and B.R.M.; methodology, D.W.K. and B.R.M.; writing—original draft preparation, D.W.K. and B.R.M.; writing—review and editing, D.W.K. and B.R.M.; visualization, D.W.K. supervision, B.R.M. All authors have read and agreed to the published version of the manuscript.

Funding

D.W.K. was supported by an Australian Government Research Training Program Scholarship.

Data Availability Statement

The data presented in this study are openly available in FigShare at https://doi.org/10.6084/m9.figshare.17148536.v1, accessed on 10 December 2021.

Acknowledgments

We thank Adeline Krix and Danny Velinski for helpful discussions on technical aspects of this study. We are also grateful to Tim Curran and Rachael Nolan for comments on an earlier version of this work.

Conflicts of Interest

The authors declare no conflict of interest.

References

  1. Petit, J.R.; Jouzel, J.; Raynaud, D.; Barkov, N.I.; Barnola, M.; Basile, I.; Bender, M.L.; Chappellaz, J.; Davis, M.L.; Delaygue, G.; et al. Climate and atmospheric history of the past 420,000 years from the Vostok ice core, Antarctica. Nature 1999, 399, 429–436. [Google Scholar] [CrossRef] [Green Version]
  2. Flannigan, M.D.; Krawchuk, M.A.; de Groot, W.J.; Wotton, B.M.; Gowman, L.M. Implications of changing climate for global wildland fire. Int. J. Wildland Fire 2009, 18, 483–507. [Google Scholar] [CrossRef]
  3. Trenberth, K.E. Changes in precipitation with climate change. Clim. Res. 2011, 47, 123–128. [Google Scholar] [CrossRef] [Green Version]
  4. Dai, A. Increasing drought under global warming in observations and models. Nat. Clim. Change 2013, 3, 52–58. [Google Scholar] [CrossRef]
  5. Dufresne, J.L.; Foujols, M.A.; Denvil, S.; Caubel, A.; Marti, O.; Aumont, O.; Balkanski, Y.; Bekki, S.; Bellenger, H.; Benshila, R.; et al. Climate change projections using the IPSL-CM5 Earth System Model: From CMIP3 to CMIP5. Clim. Dyn. 2013, 40, 2123–2165. [Google Scholar] [CrossRef]
  6. Jolly, W.M.; Cochrane, M.A.; Freeborn, P.H.; Holden, Z.A.; Brown, T.J.; Williamson, G.J.; Bowman, D.M.J.S. Climate-induced variations in global wildfire danger from 1979 to 2013. Nat. Commun. 2015, 6, 7537. [Google Scholar] [CrossRef]
  7. Goss, M.; Swain, D.L.; Abatzoglou, J.T.; Sarhadi, A.; Kolden, C.A.; Williams, A.P.; Diffenbaugh, N.S. Climate change is increasing the likelihood of extreme autumn wildfire conditions across California. Environ. Res. Lett. 2020, 15, 094016. [Google Scholar] [CrossRef] [Green Version]
  8. Pechony, O.; Shindell, D.T. Driving forces of global wildfires over the past millennium and the forthcoming century. Proc. Natl. Acad. Sci. USA 2010, 107, 19167–19170. [Google Scholar] [CrossRef] [Green Version]
  9. Westerling, A.L.; Bryant, B.P.; Preisler, H.K.; Holmes, T.P.; Hidalgo, H.G.; Das, T.; Shrestha, S.R. Climate change and growth scenarios for California wildfire. Clim. Chang. 2011, 109, 445–463. [Google Scholar] [CrossRef]
  10. Krawchuk, M.A.; Moritz, M.A.; Parisien, M.A.; Van Dorn, J.; Hayhoe, K. Global Pyrogeography: The Current and Future Distribution of Wildfire. PLoS ONE 2009, 4, e5102. [Google Scholar] [CrossRef] [PubMed]
  11. Nolan, R.H.; Sinclair, J.; Waters, C.M.; Mitchell, P.J.; Eldridge, D.J.; Paul, K.I.; Roxburgh, S.; Butler, D.W.; Ramp, D. Risks to carbon dynamics in semi-arid woodlands of eastern Australia under current and future climates. J. Environ. Manag. 2019, 235, 500–510. [Google Scholar] [CrossRef] [PubMed]
  12. Zylstra, P.; Bradstock, R.A.; Bedward, M.; Penman, T.D.; Doherty, M.D.; Weber, R.O.; Gill, A.M.; Cary, G.J. Biophysical mechanistic modelling quantifies the effects of plant traits on fire severity: Species, not surface fuel loads, determine flame dimensions in eucalypt forests. PLoS ONE 2016, 11, e0160715. [Google Scholar] [CrossRef] [Green Version]
  13. Curran, T.J.; Perry, G.L.W.; Wyse, S.V.; Alam, M.A. Managing fire and biodiversity in the wildland-urban interface: A role for green firebreaks. Fire 2018, 1, 3. [Google Scholar] [CrossRef] [Green Version]
  14. Cui, X.; Alam, M.A.; Perry GLb Paterson, A.M.; Wyse, S.V.; Curran, T.J. Green firebreaks as a management tool for wildfires: Lessons from China. J. Environ. Manag. 2019, 233, 329–336. [Google Scholar] [CrossRef] [PubMed]
  15. Poorter, H.; Niinemets, U.; Poorter, L.; Wright, I.J.; Villar, R. Causes and consequences of variation in leaf mass per area (LMA. New Phytol. 2009, 182, 565–588. [Google Scholar] [CrossRef]
  16. Reich, P.B. The world-wide ‘fast–slow’ plant economics spectrum: A traits manifesto. J. Ecol. 2014, 102, 275–301. [Google Scholar] [CrossRef]
  17. Wright, I.J.; Reich, P.B.; Westoby, M.; Ackerly, D.D.; Baruch, Z.; Bongers, F.; Cavender-Bares, J.; Chapin, T.; Cornelissen, J.H.C.; Diemer, M.; et al. The worldwide leaf economics spectrum. Nature 2004, 428, 821–827. [Google Scholar] [CrossRef]
  18. Gill, A.M.; Moore, P.H.R. Ignitability of Leaves of Australian Plants; CSIRO Plant Industry: Canberra, Australia, 1996. [Google Scholar]
  19. Murray, B.R.; Hardstaff, L.K.; Phillips, M.L. Differences in leaf flammability, leaf traits and flammability-trait relationships between native and exotic plant species of dry sclerophyll forest. PLoS ONE 2013, 8, e79205. [Google Scholar] [CrossRef] [PubMed] [Green Version]
  20. Grootemaat, S.I.; Wright, J.; van Bodegom, P.M.; Cornelissen, J.H.C.; Cornwell, W.K. Burn or rot: Leaf traits explain why flammability and decomposability are decoupled across species. Funct. Ecol. 2015, 29, 1486–1497. [Google Scholar] [CrossRef] [Green Version]
  21. Krix, D.W.; Murray, B.R. Landscape variation in plant leaf flammability is driven by leaf traits responding to environmental gradients. Ecosphere 2018, 9, e02093. [Google Scholar] [CrossRef]
  22. Prince, D.; Shen, C.; Fletcher, T. Semi-empirical Model for Fire Spread in Shrubs with Spatially-Defined Fuel Elements and Flames. Fire Technol. 2017, 53, 1439–1469. [Google Scholar] [CrossRef]
  23. Tumino, B.J.; Duff, T.J.; Goodger, J.Q.D.; Cawson, J.G. Plant traits linked to field-scale flammability metrics in prescribed burns in Eucalyptus forest. PLoS ONE 2019, 14, e0223401. [Google Scholar]
  24. Burton, J.E.; Cawson, J.G.; Filkov, A.I.; Penman, T.D. Leaf traits predict global patterns in the structure and flammability of forest litter beds. J. Ecol. 2021, 109, 1344–1355. [Google Scholar] [CrossRef]
  25. Zylstra, P.; Liow, L.H. Linking fire behaviour and its ecological effects to plant traits, using FRaME in R. Methods Ecol. Evol. 2021, 12, 1365–1378. [Google Scholar] [CrossRef]
  26. Reich, P.B.; Walters, M.B.; Ellsworth, D.S. Leaf life span in relation to leaf, plant and stand characteristics among diverse ecosystems. Ecol. Monogr. 1992, 62, 365–392. [Google Scholar] [CrossRef]
  27. Weiher, E.; Van Der Werf, A.; Thompson, K.; Roderick, M.; Garnier, E.; Eriksson, O. Challenging Theophrastus: A common core list of plant traits for functional ecology. J. Veg. Sci. 1999, 10, 609–620. [Google Scholar] [CrossRef]
  28. Vendramini, F.; Díaz, S.; Gurvich, D.E.; Wilson, P.J.; Thompson, K.; Hodgson, J.G. Leaf traits as indicators of resource-use strategy in floras with succulent species. New Phytol. 2002, 154, 147–157. [Google Scholar] [CrossRef]
  29. Ordonez, A.; Olff, H. Do alien plant species profit more from high resource supply than natives? A trait-based analysis. Glob. Ecol. Biogeogr. 2013, 22, 648–658. [Google Scholar] [CrossRef] [Green Version]
  30. Brouillette, L.C.; Mason, C.M.; Shirk, R.Y.; Donovan, L.A. Adaptive differentiation of traits related to resource use in a desert annual along a resource gradient. New Phytol. 2014, 201, 1316–1327. [Google Scholar] [CrossRef] [PubMed]
  31. Kattge, J.; Diaz, S.; Lavorel, S.; Prentice, I.C.; Leadley, P.; Bönisch, G.; Garnier, E.; Westoby, M.; Reich, P.B.; Wright, I.J.; et al. TRY—A global database of plant traits. Glob. Change Biol. 2011, 17, 2905–2935. [Google Scholar] [CrossRef]
  32. Murray, B.R.; Martin, L.J.; Brown, C.; Krix, D.W.; Phillips, M.L. Selecting low-flammability plants as green firebreaks within sustainable urban garden design. Fire 2018, 1, 15. [Google Scholar] [CrossRef] [Green Version]
  33. Wotton, M.B.; Gould, J.S.; McCaw, L.W.; Cheney, P.N.; Taylor, W.S. Flame temperature and residence time of fires in dry eucalypt forest. Int. J. Wildland Fire 2011, 21, 270–281. [Google Scholar] [CrossRef]
  34. Popovic, Z.; Bojovic, S.; Markovic, M.; Cerdà, A. Tree species flammability based on plant traits: A synthesis. Sci. Total Environ. 2021, 800, 149625. [Google Scholar] [CrossRef] [PubMed]
  35. Hammill, K.; Tasker, E. Vegetation, Fire and Climate Change in the Greater Blue Mountains World Heritage Area; Department of Environment, Climate Change and Water: Sydney, NSW, Australia, 2010. [Google Scholar]
  36. Schneider, C.A.; Rasband, W.S.; Eliceiri, K.W. NIH Image to ImageJ: 25 years of image analysis. Nat. Methods 2012, 9, 671–675. [Google Scholar] [CrossRef] [PubMed]
  37. Pérez-Harguindeguy, N.; Díaz, S.; Garnier, E.; Lavorel, S.; Poorter, H.; Jaureguiberry, P.; Bret-Harte, M.S.; Cornwell, W.K.; Craine, J.M.; Gurvich, D.E.; et al. New handbook for standardised measurement of plant functional traits worldwide. Aust. J. Bot. 2013, 61, 167–234. [Google Scholar] [CrossRef]
  38. Gubareff, G.G.; Janssen, J.E.; Torborg, R.H. Thermal Radiation Properties Survey; Honeywell Research Centre: Minneapolis, MN, USA, 1960. [Google Scholar]
  39. R Core Team. R: A Language and Environment for Statistical Computing; R Foundation for Statistical Computing: Vienna, Austria; Available online: https://www.R-project.org/ (accessed on 10 December 2021).
  40. Della Rocca, G.; Madrigal, J.; Marchi, E.; Michelozzi, M.; Moya, B.; Danti, R. Relevance of terpenoids on flammability of Mediterranean species: An experimental approach at a low radiant heat flux. iForest 2017, 10, 766–775. [Google Scholar] [CrossRef] [Green Version]
  41. Llusià, J.; Peñuelas, J.; Alessio, G.A.; Estiarte, M. Seasonal contrasting changes of foliar concentrations of terpenes and other volatile organic compound in four dominant species of a Mediterranean shrubland submitted to a field experimental drought and warming. Physiol. Plant. 2006, 127, 632–649. [Google Scholar] [CrossRef]
  42. McKiernan, A.B.; Hovenden, M.J.; Brodribb, T.J.; Potts, B.M.; Davies, N.W.; O’Reilly-Wapstra, J.M. Effect of limited water availability on foliar plant secondary metabolites of two eucalyptus species. Environ. Exp. Bot. 2014, 105, 55–64. [Google Scholar] [CrossRef]
  43. Pausas, J.G.; Alessio, G.A.; Moreira, B.; Segarra-Moragues, J.G. Secondary compounds enhance flammability in a Mediterranean plant. Oecologia 2016, 180, 103–110. [Google Scholar] [CrossRef] [PubMed] [Green Version]
  44. Bradstock, R.A.; Gill, A.M. Fire in semi-arid, mallee shrublands: Size of flames from discrete fuel arrays and their role in the spread of fire. Int. J. Wildland Fire 1993, 3, 3–12. [Google Scholar] [CrossRef]
Figure 1. Odds ratios for scaled and centered predictor data for the initial model containing all terms (A), and the reduced model with the lowest BIC. The order of the terms dropped from the model is shown in (A) in grey text, next to the resultant BIC after dropping a given term and terms before it. In (B), the grey text shows the BIC resulting from dropping a given term.
Forests 13 00152 g001
Figure 2. Classification accuracy for non-flaming leaves (blue shaded probability densities and boxplots) and flaming leaves (red shaded probability densities and boxplots). In (A), a 0.50 decision value is shown as a broken line, with shaded blue and red areas indicating correct predictions. In (B), the Weibull function fitted to the selected decision values is shown with the function presented at top. In (C), the model-predicted values for P f l a m i n g from the Weibull function are shown as a broken line with the model predictions. In both (A,C), the non-flaming leaves below the broken line and the flaming leaves above the broken line are correctly predicted.
Forests 13 00152 g002
Figure 3. Plots comparing LMA (A), LA (B), LWC (C) and the proportion of flaming samples across the predictive (D), the first validation dataset (E), and the Krix and Murray dataset (F). In (E), the bars are coloured by species included (pink) or not included (brown) in the predictive dataset, with crosses indicating no flaming samples at a given level of radiant heat flux. Colours in D-F match the colours distinguishing the datasets in A-C.
Forests 13 00152 g003
Figure 4. (A) Overall accuracy of predictions for leaf flaming behaviour for the predictive and validation datasets (coloured by dataset) and (B) classification accuracy for samples which flamed and did not by dataset. In (B), bars to the left of the x-axis divisions show the proportion of non-flaming samples, and bars to the right show the proportion of flaming samples. The blue and red shaded sections of these bars indicate the proportions of samples which were correctly predicted, dark shaded sections indicate incorrectly classified samples. Numbers above or within bars indicate the proportion of samples correctly predicted.
Forests 13 00152 g004
Figure 5. Classification accuracy by radiant heat flux level for the predictive dataset (A), the species included (B), the species not included in the predictive dataset (C) and the Krix and Murray dataset (D). Bars to the left of the x-axis divisions show the counts of non-flaming samples, and flaming samples to the right. The blue and red shaded sections of these bars indicate the counts of samples which were correctly predicted, dark shaded sections indicate incorrectly classified samples. Numbers above or within bars indicate the proportion of samples correctly predicted.
Forests 13 00152 g005
Publisher’s Note: MDPI stays neutral with regard to jurisdictional claims in published maps and institutional affiliations.