Article

Tree Species Drive the Diversity of Epiphytic Bryophytes in the Alpine Forest Ecosystem: A Case Study in Tibet

1
College of Resources and Environmental Sciences, China Agricultural University, Beijing 100193, China
2
Beijing Key Laboratory of Biodiversity and Organic Farming, China Agricultural University, Beijing 100193, China
3
Institute of Tibet Plateau Ecology, Tibet Agricultural & Animal Husbandry University, Nyingchi 860000, China
4
Resources & Environment College, Tibet Agriculture & Animal Husbandry University, Nyingchi 860000, China
5
Key Laboratory of Forest Ecology in Tibet Plateau, Tibet Agricultural & Animal Husbandry University, Ministry of Education, Nyingchi 860000, China
*
Author to whom correspondence should be addressed.
Forests 2022, 13(12), 2154; https://doi.org/10.3390/f13122154
Submission received: 2 November 2022 / Revised: 8 December 2022 / Accepted: 11 December 2022 / Published: 15 December 2022
(This article belongs to the Special Issue Biomonitoring with Lichens and Mosses in Forests)

Abstract

:
Epiphytic bryophytes can maintain water, recycle nutrients, and provide habitats for many other organisms in the forest ecosystem. Describing the spatial change of epiphytic bryophytes plays an important role in understanding the potential factors of diversity distribution. The study aimed to determine the influence of environmental factors on their diversity and assemblage in the alpine forest ecosystem of Sygera Mountain. We considered 72 trees, taking into account 1152 quadrats to research the study. Our results showed bryophyte richness first exhibited a hump-shaped pattern and then increased along elevation, reaching a peak at 3500 m. The richness of the eastern aspect was higher than that of the west. Diversity of Quercus semecarpifolia was the highest. There was significant variation among elevations of bryophytes assemblages, especially for the biotopes at 3900 m and 4100 m. The differences among bryophytes assemblages on aspects and tree species were less apparent. Diameter at breast height and elevation influenced assemblage composition. Elevation, tree species, and tree properties drive the diversity of epiphytic bryophytes, and tree species were significantly related to the variation in the diversity of bryophytes. These results are helpful for understanding the relationship between the spatial distribution pattern of bryophytes and the environment.

1. Introduction

Understanding the ecological processes and mechanisms of biodiversity is a matter of great interest to ecologists [1]. The factors that caused patterns of species richness and the changes between different environments and groups are still under debate [2,3], especially in the research of bryophytes. As the second largest group of higher plants, bryophytes have more than 20 000 species recorded worldwide [4]. The bryophytes are very sensitive to environmental changes due to their simple structure. Most bryophytes have leaves with a single layer of cells, which can make them take up water and nutrients from their surface directly [5].
More than 6100 species of epiphytic bryophytes are distributed from northern forests in the northern hemisphere to temperate forests in the southern hemisphere [6,7,8]. Epiphytic bryophytes play an essential role in ecosystem processes, maintaining local water balance and atmospheric humidity, recycling nutrients, and fostering ecological interactions by providing food sources and habitats for many other organisms [9]. Although the biomass of epiphytic bryophytes is small, they contribute a considerable part to forest biodiversity [10] and have been widely used as indicators of forest continuity and naturalness in forest ecosystems [11].
Focusing on patterns of species richness along elevational gradients is an important issue. Elevations will cause changes in temperature and precipitation. Different types of bryophytes respond differently to temperature and precipitation [12]. Epiphytic bryophytes usually show tolerance over a wide temperature range, and some species can grow in a low-temperature environment at high elevations [13]. Precipitation is also an essential factor for their diversity [5]. Many species of bryophytes can thrive under the harshest conditions because of their physiological tolerance to desiccation [7]. Several studies have examined the pattern of bryophyte species diversity and distribution in relation to elevation. As with many other groups, four distribution patterns have been reported: (a) a monotonic decrease [14], (b) a monotonic increase [15], (c) a hump-shaped distribution with high richness at mid-elevation (the hump-shaped pattern is the most commonly reported) [16], and (d) multimodality [17]. The length of an elevational gradient can affect the observed pattern of species richness. Even though factors associated with these species’ distribution patterns vary from study to study, it is generally agreed that bryophyte diversity peaks at the elevation have optimum environmental conditions, including suitable microclimate and substrate [9,15].
Stand and tree factors also influence the diversity and species composition of epiphytic bryophytes [18]. At the stand scale, canopy openness, shrub layer, and vertical structure of the canopy modify microhabitat and substrate diversity, indirectly affecting epiphytic bryophytes [19]. The continuity of the forest stands, and the available substrates is a determinant for many dispersal-limited species [11]. Tree-level variables are also critical in explaining the composition and richness of epiphytic bryophyte species [20]. This host preference of epiphytes was mainly explained by the different acidity, nutrient content, tree age and diameter of tree [21,22,23]. While tree species are discrete, nominal factors for epiphyte assemblages, the physical and chemical properties of different bark types show continuous transitions on a larger spatial and temporal scale. These vary considerably even within a species depending on site fertility, humidity, solar radiation, temperature, and precipitation [24,25,26].
The Tibetan Plateau has been called the roof of the world and is also one of the most sensitive regions to global change. Climate conditions change over very short spatial distances, leading to a significant variation of environmental factors such as temperature, precipitation, light, and soil [27]. Tree species change rapidly along the environmental gradient, shaping the rich forest types, making Tibet an ideal zone for studying the response of epiphytic bryophytes to the climate [28]. Some studies focus on the relationship between bryophytes and the environment in Tibet [29,30], but few focus on epiphyte bryophytes [31]. Therefore, this study aimed to investigate (1) how the diversity of epiphytic bryophytes change along the environmental gradient, and (2) what are the main factors affecting the diversity and distribution pattern of epiphytic bryophytes.

2. Materials and Methods

2.1. Study Area

The study area, located on Sygera Mountain in the southeastern Tibetan Plateau, China, approximately between 29°30’–29°50’N and 94°30’–94°54’E, is part of the Nyainqentanglha Mountains. Sygera Mountain was carved by the Niyang River and Parlung Zangbo River (two branches of the Yarlung Zangbo River), which created very steep terrain with a mean aspect of 28° in this region adjacent to the Yarlung Zangbo Grand Canyon. This region features steep mountains and a mean elevation of 3540 m. Affected by the Indian Ocean monsoon, rainfall is abundant in the summer half of the year but is much less abundant in the winter half of the year, leading to a humid and semi-humid subalpine cool climate with distinct wet and dry seasons. The moist air mass infiltrates the east aspect with a steep canyon zone. The light and heat conditions of the west aspect are more than those of the east aspect, but the precipitation, relative humidity and frost-free period of the east aspect are more than the west aspect [28].
The natural forest area within 3100–4100 m elevation was selected for the research. The natural vegetation composition varieties transition from deciduous broad-leaved forest to mountainous temperate coniferous forest, subalpine dark coniferous boreal forest, and boreal alpine shrub with increasing elevation. The dominant trees in the study area are Betula utilis, Quercus semecarpifolia, Abies georgei var. smithii, and Picea linzhiensis, etc. [28].

2.2. Sampling and Identification

Bryophyte field surveys and collections were carried out in Sygera Mountain in August 2017 and July 2019. We use a hierarchical nesting design to sample bryophytes on six elevations (around 3100 m, 3300 m, 3500 m, 3700 m, 3900 m, and 4100 m, Figure 1). Within each elevation, a 20 × 30 m plot was set on the southeast (east) and northwest (west) aspects (Table 1). Six trees (3 were common tree species, and 3 were other tree species) were selected on a sample plot. So, these can have a more comprehensive understanding of the epiphytes at the elevation. Because the trees had a rounded surface, we chose trees with a diameter at breast height slightly longer than the length of the quadrat side to not let the adjacent samples have overlapping parts, calculate the cover exactly in the sample quadrats and make the sampling as reasonable as possible. Therefore, we can get the relationship between diameter at breast height and diversity at a particular range. Epiphytic bryophytes were sampled in 100 cm2 (10 × 10 cm quadrats), positioned in four directions (east, south, west, and north) in four height locations (0 m as the baseline, 0.5 m, 1.0 m, and 1.5 m) on trees. Total bryophyte cover (%) was estimated for each quadrat. In total, 16 quadrats (1600 cm2) per tree were sampled. A total of 1152 quadrats of bryophytes on 72 trees were collected. All specimens were deposited in the herbarium of China Agricultural University (BAU).

2.3. Environmental Variables

According to previous studies, epiphytes were mainly explained by the physical and chemical properties of different bark [21,22,23]. This work measured tree nitrogen of barks, pH, diameter at breast height, and bark roughness grade [32] for 72 trees.
We used the shore hardness tester to determine the bark roughness grade. The bark sample was air-dried at room temperature and then cleaned from epiphytes with a brush. For the determination of bark pH, the bark of four locations of each tree was mixed in equal amounts, crushed with a crusher, sieved through a 2.0 mm mesh, weighed 1 g, added 50 mL of deionized water, shaken on a shaker at 210 r/min for 30 min, and left for 48 h before being measured with a pH meter [33]. For the determination of the total nitrogen content of bark, about 50 g of bark samples were crushed with a pulverizer and sieved, and then total nitrogen was determined by Kjeldahl method [34].
The selected environmental correlations were all less than 0.7 to avoid covariance problems (Figure S1).

2.4. Data Analyses

Species accumulation curves were built using 10 × 10 cm quadrats with 95% confidence intervals to assess the completeness of sampling effort or sampling completeness based on the richness.
We determined the relative importance of the environmental factors for the diversity of all bryophytes, mosses, and liverworts across the 72 trees, respectively, using mixed effects models [35]. In these models, elevation, aspect, tree species, nitrogen, pH, diameter at breast height, and bark roughness grade were fixed factors, and the site of 72 trees was fitted as a random factor (The R package “lme4”, “lmerTest”, “glmm.hp”, “ade4” were used) [36,37,38,39].
Cluster analysis was based on the Bray–Curtis similarity coefficient, using the furthest neighbor sorting calculated on the coverage of bryophyte species to identify if distinct groupings of species occurred within the 72 trees.
Non-metric multidimensional scaling (NMDS) was used to compare the differences in epiphytic bryophyte assemblage composition among different elevations, aspects, tree species and bryophyte assemblage classes (the adonis and metaMDS functions via the “vegan” package). The species-site matrix was hellinger-transformed before the analysis. We calculated 95% confidence ellipses around barycenters to show quadrats “typical” of elevations, aspects, tree species, and classes (the function stat_conf_ellipse from the package “ggpubr”) [40]. Analyses of similarity (ANOSIM) of the Bray–Curtis distance based on 999 permutations were used to compare the dissimilarities between bryophyte assemblage composition on elevations, aspects, and tree species (the “anosim” function via the “vegan” package) [41].
The Canonical Correlation Analysis (CCA) was used to examine the correlation between bryophyte assemblages and environment (the function cca via the “vegan” package) [41]. We computed pairwise distances between each environmental factor (including elevation, tree nitrogen of barks, pH, diameter at breast height, and bark roughness grade). Partial mantel correlations (9999 permutations) were computed to identify the relationship between bryophyte assemblage composition and environmental factors (the “ggcor” package).

3. Results

3.1. Diversity of Bryophytes

Extensive sampling efforts were conducted in this study. Although the top of the curve still shows an upward trend, the trend is relatively flat (Figure S2), indicating that the sample size of our study was sufficient. In total, 237 bryophyte species were recorded (Table S1).
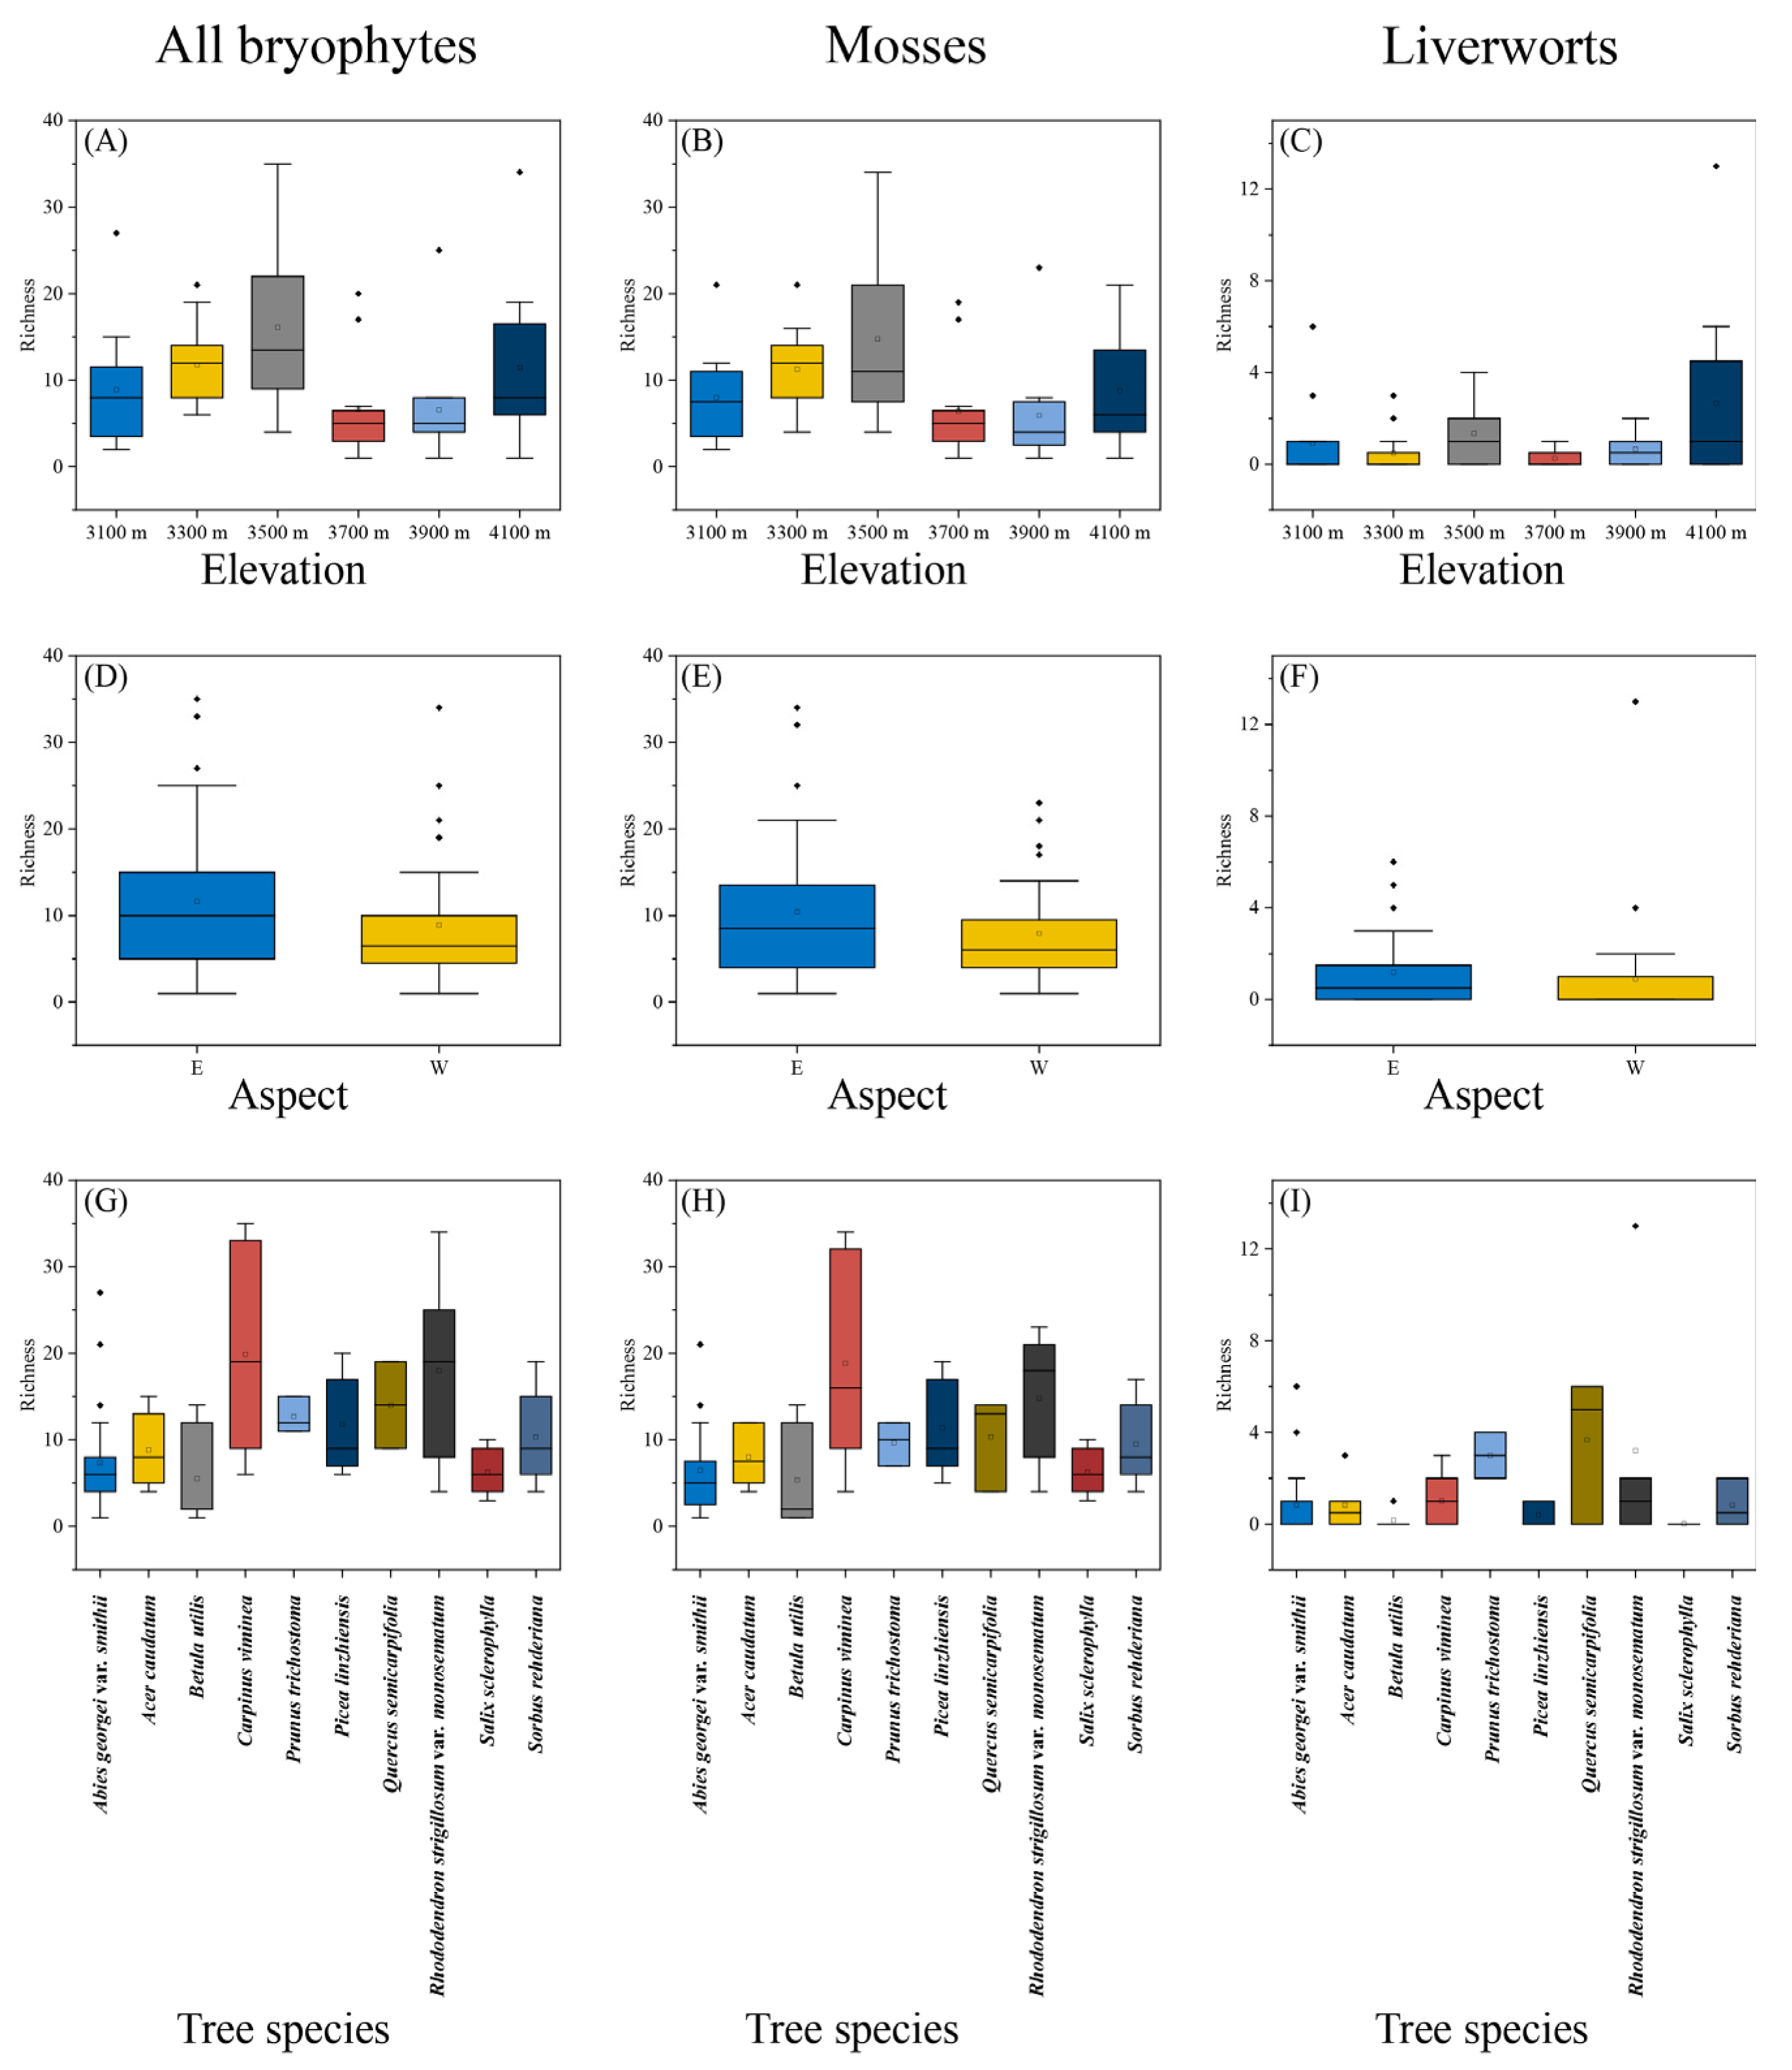
The richness of all bryophytes and mosses exhibited a hump-shaped pattern reaching a peak at 3500 m and then increasing along elevation, while liverworts richness peaked at 4100 m (Figure 2A–C). The richness of the eastern aspect was higher than those of the west (Figure 2D–F). The richness of epiphytic bryophytes on Quercus semecarpifolia was the highest (Figure 2G).
Fixed variables explained 0.462 (R2m) of the variation in diversity of all bryophytes, and the effects of all environmental factors on bryophytes diversity are significant. The random variable effect explained a small proportion of variation (R2c − R2m = 0.36) (Figure 3). Additionally, fixed variables explained a larger proportion of variation in the diversity of mosses (0.489) and liverworts (0.967). Tree species mainly explained the variation in the diversity of all bryophytes (0.285), mosses (0.254), and liverworts (0.905) across all 72 trees. Bryophyte richness exhibited a hump-shaped pattern with the increase in pH. Bryophyte richness (excluding liverworts) was negatively correlated with DBH and nitrogen and positively correlated with bark roughness, even with low R2 values (Figure S3).

3.2. Relationship between Bryophyte Assemblages and Environmental Factors

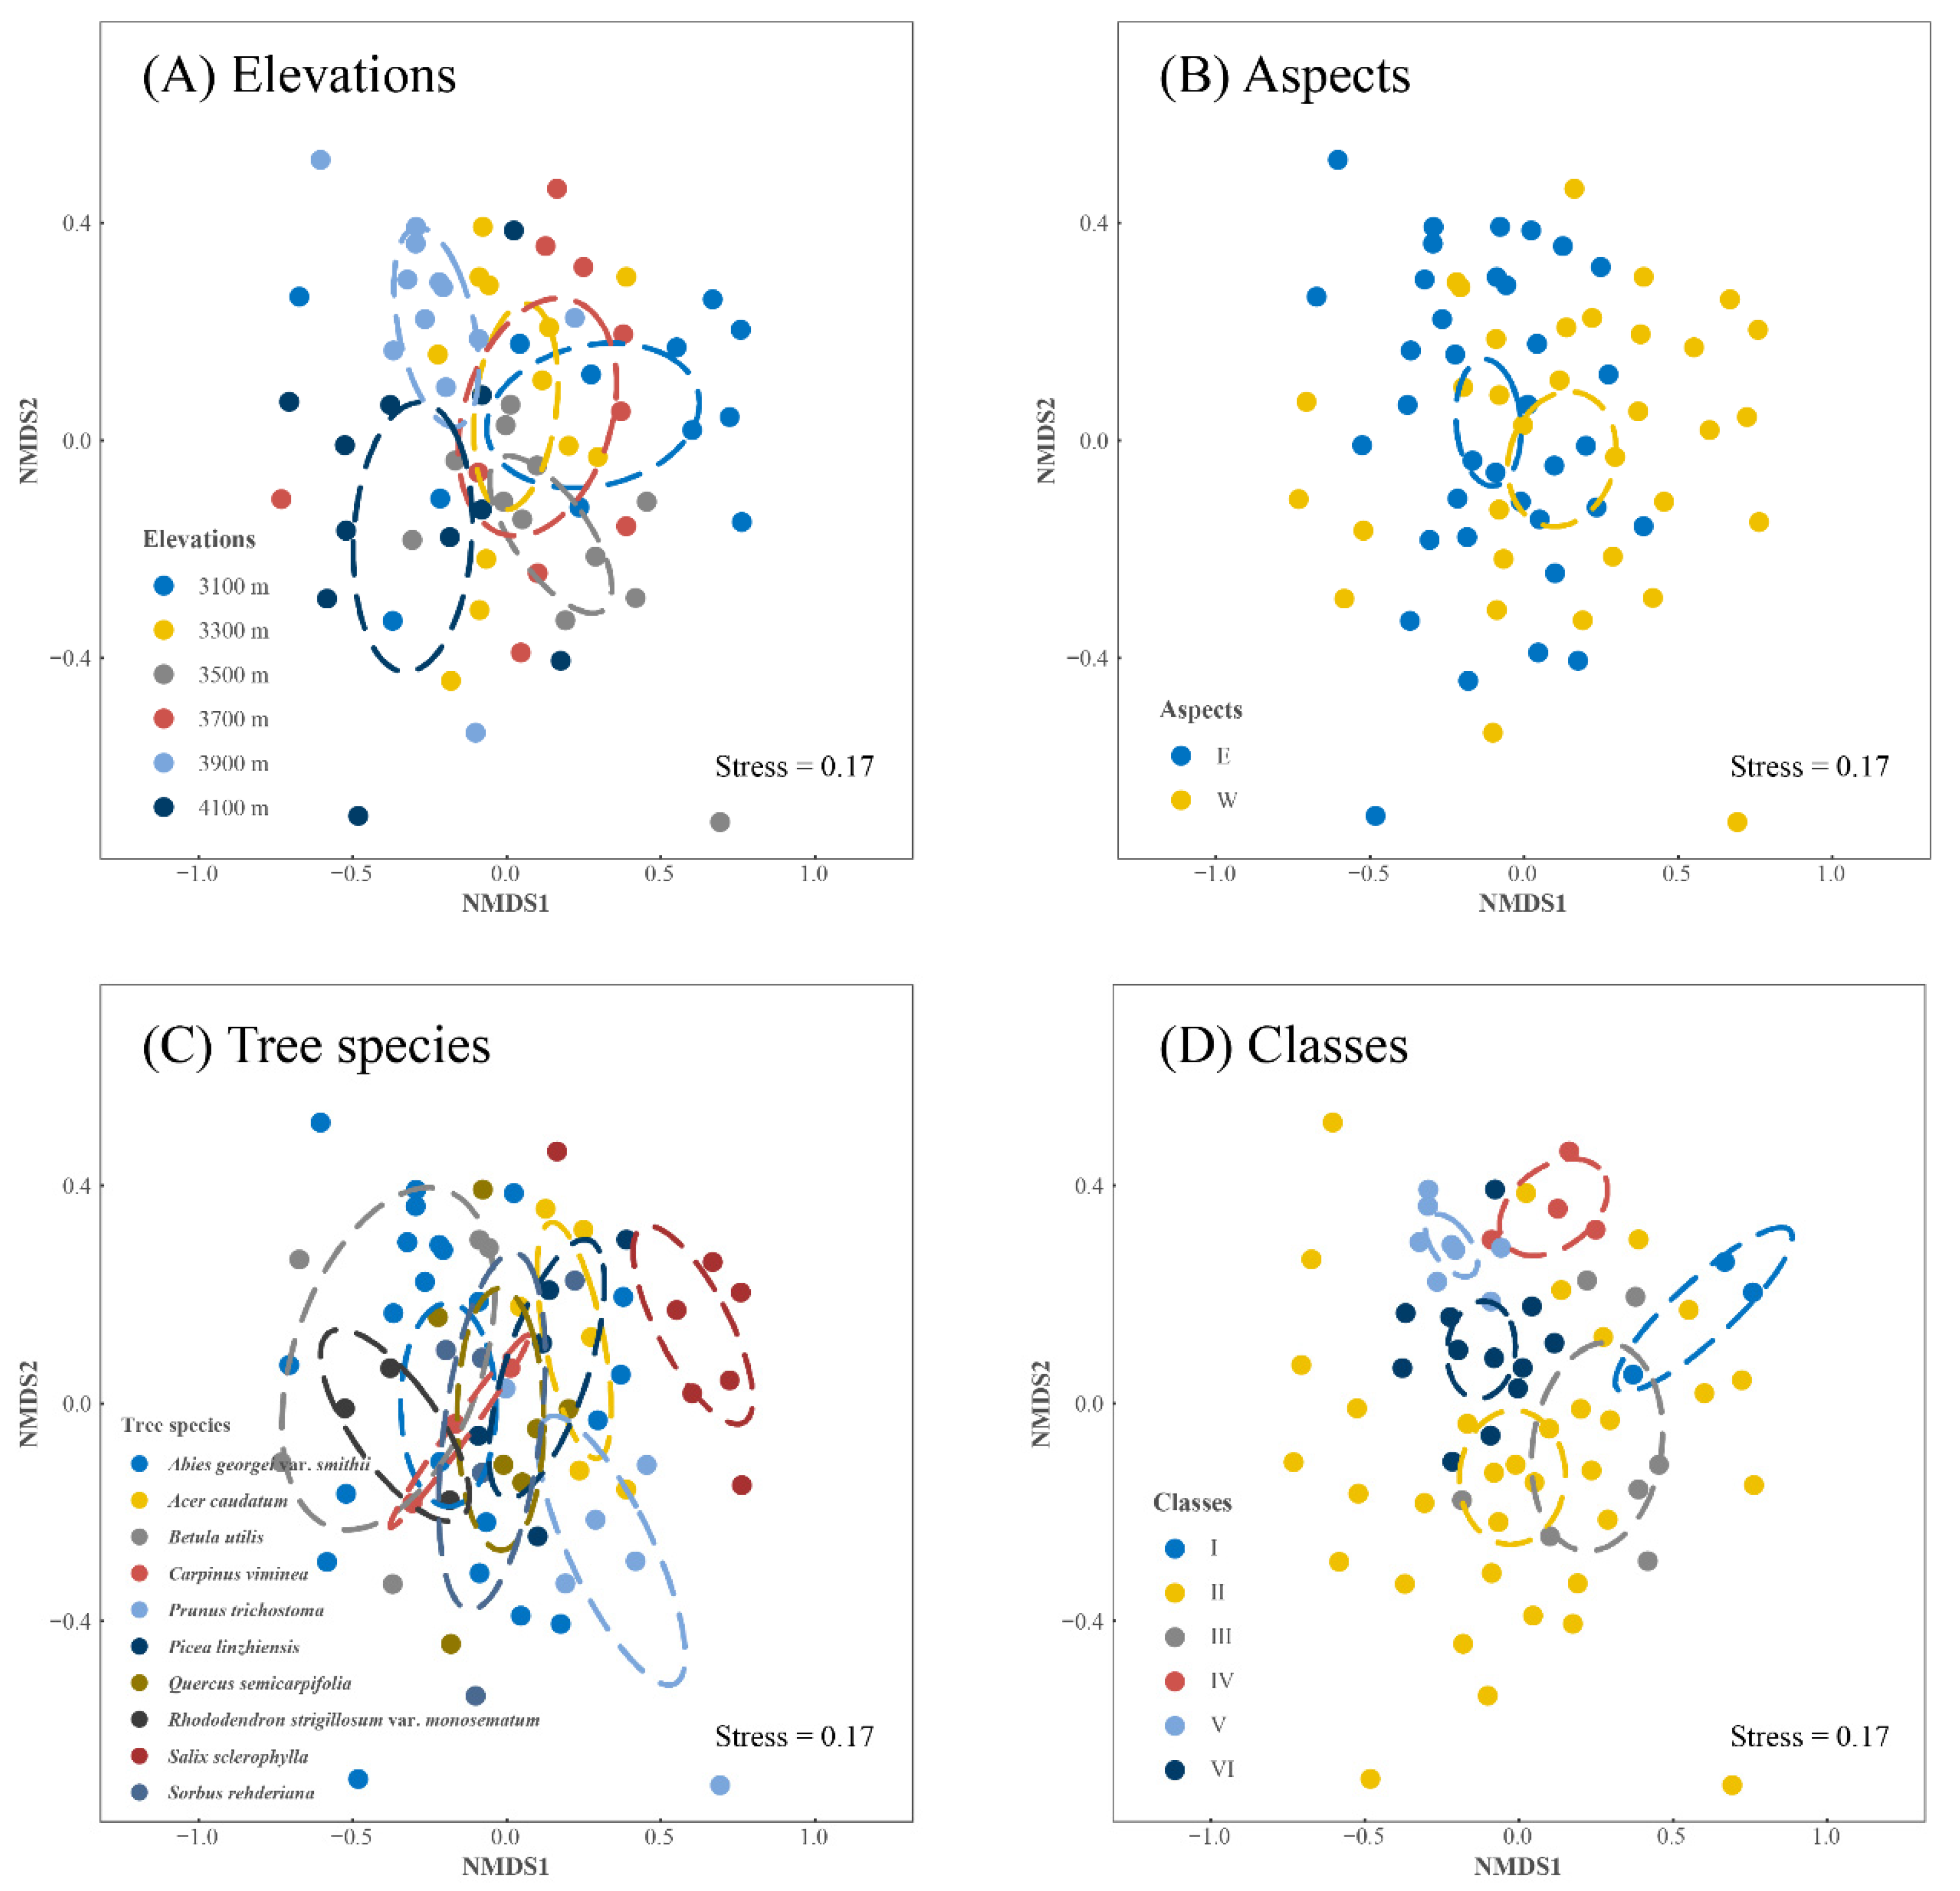
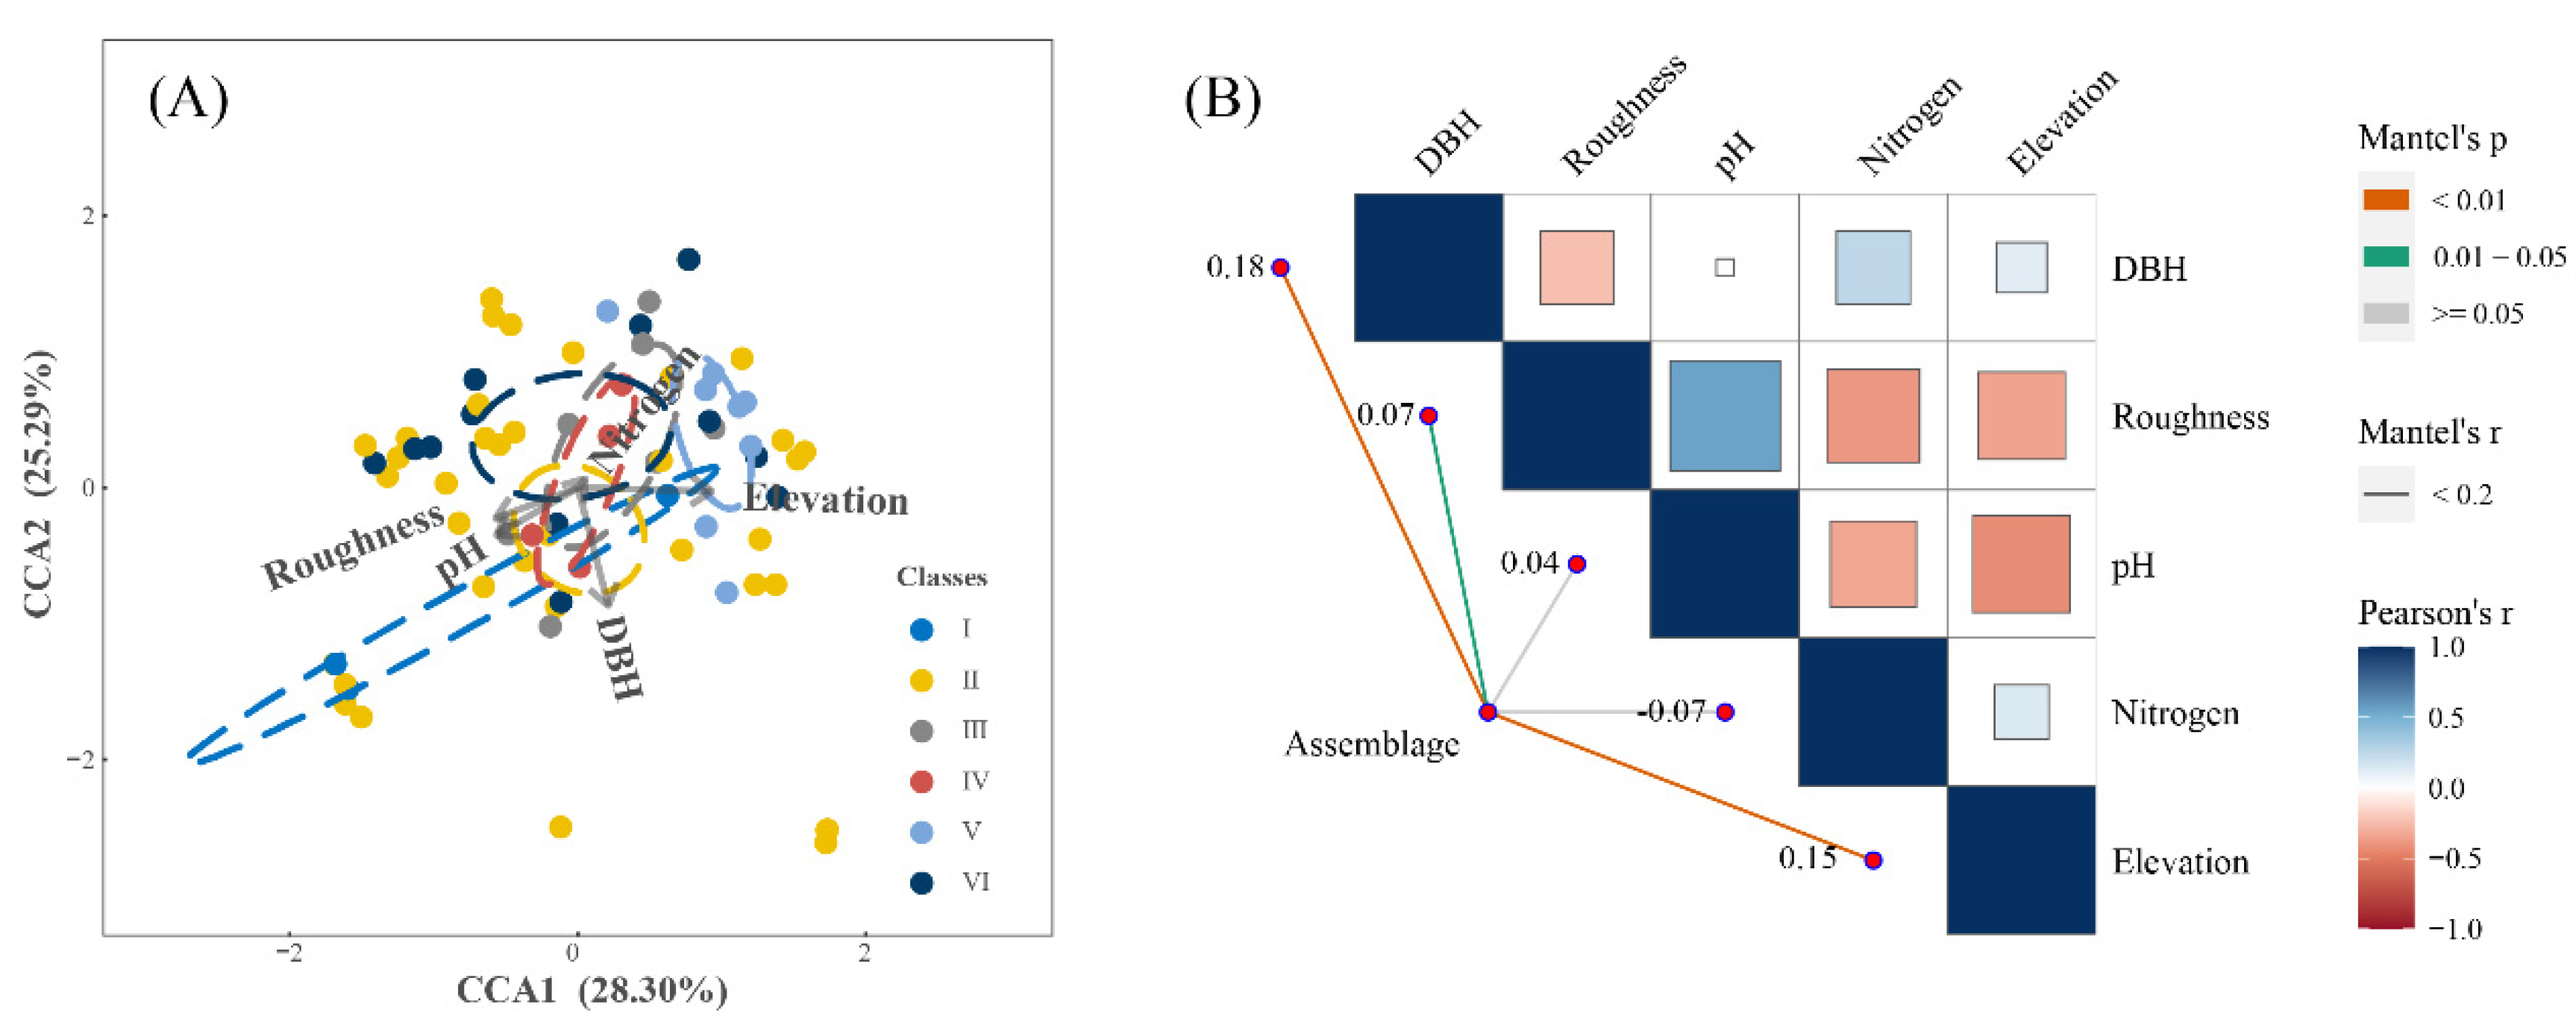
Significant variation was found in elevations with low cohesion, especially for the biotopes at 3900 m and 4100 m (Figure 4A and Figure S5A). The differences among bryophytes in aspects and tree species were less apparent (Figure 4B,C and Figure S5B,C). Bryophytes could be categorized into six groups (Figure S4, class I–VI). The dominant species in class I were Pseudoleskeella tectorum and Entodon sullivantii, and dominant species in class II were Trichostomum tenuirostre and Hypnum plumaeforme (Table S2). The differences among bryophytes assemblage in classes were apparent (Figure 4D and Figure S5D). The canonical axes of CCA explained 53.59% of the total variance. For example, assemblage class II tends to be associated with high diameter at breast height; class I was associated with high bark roughness grade (Figure 5A). Bryophytes assemblage was strongly influenced by elevation, diameter at breast height, and bark roughness grade (Figure 5B).

4. Discussion

4.1. How Does Elevation Drive the Diversity and Assemblage Structure of Bryophytes?

Floristic richness in mountain springs can be attributed to a complex interaction of environmental variables. There is rich bryophyte diversity in Sygera Mountain, with 237 bryophyte species. The epiphytic bryophytes richness along the elevation is related to the heterogeneity of the mountains. Vegetation type remarkably differs along elevation gradients. The vegetation type is at the junction of deciduous coniferous forest and broad-leaved deciduous forest at the elevation of 3500 m, while the tree type in 4100 m is at the junction of shrub and deciduous coniferous forest. The richness of epiphytic bryophytes in transition zones is higher than in other places. The diversity pattern along the elevation of Sygera Mountains was consistent with the results of similar studies on Gongga Mountain [17].

4.2. How Do Tree Properties Drive the Diversity and Assemblage Structure of Bryophytes?

Tree properties are a crucial factor driving the composition of epiphyte bryophytes and are generally related to the tree species. Tree properties determine the composition of epiphytic bryophytes. Bryophytes vary with host species and specific environmental conditions [42].
The results suggest that host characteristics, including bark roughness and pH, might affect the assemblage composition of bryophytes. At the same time, diameter at breast height was correlated negatively with bryophyte richness within a specific range. They are related to the survival and development of epiphytic bryophytes. For our study sites, the higher diameter at breast height tended to be in coniferous forests. Pine proportion also has a negative effect on the diversity of epiphytic bryophytes [19]. Some compounds and cation concentrations within the bark may also affect epiphytic bryophytes’ survival and development. As reported in a study in Romania, Picea and Abies were less suitable for epiphytic bryophyte survival may be because their bark contains more tannins and resins that inhibit the growth of bryophytes [43].
Bryophyte has a specific tolerance range for pH. The acidic and basic trees are not suitable for the growth of bryophytes (Figure S3). Additionally, thicker and fissured bark facilitates the increase of bark water content and provides more attachment space, which provides more extended colonization and successional time for the limited dispersal of species [21]. Thus, large trees with cracked, decayed bark and deeper bark fissures provide more shade, wind and moisture shelter for epiphytic bryophytes [44]. We also found that mosses diversity increased as the bark became rougher (Figure S3). Pseudoleskeella tectorum (Class I dominant species), a typical bark-dwelling species, may achieve dominance on large portions of the trunk and prefer to live on the rough bark of trees [45]. However, epiphyte bryophytes are likely to experience more exposure to desiccation on smooth-barked trees.
Epiphytic bryophytes can take up N from bark and transfer it to their branches [46]. Moving N to branches is particularly important because branches often have higher N requirements for photosynthetic enzymes. In general, due to N limitation in many bryophyte-dominated ecosystems, a slight increase in N can increase the capacity to take up nitrogen, increasing the chlorophyll content of bryophyte cells and photosynthetic capacity [47]. However, our study found that higher bark total nitrogen content reduces bryophyte diversity (Figure S3). Excessive N supply is detrimental to these sensitive organisms. For example, excessive N supply has been shown to lead to excessive absorption of NH4+ into cells, which can threaten cellular homeostasis and cause toxicity, leading to a subsequent reduction in bryophyte growth [47,48]. Increased N deposition may also lead to increased amino acid accumulation in bryophyte tissues, which may deplete the reserves of soluble carbohydrates needed for growth [49]. High N may lead to biochemical disorders in bryophytes [50].

5. Conclusions

In this study, environmental factors were combined with the spatial distribution of epiphyte bryophyte to study the effects of elevation gradient on species diversity and assemblage composition. Our investigations show the rich epiphytic bryophyte diversity in Sygera Mountain. Elevations and mountain aspects caused shifts in tree species, affecting the distribution pattern of bryophytes. The tree species and diameter at breast height mainly modulated variations in diversity along the elevation. Bryophyte assemblages changed most significantly at different elevations. Meanwhile, different bryophytes assemblages showed a marked preference for tree properties, and also strongly depending on diameter at breast height and bark roughness grade. These results are helpful for promoting the understanding of bryophytes’ ecological role in the forest ecosystem.

Supplementary Materials

The following are available online at https://www.mdpi.com/article/10.3390/f13122154/s1, Figure S1. Correlations with environmental factors. Pairwise comparisons of environmental factors are shown, with a color gradient denoting Pearson’s correlation coefficient. pH, potential of hydrogen; DBH, diameter at breast height. *, 0.01 < p ≤ 0.05; **, 0.001 < p ≤ 0.01; ***, p ≤ 0.001. Figure S2. Richness (y-axis) as the species accumulation curve for the number of sample squares (x-axis), pooled in random order. Color stripe represents error. Figure S3. Relationships between tree properties (tree nitrogen of barks, pH, DBH, and roughness) and the richness of all bryophytes, mosses, and liverworts based on 72 trees. Different lines represent the environmental conditions: DBH, nitrogen, pH, roughness. Different columns represent type: all bryophytes, mosses, and liverworts. pH, potential of hydrogen; DBH, diameter at breast height. Figure S4. Results of cluster analysis (classification) on species composition data (437 species in total) from the 72 trees (based on the Bray–Curtis similarity measure); bryophyte assembles that are most similar cluster together and six clusters are identified (I–VI). Figure S5. Results of dissimilarities between bryophyte assemblage composition from the 72 trees (based on the Bray–Curtis similarity measure) using analyses of similarity (ANOSIM). (A) based on dissimilarities among different elevation; (B) based on dissimilarities among different aspect; (C) based on dissimilarities among different tree species; (D) based on dissimilarities among different class (shown as letters I–VI corresponding to their classification). Outliers are values that do not fall within 1.5 times the interquartile range of the first and third quartiles (indicated by the whiskers). In each box, the horizontal black line represents the median. Table S1. Species of epiphytic bryophytes. Table S2. Relative coverage, relative frequency, and importance values of dominant species in different classes.

Author Contributions

Conceptualization: J.G. and X.S. (Xiaoming Shao); methodology: J.G., X.S. (Xiaotong Song) and X.S. (Xiaoming Shao); software: J.G., Y.L. (Yujia Liao) and Y.Y.; validation: H.M., X.S. (Xiaoming Shao); formal analysis: J.G., X.S. (Xiaotong Song) and X.S. (Xiaoming Shao); investigation: X.S. (Xiaoming Shao), X.S. (Xiaotong Song), R.W., H.M. and Y.Y.; resources: X.S. (Xiaoming Shao); data curation: X.S. (Xiaotong Song), J.G. and X.S. (Xiaoming Shao); writing—original draft preparation: J.G., X.S. (Xiaotong Song) and X.S. (Xiaoming Shao); writing—review and editing: J.G., X.S. (Xiaotong Song) and X.S. (Xiaoming Shao); visualization: J.G. and Y.L.; supervision: R.W. and H.M.; project administration: X.S. (Xiaoming Shao); funding acquisition: X.S. (Xiaoming Shao). All authors have read and agreed to the published version of the manuscript.

Funding

This work was funded by the Natural Science Foundation of China (Grant No. 41771054), the Flexible talent support project of Tibet Agricultural and Animal Husbandry University (Grant No. 604419044), and the Joint Scientific Research Fund Project of China Agricultural University-Tibet Agriculture and Animal Husbandry University, Chinese Universities Scientific Fund (Grant No. 2022TC126).

Data Availability Statement

The data that support the findings of this study are openly available in Supporting Information.

Acknowledgments

Sincerest thanks are given to Youfang Wang (School of life science, East China Normal University), Min Li (College of Life Sciences, Hebei Normal University), Xiaorui Wang (College of Resources and Environmental, Shijiazhuang University), Yingjie Fan, Xinyuan Jiang, Mengzhen Wang, Ling Liu from College of Resources and Environmental Sciences, China Agricultural University, for their contributions to the collection of bryophytes specimens in Tibet.

Conflicts of Interest

The authors declare no conflict of interest.

References

  1. Spence, A.R.; Tingley, M.W. The challenge of novel abiotic conditions for species undergoing climate-induced range shifts. Ecography 2020, 43, 1571–1590. [Google Scholar] [CrossRef]
  2. Mittelbach, G.G.; Schemske, D.W.; Cornell, H.V.; Allen, A.P.; Brown, J.M.; Bush, M.B.; Harrison, S.P.; Hurlbert, A.H.; Knowlton, N.; Lessios, H.A. Evolution and the latitudinal diversity gradient: Speciation, extinction and biogeography. Ecol. Lett. 2007, 10, 315–331. [Google Scholar] [CrossRef]
  3. Swenson, N.G. The role of evolutionary processes in producing biodiversity patterns, and the interrelationships between taxonomic, functional and phylogenetic biodiversity. Am. J. Bot. 2011, 98, 472–480. [Google Scholar] [CrossRef] [PubMed] [Green Version]
  4. Söderström, L.; Hagborg, A.; von Konrat, M.; Bartholomew-Began, S.; Bell, D.; Briscoe, L.; Brown, E.; Cargill, D.C.; Costa, D.P.; Crandall-Stotler, B.J. World checklist of hornworts and liverworts. PhytoKeys 2016, 59, 1–828. [Google Scholar] [CrossRef] [PubMed] [Green Version]
  5. León Vargas, Y.; Engwald, S.; Proctor, M.C. Microclimate, light adaptation and desiccation tolerance of epiphytic bryophytes in two Venezuelan cloud forests. J. Biogeogr. 2006, 33, 901–913. [Google Scholar] [CrossRef]
  6. Medina, N.G.; Albertos, B.; Lara, F.; Mazimpaka, V.; Garilleti, R.; Draper, D.; Hortal, J. Species richness of epiphytic bryophytes: Drivers across scales on the edge of the Mediterranean. Ecography 2014, 37, 80–93. [Google Scholar] [CrossRef]
  7. de Oliveira, S.M.; ter Steege, H. Bryophyte communities in the Amazon forest are regulated by height on the host tree and site elevation. J. Ecol. 2015, 103, 441–450. [Google Scholar] [CrossRef]
  8. Mellado-Mansilla, D.; León, C.A.; Ortega-Solís, G.; Godoy-Güinao, J.; Moreno, R.; Díaz, I.A. Vertical patterns of epiphytic bryophyte diversity in a montane Nothofagus forest in the Chilean Andes. New Zealand J. Bot. 2017, 55, 514–529. [Google Scholar] [CrossRef]
  9. Ah-Peng, C.; Cardoso, A.W.; Flores, O.; West, A.; Wilding, N.; Strasberg, D.; Hedderson, T.A. The role of epiphytic bryophytes in interception, storage, and the regulated release of atmospheric moisture in a tropical montane cloud forest. J. Hydrol. 2017, 548, 665–673. [Google Scholar] [CrossRef]
  10. Pardow, A.; Gehrig-Downie, C.; Gradstein, R.; Lakatos, M. Functional diversity of epiphytes in two tropical lowland rainforests, French Guiana: Using bryophyte life-forms to detect areas of high biodiversity. Biodivers. Conserv. 2012, 21, 3637–3655. [Google Scholar] [CrossRef]
  11. Fritz, Ö.; Gustafsson, L.; Larsson, K. Does forest continuity matter in conservation?–A study of epiphytic lichens and bryophytes in beech forests of southern Sweden. Biol. Conserv. 2008, 141, 655–668. [Google Scholar] [CrossRef]
  12. Odland, A.; Reinhardt, S.; Pedersen, A. Differences in richness of vascular plants, mosses, and liverworts in southern Norwegian alpine vegetation. Plant Ecol. Divers. 2015, 8, 37–47. [Google Scholar] [CrossRef]
  13. Romanski, J.; Pharo, E.J.; Kirkpatrick, J.B. Epiphytic bryophytes and habitat variation in montane rainforest, Peru. Bryologist 2011, 114, 720–731. [Google Scholar] [CrossRef]
  14. Tusiime, F.M.; Byarujali, S.M.; Bates, J.W. Diversity and distribution of bryophytes in three forest types of Bwindi impenetrable National Park. Uganda. Afr. J. Ecol. 2007, 45, 79–87. [Google Scholar] [CrossRef]
  15. Ah-Peng, C.; Chuah-Petiot, M.; Descamps-Julien, B.; Bardat, J.; Stamenoff, P.; Strasberg, D. Bryophyte diversity and distribution along an altitudinal gradient on a lava flow in La Réunion. Divers. Distrib. 2007, 13, 654–662. [Google Scholar] [CrossRef]
  16. Song, L.; Ma, W.Z.; Yao, Y.L.; Liu, W.Y.; Li, S.; Chen, K.; Lu, H.Z.; Cao, M.; Sun, Z.H.; Tan, Z.H. Bole bryophyte diversity and distribution patterns along three altitudinal gradients in Yunnan, China. J. Veg. Sci. 2015, 26, 576–587. [Google Scholar] [CrossRef]
  17. Sun, S.Q.; Wu, Y.-H.; Wang, G.-X.; Zhou, J.; Yu, D.; Bing, H.-J.; Luo, J. Bryophyte species richness and composition along an altitudinal gradient in Gongga Mountain, China. PLoS ONE 2013, 8, e58131. [Google Scholar] [CrossRef]
  18. Medina, N.G.; Bowker, M.A.; Hortal, J.; Mazimpaka, V.; Lara, F. Shifts in the importance of the species pool and environmental controls of epiphytic bryophyte richness across multiple scales. Oecologia 2018, 186, 805–816. [Google Scholar] [CrossRef]
  19. Király, I.; Nascimbene, J.; Tinya, F.; Ódor, P. Factors influencing epiphytic bryophyte and lichen species richness at different spatial scales in managed temperate forests. Biodivers. Conserv. 2013, 22, 209–223. [Google Scholar] [CrossRef] [Green Version]
  20. Mežaka, A.; Brūmelis, G.; Piterāns, A. Tree and stand-scale factors affecting richness and composition of epiphytic bryophytes and lichens in deciduous woodland key habitats. Biodivers. Conserv. 2012, 21, 3221–3241. [Google Scholar] [CrossRef]
  21. Fritz, Ö.; Niklasson, M.; Churski, M. Tree age is a key factor for the conservation of epiphytic lichens and bryophytes in beech forests. Appl. Veg. Sci. 2009, 12, 93–106. [Google Scholar] [CrossRef]
  22. Patino, J.; Gómez Rodríguez, C.; Pupo Correia, A.; Sequeira, M.; Vanderpoorten, A. Trees as habitat islands: Temporal variation in alpha and beta diversity in epiphytic laurel forest bryophyte communities. J. Biogeogr. 2018, 45, 1727–1738. [Google Scholar] [CrossRef]
  23. Mitchell, R.J.; Hewison, R.L.; Beaton, J.; Douglass, J.R. Identifying substitute host tree species for epiphytes: The relative importance of tree size and species, bark and site characteristics. Appl. Veg. Sci. 2021, 24, e12569. [Google Scholar] [CrossRef]
  24. Bates, J.W.; Brown, D.H. Epiphyte differentiation between Quercus petraea and Fraxinus excelsior trees in a maritime area of South West England. Vegetatio. 1981, 48, 61–70. [Google Scholar] [CrossRef]
  25. Boudreault, C.; Coxson, D.S.; Vincent, E.; Bergeron, Y.; Marsh, J. Variation in epiphytic lichen and bryophyte composition and diversity along a gradient of productivity in Populus tremuloides stands of northeastern British Columbia, Canada. Ecoscience 2008, 15, 101–112. [Google Scholar] [CrossRef]
  26. Fritz, Ö.; Heilmann-Clausen, J. Rot holes create key microhabitats for epiphytic lichens and bryophytes on beech (Fagus sylvatica). Biol. Conserv. 2010, 143, 1008–1016. [Google Scholar] [CrossRef]
  27. Wang, L.; Zhao, L.; Song, X.; Wang, Q.; Kou, J.; Jiang, Y.; Shao, X. Morphological traits of Bryum argenteum and its response to environmental variation in arid and semi-arid areas of Tibet. Ecol. Eng. 2019, 136, 101–107. [Google Scholar] [CrossRef]
  28. Shen, Z.; Lu, J.; Hua, M.; Tang, X.; Qu, X.; Xue, J.; Fang, J. Population structure and spatial pattern analysis of Quercus aquifolioides on Sejila Mountain, Tibet, China. J. For. Res. 2018, 29, 405–414. [Google Scholar] [CrossRef]
  29. Kou, J.; Wang, T. Yu, F.; Sun, Y.; Feng, C.; Shao, X. The moss genus Didymodon as an indicator of climate change on the Tibetan Plateau. Ecol. Indic. 2020, 113, 106204. [Google Scholar] [CrossRef]
  30. Liu, L.; Jiang, Y.; Song, X.; Tang, J.; Kou, J.; Fan, Y.; Shao, X. Temperature, not precipitation, drives the morphological traits of Didymodon rigidulus in Tibet. Ecol. Indic. 2021, 133, 108401. [Google Scholar] [CrossRef]
  31. Zhang, Y.; He, N.; Liu, Y. Temperature factors are a primary driver of the forest bryophyte diversity and distribution in the southeast Qinghai-Tibet Plateau. For. Ecol. Manag. 2023, 527, 120610. [Google Scholar] [CrossRef]
  32. Male, T.D.; Roberts, G.E. Host associations of the strangler fig Ficus watkinsiana in a subtropical Queensland rain forest. Austral Ecol. 2005, 30, 229–236. [Google Scholar] [CrossRef]
  33. Verma, A. Bio sorption of heavy metal Chromium (III) from synthetic waste water using Taxus baccata bark as bio adsorbent. Int. J. Chem. Sci. 2017, 5, 1758–1761. [Google Scholar]
  34. Kjeldahl, C. A new method for the determination of nitrogen in organic matter. Anal. Bioanal. Chem. 1883, 22, 366. [Google Scholar]
  35. Schielzeth, H.; Nakagawa, S. Nested by design: Model fitting and interpretation in a mixed model era. Methods Ecol. Evol. 2013, 4, 14–24. [Google Scholar] [CrossRef]
  36. Bates, D.; Mächler, M.; Bolker, B.; Walker, S. Fitting linear mixed-effects models using lme4. J. Stat. Softw. 2014, 6, 1–48. [Google Scholar]
  37. Dray, S.; Dufour, A. The ade4 package: Implementing the duality diagram for ecologists. J. Stat. Softw. 2007, 22, 1–20. [Google Scholar] [CrossRef] [Green Version]
  38. Kuznetsova, A.; Brockhoff, P.B.; Christensen, R.H.B. R Package: Package ‘Lmertest’. Available online: https://github.com/runehaubo/lmerTestR (accessed on 23 October 2020).
  39. Lai, J.; Zou, Y.; Zhang, S.; Zhang, X.; Mao, L. Glmm.hp: An R package for computing individual effect of predictors in generalized linear mixed models. J. Plant. Ecol. 2022, 15, rtac096. [Google Scholar] [CrossRef]
  40. Kassambara, A. R Package: Package ‘Ggpubr’: “Ggplot2” Based Publication Ready Plots. Available online: https://github.com/tidyverse/ggplot2/issues (accessed on 4 November 2022).
  41. Oksanen, J.; Blanchet, F.G.; Kindt, R.; Legendre, P.; Minchin, P.R.; Hara, R.B.O.; Simpson, G.L.; Solymos, P.; Stevens, M.H.H.; Wagner, H. R package: Package ‘Vegan’ Community Ecology Package. Available online: https://github.com/vegandevs/vegan (accessed on 11 October 2022).
  42. Patiño, J.; González-Mancebo, J.M. Exploring the effect of host tree identity on epiphyte bryophyte communities in different Canarian subtropical cloud forests. Plant Ecol. 2011, 212, 433–449. [Google Scholar] [CrossRef]
  43. Gola, I.; Schumacker, R.; Zdeněk, S. Multivariate analysis—A tool for bryosociological studies. case study for the bryophyte epiphytic communities from the upper arieş river basin (Romania). Contrib. Bot. 2015, 50, 143–150. [Google Scholar]
  44. Sales, K.; Kerr, L.; Gardner, J. Factors influencing epiphytic moss and lichen distribution within Killarney National Park. Biosci. Horiz. 2016, 9, 1–12. [Google Scholar] [CrossRef] [Green Version]
  45. Hugonnot, V. Remarkable bark-dwelling species in a Hautes-Alpes Juniperus thurifera L. forest with the new finding for France of Didymodon johansenii (RS Williams) HA Crum. Cryptogam. Bryol. 2014, 35, 217–222. [Google Scholar] [CrossRef]
  46. Song, L.; Lu, H.; Xu, X.; Li, S.; Shi, X.; Chen, X.; Wu, Y.; Huang, J.; Chen, Q.; Liu, S. Organic nitrogen uptake is a significant contributor to nitrogen economy of subtropical epiphytic bryophytes. Sci. Rep. 2016, 6, 1–9. [Google Scholar] [CrossRef] [PubMed] [Green Version]
  47. Limpens, J.; Berendse, F. Growth reduction of Sphagnum magellanicum subjected to high nitrogen deposition: The role of amino acid nitrogen concentration. Oecologia 2003, 135, 339–345. [Google Scholar] [CrossRef]
  48. Pearce, I.; Woodin, S.J.; Van der Wal, R. Physiological and growth responses of the montane bryophyte Racomitrium lanuginosum to atmospheric nitrogen deposition. New Phytol. 2003, 160, 145–155. [Google Scholar] [CrossRef] [Green Version]
  49. Baxter, R.; Emes, M.J.; Lee, J.A. Effects of an experimentally applied increase in ammonium on growth and amino-acid metabolism of Sphagnum cuspidatum Ehrh. ex. Hoffm. from differently polluted areas. New Phytol. 1992, 120, 265–274. [Google Scholar] [CrossRef]
  50. Nordin, A.; Strengbom, J.; Witzell, J.; Näsholm, T.; Ericson, L. Nitrogen deposition and the biodiversity of boreal forests: Implications for the nitrogen critical load. AMBIO A J. Hum. Environ. 2005, 34, 20–24. [Google Scholar] [CrossRef]
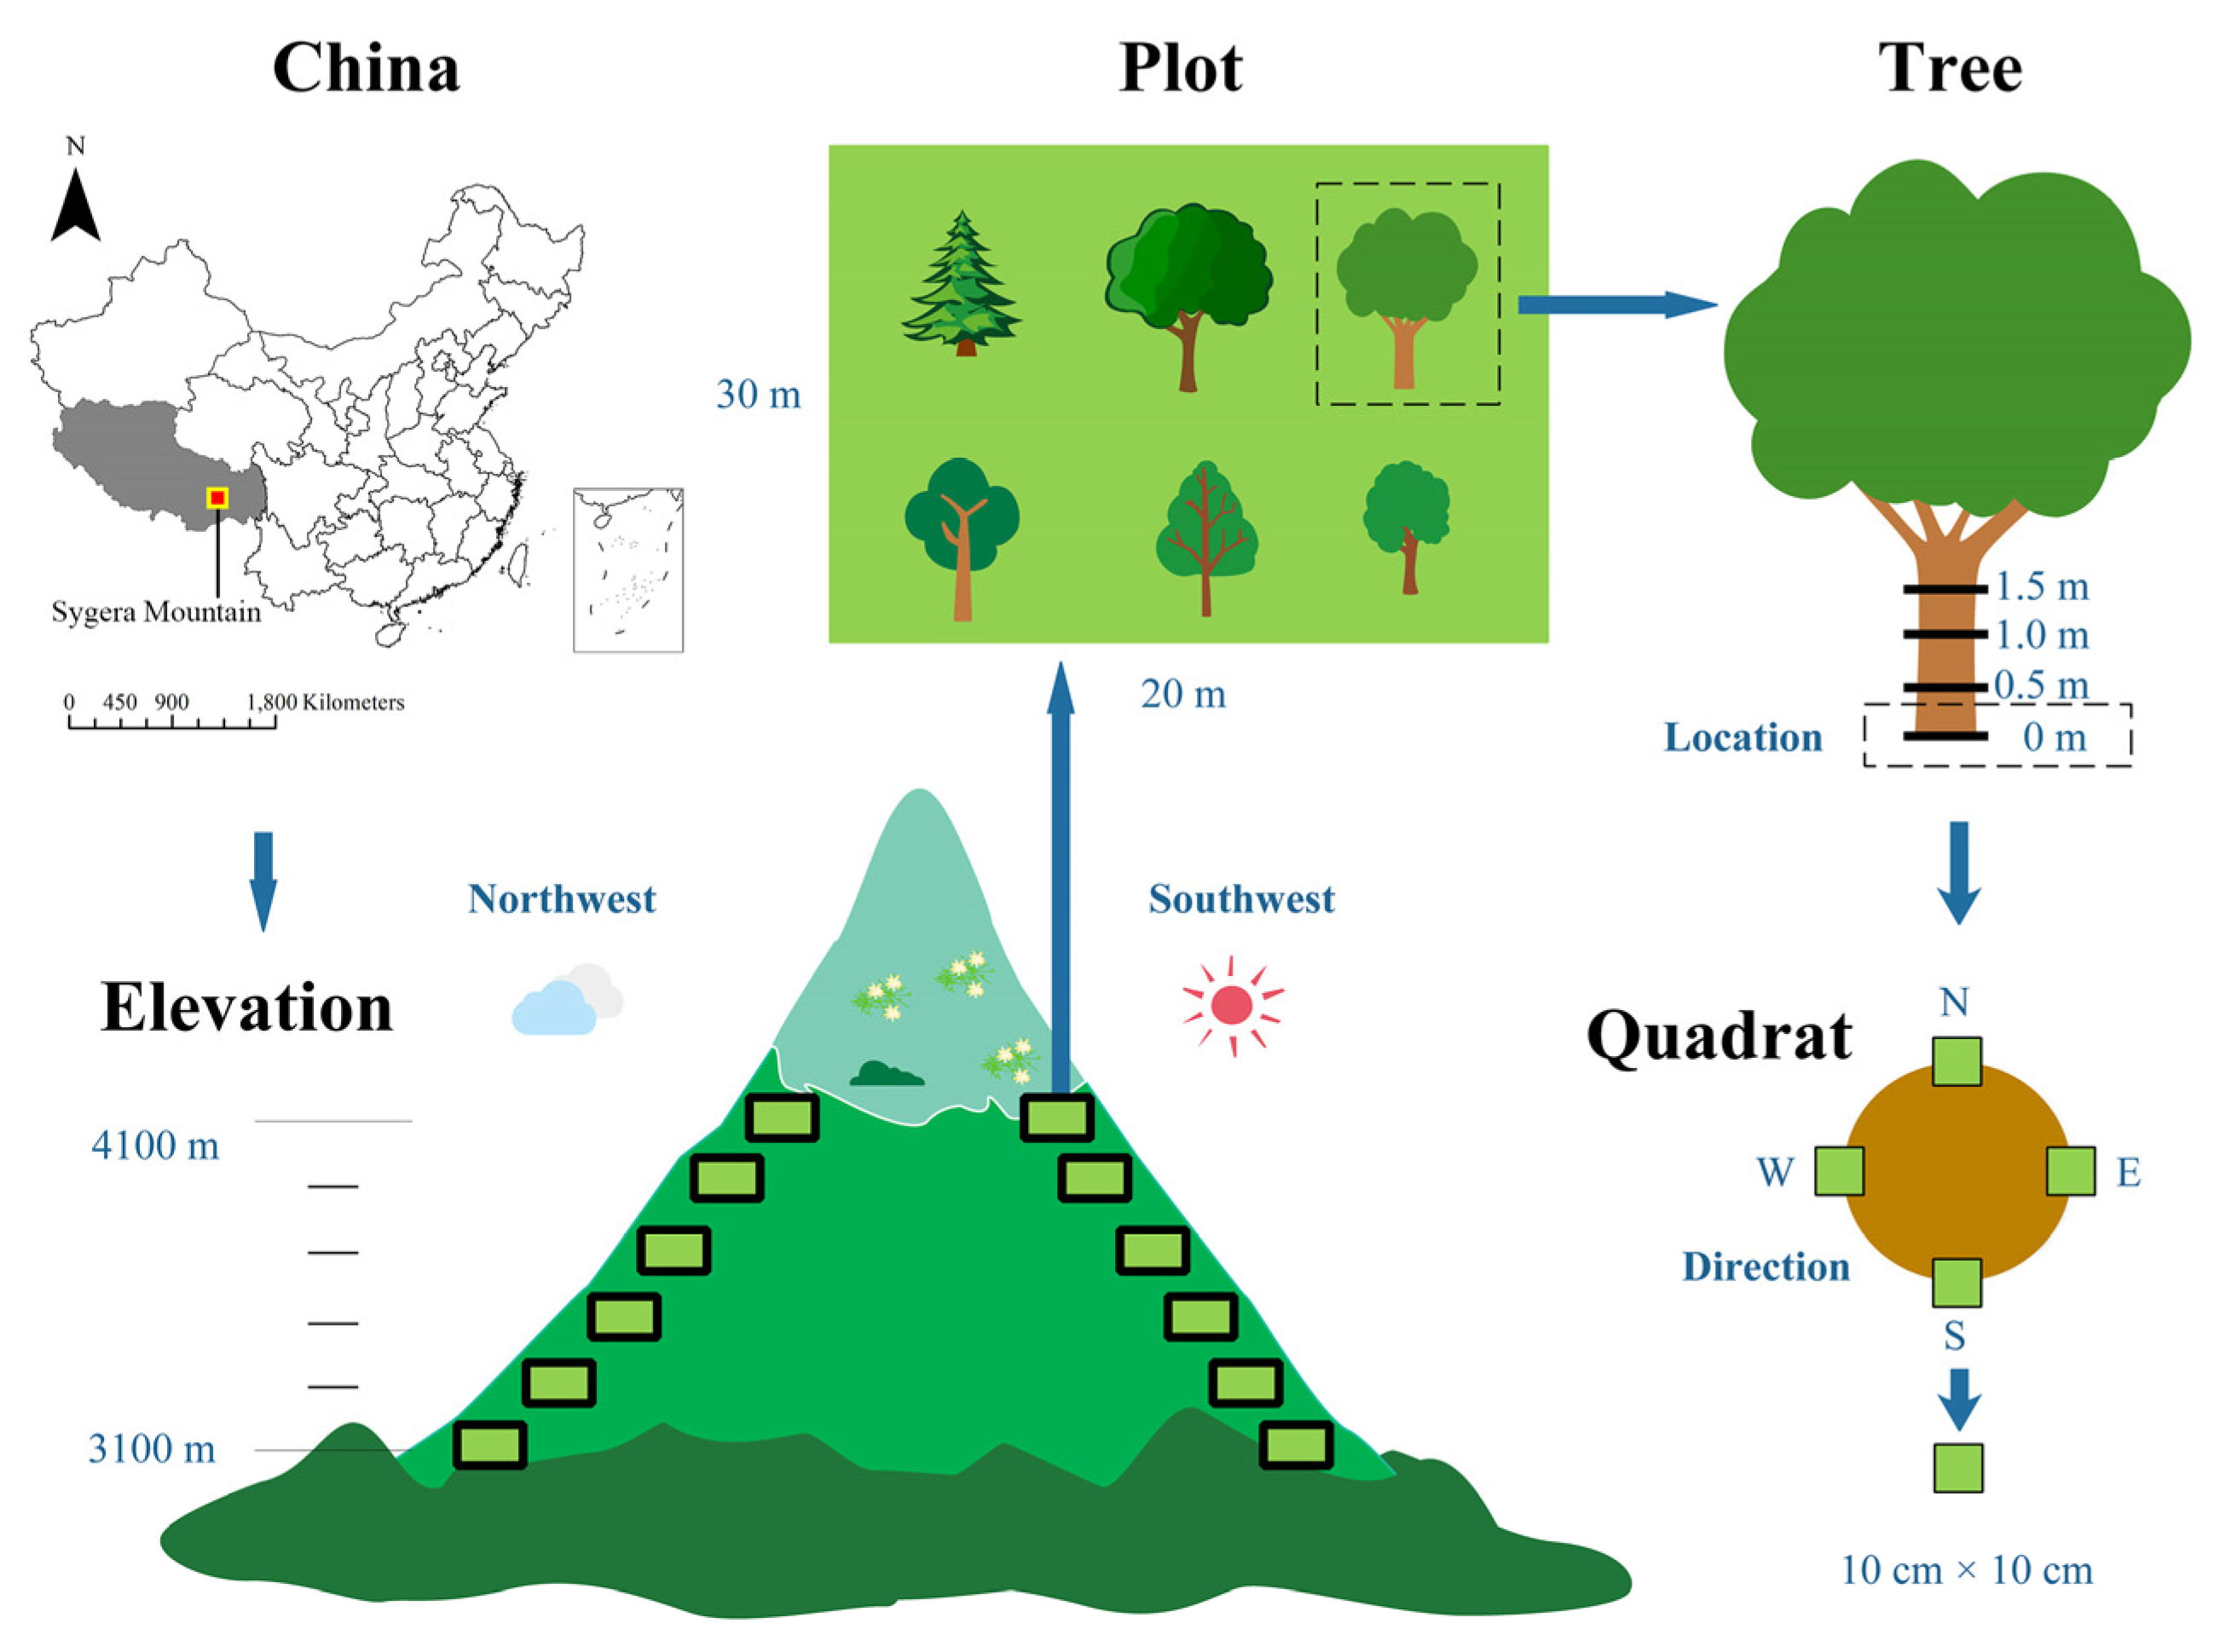
Figure 1. Bryophytes design in Sygera Mountains. A hierarchical nesting design to sample bryophytes: elevation zone, plot, tree, quadrat.
Forests 13 02154 g001
Figure 2. The diversity differences among different elevations, aspect, tree species. (AC) elevation; (DF) aspect; (GI) tree species. Different lines represent the environmental conditions: elevation, aspect, tree species. Different columns represent type: all bryophytes, mosses, and liverworts. Lowercase letters indicate significant differences at 0.05 error probability levels among different elevations, aspect, tree species. The boxes represent the range of values between the third and the first quartile. Outliers are values that do not fall within 1.5 times the interquartile range of the first and third quartiles (indicated by the whiskers). In each box, the horizontal black line represents the median while the mean value is represented by the hollow point.
Forests 13 02154 g002
Figure 3. Summary of linear mixed effects model analyzing the effects of environmental factors on the diversity of all bryophytes, mosses, and liverworts, using elevation, aspect, tree species, nitrogen, pH, DBH, and bark roughness grade as fixed effects. Tree species were taken as a random factor. R2m, R squared of fixed effect; R2c, total R squared for fixed effects and random effects. pH, potential of hydrogen; DBH, diameter at breast height. *, 0.01< p ≤ 0.05; **, 0.001 < p ≤ 0.01; ***, p ≤ 0.001.
Forests 13 02154 g003
Figure 4. Bryophytes assemble under different taxonomic situations with NMDS (ordination). The positions in ordination space are shown for 72 tree sites. (A) based on dissimilarities among different elevation; (B) based on dissimilarities among different aspect; (C) based on dissimilarities among different tree species; (D) based on dissimilarities among different class (shown as letters I–VI corresponding to their classification). The ellipses were calculated around barycenters with a confidence level of 0.95.
Forests 13 02154 g004
Figure 5. Relationship between bryophyte assembly and environment. (A) based on dissimilarities among different class (shown as letters I–VI corresponding to their classification) using CCA. The positions in ordination space are shown for 72 tree sites and environmental factors. The ellipses were calculated around barycenters with a confidence level of 0.95. (B) Pairwise comparisons of environmental factors are shown, with a color gradient denoting Pearson’s correlation coefficient. Edge color denotes statistical significance. pH, potential of hydrogen; DBH, diameter at breast height.
Forests 13 02154 g005
Table 1. Information on the tree species, elevation, and aspect of the sample plot.
No.Tree TypeElevation (m)Aspect
1Salix sclerophylla3100West
2Picea linzhiensis/Abies georgei var. smithii3300West
3Prunus trichostoma/Abies georgei var. smithii3500West
4Abies georgei var. smithii/Betula utilis/Salix sclerophylla3700West
5Abies georgei var. smithii/Sorbus rehderiana3900West
6Abies georgei var. smithii/Sorbus rehderiana4100West
7Abies georgei var. smithii/Acer caudatum/Betula utilis3100East
8Betula utilis/Quercus semecarpifolia3300East
9Carpinus viminea/Quercus semecarpifolia3500East
10Abies georgei var. smithii/Acer caudatum/Picea linzhiensis3700East
11Abies georgei var. smithii3900East
12Abies georgei var. smithii/
Rhododendron strigillosum var. monosematum
4100East
Publisher’s Note: MDPI stays neutral with regard to jurisdictional claims in published maps and institutional affiliations.