Abstract
Light detection and ranging (LiDAR) technology has become a mainstream tool for forest surveys, significantly contributing to the improved accuracy of forest inventories. However, the accuracy of the scanned data and tree properties derived using LiDAR technology may differ depending on the occlusion effect, scanning configurations, various scanning patterns, and vegetative characteristics of forest plots. Hence, this paper presents a computer simulation program to build a digital forest plot composed of many tree models constructed based on in situ measurement information and two mobile scanning patterns, i.e., airborne laser scanning (ALS) and ground-based mobile laser scanning (MLS). Through the adjustment of scanning parameters and the velocity of vehicle loading LiDAR sensors, the points scanned using two scanning patterns were compared with the original sampling points, derived from the constructed digital forest plots. The results show that only 2% of sampling points were collected by LiDAR sensors with the fastest vehicle speed (10 m/s) and coarsest scanning angular resolution (horizontal angular resolution 0.16° and vertical angular resolution 1.33°), and approximately 50% of sampling points were collected by LiDAR sensors with slow vehicle velocity (1.25 m/s) and a finer scanning angular resolution (horizontal angular resolution 0.08° and vertical angular resolution 0.33°). Meanwhile, the potential extended application of the proposed computer simulation program as a light model of forest plots was discussed to underpin the creation of the forest digital twin. Three main conclusions are drawn: (1) the collected points from airborne laser scanning (ALS) are higher than those collected from ground-based mobile laser scanning (MLS); (2) reducing the vehicle velocity is more efficient at improving the high density of the point cloud data than by increasing the scanning angular resolution; (3) the lateral extension of crown area increasing the light beams’ receptor area and the clumped leaf dispersion augmenting the light penetration with vertical elongation are the two paramount factors influencing the light transmittance of tree crowns.
1. Introduction
Forests are intrinsically 3D systems, and most forest ecosystem research is based on spatially oriented data. With respect to the remote sensing data that are utilized, LiDAR scans have become a preferred alternative, rapidly replacing traditional optical imagery in forest characteristic representation [1].The two common laser scanning patterns include ground-based mobile LiDAR [2] and airborne LiDAR [3]. LiDAR sensors, loaded on ground vehicles, mainly provide a lateral perspective of the high-density representation of tree trunks, branches, and leaves at the low and middle heights of the forest canopy [4]. Airborne LiDAR provides a top-down measurement setup for the quantitative acquisition of features in the upper forest canopies, such as treetop locations and upper tree crown attributes [5]. The use of any LiDAR-scanning pattern for forest applications, such as the assessment of forest volumes, biomass, and carbon stocks, may be limited by specific environmental factors and the different measurement setups. For example, the various-perspective view of the scanning angle leads to the inhomogeneous distribution of scanned point cloud [6], localized vegetative elements in forest canopy result in various degrees of occlusion in different scanning patterns [2], and the specification of the sensors and scanning parameter settings affect the quality of the obtained point clouds [7]. It is unknown how significantly these main factors affect the quality of the obtained point clouds. LiDAR utilizes light or nonvisible electromagnetic radiation to measure the distance to the target objects (e.g., biotic elements of the forest) [8]. Hence, the pervading propagation of LiDAR beams within heterogeneous tree crowns may enlighten the model of light transfer in complex forest scenes, which is highly important for the understanding of the impacts of light distribution in forest ecosystem development with water absorption and evaporation [9] and for guiding the virtual representation of forests with real physical and physiological processes, known as the forest digital twin [10]. Therefore, it is necessary to provide a method with reliable benchmarking against output and a realistic ray propagation process to evaluate the efficacy of different laser-scanning patterns on acquisitions of forest phenotype information.
Many researchers have attempted to evaluate the effect of laser-scanning forest-measurement techniques with different scanning parameter setups. For example, the variation in vegetation errors of height estimation according to scan distance and incidence angle were analyzed at the local scale [11]; the relationship between the retrieval of forest gap fraction and sampling density of the LiDAR data was calculated [6]; occlusion metrics among multiplatform LiDAR for different target trees were performed using computer simulation techniques [12]; another sensitivity analysis was conducted to study the influence of instrument parameters (i.e., beam divergence and multiecho LiDAR points), scanning configuration (scanning angular resolution), and vegetation characteristics (leaf size, leaf density, and angle distribution) [13]. The previous research repeatedly changed the scanning configurations and endeavored to find the efficacy of the main scanning factors, such as the characteristics of forest canopies, scanning angular resolution, scan distance, and scanning angles, regarding the point cloud data obtained for target forests [13]. The strategy involving repeated pilots is not convenient and requires arduous manual measurements to validate the results, which results in a bias towards a comparison of the collected data and the true, universally existing value [14]. Therefore, the credibility of this derivation pattern is not well understood, and a more advanced approach is worth further study.
Digital twin, typically described as the synchronization of a physical entity and a virtual counterpart with a specific fidelity and frequency, is increasingly being recognized as a means of optimizing the performance of the physical entity by reasonably and effectively organizing and calculating the massive data of the virtual counterpart [15]. Leveraging the development of computational techniques, the digital twin has become a practical topic across both academia and industry, and thus brings unprecedented opportunities to forest ecosystem monitoring [16]. The digital twin of forest aims to integrate accurate and reliable forest monitoring data with the surrounding environmental state, which are obtained by advanced remote sensing technologies, and sharpen the digital, perceptual, intelligent, and sustainable forest management [17,18]. Light is a key resource for all performance and production by trees, and it provides the foundational energy during the process of photosynthate, converting absorbed light into various tree biomass tissues [19]. Therefore, understanding the heterogeneous distribution of light within the forest is paramount to establishment of the forest digital twin, from the tree biotic state to the corresponding monitoring environment state [20,21]. However, different from the agricultural digital twin, with real-time monitoring devices on farms, forest landscapes with complex community structures do not have the necessary conditions to acquire systematized forest data such as vertical and horizontal light distribution within the forest stands [22]. Thus, the light cosimulation program uses existing input data from the physical entity collected by monitoring devices (e.g., leaf distribution, leaf area, and crown shape) to derive the light transmission process within forests. This is essential to make up for the deficiencies in the continuous stream of forest physiological procedure portrayal and assessment of solar radiation distribution within canopies [23].
The aim of the present study was to develop a computer-simulation-based method to quantify the relationship between multiple scanning patterns, various scanning configurations, and different forest plots. The specific objectives were the following: (1) to generate various forest plots composed of 3D virtual tree models with the phenotypic characteristics obtained from field measurements; (2) to develop a fast computer simulation program of mobile ground-based and airborne laser scanning to generate scanned points of corresponding modeling forest plots and quantify the scanned results and occlusion metrics under different scanning patterns and configurations; and (3) to suggest a potential extension of the laser scanning simulation program as a light model of modeling forest plots and assess the impact of the occlusion effects in the forest canopy on the transmittance of the light rays. In this way, we provide a convenient and verifiable method to quantitatively assess the efficacy of mobile laser scanning techniques on the acquisition of forest appearance data and produce guidelines to optimize the scanning configuration selection in different forest scenarios. Meanwhile, the light transmittance within the forest plot, including the shading rate of leaves, is discussed with the extended application of the laser scanning simulation program, combined with a uniform sampling strategy.
2. Materials and Methods
The following paragraphs provide an overview of the different steps of the methodology, which are schematically represented in Figure 1.

Figure 1.
Flowchart illustrating the main steps of our mobile laser scanning simulation framework.
2.1. Field Data
The complexity, heterogeneity, and diversity of natural forests challenge LiDAR’s capacity to provide accurate three-dimensional information on forest structure. The mutual occlusion effect of vegetative elements throughout the forest leads to an inadequate account of incident and transmitted LiDAR beams at the individual stand scale, leading to the omission of localized forest structure data acquired by LiDAR. To assess the relationships between the scanned results and forest occlusion metrics, a modeling forest landscape with three-dimensional heterogeneous structures that is capable of deriving ecological parameters from the vegetation structure of single trees is desirable. Herein, six datasets, comprising one apple tree (Malus communis), two mango trees (Mangifera indica), two rubber trees (Hevea brasiliensis), and one walnut tree (Juglans intermedia), are provided to establish a heterogeneous forest scene with various crown layers, as shown in Figure 2a, where two rubber trees constitute the overstory layer, apple and walnut constitute the understory layer, and two mango trees constitute the shrub layer. Each leaf location and orientation in every tree crown were manually measured using an electromagnetic 3D digitizer (Fastrak, Polhemus Inc., Colchester, VT, USA). All leaves, leaflets, and compound leaves were digitized using the digitizer. Each main branch and all first-order and second-order branches were measured using the digitizer from the proximal to the distal tip of each branch. We, therefore, can precisely determine the rank order of leaves along each last-order branch for every tree specimen. The specific measurement information of six tree specimens is listed in Table 1. The 20-year-old apple tree was located in Vouvray, near Tours, France. The two two-year-old mango trees (Mango 1 and 2, listed in Table 1) were in an orchard in Ban Bung, near Chonburi, Thailand. The smaller 1.5-year-old rubber tree (Rubber 1, listed in Table 1) was grown in the garden of the Department of Agronomy, Kasetsart University, Bangkok, Thailand. The larger three-year-old rubber tree (Rubber 2, listed in Table 1) was grown in Suwan Wajokkasikit Field Crops Research Station, Pak Chong, Thailand. The three-year-old walnut tree was grown in a research field at INRA Research Center in Clermont-Ferrand, France.
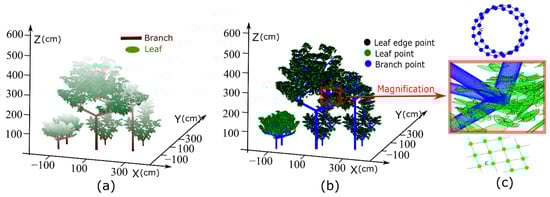
Figure 2.
Our program shows the reconstructed forest plot scenario based on the field measurement data. (a) The several trees constituting a forest plot for our study, and the brightness value is adopted to represent the height value. (b) The discretization of tree models using evenly distributed sampling points covering the vegetative element surfaces, where the blue, green, and black points represent the sampling points on the branch surface, leaf surface, and leaf edge, respectively. (c) The magnification of simulated tree crotch structure, where the spot spacing between two neighboring discrete points used in uniform sampling strategy is set to c.

Table 1.
Growth properties of the available tree specimens used in our simulation method. Some growth properties, including height, crown diameter, number of leaves, and total leaf area of the tree crown, were manually collected by field measurements [24], and other properties were derived from the manually collected properties mentioned above.
2.2. Forest Plot Modeling and Laser Scanning Simulation
For each tree crown, we adopted a single tree modeling method [24] according to the information of manual measurements, which includes every spatial leaf blade depicted by ellipse surfaces with a given size, and tree skeleton reconstructed by the composition of lots of cylinders with settable radiuses and directions. Consequently, we used the six tree specimens to constitute a forest plot with a tree spacing of two meters on the line and between rows (Figure 2a). In computer vision, to improve computational efficiency, three-dimensional objects were treated as a well-behaving point cloud with a well-distributed vertex set covering the entire object surface [25]. We transformed every single tree model composed of regular and conforming mesh geometries, i.e., ellipse and cylinders surface, into uniform discrete points using the uniform sampling strategy with fixed spot spacing (Figure 2b,c). The following mobile laser scanning simulation can be facilitated by this sparse representation of every single tree model.
The actual laser scanning process aims to determine the intersection points between vegetative elements and the laser beams emitted from the scanner. However, the calculation of the intersection between geometric primitives and numerous lines is time-consuming and computationally complex. After the sampling strategy was conducted for each branch and leaf, the scanned point acquisition was simplified to seek the intersection between the incident lines and the sampling points on the branch and leaf surfaces, which improves the efficiency and computational performance of our simulation program.
Meanwhile, two parameters (i.e., angular resolution and beam divergence ) concerning the scanning configuration were set. The angular resolution , including horizontal and vertical angular resolution, was used to determine the minimal angle increment between the two successively emitted laser beams. The smaller the angular resolution, the finer the scanning resolution, and a smaller spacing of scanned points is obtained. In addition, the spacing of scanned points also depends on the distance between the scanner and the target vegetative elements. Here, we set the sampling spacing as smaller than the maximal spacing of scanned points to preclude any beam from passing through the spacing between two neighboring sampling points without any recorded information. In order to simulate the properties of beam divergence of the scanner, the sampling points on each leaf surface were divided into inner points and edge points. If a beam is intercepted by an edge point, there is a larger probability of the beam being split into two portions, and the split beam with remaining energy continues along its original direction to seek the second intersection with the other vegetative elements. When the second intersection of the beam still occurs with an edge point, a scanned point is recorded and the beam with residual energy continues along the path. This strategy can be employed to manage a multiecho laser scanning simulation program that is suitable for the beam divergence properties. Here, our program only simulated three echoes, as shown in Figure 3, because the laser energy attenuated after each collision by edge point, which is consistent with the real situations of using the laser scanners on the market.
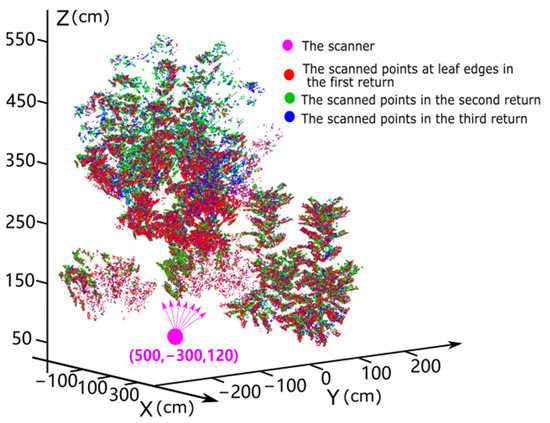
Figure 3.
Our simulation program diagram shows the multi-return scanning results caused by the laser characteristics of beam divergence for our studied forest plot. The position of scanner was set at pink point in the figure, where the pink red arrows characterized the emission orientation of laser beams. The red points in the figure represent the sampling points on the edges of leaf surfaces that are scanned by laser beams and trigger the first signal returns. Then, the split beams continue along their paths and collide with the consequent vegetative elements, which produce the second returns, represented by green points. If the second returns occur, caused by the beams being intercepted by any edge point on the leaf surface, it is possible to generate the third return (blue points) when the beams with remnant energy collide with the following vegetative elements again. As seen from the diagram, the first returns are near the scanner and the last returns are further from the scanner.
Scalability and compatibility are essential prerequisites for any computer simulation program. Hence, it is plausible that the scanning simulation program is suitable for any LiDAR sensors and scanning patterns. Here, the popular, high-definition Velodyne HDL-32E LiDAR sensor (Velodyne Lidar, Inc., San Jose, CA, USA) is taken as a typical case for our simulation. The sensor can be mounted on the pan and tilt of an unmanned aerial vehicle and radar platforms on the roof of the ground vehicle for aerial 3D mapping and mobile terrestrial mapping, respectively. The technical specifications of the Velodyne HDL-32E sensor are listed in Table 2. The study site of the forest plot, including two mango trees, two rubber trees, a walnut tree, and an apple tree, has a total of 5,502,122 sampling points on leaf surfaces and 2,053,687 sampling points on branch surfaces. The specified growth properties of every tree can be seen in Table 1. Two simulation experiments were conducted to realize the ALS and ground-based MLS for the same forest plot.
Table 2.
The technical specifications of the Velodyne HDL-32E sensor.
- (1)
- For ALS, the HDL-32E LiDAR sensor was mounted under the multirotor unmanned aerial vehicle to point at the nadir and set to “continuous shooting mode” to collect data at 10 revolutions per second. The flight was programmed as a predetermined rectangle parallel flight plane, designed to cover the study site plus a buffer area, avoiding edge effects in the scanned data collection (Figure 4a). The flight was conducted at a 6.25 m altitude above the forest canopy of the study site, approximately 1 m distance away from the peak height of the tree crown, and the flight-path-tracing survey lines (blue dashed lines in Figure 4a) were at a set flight speed. This scanning pattern provides a 41.3° vertical field of view (FOV) downward and a 360° horizontal FOV around the flight path (Figure 4b).
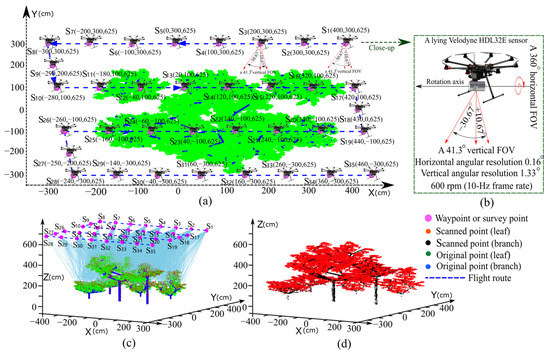 Figure 4. Our program diagram shows the simulation workflow of our aerial LiDAR scanning process. (a,c) The predetermined survey route of our flights with a controllable flight speed covering the study site and a top-down scanning pattern. (b) A lying HDL-32E sensor is mounted under the UAV to produce a 41.3° vertical FOV and a 360° horizontal FOV with adjustable angular resolutions, respectively. (d) Final scanning results show sparsely scanned data of the target forest plot, with occlusion dominating in the lower part of the forest canopy.
 - (2)
- For ground-based MLS, a simulation using an HDL-32E LiDAR sensor was mounted on a car roof to perform a 360° horizontal FOV and 41.3° vertical FOV scanning (Figure 5a,b). The car runs at a set speed along the survey route surrounding the study site and remains about 1 m from the nearest tree leaves.
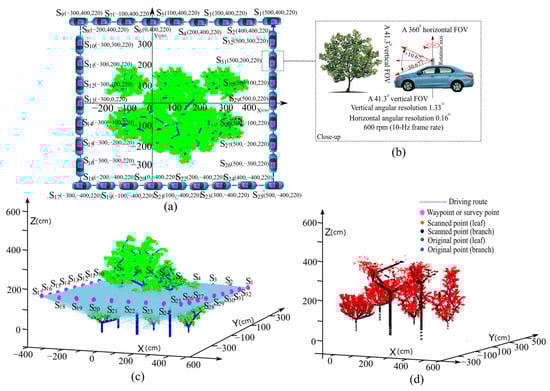 Figure 5. Our program diagram shows the simulation of the ground-based MLS for the modeled forest plot. (a) The set ground vehicle’s path around the target trees and the sensor fires lasers to capture the point cloud from different lateral sides. (b) A standing Velodyne HDL-32E was installed on the car’s roof to guarantee a +10.67° to −30.67° vertical scanning FOV and 360° horizontal scanning FOV, with the settable angular resolution and car running speed. (c) Equivalent diagram illustrates the simulation of a ground-based MLS system designed to acquire forest-scanned data. (d) The collected scanned data from mobile LiDAR with a ground vehicle; occlusion effects are mostly expected to occur high up in the forest, as the leaves in the higher part are out of scanning range due to the limitation in vertical FOV.
3. Results
3.1. Laser Scanning Simulation
The scenarios established using our simulation program for the two scanning patterns are shown in Figure 4 and Figure 5, where the survey routes, scanning process, and scanned results are presented by several subgraphs. For the same forest plot, the number of points obtained using two different scanning patterns, along with the variations in vehicle velocity and angular resolution, are shown in Table 3. The conclusion derived from Table 3 is that the scanned leaf points collected by ALS are smaller than those collected by ground-based MLS when the velocity of the vehicle loading the LiDAR sensor is at 10 m/s speed. As the speed of the vehicle slows down, leading to more observation points being obtained for scanning data acquisition, the number of points of the leaf that are scanned by ALS exceeds those obtained using ground-based MLS. A reasonable explanation for this is that leaf inclination distribution, according to botany characteristics, optimizes solar radiation absorption and deepens the laser beams emitted from overhead that enter the forest canopy. In addition, the number of branch points scanned using ground-based MLS is higher than that obtained using ALS because more branch elements in the forest canopy can be seen from the lateral view. If we changed the scanning angular resolution, the number of scanned points by ALS would still be smaller than those obtained using ground-based MLS, which provides the heuristic knowledge that vertically grown tree crowns usually provide more vegetative elements that are exposed to the lateral side than the top view.
Table 3.
The results of ALS and ground-based MLS versus the variations in the tuning of the velocity of the drone or vehicle, the vertical angular resolution, and the horizontal angular resolution, respectively.
A vertical profile was drawn of the original sampling points for the study forest plot for comparison with the scanned points obtained by two scanning patterns with the variations in tuning vehicle velocity and scanning angular resolution (Figure 6). Figure 6a shows that the distribution of the original sampling points on leaf surfaces of the forest plot presents a roughly bimodal distribution, which is attributed to the crown of the larger tree (Rubber tree 2) being higher than the other five smaller trees (see Table 1), causing the leaf elements to mainly distribute at height intervals of 0.5–1.5 m and 3–4 m. The sampling points on the branch elements are mainly distributed in the lower parts of the forest canopy, which conforms to the general phenomenon where nonphotosynthetic components support the weight of the whole tree crowns and are hidden in the forest canopy [26,27]. Figure 6b shows the scanned point distribution versus the variations in tuning scanning angular resolution with an unchanged vehicle velocity, where the distribution of the scanned points collected by ALS preserves its bimodal distribution, with a smaller peak in the lower heights of the canopy and a larger peak in the upper heights of the canopy. This result demonstrates that a larger proportion of laser beams are intercepted by the foliage elements belonging to the larger trees, and a small proportion of laser beams travel through the upper forest canopy and hit the subcanopy vegetation understory. Conversely, the distribution of the scanned points collected by ground-based MLS presents with a bimodal distribution, with a larger peak at the lower heights and a small peak at the higher heights of the forest canopy. This distribution can be explained by the fact that the LiDAR sensor fixed on the car roof is approximately 2.2 m in height, with a 41.3° vertical FOV and 1.5 m distance from the nearest foliage elements, resulting in a limited scanning field focused on the middle parts of the forest canopy. Hence, the diagram of the scanned results (Figure 5d) shows the deficiencies in depicting the upper forest canopy without adequate laser beam coverage. Figure 6c shows the scanning results versus the variation in tuning scanning angular resolution when vehicle velocity is unchanged. Similar results for scanned point distribution are obtained in Figure 6b. This means that the finer scanning angular resolution or slower velocity of the vehicle loading LiDAR sensor will increase the number of scanned target forest plot points that are acquired. The only difference in the number of collected scanned points in Figure 6b,c is that slowing down the velocity speed to effectively improve the quality of the scanned points is preferred to changing the scanning angular resolution.
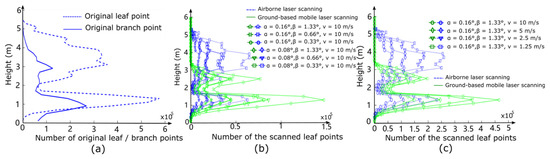
Figure 6.
The vertical profile of the vegetative element distribution is in the form of discrete points. (a) The vertical profile of the original sampling points compared to the vegetative elements. (b) Vertical profiles of the acquired scanned points versus the variation in the tuning of scanned angular resolution with an unchanged velocity of the vehicle loading LiDAR sensors. (c) Vertical profiles of the acquired scanned points versus the variation in tuning vehicle velocity with an unchanged scanning angular resolution. Through the comparison between (b,c), the number of the collected point clouds shows that the effect of adjusting velocity outperforms that of the scanning angular resolution in the acquisition of high-density point cloud data for the same forest plot.
3.2. Application Extension of the Proposed Framework for a Light Model of Forest Plots
The increase in technologies associated with Internet of Things (IoT) devices [28], multivariate remote sensing, and 5G wireless broadband connectivity [29] could possibly underpin the simultaneous collection and integration of the physical or biotic variables of trees, which underpins the establishment of a forest digital twin and sharpens sustainable forest management. Herein, we envisage an extended application of the proposed framework to model light transfer in a heterogenous forest landscape, which is paramount to twinning the ecosystems of forest scenes, as light availability is a core pillar of tree species partition and spatial and temporal gradients. The reasons for the proposed framework, which could form a potential light model of a forest plot, are as follows:
- The precise digitized data of individual trees shown in Table 1, as measured by an electromagnetic 3D digitizer, provided as realistic a digital twin of each tree as possible, including the location and orientation of each leaf in every tree crown. This synchronized the virtual and physical states of every leaf, simulating a realistic light transmission environment in a forest plot.
- The scanned point acquisitions for every laser beam, with an efficient computational performance as measured by the simplified strategy mentioned in Section 2.2, can easily be converted to the intersection points between solar rays covering all directions and biotic elements in forest plots, such as leaves, branches, and trunks.
By regarding the laser beams emitted by the scanner as solar beams, we can efficiently seek point of the ray intersection against forest scene elements. To simulate the physiological properties of various biotic elements in the modeling forest plot, we classified the uniform sampling points of each tree into two classes, leaf and branch, shown in Figure 7a,b, respectively, which have different optical properties. The intersection point of the ray and the leaf point, determined by its biochemical characteristics and 3D cellular organization, has light absorption , light reflectance , and light transmittance [30]. The intersection point of the ray and the branch point has light absorption, , and light reflectance, , without light transmittance, due to its structural features [31]. Each solar beam with initial energy was traced using a recursive procedure, i.e., the reflected and transmitted rays derived from the initialized solar beams as the material properties of a struck object were recursively traced to find the corresponding intersection point with biotic elements in the modeling forest plot [32]. Due to the initial energy attenuated during the transmittance or reflectance with the corresponding coefficient and , respectively, we stopped the recursion of ray tracing when the initial energy was below threshold value , where represents the rate of minimum light energy. The energy of each uniform sampling point of a tree with an initialized value equal to zero was determined as the accumulated absorption energy of incident, transmitted, and reflected light during the process of ray tracing. Figure 7c shows the light simulation of a single tree, where light is derived from the top left. The brightness of the point in Figure 7c indicates the energy magnitude of the uniform sampling point of a single tree.
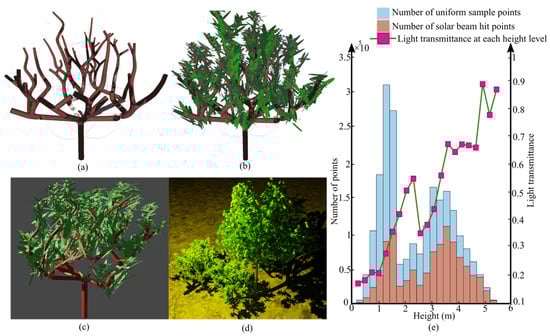
Figure 7.
The schematic diagram draws the light simulation of the forest plot based on the proposed framework. (a,b) The exhibition of branch and leaf sampling points of a single tree. (c) The light simulation of a single tree where light originates from the top left. (d) Light simulation of the modeling forest plot with a solar azimuth angle of 179.01° and an altitude angle of 62.88°. (e) The light transmittance of the forest plot under the solar beams at each height interval, where distribution histograms illustrate the number of uniform sampling points (blue color) and solar beam hit points (red color) at each height level, respectively, and the line chart represents the light transmittance at each height level.
Furthermore, we drew a light simulation of a modeling forest plot composed of six trees with corresponding measurement information in Table 1. This was simulated at 12:00 on 10 September 2022, in Nanjing, when solar light was derived from the position of the sun in the sky, with a solar azimuth angle of 179.01° and an altitude angle of 62.88°, as shown in Figure 7d. Based on the sampling strategy used for each branch and leaf, the light transmittance of each height level, i.e., the ratio of points hit by solar beams to all uniform sampling points with a specific height interval, can be calculated, as shown in Figure 7e. This assumes an upward tendency with an increase in the height level, which conforms to the photosynthetic competition phenomenon that light’s availability to understory trees with crowns extending into the lower parts of the dominant tree is reduced as biodiversity increases [33]. Significant fluctuations appear over the height interval of 1.5~2.5 m, with a small peak, which is mainly attributed to the crown of Mango 1 and Mango 2, with heights of 1.7 m and 1.6 m, respectively, when directly exposed to the solar beams without overlapping vegetative elements from surrounding dominant trees. By virtue of the leaf area of each tree in the modeling forest plot, measured by electromagnetic 3D digitizer (shown in Table 1), the unshaded area and shaded area of leaves for each tree can be estimated, i.e., leaf areas of each tree occupied by uniform sampling points that were (unshaded area) and were not (shaded area) hit by solar beams. Table 4 quantitatively shows the unshaded area and shaded area and the corresponding ratio of leaves for each tree in the modeling forest plot. The ratio of the dominant tree (Rubber 2) with the larger crown is lower than other suppressed trees (Mango 1 and Mango 2) with smaller crowns, which is attributed to their tree crown architecture and the angles at which they accept solar beams. For suppressed trees (Mango 1 and Mango 2) with wider-spreading crowns exposed to full sunlight in the emulated environment, the lower height increases the amount of light with vertical elongation, and the quill-shaped leaves cluster together in a radiant shape, anisotropically growing, which extends the lateral area of the crown and increases the receptor area of solar beams. For the dominated tree (Rubber 2), the higher leaf density (shown in Table 1) and typical conical shape crown with deeper vertical elongation decreases the penetration of light through the clustered foliage, making more nonphotosynthetic components fundamental to the mechanical strength of the whole tree and causing the lower ratio . Furthermore, the existence other subcanopy trees (Apple, Rubber 1, and Walnut) with a low ratio is mainly attributed to the solar light emitted from the sun’s position in the emulated environment, which is overshadowed by a larger and higher tree crown (Rubber 2). In conclusion, the extension of the proposed framework utilized in the light model of a forest plot with lower computational complexity has the potential advantage of capturing and digitizing the heterogeneous light distribution during forest plots, which is a key resource for tree performance.
Table 4.
Unshaded and shaded area of leaves for each tree in the modeling forest plot with the specific sun position at 12:00 on 10 September 2022 in Nanjing.
Extended Experiments of Light Model for the Complex Forest Plot
It is of great interest to model the light transfer within complex and heterogenous forest scenes to research light-dependent biophysiological processes [34]. We drew the light simulation of a mixed tree species plot made up of three coniferous species, Douglas fir, Norway spruce, and Scots pine, and two deciduous species, European beech and European ash. To facilitate the extended experiments, as shown in Figure 8a, three-dimensional models of five tree species were built in the SpeedTree software with realistic morphological and structural characteristics derived from the open LiDAR dataset produced by Dominik Seidel et al. [35]. For each tree species, we generated 50 trees by varying corresponding parameters within reasonable bounds, such as diameter at breast height, crown width, and tree height, using SpeedTree software, which did not change the biotic characteristic of each tree. Then, as mentioned above, the uniform sampling strategy was used to generate uniform sampling points corresponding to the three-dimensional model of each tree species, which was used for light simulation. The hourly light simulation of the mixed tree species plot with different solar altitude angles from 10:00 to 16:00 on 10 September 2022 in Nanjing was drawn with two-hour intervals; the results are shown in Figure 8b (10:00), Figure 8c (12:00), Figure 8d (14:00), and Figure 8e (16:00).
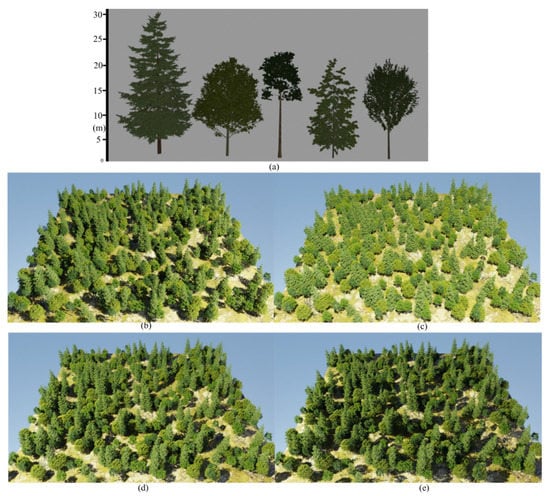
Figure 8.
Light simulation of mixed tree species plot composed of five species in (a). (a) Exemplary three-dimensional models of five tree species built in the SpeedTree software. From left to right: Douglas fir, European beech, Scots pine, Norway spruce, and European ash. (b–e) Light simulation results of mixed tree species plot at different times on 10 September 2022 in Nanjing: (b) at 10:00, (c) at 12:00, (d) at 14:00, and (e) at 16:00.
For each tree species in the emulated mixed plot, the ratio of points hit by solar beams at different times of the day to all uniform sampling points (light transmittance) is shown in Table 5. The solar orientation varies in response to time, thereby affecting the altitude and azimuth angles of transmitted solar beams, and consequently making a difference to the light transmittance of each tree species at different times. For example, the solar altitude angle at noon (12:00) is obviously higher than at other times of the day, casting shorter tree shadows (shown in Figure 8c), and fully exposing most trees in the emulated mixed plot to solar beams, which results in a higher light transmittance of each tree species than at other times. Furthermore, the light transmittance of each tree species at times 10:00 and 14:00 is approximate due to the similar solar altitude angles at these two times causing a similar shadow area (Figure 8b,d) to intercept the propagation of solar beams. Moreover, the ontogenetic leaf form of tree species is another key element making a difference to the light transmittance of trees. Three coniferous species (Douglas fir, Scots pine, and Norway spruce) have higher light transmittance than the other two deciduous species (European beech and European ash) at 12:00 in the day, which is mainly attributed to the needle-like leaves of coniferous species increasing light penetration through the clustered foliage compared to deciduous species with wide and flat leaves.
Table 5.
Light transmittance of five tree species in the emulated mixed plot at different times with corresponding solar azimuth angle and altitude angle , i.e., 10:00 (: 133.91°; : 46.61°), 12:00 (: 180.57°; : 57.01°), 14:00 (: 226.74°; : 46.17°), and 16:00 (: 251.79°; : 23.96°), on 10 September 2022 in Nanjing.
4. Discussion
4.1. Perspective of Mobile Laser Scanning Simulation for Forest Plots
A computer simulation [36] is the reproduction of the behavior of an actual system using a computer to simulate the outcomes of a mathematical model associated with the system. This has become a useful tool for the mathematical modeling of many natural systems in physics, astrophysics, climatology, ecology, and engineering. LiDAR is a popularly used optical active remote sensing technique that measures the phenotypical or topological information of a plant or forest plot [37]. Pioneering studies applying LiDAR technology to forest investigation are limited to benchmarking the presentation of results using arduous manual measurements [38]. Hence, a computer simulation program provides a convenient and reliable evaluation method for efficient forest investigation using LiDAR technology. The modeling forest plot is composed of six trees with in situ measurement information, and the two scanning patterns (i.e., ALS and ground-based MLS) with adjustable parameters are simulated to estimate the performance of the mobile LiDAR system. Our simulation program can extrapolate for any forest plot with different broad-leaf tree species and any other brands of LiDAR sensors with various scanning parameters. Meanwhile, our method presents a framework providing a quantitative assessment of adopting various LiDAR scanning patterns on different forest plots, and offers the validation results to guide users toward the best scanning pattern for actual applications.
The simulation results in Table 3 show that only one-fifth of the total sampling points on branches and leaves are collected by laser beams using airborne and ground-based MLS, with the fastest speed for the vehicle loading LiDAR sensor and coarsest scanning angular resolution. If we set the finest scanning angular resolution (α = 0.08° and β = 0.33°) and slow down the vehicle velocity (v = 1.25 m/s, similar to human walking speed), roughly 50% of the total sampling points and 45% of the total sampling points were obtained by ALS and ground-based MLS, respectively. The reason for the deficiencies in acquiring sampling points for vegetative elements is mainly due to inter-tree competition, with the overlapping of vegetative elements resulting in serious occlusion from the perspective of the scanning angles. In addition, a 41.3° vertical FOV also provides a limited coverage area for laser beams, which results in the point cloud being generated on a small area below the drone collected by ALS and the point cloud covering the middle part of the tree crown collected by ground-based MLS. In the actual scanned data acquisition process, a higher flight altitude and a greater distance between the scanner and target trees should always be adopted to enlarge the scanned area, but the beam spot size and spacing will also increase to lower the sampling precision due to beam divergence and increased scanning distance [11]. Meanwhile, a simplified strategy based on the comparison between the original sampling points and scanned points, used to evaluate the efficacy of different scanning patterns, is proposed to substitute for existing leaf area retrieval methods, e.g., Delaunay triangulation, which aims to transform discrete scanned points into leaf surface [39], and optical plant canopy analysis theory [40]. This would markedly reduce the computational cost and improve the accuracy of the results. Assisted by the ground truth value of the original sampling points, our method removes complications stemming from environmental influences and uses an evaluation framework to assess the efficacy of using any brand of laser sensor in the survey of different type of forests.
4.2. Application Extension about the Light Model of Forest Plots
In this study, we extend the mobile laser scanning simulation program to solar beam illumination, i.e., a light model, for forest plots. Using the precise single-tree structure data provided by an electromagnetic 3D digitizer and efficient intersection program for solar beams and biotic elements in forest plots, we demonstrate that the proposed framework, containing the construction of a digital forest plot and simulation of mobile laser scanning, has good potential in forest plots’ light modeling. The quantitative results in Table 4 of the light simulation of a digital forest plot composed of six trees show that trees with wider-spreading crowns and clumped leaf dispersion (Mango 1 and Mango 2) have higher light transmittance compared with trees that have continuous closed leaf clusters and crowns. As the wider-spreading crowns and clumped, dispersive leaf clusters increase the amount and position of gaps, more solar beams can enter the forest canopy to increase the benefits of light transmittance. On the other hand, the light transmittance of each height level (Figure 7e) reveals a prevalent photosynthetic competition phenomenon in mature forests, where dominant trees more effectively preempt the light resources, leading to lower light availability below the canopy [33]. Furthermore, the extended experimental results in Table 5 show that the light transmittance of every single tree in the forest plot is expected to be primarily determined by the position of the sun and spatial arrangement of canopy gaps derived from the different physiological and anatomical features of trees, which is in accordance with previous research [18,41]. Light conditions change dramatically throughout different times of the day, as determined by the position of the sun. The light quantity in the forest plot increases with the increased solar altitude angle at noon, when the layer of canopy tends to be exposed to incident light with the lowest shading disturbance, leading to a higher light transmittance of each tree species than at other times. Moreover, coniferous trees with needle-like leaves increase the amount and spatial arrangement of canopy gaps and decrease self-shading compared to deciduous trees with broader and dense leaves, with intense self-shading, which makes a difference in interspecific light transmittance [42]. Having access to tree structure data using an electromagnetic 3D digitizer [43] or other remote sensing technology [44] can allow us to directly use the mobile laser scanning simulation program to efficiently simulate solar beam illumination for forest plots, providing a basal component to establish a forest digital twin with the final goal of sustainable forest management [45,46].
However, several limitations exist in the extended experiment of using a light model for forest plots. First, real datasets of light quantity and transmittance within tree crowns are not provided to validate the simulation results reported in Table 4 and Table 5. In practice, examples of capturing the spatial heterogeneity of light transmittance within the tree canopy by combining multiple monitoring applications at different scales are currently missing [10]. The existing method, i.e., the HPEval software tool in MATLAB, is able to calculate the transmission of shortwave radiation in a canopy, which can be used to evaluate light absorption and interception in the tree canopy [34,47]. However, it requires high-resolution hemispherical images of an actual forest plot, which were lacking in our extended experiment of virtually modeling a forest plot. Second, the influence of weather situations on light propagation is overlooked in the extended experiment. Light propagation in the atmosphere is affected by meteorological conditions such as fog, rain, and cloud, which change the Earth’s energy budget by reflecting or absorbing sunlight [48], thereby affecting the light intensity accepted by the surface of the canopy [49]. In future work, the extended light model derived from the proposed mobile laser scanning simulation framework should be improved in three aspects: (1) Constructing a tree model comprehensively, considering the interactions between the genome variations [50] of a study tree and all the micro- and mega-environments encountered during its lifespan, employing deep learning techniques [51]. (2) Allocating a sufficient design margin for the light simulation model to improve the robustness of the model under changing atmospheric and weather conditions. (3) Enriching the monitoring method at forest level to collect high-resolution hemispherical images of forest plots, providing a validation dataset of light transmittance within the canopy, calculated by a corresponding method, such as the HPEval software tool.
5. Conclusions
A simulation program of laser scanning was developed and applied to a forest plot composed of many modeled trees based on the in situ measurement information. The user can adjust the scanning configurations and change scanning patterns to compare the scanned points with the original sampling points regarding the vegetative elements of the forest plots. The conclusion, derived through a simulation experiment, shows that ALS is a preferred pattern, acquiring more complete point cloud data than ground-based MLS, and slowing down the velocity of vehicle loading LiDAR sensors is a more effective way to increase laser beam coverage of the forest’s vegetative elements. Our simulation program can be extended to any forest plot and various brands of scanners. The extended application of the proposed framework as a light model of the emulated forest plot revealed that the light transmittance of trees depends, in part, on both the canopy architecture and differences in leaf dispersion related to leaf size. Trees that have wider-spreading crowns increase the amount of light with lateral elongation, and clumped leaf dispersion augments light’s penetration through the clustered foliage with vertical elongation, which may lead to increased light transmittance. This study opens a promising pathway for qualitatively and quantitatively performing uncertainty analysis using mobile LiDAR technology for the property retrieval of various habitats, which will help develop experiences and guidelines regarding the choice of scanning patterns and scanning configurations to achieve optimal scanned results. Furthermore, the extended application of the proposed framework as a potential light model provides a fundamental component for the design of a forest digital twin to facilitate sustainable forest management, as light is a crucial environmental factor affecting all production by trees and stands.
Author Contributions
Conceptualization, K.J., X.W. and T.Y.; data curation, X.W., F.A., T.Y. and H.Z.; formal analysis, K.J., L.C. and T.Y.; funding acquisition, X.W. and T.Y.; investigation, K.J., X.W. and T.Y.; methodology, K.J., L.C. and T.Y.; project administration, K.J. and T.Y.; software, K.J., L.C. and T.Y.; supervision, F.A., T.Y. and H.Z.; validation, H.Z.; visualization, K.J.; writing—original draft, K.J.; writing—review and editing, K.J., L.C., X.W. and T.Y. All authors have read and agreed to the published version of the manuscript.
Funding
This research was funded by the National Natural Science Foundation of China (grant numbers 32071681 and 31770591), the Central Public-interest Scientific Institution Basal Research Fund for Chinese Academy of Tropical Agricultural Science (1630032022007), the Natural Science Foundation of Jiangsu Province (BK20221337), China, the Jiangsu Provincial Agricultural Science and Technology Independent Innovation Fund Project (CX(22)3048), and Key Laboratory of Land Satellite Remote Sensing Application, Ministry of Natural Resources of the People’s Republic of China (KLSMNR-G202208).
Data Availability Statement
The data presented in this study are available on request from the corresponding author.
Acknowledgments
We are highly grateful to the anonymous reviewers and handling editor for their insightful comments, which greatly improved an earlier version of this paper.
Conflicts of Interest
The authors declare no conflict of interest.
References
- Sun, Y.; Lin, X.; Gong, Y.; Jiang, J.; Zhang, Y.; Wen, X. Multi-Station LiDAR Scanning-Based Hierarchical Features for Generation of an Allometric Stem Volume Model. J. Appl. Remote Sens 2021, 15, 028503. [Google Scholar] [CrossRef]
- Yu, T.; Hu, C.; Xie, Y.; Liu, J.; Li, P. Mature Pomegranate Fruit Detection and Location Combining Improved F-PointNet with 3D Point Cloud Clustering in Orchard. Comput. Electron. Agric. 2022, 200, 107233. [Google Scholar] [CrossRef]
- Zhou, K.; Cao, L.; Liu, H.; Zhang, Z.; Wang, G.; Cao, F. Estimation of Volume Resources for Planted Forests Using an Advanced LiDAR and Hyperspectral Remote Sensing. Resour. Conserv. Recycl. 2022, 185, 106485. [Google Scholar] [CrossRef]
- Xu, Y.; Hu, C.; Xie, Y. An Improved Space Colonization Algorithm with DBSCAN Clustering for a Single Tree Skeleton Extraction. Int. J. Remote Sens. 2022, 43, 3692–3713. [Google Scholar] [CrossRef]
- Cao, L.; Liu, H.; Fu, X.; Zhang, Z.; Shen, X.; Ruan, H. Comparison of UAV LiDAR and Digital Aerial Photogrammetry Point Clouds for Estimating Forest Structural Attributes in Subtropical Planted Forests. Forests 2019, 10, 145. [Google Scholar] [CrossRef]
- Hancock, S.; Essery, R.; Reid, T.; Carle, J.; Baxter, R.; Rutter, N.; Huntley, B. Characterising Forest Gap Fraction with Terrestrial Lidar and Photography: An Examination of Relative Limitations. Agric. Meteorol. 2014, 189–190, 105–114. [Google Scholar] [CrossRef]
- Li, Q.; Yuan, P.; Liu, X.; Zhou, H. Street Tree Segmentation from Mobile Laser Scanning Data. Int. J. Remote Sens. 2020, 41, 7145–7162. [Google Scholar] [CrossRef]
- Khosravipour, A.; Skidmore, A.K.; Isenburg, M.; Wang, T.; Hussin, Y.A. Generating Pit-Free Canopy Height Models from Airborne Lidar. Photogramm. Eng. Remote Sens. 2014, 80, 863–872. [Google Scholar] [CrossRef]
- Gao, X.; Qi, Y.; Dong, B.; Cui, Y.; Hao, S.; Zhao, F.; Wang, H. Impact of Water Level Fluctuations on Habitats of Wintering Migratory Birds Based on Multispectral Data. Spectrosc. Spectr. Anal. 2021, 41, 579–585. [Google Scholar]
- Buonocore, L.; Yates, J.; Valentini, R. A Proposal for a Forest Digital Twin Framework and Its Perspectives. Forests 2022, 13, 498. [Google Scholar] [CrossRef]
- Fan, L.; Powrie, W.; Smethurst, J.; Atkinson, P.M.; Einstein, H. The Effect of Short Ground Vegetation on Terrestrial Laser Scans at a Local Scale. ISPRS J. Photogramm. Remote Sens. 2014, 95, 42–52. [Google Scholar] [CrossRef]
- Yun, T.; Cao, L.; An, F.; Chen, B.; Xue, L.; Li, W.; Pincebourde, S.; Smith, M.J.; Eichhorn, M.P. Simulation of Multi-Platform LiDAR for Assessing Total Leaf Area in Tree Crowns. Agric. Meteorol. 2019, 276–277, 107610. [Google Scholar] [CrossRef]
- Grau, E.; Durrieu, S.; Fournier, R.; Gastellu-Etchegorry, J.P.; Yin, T. Estimation of 3D Vegetation Density with Terrestrial Laser Scanning Data Using Voxels. A Sensitivity Analysis of Influencing Parameters. Remote Sens. Environ. 2017, 191, 373–388. [Google Scholar] [CrossRef]
- Xu, Q.; Cao, L.; Xue, L.; Chen, B.; An, F.; Yun, T. Extraction of Leaf Biophysical Attributes Based on a Computer Graphic-Based Algorithm Using Terrestrial Laser Scanning Data. Remote Sens. 2019, 11, 15. [Google Scholar] [CrossRef]
- Jones, D.; Snider, C.; Nassehi, A.; Yon, J.; Hicks, B. Characterising the Digital Twin: A Systematic Literature Review. CIRP J. Manuf. Sci. Technol. 2020, 29, 36–52. [Google Scholar] [CrossRef]
- Jiang, X.; Jiang, M.; Gou, Y.; Li, Q.; Zhou, Q. Forestry Digital Twin with Machine Learning in Landsat 7 Data. Front. Plant Sci. 2022, 13, 916900. [Google Scholar] [CrossRef] [PubMed]
- Zou, W.; Jing, W.; Chen, G.; Lu, Y.; Song, H. A Survey of Big Data Analytics for Smart Forestry. IEEE Access 2019, 7, 46621–46636. [Google Scholar] [CrossRef]
- Zhang, F.; Dong, Y.; Xu, S.; Yang, X.; Lin, H. An Approach for Improving Firefighting Ability of Forest Road Network. Scand. J. Res. 2020, 35, 547–561. [Google Scholar] [CrossRef]
- Binkley, D.; Campoe, O.C.; Gspaltl, M.; Forrester, D.I. Light Absorption and Use Efficiency in Forests: Why Patterns Differ for Trees and Stands. Ecol. Manag. 2013, 288, 5–13. [Google Scholar] [CrossRef]
- Matsuo, T.; Martínez-Ramos, M.; Bongers, F.; van der Sande, M.T.; Poorter, L. Forest Structure Drives Changes in Light Heterogeneity during Tropical Secondary Forest Succession. J. Ecol. 2021, 109, 2871–2884. [Google Scholar] [CrossRef]
- van der Zande, D.; Stuckens, J.; Verstraeten, W.W.; Mereu, S.; Muys, B.; Coppin, P. 3D Modeling of Light Interception in Heterogeneous Forest Canopies Using Ground-Based LiDAR Data. Int. J. Appl. Earth Obs. Geoinf. 2011, 13, 792–800. [Google Scholar] [CrossRef]
- Nasirahmadi, A.; Hensel, O. Toward the Next Generation of Digitalization in Agriculture Based on Digital Twin Paradigm. Sensors 2022, 22, 498. [Google Scholar] [CrossRef] [PubMed]
- Huang, H.; Qin, W.; Liu, Q. RAPID: A Radiosity Applicable to Porous IndiviDual Objects for Directional Reflectance over Complex Vegetated Scenes. Remote Sens. Environ. 2013, 132, 221–237. [Google Scholar] [CrossRef]
- Sinoquet, H.; Pincebourde, S.; Adam, B.; Donès, N.; Phattaralerphong, J.; Combes, D.; Ploquin, S.; Sangsing, K.; Kasemsap, P.; Thanisawanyangkura, S.; et al. 3-D Maps of Tree Canopy Geometries at Leaf Scale. Ecology 2009, 90, 283. [Google Scholar] [CrossRef]
- Birdal, T.; Ilic, S. A Point Sampling Algorithm for 3D Matching of Irregular Geometries. In Proceedings of the 2017 IEEE/RSJ International Conference on Intelligent Robots and Systems (IROS), Vancouver, BC, Canada, 24–28 September 2017. [Google Scholar]
- Niklas, K.J.; Spatz, H.C. Allometric Theory and the Mechanical Stability of Large Trees: Proof and Conjecture. Am. J. Bot. 2006, 93, 824–828. [Google Scholar] [CrossRef] [PubMed]
- Blomley, R.; Hovi, A.; Weinmann, M.; Hinz, S.; Korpela, I.; Jutzi, B. Tree Species Classification Using within Crown Localization of Waveform LiDAR Attributes. ISPRS J. Photogramm. Remote Sens. 2017, 133, 142–156. [Google Scholar] [CrossRef]
- Gao, D.; Wang, L.; Hu, B. Spectrum Efficient Communication for Heterogeneous IoT Networks. IEEE Trans. Netw. Sci. Eng. 2022, 9, 3945–3955. [Google Scholar] [CrossRef]
- Gao, D.; Wang, S.; Liu, Y.; Jiang, W.; Li, Z.; He, T. Spoofing-Jamming Attack Based on Cross-Technology Communication for Wireless Networks. Comput. Commun. 2021, 177, 86–95. [Google Scholar] [CrossRef]
- Ma, L.; Upadhyaya, M.K. Effects of Leaf Position on Reflectance, Transmittance and Absorption of Red and Far-Red Light in Tomato, Chenopodium album and Amaranthus retroflexus Leaves. Weed Res. 2018, 58, 17–24. [Google Scholar] [CrossRef]
- Farrell, R.W. Structural Features Related to Tree Crotch Strength. Ph.D. Thesis, Virginia Polytechnic Institute and State University, Blacksburg, VA, USA, 2003. [Google Scholar]
- Li, W.; Guo, Q.; Tao, S.; Su, Y. VBRT: A Novel Voxel-Based Radiative Transfer Model for Heterogeneous Three-Dimensional Forest Scenes. Remote Sens. Environ. 2018, 206, 318–335. [Google Scholar] [CrossRef]
- Hunt, B.; Pratt, E.; Gadagkar, V.; Yamashita, M.; Balatsky, A.V.; Davis, J.C. Evidence for a Superglass State in Solid 4He. Science 2009, 324, 632–636. [Google Scholar] [CrossRef] [PubMed]
- Xue, X.; Jin, S.; An, F.; Zhang, H.; Fan, J.; Eichhorn, M.P.; Jin, C.; Chen, B.; Jiang, L.; Yun, T. Shortwave Radiation Calculation for Forest Plots Using Airborne LiDAR Data and Computer Graphics. Plant Phenomics 2022, 2022, 9856739. [Google Scholar] [CrossRef] [PubMed]
- Seidel, D.; Annighöfer, P.; Thielman, A.; Seifert, Q.E.; Thauer, J.H.; Glatthorn, J.; Ehbrecht, M.; Kneib, T.; Ammer, C. Predicting Tree Species From 3D Laser Scanning Point Clouds Using Deep Learning. Front. Plant Sci. 2021, 12, 635440. [Google Scholar] [CrossRef]
- Lima, J.; Gonçalves, J.; Costa, P.; Moreira, A. Modeling and Simulation of a Laser Scanner Sensor: An Industrial Application Case Study. In Advances in Sustainable and Competitive Manufacturing Systems; Springer: Heidelberg, Germany, 2013. [Google Scholar] [CrossRef]
- Xu, S.; Yun, J.; Xu, S. An Effectively Dynamic Path Optimization Approach for the Tree Skeleton Extraction from Portable Laser Scanning Point Clouds. Remote Sens. 2021, 14, 94. [Google Scholar] [CrossRef]
- Cao, L.; Zhang, Z.; Yun, T.; Wang, G.; Ruan, H.; She, G. Estimating Tree Volume Distributions in Subtropical Forests Using Airborne LiDAR Data. Remote Sens. 2019, 11, 97. [Google Scholar] [CrossRef]
- Li, Q.; Yuan, P.; Lin, Y.; Tong, Y.; Liu, X. Pointwise Classification of Mobile Laser Scanning Point Clouds of Urban Scenes Using Raw Data. J. Appl. Remote Sens. 2021, 15, 024523. [Google Scholar] [CrossRef]
- Li, Y.; Guo, Q.; Su, Y.; Tao, S.; Zhao, K.; Xu, G. Retrieving the Gap Fraction, Element Clumping Index, and Leaf Area Index of Individual Trees Using Single-Scan Data from a Terrestrial Laser Scanner. ISPRS J. Photogramm. Remote Sens. 2017, 130, 308–316. [Google Scholar] [CrossRef]
- Sercu, B.K.; Baeten, L.; van Coillie, F.; Martel, A.; Lens, L.; Verheyen, K.; Bonte, D. How Tree Species Identity and Diversity Affect Light Transmittance to the Understory in Mature Temperate Forests. Ecol. Evol. 2017, 7, 10861–10870. [Google Scholar] [CrossRef]
- Wang, Z.; Zhang, X.; Zheng, J.; Zhao, Y.; Wang, J.; Schmullius, C. Design of a Generic Virtual Measurement Workflow for Processing Archived Point Cloud of Trees and Its Implementation of Light Condition Measurements on Stems. Remote Sens. 2021, 13, 2801. [Google Scholar] [CrossRef]
- Wang, Z.; Shen, Y.; Zhang, X.; Zhao, Y.; Schmullius, C. Processing Point Clouds Using Simulated Physical Processes as Replacements of Conventional Mathematically Based Procedures: A Theoretical Virtual Measurement for Stem Volume. Remote Sens. 2021, 13, 4627. [Google Scholar] [CrossRef]
- Fan, X.; Luo, P.; Mu, Y.; Zhou, R.; Tjahjadi, T.; Ren, Y. Leaf Image Based Plant Disease Identification Using Transfer Learning and Feature Fusion. Comput. Electron Agric. 2022, 196, 106892. [Google Scholar] [CrossRef]
- Han, W.; Cao, L.; Xu, S. A Method of the Coverage Ratio of Street Trees Based on Deep Learning. Int. J. Interact. Multimed. Artif. Intell. 2022, 7, 23. [Google Scholar] [CrossRef]
- Wang, J.; Fan, X.; Yang, X.; Tjahjadi, T.; Wang, Y. Semi-Supervised Learning for Forest Fire Segmentation Using UAV Imagery. Forests 2022, 13, 1573. [Google Scholar] [CrossRef]
- Jonas, T.; Webster, C.; Mazzotti, G.; Malle, J. HPEval: A Canopy Shortwave Radiation Transmission Model Using High-Resolution Hemispherical Images. Agric. Meteorol. 2020, 284, 107903. [Google Scholar] [CrossRef]
- Yang, X.; Wang, Y.; Liu, X.; Liu, Y. High-Precision Real-Time Forest Fire Video Detection Using One-Class Model. Forests 2022, 13, 1826. [Google Scholar] [CrossRef]
- Nandi, D.; Maitra, A. The Effects of Rain on Millimeter Wave Communication for Tropical Region. In Proceedings of the 2019 URSI Asia-Pacific Radio Science Conference (AP-RASC), New Delhi, India, 9–15 March 2019. [Google Scholar]
- Zhang, F.; Bai, D. The Complete Chloroplast Genome of Citrus Medica (Rutaceae). Mitochondrial DNA Part B 2020, 5, 1627–1629. [Google Scholar] [CrossRef]
- Gao, X.; Niu, S.; Wei, D.; Liu, X.; Wang, T.; Zhu, F.; Dong, J.; Sun, Q. Joint Metric Learning-Based Class-Specific Representation for Image Set Classification. IEEE Trans. Neural Netw. Learn. Syst. 2022, 1–15. [Google Scholar] [CrossRef]


Publisher’s Note: MDPI stays neutral with regard to jurisdictional claims in published maps and institutional affiliations. |
© 2022 by the authors. Licensee MDPI, Basel, Switzerland. This article is an open access article distributed under the terms and conditions of the Creative Commons Attribution (CC BY) license (https://creativecommons.org/licenses/by/4.0/).