Abstract
Improved knowledge of nutrient removals from harvesting is essential for the sustainable management of Moso bamboo forests. In particular, the growth and development of bamboo forests are considered to meet the increasing demand for biomass energy. In this study, plots with an 8 m width strip cut (SC) after five years of restoration were selected as the research object and the traditional management forest (CK) as the control. The nutrient content and biomass of Moso bamboo at different ages were studied and the nutrient storage was calculated. The results showed that five years after cutting, the soil nutrient content in different soil layers and the aboveground nutrient storage reached the same level as the CK. The nutrient ranking of each organ of Moso bamboo was nitrogen > potassium > phosphorus. The phosphorus content of bamboo culm in CK was significantly higher than that in SC at different ages (p < 0.05). The biomass accumulation of each organ of Moso bamboo was culm > branch > leaf. In addition, the relationship between nutrient storage and DBH and density in SC is a simple power form, and the coefficient of determination of most computational models is above 0.9. Our results demonstrated that strip cutting is more economical than traditional management, but nutrient addition is needed to improve the quality of new bamboo trees at the initial stage of recovery in consideration of long-term productivity maintenance.
1. Introduction
Moso bamboo (Phyllostachys edulis) is an important biomass energy source [1]. According to the 2019 China Forest Resources Report, China has 6.41 million hm2 of bamboo forests [2]. Among them, 72.96% of the total bamboo forest in China is Moso bamboo, covering an area of 4.67 million hm2 [3]. Increased demand for biomass fuels may lead to more harvesting of bamboo biomass. The traditional management method of the bamboo forest includes bamboo shoot thinning and cutting down the trees older than 6 years of age in the year that they produce numerous new bamboo shoots. Therefore, all bamboo shoots are harvested in the year that produces only a few new shoots [4]. At present, the shortage of labor has restricted bamboo cultivation and development [5]. Therefore, based on the physiological integration characteristics, experts proposed a strip-cutting method for Moso bamboo forest management to reduce cutting costs [6]. Previous studies have reached relatively consistent conclusions on the optimal width for strip cutting [7,8]. However, the difference in aboveground nutrient storage between strip cut plots after one recovery cycle and traditional management plots has not been reported.
In contrast with traditional management methods, strip cutting can effectively reduce the harvesting cost and improve harvesting efficiency, but it removes many nutrients at one time, which breaks the nutrient cycle and balance of the bamboo forest ecosystem [5]. The average diameter at breast height and height of new bamboo trees in the optimal bandwidth cut plots were lower than those in the traditional management plots [7,8], which to a certain extent reflects the degradation of bamboo forest productivity after cutting [9]. Although this degradation trend has not yet had a significant impact on productivity [10], owing to the strip-cut forest still being of an early stage, the soil has a good foundation, the litter decomposition of organic matter and others contains substantial nutrients, and organic matter in the cycle of certain nutrients can meet the demand of most of the plants [4]. Harvesting alters bamboo forest structure [11] and increases the risk of nutrient loss, including reduced nutrient return [4] and increased exposure to rainfall leaching and trunk runoff [12]. Therefore, if harvesting in Moso bamboo forests is to meet the energy demand, a detailed study of the nutrient storage of bamboo forests by harvesting is urgently needed, as bamboo productivity after long-term rotation may be limited by nutrient deficits.
In this study, we used strip cutting (SC) and traditional logging (CK) of Moso bamboo forests to investigate the difference in nitrogen, phosphorus, and potassium storage between SC after one recovery cycle and CK. The objectives of this study are to (1) obtain detailed information on nutrient content and biomass accumulation in Moso bamboo; (2) quantify nutrient storage under different harvesting patterns; and (3) provide a theoretical basis of nutrient management for the long-term rotation of bamboo forest with strip cutting.
2. Material and Methods
2.1. Experimental Sites
The study was conducted on the Yixing forest farm in southern Jiangsu Province, China (Figure 1). The experimental area is within the marine monsoon climate zone in the subtropical region. The lowest temperature is −4.5 °C and the highest is 38.8 °C, and the average annual and monthly temperature are 16.5 °C and 28.3 °C, respectively [5]. Rainfall occurs throughout the four seasons, with an average annual precipitation of 1229.9 mm. The predominant understory species include Salvia prionitis, Oxalis corniculata, and Paederia cruddasiana [11].
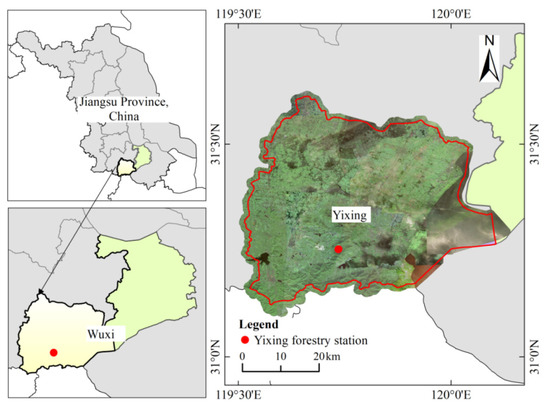
Figure 1.
Location of the study area.
2.2. Experimental Design
According to the nutrient utilization cycle, the growth and development of Moso bamboo is divided into the on-year and off-year [13]. During the on-year, many shoots sprout [14]; however, in the off-year, the dynamics of new bamboo shoots were reversed [15]. A 1-year-old bamboo was labeled as “du”, and thereafter marked as a sub-degree bamboo according to a 2-year vegetative cycle [4]. For example, 2- to 3-year-old bamboos are labeled II “du”, and III “du” represents a 4- to 5-year-old bamboo forest.
In February 2017 (on-year), Moso bamboo forests with the same stand structure, management measures, and slope were selected for the experiment. Three strip-cut (SC) plots with a length of 20 m and a width of 8 m were set. The same width of the reserved plots was set on both sides of the SC. The function of the reserved plots was to transport nutrients to support the growth and development of the new bamboo in the SC through the underground whip root system [11]. Meanwhile, trenches 50 cm wide and 50 cm deep were dug around the plots to eliminate long-distance nutrient transport. Three traditional management plots (20 m × 20 m) were set as the control (CK). The management methods for the CK include including digging bamboo shoots and artificial selective harvest of old bamboo in the on-year, and digging all bamboo shoots in the off-year. The SC were monitored for five consecutive years. After five years of restoration (including three on years), the age structure in SC can reach the level of CK. Additionally, new bamboo characteristics, stand density, and aboveground biomass in two treatment plots are shown in Table 1.

Table 1.
Basic information of different treatment plots in 2021.
2.3. Biomass Determination and Sample Extraction
The biomass survey time of the two treatment plots was in November 2021. On the one hand, the management of Moso bamboo was concentrated in the on-year, and the assessment of the recovery level at this time could provide a scientific basis for formulating reasonable management measures over time. On the other hand, cutting Moso bamboo in winter can reduce the damage caused by pests and diseases. The standard bamboo was selected according to the mean diameter at breast height and bamboo height to investigate the biomass. Twelve standard bamboo of different ages were selected from each treatment plot. The whole plant was divided into leaves, culm, and branches. Samples were oven-dried at 65 °C to a constant weight and then weighed. The biomass of each organ at stand level was calculated according to Equation (1).
where x is the age (I, II, and III “du”) of bamboo; y refers to the different treatment (SC and CK) plots; wxy is the average dry weight of x-year-old standard bamboo culms, branches, and leaves in y; nx is the number of x-year-old bamboo; Wxy is the total dry weight of leaves, branches, and culms of x-year-old bamboo in y.
Wxy = nxwxy
The standard bamboo was divided into four layers according to height, and samples of bamboo branch, culm, and leaf were taken. Samples obtained from the same age class bamboo plants in the same treatment plot were composed of a mixed sample. The samples were dried in an oven at 65 °C to constant weight. The dried samples were ground in a mill and passed through a 2 mm (10 mesh) sieve.
In our study, we did not consider nutrients in the underground whip root system because the bamboo stump, whip, and root were not removed during the harvesting process. In addition, the total removal of aboveground biomass may lead to the death of a part of the root, thus affecting the root decomposition. The nutrient return rate of root affected soil nutrient content in different cutting methods. However, little is known about the decomposition rate of bamboo whips at different ages, and the complexity of the spatial distribution of roots and the differences in nutrient concentrations in underground bamboo whips are poorly understood. Therefore, we excluded the root system from the calculation.
2.4. Soil Sampling
In each plot, sequential soil coring was used to extract 10 soil cores in November 2021. Sampling was conducted at 0–10 cm, 10–20 cm, and 20–40 cm. Cores from the same layer were mixed as one composite sample. The mixed samples were placed in a cool place to air dry. The aired soil was ground and passed through a 2 mm sieve. A part of the sample was placed for available nutrient determination. The remaining samples were then further ground to pass through a 0.149 mm sieve for the determination of total nutrients.
2.5. Chemical Analysis
Soil total nitrogen was determined using the Kjeldahl method, and alkali-hydrolyzed nitrogen was determined using the alkali-hydrolyzed diffusion method (LY/T 1228-2015). Soil total phosphorus was detected by the alkali fusion-molybdo-antimony resistance colorimetric method, and available phosphorus was detected using the molybdo-antimony resistance colorimetric method (LY/T 1232-2015). Soil total potassium was detected using an alkali fusion flame photometer, and available potassium was detected using an ammonium acetate extraction flame photometer (LY/T 1234-2015).
2.6. Statistical Analysis
One-way analysis of variance and T-tests were used to measure differences between tree compartments of nutrient content and dry weights between sites, and statistical significance was set at p ≤ 0.05. All statistical analyses were performed in the software package SPSS (IBM Crop, Version 19.0, Armonk, NY, USA), and the data were calculated using Excel 2016 [16]. All graphs were drawn in the program R [17] using the ggplot2 package. Non-linear regressions with two explanatory variables were used to calculate biomass and associated nutrient storage of stand compartments from the dynamics of mean tree diameter and stand density during the restoration in SC. Due to the small annual dynamic differences in average DBH and average density in CK, nutrient storage in CK was not simulated.
3. Result
3.1. Soil Nutrients
In the 0–10 cm soil layer, total nitrogen and available phosphorus in SC were significantly higher than those in CK (Table 2, p ≤ 0.05). In addition, the available potassium content of 20–40 cm soil in SC was significantly higher than that in CK (p ≤ 0.05). There was no significant difference in the nutrient content of 10–20 cm soil between the two treatment plots. Soil available phosphorus content in SC and CK decreased significantly with the increase of soil layer (p ≤ 0.05).
Table 2.
Soil nutrients per sampling layer of the two study sites.
3.2. Bamboo Nutrients
The nutrient ranking of each organ of Moso bamboo was nitrogen > potassium > phosphorus (Figure 2). The nitrogen content of the III “du” bamboo culm in SC was significantly higher than that in CK (Figure 2A, p ≤ 0.05). The phosphorus content of bamboo culm in CK was significantly higher than that in SC at different ages (Figure 2B, p ≤ 0.05). The nitrogen content of II and III “du” bamboo branches in SC was significantly higher than that in CK (Figure 2D, p ≤ 0.05). There were no significant differences in the contents of N, P, and K in bamboo leaves in different age trees between the two treatment plots (Figure 2G–I).
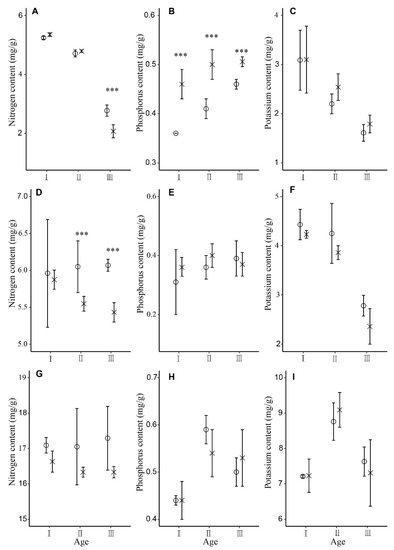
Figure 2.
Nutrient content of Moso bamboo culm (A–C), branch (D–F), and leaf (G–I) at different ages at the two study sites SC (o) and CK (x). Error bars represent standard deviation (n = 3). Asterisks indicate differences between study sites at different levels of significance: p ≤ 0.001 = ***. I “du” bamboo refers to a 1-year-old bamboo, II “du” refers to 2–3-year-old bamboo, and III “du” refers to 4–5-year-old bamboo.
In the two treatment plots, the contents of nitrogen and potassium in bamboo culm gradually decreased with the increase of bamboo age (Figure 2A,C), and the content of phosphorus gradually increased with the increase of age (Figure 2B). The nitrogen content of the branch increased gradually with the increase of age in SC, while it decreased in CK (Figure 2D). Potassium content in the branch decreased gradually with the increase of bamboo age in the two treatment plots (Figure 2F). The nitrogen content of bamboo leaves in the two treatment plots showed no obvious trend of change in Moso bamboo at different ages (Figure 2G), while the phosphorus and potassium contents increased first and then decreased with the increase of age (Figure 2H,I).
3.3. Biomass Accumulation
The biomass accumulation of each organ of Moso bamboo was culm > branch > leaf (Figure 3). After 5 years of restoration, there was no significant difference between the biomass accumulation of organs of Moso bamboo at different bamboo ages in SC and CK (Figure 3). The biomass accumulation of branches and leaves in III “du” trees was lower than that in I and II “du” trees. The biomass accumulation of culm in III “du” trees was lower than that of II and III “du” trees.
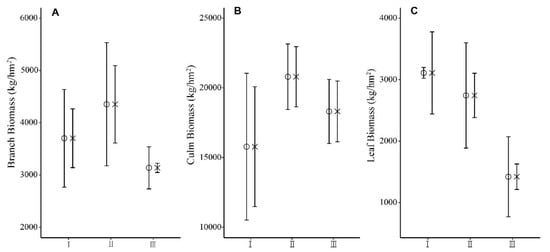
Figure 3.
Biomass accumulation of Moso bamboo branch (A), culm (B), and leaf (C) at different ages at the two study sites SC (o) and CK (x). Error bars represent standard deviation (n = 3). I “du” bamboo refers to a 1-year-old bamboo, II “du” refers to 2–3-year-old bamboo, and III “du” refers to 4–5-year-old bamboo.
3.4. Nutrient Storage
In two treatment plots, bamboo culm biomass accounted for the highest proportion of the total aboveground biomass (Table 3). Therefore, the nutrient storage in the culm occupies the largest proportion of the total nutrient storage, especially phosphorus. More biomass and nutrients were allocated to branches and leaves in SC. Additionally, the biomass accumulation and potassium storage in SC were higher than those in CK, while the nitrogen and phosphorus storage were lower than those in CK (Table 3). Compared with CK, more K and less P were stored in the aboveground part of SC (p ≤ 0.05).
Table 3.
Biomass (t/hm2) and nutrient storage (kg/hm2) of tree compartments of Moso bamboo at strip clearcut (SC), and traditional management (CK) plots.
Based on the data of the 5-year dynamic monitoring of the recovery of SC, we further developed regression models to determine nutrient storage as a function of DBH and density. In general, the relationship between nutrient storage and DBH and density is a simple power form (similar to the allometric function of biomass), and the coefficient of determination of most computational models is above 0.9, which emphasizes the adaptability of power models in predicting nutrient storage (Table 4).
Table 4.
Models for the estimation of nutrient storage (kg/hm2) as a function of dbh (cm) and density (individual/hm2) for the total above-ground biomass of Moso bamboo in SC.
All models are based on the equation:
a, b, and c are regression coefficients, dbh is the tree diameter at breast height; density is the bamboo number per hectare.
a·dbhbdensityc
4. Discussion
4.1. Differences in Soil Nutrients
The nutrient elements demanded for the growth of bamboo include K, N, P [18], Si, Ca [19], Zn, and B [20]. Except for nitrogen, phosphorus, and potassium, the content of other elements in the soil can satisfy the growth of Moso bamboo [13]. Therefore, studies on the nutrients of Moso bamboo mainly focus on nitrogen, phosphorus, and potassium. Studies have shown that biogeochemical processes after cutting change due to changes in species composition, root uptake requirements, soil conditions, and microbial activities [21] leading to short-term increases in nutrient concentrations in soil solutions [22]. By investigating the physical and chemical properties of bamboo forest soil after cutting with different cutting widths, they found that after one growing season, the soil quality of the cut plots was higher than that of the traditional management plots, indicating that strip cutting improved soil fertility in the short term [7]. It was mainly the change in the light environment in the forest [23] and the increase of soil microorganisms [8] that promoted the decomposition of litter [4]. It has been reported that litter provides more than 70% of plant growth nutrients that can be obtained through nutrient return [24]. Moso bamboo is a fast-growing grass plant, and the nutrients needed during the growth of bamboo trees in the harvesting plot are mainly provided by the female bamboo in the reserved belt by physiological integration [25], but the bamboo in the stand only relies on soil nutrient cycling to maintain fertility [26]. Studies have shown that, in soils with higher fertility, rather than accelerating the decomposition and absorption of litter, plants tend to extract nutrients from the soil more efficiently [27]. This indicates that the reduction of standing bamboo density after cutting provides more fertile soil conditions for the growth of new bamboo trees [4]. With the restoration of strip cut plots, bamboo forest structure and microenvironment tended to be at the same level as normal plots, and the increase of standing bamboo increased the demand for nutrients, thus reducing the content of nutrients in the soil. Fan et al. [28] evaluated the soil quality of Moso bamboo stands with different densities, and they found that soil total nitrogen, available phosphorus and available potassium contents gradually increased with the increase of stand density. This is consistent with our results that the bamboo standing density in the SC was higher than that in the CK (Table 1).
In addition, the roots of the Moso bamboo forest were mainly concentrated in the 0–20 cm soil layer, and the productivity level was most strongly affected by the nutrient content in the surface soil [5]. The I~III “du” trees are considered to be young. At this time, bamboo has a strong physiological metabolism, fast dry matter accumulation rate, strong whipping ability of the underground root system, and high shoot emergency rate [13]. The growth of whipping roots is also affected by the age and spatial structure of above-ground bamboo. The time of soil sampling was during the bamboo shoot period. The consumption of phosphorus and potassium in the stand is increased during the period of bamboo shoots emergency [13]. Therefore, more phosphorus and potassium are converted into available nutrients in SC.
4.2. Differences in Tissue Nutrients
There were significant differences in the content of nutrient elements in different organs of Moso bamboo. Bamboo culm, branch, and leaf contain more nitrogen and potassium, but less phosphorus [13]. As a photosynthetic organ, the amounts of phosphorus, nitrogen, and potassium in the leaf were significantly higher than those in other organs [13]. Additionally, in each organ, the content of nitrogen is the highest, followed by potassium and phosphorus [29]. This is consistent with our findings. However, according to previous studies, the nitrogen content in the organs of III “du” bamboo was slightly lower than that of I “du” and II “du” bamboo, while the phosphorus content in I “du” was lower than II and III “du” bamboo [13]. The potassium content of II and III “du” bamboo was significantly lower than that of I “du” bamboo [9].
In our study, the nitrogen content of the branch increased gradually with the increase of age in SC, while it decreased in CK (Figure 2). Eco-chemical dynamic equilibrium theory believes that organisms can form a steady-state mechanism to maintain the stability of nutrient elements and achieve dynamic equilibrium when the environment fluctuates in a small range [29]. Nutrient reabsorption provides nutrients to developing tissues through the transport of nutrients [30]. We cut and manage the CK plots every other year. The development and growth of Moso bamboo are achieved not only by absorbing nutrient elements from the soil, but also by transferring nutrients and photosynthates from leaves or stems to growing organs [31]. It has been suggested that there is a balance between soil and internal plant nutrient supply, with trees using the most readily available nutrients [32]. Therefore, we believe that the transport efficiency of nitrogen in bamboo shoots in CK can be improved to meet the demand for the culm and leaf. In addition, our study also found that the potassium content in the leaf of II “du” bamboo was higher than that of I and III “du” bamboo. Potassium in plants has a high reabsorption efficiency [31]. Nutrient reuptake by leaves has a strong potential to reduce soil nutrient supply [33]. Thus, we believe that the nutrient reabsorption efficiency of potassium in the leaf of I and III “du” bamboo is high.
4.3. Implications for Nutrient Management
There are also differences in biomass accumulation of Moso bamboo at different developmental stages [34]. After bamboo formation, DBH and height remained stable. The biomass accumulation of II and III “du” bamboo was significantly higher than that of I “du” bamboo, and there was no significant difference in the biomass of II and III “du” bamboo, which indicates that when the growth of Moso bamboo grew to II “du” bamboo, the accumulation of dry matter began to slow down [13]. In our study, there was no significant difference between the biomass accumulation of organs of Moso bamboo at different bamboo ages in SC and CK (Figure 3). On the one hand, we believe that the bamboo forest density in CK is lower than that in SC, and the number of new trees formed in 2021 in SC reaches the level of CK (Table 1), which means that there is no significant difference in the biomass accumulation of I “du” bamboo in the two treatment plots. On the other hand, the quality of new trees decreased after the initial cutting, and the non-structural carbohydrate content of organs of new bamboo in SC was lower than that in CK [7]. However, the gibberellin content of bamboo whip bud increased, which broke the dormancy of bamboo whip bud, and the number of new trees per unit area in SC was greater than that in CK [8]. We found that the increase in quantity made up for the difference in the loss of quality per plant. In addition, with the increase in stand density, Moso bamboo can improve the nutrient use efficiency by adjusting the distribution pattern of biomass [5]. Therefore, there was no significant difference in the biomass accumulation of II and III “du” bamboo between the two treatment plots.
It has been suggested that harvesting, especially whole-plant removal, has a negative impact on nutrient balance [35]. However, Pyttel et al. [36] cut oak (Quercus petraea) forests with different intensities and found by studying the nutrient pool that harvesting the whole tree would not significantly reduce the nutrient pool of the ecosystem in places with large soil nutrient content. The long-term restoration goal of logging forests should be the long-term sustainable restoration of the forest ecosystem. In our study, from the perspective of nutrient storage, it was verified that there was no difference between CK and SC after 5 years of recovery. Where nutrients are abundant, strip cutting is permitted. However, it is necessary to consider the effect of long-term rotation cutting on nutrient cycling in the bamboo forest ecosystem. Although new trees can develop in a short time after clear-cutting, surface runoff and leaching still affect the loss of nutrients. In addition, attention should be paid to the effect of new tree quality after rotation cutting. Although DBH and the height of Moso bamboo need not be considered from the perspective of biomass energy utilization, the characteristics of new bamboo are closely related to the long-term productivity of the plot. It may be possible to improve the quality of new bamboo after cutting by applying fertilizer to bamboo forests before clear-cutting. The traditional harvesting method has been maintained for many years, and no negative effect has been found on the bamboo forest. Additional nutrient management practices need to be explored.
5. Conclusions
By comparing the aboveground nutrient storage between CK and SC during one recovery period, it was found that there was no significant difference in aboveground nutrient storage and soil nutrient content between the two harvesting methods. However, it is necessary to consider the relationship between the quality of new bamboo trees and long-term productivity maintenance. If necessary, nutrient storage in the underground whip root system can be increased by fertilization prior to clear-cutting to provide new quality bamboo trees. Although no negative effects on new trees’ growth have been found under traditional management methods, long-term monitoring is still needed.
Author Contributions
Y.Z., Y.F., M.Z., X.Z. (Xuan Zhang), X.Z. (Xiao Zhou) collected data; Y.Z. analyzed data; S.F. and F.G. contributed critically to improve the manuscript, and gave a final approval for publication. All authors have read and agreed to the published version of the manuscript.
Funding
This research was supported by the Basic scientific research funding of International Center For Bamboo and Rattan (Grant No. 1632020023).
Data Availability Statement
Not applicable.
Conflicts of Interest
The authors declare no conflict of interest.
References
- Cao, Y.; Bai, Y.; Du, J. Co-gasification of rice husk and woody biomass blends in a CFB system: A modeling approach. Renew. Energy 2022, 188, 849–858. [Google Scholar] [CrossRef]
- National Forestry and Grassland Administration. China Forest Resources Report; China Forest Publishing House: Beijng, China, 2019. [Google Scholar]
- Zheng, Y.; Guan, F.; Fan, S.; Yan, X.; Huang, L. Biomass Estimation, Nutrient Content, and Decomposition Rate of Shoot Sheath in Moso Bamboo Forest of Yixing Forest Farm, China. Forests 2021, 12, 1555. [Google Scholar] [CrossRef]
- Zheng, Y.; Guan, F.; Fan, S.; Yan, X.; Huang, L. Dynamics of Leaf-Litter Biomass, Nutrient Resorption Efficiency and Decomposition in a Moso Bamboo Forest after Strip Clearcutting. Front. Plant Sci. 2022, 12, 799424. [Google Scholar] [CrossRef] [PubMed]
- Zheng, Y.; Guan, F.; Fan, S.; Zhou, Y.; Jing, X. Functional Trait Responses to Strip Clearcutting in a Moso Bamboo Forest. Forests 2021, 6, 793. [Google Scholar] [CrossRef]
- Fan, S.; Liu, G.; Su, W.; Cai, C.; Guan, F. Advances in Research of Bamboo Forest Cultivation. For. Res. 2018, 31, 137–144. [Google Scholar] [CrossRef]
- Zeng, X. Recovery Characteristics and Influencing Factors of Moso Bamboo Forests under Different Strip Clearcutting in South Anhui Province; Chinese Academy of Forestry: Beijing, China, 2019. [Google Scholar]
- Wang, S. Study on Response Characteristics of Underground Whip Root System and Ground Growth of Phyllostachys edulis Forests under Different Strip Cutting; Chinese Academy of Forestry: Beijing, China, 2021. [Google Scholar]
- Liu, G. Study on the Mechanism of Maintaining Long-term Productivity of Bamboo Forest; Chinese Academy of Forestry: Beijing, China, 2009. [Google Scholar]
- Zheng, Y.; Fan, S.; Zhou, X.; Zhang, X.; Guan, F. Dynamics of stand productivity in Moso bamboo forest after strip cutting. Front. Plant Sci. 2022, 13, 1064232. [Google Scholar] [CrossRef]
- Zheng, Y.; Fan, S.; Guan, F.; Xia, W.; Wang, S.; Xiao, X. Strip Clearcutting Drives Vegetation Diversity and Composition in the Moso Bamboo Forests. For. Sci. 2022, 68, 27–36. [Google Scholar] [CrossRef]
- Ma, C.; Luo, Y.; Shao, M.; Jia, X. Estimation and testing of linkages between forest structure and rainfall interception characteristics of a Robinia pseudoacacia plantation on China’s Loess Plateau. J. For. Res. 2022, 33, 529–542. [Google Scholar] [CrossRef]
- Su, W. Fertilization Theory and Practice for Phyllostachys Edulis Stand Based on Growth and Nutrient Accumulation Rules; Chinese Academy of Forestry: Beijing, China, 2012. [Google Scholar]
- Song, X.; Peng, C.; Zhou, G.; Gu, H.; Quan, L.; Chao, Z. Dynamic allocation and transfer of non-structural carbohydrates, a possible mechanism for the explosive growth of Moso bamboo (Phyllostachys heterocycla). Sci. Rep. 2016, 6, 25908. [Google Scholar] [CrossRef] [PubMed]
- Li, L.; Li, N.; Lu, D.; Chen, Y. Mapping Moso bamboo forest and its on-year and off-year distribution in a subtropical region using time-series Sentinel-2 and Landsat 8 data. Remote Sens. Environ. 2019, 231, 111265. [Google Scholar] [CrossRef]
- Encyclopedia Britannica. The Editors of Encyclopaedia. “Microsoft Excel”; Encyclopedia Britannica: Chicago, IL, USA, 2019. [Google Scholar]
- Team, R.C. R: A Language and Environment for Statistical; R Foundation for 417 Statistical Computing: Vienna, Austria, 2020. [Google Scholar]
- Embaye, K.; Weih, M.; Ledin, S.; Christersson, L. Biomass and nutrient distribution in a highland bamboo forest in southwest Ethiopia: Implications for management. For. Ecol. Manag. 2005, 204, 159–169. [Google Scholar] [CrossRef]
- Ma, J.F.; Takahashi, E. Soil, Fertilizer, and Plant Silicon Research in Japan; Elsevier Science: Amsterdam, The Netherlands, 2002; p. 281. [Google Scholar]
- White, P.J. Long-Distance Transport in the Xylem and Phloem; Elsevier: Amsterdam, The Netherlands, 2012; pp. 49–70. [Google Scholar]
- Lilli, K.; Janne, V.; Mikael, M.; Sofie, H.; Mikko, K.; Anna, S.; Marjo, P.; Helmisaari, H.S. Stump harvesting in Picea abies stands: Soil surface disturbance and biomass distribution of the harvested stumps and roots. For. Ecol. Manag. 2018, 425, 27–34. [Google Scholar] [CrossRef]
- Johnson, K.; Scatena, F.N.; Pan, Y. Short- and long-term responses of total soil organic carbon to harvesting in a northern hardwood forest. For. Ecol. Manag. 2010, 259, 1262–1267. [Google Scholar] [CrossRef]
- Shen, J.; Fan, S.; Liu, G.; Chen, B.; Wu, C.; Cao, B. Spatiotemporal distribution characteristics of temperature on the surface layer of cutting gap of Phyllostachys edulis forest. Chin. J. Ecol. 2020, 39, 3549–3557. [Google Scholar] [CrossRef]
- Adolfo, C.C.; Lourdes, C.H.; Sandra, R.O. Mass, nutrient pool, and mineralization of litter and fine roots in a tropical mountain cloud forest. Sci. Total Environ. 2016, 575, 876–886. [Google Scholar] [CrossRef]
- Su, W.; Fan, S.; Zhao, J.; Cai, C. Effects of various fertilization placements on the fate of urea−15N in moso bamboo forests. For. Ecol. Manag. 2019, 453, 117632. [Google Scholar] [CrossRef]
- Tu, L.; Hu, H.; Hu, T.; Jian, Z.; Xianwei, L.; Li, L.; Xiao, Y.; Cheng, G.; Li, R. Litterfall, Litter Decomposition, and Nutrient Dynamics in Two Subtropical Bamboo Plantations of China. Pedosphere 2014, 24, 84–97. [Google Scholar] [CrossRef]
- Wright, I.J.; Westoby, M. Nutrient concentration, resorption and lifespan: Leaf traits of Australian sclerophyll species. Funct. Ecol. 2010, 17, 10–19. [Google Scholar] [CrossRef]
- Fan, S.; Zhao, J.; Su, W.; Yu, L.; Yan, Y. Comprehensive Evaluation of Soil Quality in Phyllostachys edulis Stands of Different Stocking Stocking Densities. Sci. Silvae Sin. 2015, 51, 1–9. [Google Scholar] [CrossRef]
- Guo, B. Ecological Stoichiometry Characteristics of Carbon, Nitrogen and Phosphorus in Phyllostachys pubescens Forest of Different Productivity Levels; Chinese Academy of Forestry: Beijing, China, 2014. [Google Scholar]
- Johnson, D.W.; Turner, J. Nutrient cycling in forests: A historical look and newer developments. For. Ecol. Manag. 2019, 444, 344–373. [Google Scholar] [CrossRef]
- Umemura, M.; Takenaka, C. Retranslocation and localization of nutrient elements in various organs of moso bamboo (Phyllostachys pubescens). Sci. Total Environ. 2014, 493, 845–853. [Google Scholar] [CrossRef] [PubMed]
- Turner, J.; Lambert, M.J. Analysis of nutrient use efficiency (NUE) in Eucalyptus pilularis forests. Aust. J. Bot. 2015, 62, 558. [Google Scholar] [CrossRef]
- Krift, T.A.J.d.; Gioacchini, P.; Kuikman, P.J.; Berendse, F. Effects of high and low fertility plant species on dead root decomposition and nitrogen mineralisation. Soil Biol. Biochem. 2001, 33, 2115–2124. [Google Scholar] [CrossRef]
- Shanmughavel, P.; Francis, K. Bioproductivity and nutrient cycling in bamboo and acacia plantation forests. Bioresour. Technol. 2001, 80, 45–48. [Google Scholar] [CrossRef]
- White, E.H. Whole-tree Harvesting Depletes Soil Nutrients. Rev. Can. Rech. For. 1974, 4, 530–535. [Google Scholar] [CrossRef]
- Pyttel, P.L.; Köhn, M.; Bauhus, J. Effects of different harvesting intensities on the macro nutrient pools in aged oak coppice forests. For. Ecol. Manag. 2015, 349, 94–105. [Google Scholar] [CrossRef]


Publisher’s Note: MDPI stays neutral with regard to jurisdictional claims in published maps and institutional affiliations. |
© 2022 by the authors. Licensee MDPI, Basel, Switzerland. This article is an open access article distributed under the terms and conditions of the Creative Commons Attribution (CC BY) license (https://creativecommons.org/licenses/by/4.0/).