Article

Impact of Facility Location on the Financial Performance of Integrated and Distributed LVL Production in Subtropical Eastern Australia

1
School of Agriculture and Food Sciences, The University of Queensland, St Lucia, Brisbane, QLD 4072, Australia
2
Agri-Science Queensland, Queensland Department of Agriculture and Fisheries, Salisbury, QLD 4107, Australia
3
School of Civil Engineering, The University of Queensland, St Lucia, Brisbane, QLD 4072, Australia
*
Author to whom correspondence should be addressed.
Forests 2022, 13(11), 1903; https://doi.org/10.3390/f13111903
Submission received: 29 September 2022 / Revised: 30 October 2022 / Accepted: 2 November 2022 / Published: 12 November 2022
(This article belongs to the Section Wood Science and Forest Products)

Abstract

:
In subtropical eastern Australia, the declining availability of traditional, large hardwood native forest logs has motivated hardwood sawmills to explore potentially utilising small logs in the manufacture of veneer-based engineered wood products (EWPs), such as laminated veneer lumber (LVL). An aspatial mathematical model that maximises net present value (NPV) over a 30-year project life has been applied to estimate the financial performance of LVL manufacture in this region. Of particular interest was how facility location affected financial performance, and whether distributed production of veneer (close to the log resource) and LVL (distant from the log resource) may be more profitable than integrated production under some circumstances. While integrated production of veneer and LVL near the resource maximised NPV, distributed production was found to be more profitable than integrated production in situations where the LVL manufacturing facility had to be located relatively far from the resource. Nevertheless, the level of value-adding and processing scale had a greater impact on financial performance than facility location. The analysis also highlighted that log procurement strategy substantially affected financial performance. Encouragingly for forest growers and wood processors, utilising large volumes of small diameter logs, was important for maximisation of NPV of larger-scale LVL facilities.

1. Introduction

The demand for building products that are sustainable and have low-embodied energy is rising at a time when wood production from the world’s native forests is in decline [1]. To meet this demand, many countries are becoming increasingly reliant on shorter forest harvesting cycles, which is increasing the availability of smaller-diameter logs. Many countries also have large volumes of small, low-grade plantation or native forest logs that are destined for low-value products such as landscaping, woodchips and bioenergy [2]. Forest growers and wood processors are seeking more efficient uses for these typically neglected log resources. The manufacture of engineered wood products (EWPs) from small diameter logs processed with spindleless rotary veneering technology provides a potential adaptation strategy for wood processors adjusting to declining availability of large logs.
Many studies in Asia, Australia, Europe, and North America have reported that small diameter softwood and hardwood logs, previously considered non-merchantable, can yield acceptable quantities of veneer for use in the manufacture of veneer-based EWPs with favourable mechanical properties [3,4,5,6,7,8,9,10,11,12,13,14,15,16]. Relative to sawing, spindleless rotary veneering can achieve much higher volume recovery rates from small logs, and the manufacture of EWPs, such as plywood and laminated veneer lumber (LVL), facilitates attainment of a marketable grade through randomisation of defects within the product [2,17].
In southern Queensland and northern New South Wales, Australia, the hardwood timber industry is seeking information to support their EWP investment decisions, including:
  • which log types should be procured?
  • where should processing facilities be located?
  • what scale of production should be targeted?
  • which final products should be produced (i.e., how much value-adding)?
Forestry has been an extensive user of operations research (OR) to support strategic, tactical and operational planning, particularly in countries where forestry represents a sizable proportion of exports, such as Canada, Chile, New Zealand, and Scandinavian countries [18]. Several papers have provided broad overviews of the application of optimisation in forestry [19,20,21,22]. Ronnqvist et al. [23] outlined 33 forestry research challenges for OR to address, suggesting that the utilisation of these methods is effective. Forestry OR applications have tended to focus on either strategic long-term forest management issues (e.g., silvicultural strategies and the sustainability of timber and non-timber values), strategic decisions about processing location and scale, or tactical short-term forest products industry supply chain planning. Recent examples of the application of OR to support wood processing investment decisions have typically used geographic information systems (GIS) to accommodate spatially explicit parameters and decision variables [18,24,25,26,27,28,29,30,31,32,33,34,35]. However, spatially-explicit datasets are not available in many forestry environments around the world, including for hardwood forestry in subtropical eastern Australia. Additionally, log procurement in forestry OR models has tended focus on cost minimisation e.g., [24,36,37,38], even though forestry investments are usually made on the basis of profitability [39].
Despite high growth in veneer and EWP manufacture with spindleless rotary veneer processors in the last decade, particularly in Asia [2,40], the authors are unaware of any publications that have assessed the financial performance of such investments, including the question of whether distributed manufacturing may be preferable to integrated manufacturing under some circumstances. The aspatial non-linear mathematical programming model to support decision-making about investments in veneer and LVL manufacturing introduced by Venn and McGavin [41] and Venn et al. [42] was the first to jointly consider the tactical log procurement decision, as well as the strategic processing scale and facility location decisions while maximising returns, rather than minimising costs. The objective of this paper was to demonstrate a new application of that model to assess the effect of alternative locations of integrated and distributed veneer and LVL manufacturing facilities on their financial performance. A single, integrated facility producing LVL close to the log resource is likely to have lower costs of production because of lower mill-delivered log costs. However, there may be challenges operating an LVL plant distant from regional population centres, for example, limited availability of energy, water, or skilled labour. With distributed manufacturing, dry veneer could be produced at one location and transported to an alternative site for LVL manufacture. Distributed production could provide greater access to harvestable forests by reducing log haul costs to the veneering facility, and improve LVL manufacturing facility access to utilities, labour, and markets. The extension of the model is demonstrated for subtropical eastern Australia; however, the method and some model parameters are likely to be adaptable to other decision-making environments.

2. Subtropical Eastern Australia Case Study

Figure 1 illustrates the 24.4 million ha case study area in subtropical southern Queensland and northern New South Wales. In 2018, there were 2.42 million ha of harvestable (net of management restrictions) and commercially important private native forests in the region [43]. The southern Queensland private native forest estate is distributed over 17,665 LotPlans with a minimum harvestable native forest area of 20 ha [43]; however, there is no information identifying which are managed for timber production. There are also 2.75 million ha of production native forests on state land in this region [43], although the fraction that is commercially important and harvestable was not available at the time of publication. The genera Eucalyptus and Corymbia dominate the commercially important native forest types, the vast majority of which are mixed-species and uneven-aged. The timber industry and the Queensland government has over 100 years of individual-tree selection harvesting experience in these forests. Although the harvest return interval can be as short as 15 years in more productive forest types, 30 years is more typical [44,45]. In well-managed stands where appropriate silviculture is performed in conjunction with selection harvesting to ensure adequate regeneration and vigor of future crop trees, environmental management objectives can be met while also sustaining timber yields [44,46].
In 2018, there were about 1285 full-time equivalent workers processing 554,000 m3 of native forest hardwood logs per annum at 63 hardwood sawmills in the region [43]. Historically, 50% to 70% of annual hardwood log volume requirements in Queensland have come from private native forests [43,47,48,49,50], and this proportion appears likely to increase [51]. This is problematic because sovereign risk is a substantial barrier to private landholder investment in sound native forest management [52,53]. Private forests have accumulated large volumes of small (less than 30 cm DBH), suppressed trees that are unlikely to attain traditional log type specifications, which is a consequence of decades of ‘high-grading’ without follow-up silvicultural treatment. Markets that can utilise small diameter logs would not only help to sustain the timber industry in the short to medium term, but potentially help to ensure long-term supplies of traditional electricity distribution poles, bridge girders, and sawlogs by facilitating the necessary silvicultural treatment to increase forest productivity. Long-term growth plots have indicated that silvicultural treatments increase forest productivity by a factor of between three and four [54]. The hardwood timber industry in subtropical eastern Australia has limited experience processing small diameter logs and has requested a financial evaluation of rotary veneering and LVL manufacturing opportunities to support their investment decisions [55,56].
OR methods provide an appropriate framework to analyse wood product manufacturing opportunities. However, spatially explicit records of which commercially important private native forests in subtropical eastern Australia that have been and are managed for timber production, do not exist. There are also no records of what volumes were harvested from particular private forests, nor when they might be available to re-harvest. Furthermore, many information gaps will not be filled in the near future due to limited funding for native forestry research in the subtropics of Australia. Consequently, it is not possible to employ geographical information system (GIS) software to perform network analysis to estimate haul distances, determine optimal locations for processing facilities, or develop optimal harvest plans in space and time. Nevertheless, Venn et al. [42] found that their aspatial mathematical programming model could provide valuable insights to support decisions about log procurement, selection of final product type to manufacture and processing scale. In this paper, that model has been applied to investigate how alternative forest distributions (and log availabilities) by distance from the processing facility could affect the NPV of integrated and distributed manufacturing operations.

3. Materials and Methods

3.1. Mathematical Model

An aspatial, deterministic, non-linear mathematical programming model was developed in Microsoft Excel to support decision-making about investments in EWP manufacturing in subtropical eastern Australia [42]. The model evaluates the following production process. The logs are harvested and hauled to the processing facility, where they are pre-conditioned (heated), docked, and rounded into 2.6 m billets before being converted into green veneer sheets with a spindleless lathe. The green veneer is then dried with a conventional jet-box dryer, clipped, and graded. In distributed production scenarios, dry graded veneer is packaged and transported from the veneering facility to the LVL plant. If production is integrated, the dry veneer will instead proceed on-site to LVL production. Dry veneer sheets are assumed to be glued using traditional plywood production equipment, which restricts LVL length to billet length minus end-trimming. One stage LVL can be sawn and sanded to specific product dimensions or be value-added into two-stage LVL, which involves gluing together one-stage LVL panels. Two-stage LVL panels are then sawn and sanded to desired dimensions.
The model was designed to be used by experienced decision-makers in the wood processing industry, and was intended to be run iteratively for each combination of facility location, log procurement, processing scale, and final product scenarios of interest. As indicated in the mathematical programming formulation that follows, the objective function drives the model to maximise after tax NPV.
M a x i m i s e   N P V = t = 1 T A R t A C t A R t A C t C a p A L D e p t T A X 1 + r t C a p 1 B B
where
A R t = M P M V t
A C t = M D L C t + C a p A M + A I + L Y C a p t + N L P S l = 1 L i = 1 N A H i t L V i l t + N L M V + F M V t + L C t + L R t
M V t = i = 1 N l = 1 L L V i l t R F s l A H i t
M D L C t = i = 1 N A H i t l = 1 L L V i l t S l + C S L l + H F C i + ( H V C i D i s t i 1 + W R F )
L C t = j = 1 J s = 1 S F T E j s H L j s l = 1 L i = 1 N A H i t L V i l t R F s l U R s P R s l
subject to constraints:
0   L V i l t   S L V i l t ,     l , i , t
0   AH i t   H A i H R I C F i ,   i , t
0   i = 1 I l = 1 L A H i t L V i l t   Scale ,     t
Table 1 defines the decision variables and parameters for the model, and the index sets are described in Table 2. The model requires estimates for 20 vector or matrix parameters and nine scalar or binary parameters to represent costs of production (e.g., capital costs by building, equipment or machinery type, and hourly labour cost by job type), market prices for final products, machinery utilisation rates by equipment or machine type (e.g., percent of operating hours the jet dryer is available to dry green veneer), processing rates of inputs (e.g., volume of logs of different sizes that can be veneered per hour), and the recovery of product from inputs (e.g., volume of one-stage LVL recovered from dry veneer volume). The model uses the prime cost method to account for the tax benefits of asset depreciation. To complement the NPV metric, the model also reports average costs of production in dollars per cubic metre of final product (MeanC), and the mean after tax profit in dollars per cubic metre of final product (MeanP), which have been estimated as follows.
M e a n C = C a p 1 B B + t = 1 T A C t A R t A C t C a p A L D e p t T A X t = 1 T M V t
M e a n P = M P M e a n C
Venn et al. [42] provided a more detailed description of the mathematical model.

3.2. Model Parameters and Case Study Scenarios for Subtropical Eastern Australia

A combination of literature review, key informant interviews, quotes from equipment suppliers, and empirical research was used to derive parameter estimates for the mathematical model that are broadly representative of the hardwood industry’s operating environment in southern Queensland and northern New South Wales [41,56,57]. Adopted model parameters for the forest resource are provided within the scenario descriptions below. Model coefficients for equipment utilisation rates (URs), log processing rates (PRsl), marketable product recovery rates (RFsl), capital costs (Cap), non-labour operating costs (NLPS and NLMV), and labour costs (HLjs) are consistent with those reported in Venn et al. [42]. NPV for a 30-year project life has been evaluated at a 7% real (net of inflation) discount rate. Sensitivity analyses have been performed on parameters that NPV is most sensitive to by increasing and decreasing base case parameter levels by 20% for: (a) average mill-delivered log costs; (b) utilisation rates of equipment and machinery; (c) capital costs throughout the life of the investment; (d) labour costs; and (e) market price. Alternative discount rates of 4% and 10% have also been assessed.
The financial performance of 54 LVL manufacturing scenarios have been evaluated in this paper. These include 36 integrated production scenarios, comprising three log procurement scenarios, two facility location scenarios, three processing scale scenarios, and two final product scenarios. Eighteen distributed production scenarios are also defined below. All scenarios assume veneer and LVL manufacture represents an expansion of processing activity at an existing sawmill. Therefore, the analysis has not considered land costs and non-labour administration costs (e.g., office supplies, telecommunications, and office space).

3.2.1. Log Procurement Scenarios

Spindleless rotary veneering could potentially utilize four hardwood log types in the study area, namely top logs, small peeler logs, B-grade sawlogs, and A-grade sawlogs. Top logs and small peeler logs are proposed log types that the industry is not accustomed to utilising. Top logs are often left among native forest harvest residues, either within the crown or in the bole below crown break, but above a traditional merchantable sawlog. Small diameter and suppressed trees can supply small peeler logs. B and A-grade sawlogs are traditional log types familiar to the hardwood industry.
Table 3 reports harvest cost and log parameters for log types considered in this analysis. Equations reported by Venn et al. [56] have been used to estimate log volume and log volume loss due to rounding for 2.6 m logs. The estimates adopted for the harvestable volumes per hectare of small peeler logs, and B and A-grade sawlogs are consistent with the most recent inventories of private native forests in the study area [58,59]. Reported volume of harvestable top logs was informed by empirical research in the study area by Leggate et al. [55]. Average stumpage prices received by landholders, as well as mean costs of cut, snig, and load for B-grade and A-grade sawlogs, were provided by industry partners. In the absence of markets for top logs and small peeler logs, parameter levels adopted were derived in Venn and McGavin [60]. All dollar amounts are Australian dollars unless otherwise specified (In August 2022, A$1 = US$0.69).
Three log procurement scenarios have been specified for evaluation of LVL manufacture:
  • Only top logs and small peeler logs from each harvested hectare. Other log types from harvested forests are assumed to be processed into other products (e.g., sawnwood) and are not considered further;
  • All four log types from each harvested hectare; and
  • All four log types can be used for veneering, but the model optimally procures particular log types from each harvested hectare to maximise NPV.
In subtropical eastern Australia, log procurement scenarios 1 and 2 are considered ‘near feasible’, because the contractual provisions required are no more onerous for contracted parties than existing operations. Extra transaction costs likely to be incurred with landholders, loggers, and other wood processors (e.g., for on-selling less-desired logs), mean that it is less likely log procurement scenario 3 can be achieved in practice.

3.2.2. Facility Location Scenarios

Consistent with industry practice in subtropical eastern Australia, the maximum haul distance was set to 400 km. Because the study area is on the east coast of Australia, the analysis assumes that logs can be harvested from a semi-circular area around a processing facility located proximate to the east coast. Two facility location scenarios have been defined:
A. No harvestable resource within 50 km of the processing facility, 3.55% of the landscape between 51 km and 100 km, and 7.3% of the landscape thereafter to 400 km; and
B. 21.3% of the landscape between 0 km and 100 km, and then 6.1% of the landscape thereafter to 400 km.
Facility location scenarios A and B in this study correspond to facility location scenarios B and D in Venn and McGavin (2021), respectively. Scenario A reflects likely resource conditions for a processing facility located distant from the forest (e.g., within a city). Scenario B has been designed to reflect a processing facility located in close proximity to commercial and harvestable forests. Table 4 reports the harvestable and commercial native forest area by Euclidean haul distance for facility location scenarios A and B. To account for the reality that roads do not run in straight lines from the forest to the facility, the mathematical model includes a ‘windy road’ factor that has been set in the case study to 30% to inflate the Euclidean distances reported in Table 4.
Table 4 also lists 2018 haul rates in the study area paid by a large hardwood processor to haul contractors. Truck configurations varied between contractors, so the rates are not illustrative of a specific configuration. The haul fixed costs associated with each haul zone are payable for the minimum haul distance for that zone to the mill. Haul variable costs are the costs per cubic metre per kilometre thereafter. The competition factor defines the fraction of the harvestable and commercial native forest assumed to be available to the processing facility. Venn and McGavin [60] defined how the fraction decreases with distance from the facility due to competition from other primary wood processors.

3.2.3. Processing Scale Scenarios

Empirical evidence from spindleless rotary veneering operations in Australia processing hardwoods indicates throughput of 15,000 m3 of log volume per annum is possible with one full-time veneering line. Three processing scales are considered in this paper:
  • Part-time operation at 7500 m3/y of log;
  • Full-time operation processing 15,000 m3/y of log; and
  • Full-time operation processing 30,000 m3/y of log with two veneering lines.
The part-time (7500 m3/y) operation is assumed to utilise the same equipment as the 15,000 m3/y scale, but operate fewer hours per annum.

3.2.4. LVL Final Product Scenarios

Venn et al. [42] found that the manufacture of green or dry hardwood veneer was unlikely to be financially viable, at the wholesale market prices evaluated of $300/m3 for green ungraded veneer and $426/m3 for dry graded veneer. Two final product scenarios have been assessed in this analysis:
  • One-stage LVL that is assumed to substitute for sawn timber in applications where high mechanical performance is required (e.g., in multi-storey construction) with a wholesale market price of $1000/m3; and
  • Two-stage LVL that is assumed to be an electricity pole cross-arm that can substitute for solid wood or fibre glass cross-arms with a wholesale market price of $1375/m3.
Table 5 reports the dimensions of the final products evaluated.

3.2.5. Distributed Production Scenarios

Distributed production scenarios assume the production of dry veneer at facility location B and LVL production at facility location A. There are 18 distributed production scenarios in total. Distributed production is evaluated for each of the three log procurement scenarios and two final product scenarios defined above. In addition, three veneer processing scale scenarios are examined for facility location B:
  • One veneering facility processing 15,000 m3/y of log;
  • One veneering facility processing 30,000 m3/y of log; and
  • Two separate veneering facilities processing 15,000 m3/y of log each.
For the distributed production scenarios, the non-log costs of dry veneer production at facility location B are assumed to be the same as reported in Venn et al. [42] for the manufacture and sale of dry veneer. However, rather than freight to market, this analysis adopts shipping and handling (S&H) costs for transporting dry veneer to the LVL plant over the range of $20/m3 to $40/m3 of dry veneer. The non-log costs of LVL production at facility location A are assumed to be the same as that reported by Venn et al. [42] for an integrated LVL facility, less the costs associated with green and dry veneer production (which are incurred at facility location B in the distributed facility scenarios). Relative to integrated LVL production, distributed production costs are higher because of duplication of administration staff, duplication of some machinery and equipment, such as forklifts, and the S&H of dry veneer between production facilities. Potentially offsetting these added costs are savings in log haul costs compared with operating an integrated facility at facility location A.

4. Results

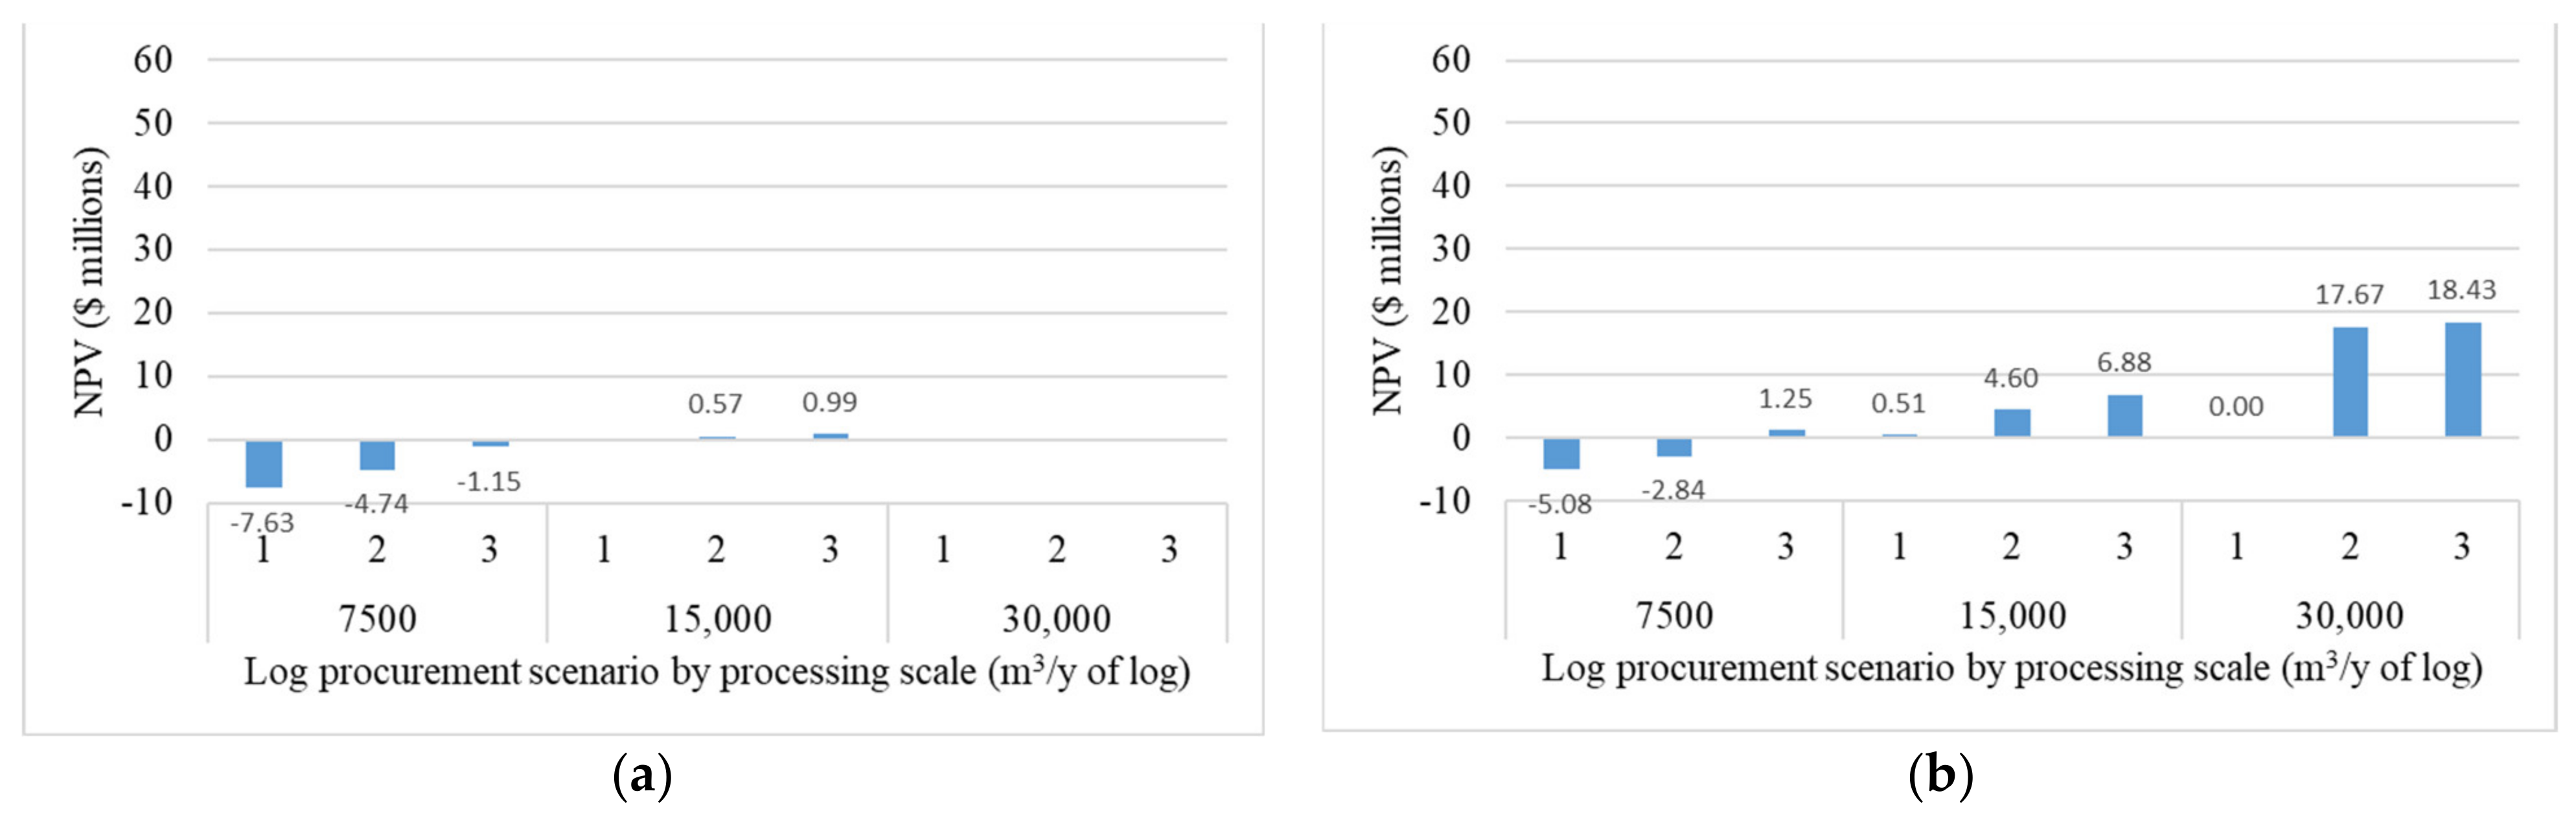
4.1. Financial Performance of Integrated Processing Facilities

Figure 2 and Figure 3 illustrate the after tax NPVs for the integrated manufacture of one-stage and two-stage LVL, respectively. The financial performance at each facility location is presented in the two panels of each figure. Each bar in the figures represents a combination of facility scale and log procurement scenarios. Missing bars indicate that the processing scale and log procurement scenario was not technically feasible, because insufficient forest resources were available throughout the evaluated 30-year investment period. One- and two-stage LVL manufacture was not technically feasible at facility location A at the 30,000 m3/y scale, nor was log procurement scenario 1 at the 15,000 m3/y scale. At facility location B, only log procurement scenario 1 at the 30,000 m3/y scale was not technically feasible.
Among the technically feasible one-stage LVL production scenarios at both facility locations, the processing scale had to be at least 15,000 m3/y to achieve financial viability. One-stage LVL with log procurement scenario 1 could only generate a positive NPV at facility location B. In contrast, two-stage LVL production was profitable for all scenarios that were technically feasible.
Figure 4 and Figure 5 present the average profit after tax and costs of production for integrated one-stage and two-stage LVL manufacture, respectively. For any combination of log procurement, processing scale and facility location scenarios, average costs increase with greater value-adding due to lower recovery of marketable product from log volume.
The analysis revealed the relative importance of the strategic decisions of where to locate the processing facility, which scale of production to target, and which product to manufacture (level of value-adding), as well as the tactical decision of which log types to procure. Figure 2 to Figure 5 highlight that the most important decision for LVL manufacturing in this case study was the selection of the final marketable product. For example, at the 30,000 m3 of log per annum scale, the NPV of two-stage LVL manufacture was $38 million higher than one-stage LVL. A comparison of Figure 4 and Figure 5 reveal that the difference in average profit after tax between one-stage and two-stage LVL was generally about $200/m3 of final product irrespective of facility scale, facility location, or log procurement scenario.
The second most important decision affecting NPV of LVL manufacture in subtropical eastern Australia was the processing scale. Figure 2 and Figure 3 highlight that doubling the processing scale of both one-stage and two-stage LVL production leads to a more than doubling of the NPV, suggesting economies of scale in LVL manufacture. Increasing processing scale from 15,000 m3 of log per annum to 30,000 m3 of log per annum increased NPV by $10 million for one-stage LVL and $30 million for two-stage LVL. Figure 4 and Figure 5 revealed that each increase in processing scale for one-stage and two-stage LVL increased average profit after tax by between $30/m3 and $100/m3 of final product.
The third most important decision for LVL manufacturing was found to be facility location. NPV and average profit after tax were always estimated to be higher at facility location B. Figure 2 and Figure 3 highlighted a $4 to $7 million difference in NPV between facility locations A and B at the 15,000 m3 of log per annum scale. The average profit after tax differed between facility locations A and B at the 7500 m3 and 15,000 m3 of log per annum scales by between $40/m3 and $70/m3 of final product (Figure 4 and Figure 5).
The fourth most important decision for LVL manufacturing decision-makers was found to be a log procurement strategy. In increasing order of NPV and average profit after tax, the log procurement scenarios were 1, 2 and 3. For any specific processing scale and facility location, the difference in NPV between log procurement scenarios for both one-stage and two-stage LVL production ranged between $1 and $8 million (Figure 2 and Figure 3). The difference in average profit after tax between alternative log procurement scenarios for a particular facility location and processing scale was up to $150/m3 (Figure 4 and Figure 5).
For any particular combination of facility location, processing scale, and final product type scenarios, the difference in NPV and average profit after tax between log procurement scenarios is due to differences between log types of: (i) log processing rates (m3/h); (ii) final marketable product recovery from log volume (%); and (iii) costs of mill-delivered logs ($/m3 of log). Processing rates, recovery rates and mill-delivered log costs increase with log size [42,56]. Log procurement scenarios 1 and 2 resulted in constant proportions of log types processed, which were 100% small peeler and top logs for scenario 1, and 46.5% small peeler and top logs, 40.7% B-grade sawlog, and 12.8% A-grade sawlog for scenario 2. For log procurement scenario 3, the model maximises NPV by optimally procuring different log types at different distances from the mill. Table 6 reports the optimal mixes of log types for log procurement scenario 3 by scale of production and facility location.
B-grade sawlogs were found to be the most desirable log type for LVL manufacture because of their high processing rate and product recovery from log volume relative to small peeler logs and top logs, and their modest cost relative to A-grade sawlogs [42]. B-grade sawlogs are relatively abundant when the LVL processing scale is small, and the optimal log procurement strategy focusses on acquiring B-grade sawlogs. With increasing processing scale, B-grade sawlogs become more scarce, and a greater proportion of small peeler and top logs enter the optimal log procurement strategy. The proportions of small peeler and top logs are higher for facility location A, because there is less forest resource in proximity to the processing facility, and utilising more of these logs reduces average haul costs. At facility location B, there is greater forest area proximate to the processing facility and less reliance on small peelers and top logs. Nevertheless, at facility location B for the 30,000 m3 of logs per annum processing scale, it is optimal for 42.5% of processed logs to be small peelers and top logs. The optimal proportion of A-grade sawlog is less than 6% in all scenarios.
Although the different log procurement scenarios had large differences in log mixes, Table 7 indicates that for any specific facility location and processing scale, average mill-delivered log costs were similar over the 30-year investment period. Therefore, differences between log types in terms of recovery of marketable product from log volume and in log processing rates must be responsible for the substantial effect that log type has on financial performance. For example, average mill-delivered log cost varied between $132/m3 and $138/m3 of log across the three log procurement scenarios at the 15,000 m3/y of log processing scale for facility location B (Table 7). However, for the same processing scale and facility location scenario, the difference in average mill-delivered log cost for two-stage LVL is $49/m3 (Figure 5). The benefit of optimal log procurement in scenario 3 is greater for higher levels of value-adding and smaller processing scales (Figure 2, Figure 3, Figure 4 and Figure 5). The benefit diminishes with increasing scale, because: (a) capital costs are spread over larger volumes of product; (b) stumpage price becomes relatively less important as mill-delivered log cost becomes increasingly dominated by haul costs; and (c) log procurement in scenario 3 (Table 6) becomes increasingly similar to log procurement in scenario 2.
The sensitivity analyses for integrated production are reported in Table A1, Table A2, Table A3 and Table A4 in Appendix A. The NPV of one-stage LVL production at facility location A is highly sensitive to changes in parameter levels, with manufacture becoming unprofitable with a pessimistic level for any single model parameter. At facility location B, one-stage LVL manufacture at the 7500 m3/y scale is only financially viable for log procurement scenario 3, and only with optimistic parameter levels. When one-stage LVL manufacture is at a scale of at least 15,000 m3/y, then profitability under log procurement scenarios 2 and 3 is robust against changes in all parameters except for market price.
The financial performance of the majority of two-stage LVL manufacturing scenarios are robust against parameter level changes. Two cases generating negative returns were projected. First, profitability of two-stage LVL is sensitive to market price at both facility locations at the 7500 m3/y processing scale. Second, pessimistic levels of any parameter generated negative returns for the 7500 m3/y processing scale at facility location A. Overall, the analysis has revealed the superior investment option to be two-stage LVL production at a scale of at least 15,000 m3 of log per annum.

4.2. Financial Performance of Distributed Processing Operations

Figure 6 illustrates total profitability within the value chain for distributed production of one-stage and two-stage LVL, where dry veneer is produced at a facility in location B and is transported to an LVL manufacturing plant at facility location A. The facility categories on the x-axis are the three distributed veneering scenarios. The cost to produce and deliver the dry veneer to the LVL plant varied between $494/m3 and $591/m3 of dry veneer (the minimum cost of producing dry veneer was with one or two 15,000 m3/y of log per annum veneering facilities operating under log procurement scenario three, and at $20/m3 of dry veneer S&H. Maximum cost of producing dry veneer was with one or two 15,000 m3/y of log per annum veneering facilities operating under log procurement scenario one, and at $40/m3 S&H costs). Bars in Figure 6 represent the potential after-tax profit for distributed production when the S&H costs of dry veneer delivery to the LVL plant were $20/m3 (blue) and $40/m3 (green). For comparison, after-tax profits for integrated production at facility locations A and B (also illustrated in Figure 4 and Figure 5) are represented in Figure 6 by orange and yellow dots, respectively. Missing bars and dots represent production scenarios that were not technically feasible (i.e., insufficient log resource to supply a particular LVL processing scale over 30 years). As expected, if integrated LVL manufacture can be performed close to the forest resource (yellow dots in Figure 6), this will be more profitable than distributed production.
Three notable findings were revealed by the distributed production analysis. First, distributed production allowed a greater number of technically feasible and financially viable scenarios than integrated production. Distributed production provided the only feasible business model for a 30,000 m3/y LVL manufacturing facility at location A (compare Figure 2, Figure 3, Figure 4 and Figure 5 with Figure 6). Furthermore, the only scenario to make log procurement scenario 1 at the 30,000 m3/y processing scale technically feasible and financially viable was distributed production with two 15,000 m3/y veneering plants.
Second, distributed production always generated higher profits than integrated production at facility location A (orange dots in Figure 6). This is because the reduced cost of processing logs closer to the forest exceeded the added cost of distributed production, which included S&H of the dry veneer to the LVL manufacturing facility, and the duplication of administration staff and some machinery and equipment across the distributed production sites. For example, Table 7 revealed that average mill-delivered log costs at facility location B are $32/m3 lower for the 15,000 m3/y processing scale under log procurement scenario 3. In addition, for the 15,000 m3/y processing scale at facility location B, 90.7% of logs processed are B-grade sawlogs, while only 54.6% are B-grade sawlogs at facility location A (Table 6). This conveys processing rate and recovery rate efficiencies at facility location B such that mill-delivered log costs for two-stage LVL manufacture are $79/m3 lower at facility location B than at facility location A (compare panels (a) and (b) in Figure 5).
Third, the distributed LVL production scenarios have strong economies of size. Mill-delivered log costs per cubic metre are lower for 15,000 m3/y veneering facilities than for 30,000 m3/y facilities (Table 7). However, the economies of size achieved when veneering at a 30,000 m3 per annum facility is projected to generate higher profits per cubic metre of LVL output for one-stage and two-stage LVL production (compare one facility at 30,000 m3/y with two facilities at 15,000 m3/y in Figure 6). Likewise, the profitability per cubic metre of final LVL product from two distributed veneering facilities of 15,000 m3/y supplying one 30,000 m3/y LVL facility, exceeds that of one 15,000 m3/y veneering facility supplying one 15,000 m3/y LVL facility (Figure 6). These findings suggest, regardless of whether LVL production is integrated or distributed, processing scale is a more important factor for profitability than facility location in subtropical eastern Australia.

5. Discussion

An international review of literature highlighted that little has been published about the financial performance of spindleless rotary veneering and LVL manufacture, including processing coefficients, costs of production, and NPV estimates. There is some international literature reporting recovery of veneer from log volume from small and large diameter softwood and hardwood logs [61,62,63], and the levels of adopted in this case study are consistent with these.
Assessing the potential effect of strategic and tactical decisions on NPV is somewhat subjective, depending on the ranges of parameter levels appraised. Venn et al. [42] found for southern Queensland and northern New South Wales that the most important decisions for veneer and LVL manufacture were: (a) final product (i.e., level of value-adding); (b) processing scale; and (c) log procurement strategy. Forest industry experience in Sweden and Finland [64,65,66], has also found the level of value-adding has the greatest impact on financial performance. Venn et al. [42] did not consider alternative facility locations. This study has revealed facility location is the third most important decision for LVL producers in subtropical eastern Australia, behind selection of the final product and processing scale. Facility location affects mill-delivered log costs of all scenarios (Table 7) and, unique to log procurement scenario three, also by modifying the availability of different log types (Table 6), which influences processing costs and product recovery from log volume. The evaluation of distributed production of LVL revealed that, if for technical or logistical reasons LVL manufacture had to be located at facility location A, the investor should carefully consider veneering at facility location B, and transporting dry veneer (instead of logs) to facility location A for LVL manufacture. Lower mill-delivered log costs more than made up for the added costs of distributed production. This finding is consistent with a growing body of research that has reported opportunities for wood product and other manufacturers to increase overall financial performance by moving away from centralised manufacturing methods towards decentralised and geographically dispersed manufacturing strategies [67,68]. Distributed production in southern Queensland and northern New South Wales can provide processors with opportunities to keep feedstock costs relatively low, while also accessing benefits that towns and cities can use to provide manufacturing facilities, such as improved access to skilled labour and better access to markets [69,70].
The model has highlighted that a simple focus of log procurement officers on log size or mill-delivered log cost, is insufficient to maximise profitability; a conclusion that was also reached by Dobner Jr. et al. [5] for veneer production from Pinus taeda logs in Brazil. Profitability in subtropical eastern Australia was maximised by log procurement scenario 3, which preferentially utilised B-grade sawlogs that are of moderate size and cost. The exclusive use of small peeler and top logs in log procurement scenario 1, resulted in relatively low veneer recovery rates from log volume and relatively long processing time per cubic metre of log processed [42]. The utilisation of relatively large volumes of costly A-grade sawlogs, in addition to small peeler and top logs, meant that log procurement scenario two performed poorly in comparison to scenario three. Nevertheless, profitability at the 30,000 m3/y scale was maximised in log procurement scenario three with 42.5% of log volume being from small peeler and top logs. Increased utilization of small logs is likely to facilitate and offset the costs of silvicultural treatment in degraded private native forests of subtropical eastern Australia, and LVL manufacturing could help develop new markets for these small logs. Venn et al. [42] discussed forest management and policy implications of this development, including the potential to increase future harvestable volume and value of traditional log types (e.g., sawlogs and poles). Importantly, for a large fraction of state-owned native forests in southern Queensland that are managed for multiple use, including timber, forest policy does not allow new log types, such as top logs and small peeler logs.
When interpreting the results, several assumptions adopted for the analysis should be considered. First, while log procurement scenarios one and two can be regarded as ‘near feasible’ because of their similarity to existing contractual arrangements, log procurement scenario three, which assumed volumes of different log types can be optimally procured from the landscape, may be difficult to achieve in practice.
Second, due to a lack of information, stumpage prices and harvest costs have been modelled as constant throughout the study area, not varying in response to differences in log procurement scenarios, environmental characteristics, or distance from processing facilities. It would be beneficial for these data limitations to be addressed by future research.
Third, although the analysis has adopted haul contract rates paid by a hardwood sawmill in the study area, haul costs are also likely to be affected by the dimensions of delivered log types. If the modelled composition of logs being delivered for processing differs considerably from the actual composition for which the contract rates are applicable (mostly A-grade and B-grade sawlogs), then the contract rates may not be appropriate.
Fourth, the heat necessary for log steaming and veneer drying is assumed to be generated by a biomass boiler that is largely (although not entirely; please see Venn et al. [42] for details) supplied from on-site waste. If this heat had to be generated from electricity or natural gas instead, annual energy costs would increase substantially, offset in part by reduced capital costs associated with not requiring a biomass boiler.
Fifth, the model assumes an existing processing facility is expanded to accommodate veneer and LVL manufacture. As a result, non-labour administration costs (e.g., telecommunications, stationery and office space) and costs of land acquisition were not considered in either the integrated or distributed production scenarios. The sensitivity analyses in Appendix A indicate that only the financial performance of integrated one-stage LVL production at facility location A is sensitive to changes in capital costs.
Sixth, the distributed production analysis assumed a vertically integrated operation owned by a single entity. If the veneering and LVL facilities were operated as independent businesses, the total cost of LVL manufacture may be higher than reported, due to costs of vertical separation that have not been captured in this analysis. Particularly with distributed two-stage LVL manufacture, a substantial profit margin has been reported in Figure 6. Therefore, profitable, independent veneer and LVL manufacturing businesses may be possible in an LVL value chain in subtropical eastern Australia.
Seventh, new hardwood LVL products are assumed to be immediately accepted by the market. In reality, promoting adoption may be challenging and require time [16].
Eighth, asset depreciation was accounted for in the analysis using the prime cost method for all assets over 20 years. Dozens of asset types have asset lives less than 20 years (please see Venn et al. [42] for details); however, this simplification was necessary to streamline the model for Microsoft Excel. Nevertheless, 75% of the initial investment costs in LVL manufacture are associated with assets with lives of at least 20 years. In addition, sensitivity analyses revealed that the NPV of LVL production is not particularly sensitive to the level of capital cost. Therefore, the simplified handling of depreciation in the model is unlikely to have affected the relative performance of scenarios.

6. Conclusions

There are strong economies of scale in one-stage and two-stage LVL manufacture with subtropical eastern Australian hardwoods. Two-stage LVL production was projected to be highly profitable, while one-stage LVL production was at best marginally to moderately profitable. If logistical or technical constraints made it impossible to locate a single, integrated veneering and LVL facility proximate to the forest resource, this analysis revealed that distributed production of LVL (where an LVL manufacturing facility distant from the resource would be supplied dry veneer from a veneering operation located close to the log resource) would likely be more profitable than an integrated veneering and LVL facility located distant from the forest resource. In decreasing order of impact on the financial performance of LVL manufacture, the strategic and tactical decisions for LVL manufacture in subtropical eastern Australia are the: (a) product manufactured (level of value-adding); (b) processing scale; (c) facility location (proximity to forest); and (d) log procurement strategy (log types processed). LVL production was revealed to be most profitable when utilizing B-grade sawlogs. However, 42.5% of log feedstock for veneering was projected to be small, non-traditional log types (top and small peeler logs) in order to maximise NPV at the 30,000 m3/y scale. Therefore, an increase in demand for small native forest hardwood logs is likely if hardwood LVL manufacture becomes more common in subtropical eastern Australia. In order for the native forest hardwood timber industry to take advantage of the opportunities associated with LVL production, including the potential to offset some costs of silvicultural treatment, forest policy will need to accommodate the utilisation of small, suppressed trees.

Author Contributions

Conceptualization, R.L.M. and T.J.V.; methodology, T.J.V. and J.W.D.; validation, T.J.V., R.L.M. and W.L.; formal analysis, T.J.V. and J.W.D.; investigation, T.J.V., J.W.D. and R.L.M.; resources, R.L.M. and W.L.; data curation, T.J.V., R.L.M. and J.W.D.; writing—original draft preparation, J.W.D. and T.J.V.; writing—review and editing, T.J.V., R.L.M. and W.L.; visualization, J.W.D. and T.J.V.; supervision, R.L.M.; project administration, R.L.M. and W.L.; funding acquisition, R.L.M. and W.L. All authors have read and agreed to the published version of the manuscript.

Funding

The authors acknowledge the financial support of the Australian Centre for International Agricultural Research (ACIAR) for funding this research through the ACIAR Project FST/2019/128.

Data Availability Statement

Not applicable.

Acknowledgments

The authors are grateful for the support of the Queensland Government, Department of Agriculture and Fisheries (DAF), the Forest and Wood Products Australia, Big River Group, Austral Plywoods, Parkside Group, Hurford Wholesale, Engineered Wood Products Association of Australasia, Timber Queensland, HQ Plantations and Wood Products Victoria for their participation in project PNB407-1516 which provided the financial model platform from which this study extended. Private Forestry Service Queensland (PFSQ) are also acknowledged for their support in modelling private native forest log supply and mill-delivered log costs.

Conflicts of Interest

The authors declare no conflict of interest.

Appendix A

Sensitivity of net present value of product manufacture to changes in levels of several important model parameters.
Table A1. Sensitivity of NPV of one-stage LVL manufacture to changes in levels of several important model parameters at facility location A.
ParameterLevelNPV ($ Millions) by Processing Scale (m3/y of Log) and Log Procurement Scenario
750015,00030,000
123123123
Average mill-delivered log costs−20%−5.04−2.32−1.68 4.915.27
Base−7.63−4.74−3.97 0.570.99
+20%−10.36−7.20−6.37 −4.20−3.63
Utilisation rate of equipment and machinery−20%−9.62−6.73−5.99 −2.61−2.12
Base−7.63−4.74−3.97 0.570.99
+20%−6.35−3.41−2.64 2.793.21
Capital costs−20%−4.69−1.84−1.15 3.303.73
Base−7.63−4.74−3.97 0.570.99
+20%−10.61−7.68−6.91 −2.02−1.58
Labour costs−20%−5.92−2.97−2.23 3.984.40
Base−7.63−4.74−3.97 0.570.99
+20%−9.40−6.51−5.76 −2.97−2.54
Market price−20%−15.17−12.56−11.84 −14.41−13.90
Base−7.63−4.74−3.97 0.570.99
+20%−1.011.942.69 12.6113.06
Discount rate4%−9.18−5.22−4.16 2.132.73
Base−7.63−4.74−3.97 0.570.99
10%−6.58−4.36−3.77 −0.320.00
Note: missing value indicate that this scenario is not technically feasible i.e., insufficient resource over the 30-year duration.
Table A2. Sensitivity of NPV of two-stage LVL manufacture to changes in levels of several important model parameters at facility location A.
ParameterLevelNPV ($ Millions) by Processing Scale (m3/y of Log) and Log Procurement Scenario
750015,00030,000
123123123
Average mill-delivered log costs−20%3.026.106.86 22.6323.06
Base0.834.084.89 18.4318.91
+20%−1.382.022.90 14.2414.76
Utilisation rate of equipment and machinery−20%−0.892.333.13 15.3615.86
Base0.834.084.89 18.4318.91
+20%1.985.236.05 20.6721.15
Capital costs−20%3.736.857.64 21.3421.84
Base0.834.084.89 18.4318.91
+20%−2.121.182.02 15.7516.23
Labour costs−20%2.355.616.42 21.8422.33
Base0.834.084.89 18.4318.91
+20%−0.692.533.34 15.0915.52
Market price−20%−7.71−4.64−3.83 2.422.85
Base0.834.084.89 18.4318.91
+20%8.4012.0913.02 34.2934.82
Discount rate4%2.697.258.39 27.4828.15
Base0.834.084.89 18.4318.91
10%−0.222.232.85 13.0113.37
Note: missing value indicate that this scenario is not technically feasible i.e., insufficient resource over the 30-year duration.
Table A3. Sensitivity of NPV of one-stage LVL manufacture to changes in levels of several important model parameters at facility location B.
ParameterLevelNPV ($ Millions) by Processing Scale (m3/y of Log) and Log Procurement Scenario
750015,00030,000
123123123
Average mill-delivered log costs−20%−3.01−0.990.394.138.0510.21 24.8125.38
Base−5.08−2.84−1.320.514.606.88 17.6718.43
+20%−7.16−4.91−3.15−3.371.063.49 10.4911.46
Utilisation rate of equipment and machinery−20%−7.00−4.83−3.19−2.851.604.03 10.9811.75
Base−5.08−2.84−1.320.514.606.88 17.6718.43
+20%−3.81−1.63−0.152.656.759.05 21.4222.19
Capital costs−20%−2.16−0.181.253.027.229.61 21.5622.32
Base−5.08−2.84−1.320.514.606.88 17.6718.43
+20%−8.02−5.78−4.09−2.082.134.45 13.7514.53
Labour costs−20%−3.38−1.250.233.827.9110.21 23.1823.94
Base−5.08−2.84−1.320.514.606.88 17.6718.43
+20%−6.79−4.60−2.96−2.991.283.49 12.1512.91
Market price−20%−12.29−10.42−10.94−13.17−8.97−6.72 −7.42−6.41
Base−5.08−2.84−1.320.514.606.88 17.6718.43
+20%1.163.523.7011.6316.5019.21 41.3942.10
Discount rate4%−5.69−2.62−2.782.057.7910.99 27.3328.40
Base−5.08−2.84−1.320.514.606.88 17.6718.43
10%−4.62−2.90−2.99−0.362.724.44 11.9712.54
Note: missing value indicate that this scenario is not technically feasible i.e., insufficient resource over the 30-year duration.
Table A4. Sensitivity of NPV of two-stage LVL manufacture to changes in levels of several important model parameters at facility location B.
ParameterLevelNPV ($ Millions) by Processing Scale (m3/y of Log) and Log Procurement Scenario
750015,00030,000
123123123
Average mill-delivered log costs−20%4.727.349.0720.3425.7428.66 61.6862.17
Base2.995.657.4716.8622.3225.33 54.5455.22
+20%1.233.935.8513.3818.9022.00 47.3948.27
Utilisation rate of equipment and machinery−20%1.293.925.7213.6519.2522.36 47.6648.34
Base2.995.657.4716.8622.3225.33 54.5455.22
+20%4.116.788.6219.0024.5527.61 58.4459.12
Capital costs−20%5.818.3710.1619.5425.2228.37 58.7859.45
Base2.995.657.4716.8622.3225.33 54.5455.22
+20%0.062.804.6814.1719.6322.65 50.2250.90
Labour costs−20%4.477.158.9920.1525.7328.80 60.2360.91
Base2.995.657.4716.8622.3225.33 54.5455.22
+20%1.484.125.9313.5618.9821.86 48.8549.53
Market price−20%−5.17−2.79−2.892.076.448.84 22.8323.57
Base2.995.657.4716.8622.3225.33 54.5455.22
+20%10.4313.6114.2531.4738.1441.75 86.0386.64
Discount rate4%5.729.459.8525.2532.9637.21 79.6280.58
Base2.995.657.4716.8622.3225.33 54.5455.22
10%1.413.423.6311.8315.9218.18 39.4839.99
Note: missing value indicate that this scenario is not technically feasible i.e., insufficient resource over the 30-year duration.

References

  1. Warman, R.D. Global wood production from natural forests has peaked. Biodivers. Conserv. 2014, 23, 1063–1078. [Google Scholar] [CrossRef]
  2. Leggate, W.; McGavin, R.L.; Bailleres, H. (Eds.) A Guide to Manufacturing Rotary Veneer and Products from Small Logs; Australian Centre for International Agricultural Research: Canberra, Australia, 2017; p. 159.
  3. Spelter, H.; Sleet, G. Potential reductions in plywood manufacturing costs resulting from improved technology. For. Prod. J. 1989, 39, 8–15. [Google Scholar]
  4. Pease, D.A. Small-log diet agrees with spindleless lathe. Wood Technol. 1993, 120, 16–18. [Google Scholar]
  5. Dobner, M., Jr.; Nutto, L.; Higa, A.R. Recovery rate and quality of rotary peelerd veneer from 30-year-old Pinus taeda L. logs. Ann. For. Sci. 2013, 70, 429–437. [Google Scholar] [CrossRef] [Green Version]
  6. Wang, B.J.; Dai, C. Development of structural laminated veneer lumber from stress graded short-rotation hem-fir veneer. Constr. Build. Mater. 2013, 47, 902–909. [Google Scholar] [CrossRef]
  7. McGavin, R.L.; Bailleres, H.; Lane, F.; Blackburn, D.; Vega, M.; Ozarska, B. Veneer recovery analysis of plantation eucalypt species using spindleless lathe technology. BioResources 2014, 9, 613–627. [Google Scholar] [CrossRef] [Green Version]
  8. McGavin, R.L.; Bailleres, H.; Lane, F.; Fehrmann, J.; Ozarska, B. Veneer grade analysis of early to mid-rotation plantation Eucalyptus species in Australia. BioResources 2014, 9, 6565–6581. [Google Scholar] [CrossRef] [Green Version]
  9. McGavin, R.L.; Bailleres, H.; Fehrmann, J.; Ozarska, B. Stiffness and density analysis of rotary veneer recovered from six species of Australian plantation hardwoods. BioResources 2015, 10, 6395–6416. [Google Scholar] [CrossRef]
  10. McGavin, R.L.; Bailleres, H.; Hamilton, M.; Blackburn, D.; Vega, M.; Ozarska, B. Variation in rotary veneer recovery from Australian plantation Eucalyptus globulus and Eucalyptus nitens. BioResources 2015, 10, 313–329. [Google Scholar] [CrossRef] [Green Version]
  11. Gilbert, B.P.; Bailleres, H.; Fischer, M.F.; Zhang, H.; McGavin, R.L. Mechanical properties of rotary veneers recovered from early to midrotation subtropical-hardwood plantation logs for veneer-based composite applications. J. Mater. Civ. Eng. 2017, 29, 04017194. [Google Scholar] [CrossRef] [Green Version]
  12. Khoo, P.S.; H’ng, P.S.; Chin, K.L.; Bakar, E.S.; Maminski, M.; Raja-Ahmad, R.; Lee, C.L.; Ashikin, S.N.; Saharudin, M. Peeling of small diameter rubber log using spindleless lathe technology: Evaluation of veneer properties from outer to inner radial section of log at different veneer thicknesses. Eur. J. Wood Wood Prod. 2018, 76, 1335–1346. [Google Scholar] [CrossRef]
  13. Verkasalo, E. Evaluating the potential of European white birch (Betula pubescens) for veneer and plywood by timber and wood quality. In Proceedings of the Second Workshop, Connection between Silviculture and Wood Quality through Modelling and Simulation Software, Berg-en-Dal, Kruger National Park, South Africa, 26–31 August 1996; pp. 431–439. [Google Scholar]
  14. Heräjärvi, H.; Arponen, J. Log and veneer quality of Finnish and Russian birch in plywood production. In Proceedings of the International Panel Products Symposium, Espoo, Finland, 24–26 September 2008. [Google Scholar]
  15. Verkasalo, E.; Heräjärvi, H. Potential of European birch species for product development of veneer and plywood—Recovery, grades and mechanical properties and future market requirements. In Proceedings of the ISCHP 09, 2nd International Scientific Conference on Hardwood Processing, Paris, France, 28–29 September 2009; pp. 11–19. [Google Scholar]
  16. Evison, D.C.; Kremer, P.D.; Guiver, J. Mass timber construction in Australia and New Zealand—Status, and economic and environmental influences on adoption. Wood Fibre Sci. 2018, 50, 128–138. [Google Scholar] [CrossRef]
  17. McGavin, R.L.; Leggate, W. Comparison of processing methods for small diameter logs: Sawing versus rotary peeling. BioResources 2019, 14, 1545–1563. [Google Scholar]
  18. Jena, S.D.; Cordeau, J.F.; Gendron, B. Modelling and solving a logging camp location problem. Ann. Oper. Res. 2015, 232, 151–177. [Google Scholar]
  19. Ronnqvist, M. Optimization in forestry. Math. Program. 2003, 97, 267–284. [Google Scholar] [CrossRef]
  20. Weintraub, A.; Romero, C. Operations research models and the management of agricultural and forestry resources: A review and comparison. Interfaces 2006, 35, 446–457. [Google Scholar] [CrossRef] [Green Version]
  21. D’Amours, S.; Rönnqvist, M.; Weintraub, A. Using operational research for supply chain planning in the forest products industry. INFOR Inf. Syst. Oper. Res. 2008, 46, 265–281. [Google Scholar] [CrossRef]
  22. Kaya, A.; Bettinger, P.; Boston, K.; Akbulut, R.; Ucar, Z.; Siry, J.; Merry, K.; Cieszewski, C. Optimisation in Forest Management. Curr. For. Rep. 2016, 2, 1–17. [Google Scholar] [CrossRef] [Green Version]
  23. Ronnqvist, M.; D’Amours, S.; Weintraub, A.; Jofre, A.; Gunn, E.; Haight, R.G.; Martell, D.; Murray, A.T.; Romero, C. Operations research challenges in forestry: 33 open problems. Ann. Oper. Res. 2015, 232, 11–40. [Google Scholar] [CrossRef]
  24. Troncoso, J.J.; Garrido, R.A. Forestry production and logistics planning: An analysis using mixed-integer programming. For. Policy Econ. 2005, 7, 625–633. [Google Scholar] [CrossRef]
  25. Singer, M.; Donoso, P. Internal supply chain management in the Chilean sawmill industry. Int. J. Oper. Prod. Manag. 2007, 27, 524–541. [Google Scholar] [CrossRef]
  26. Natarajan, K.; Leduc, S.; Pelkonen, P.; Tomppo, E.; Dotzauer, E. Optimal locations for second generation Fischer Trosch biodiesel production in Finland. Renew. Energy 2014, 62, 319–330. [Google Scholar] [CrossRef]
  27. Delivand, M.K.; Cammerino, A.R.B.; Garofalo, P.; Monteleone, M. Optimal locations of bioenergy facilities, biomass spatial availability, logistics costs and GHG (greenhouse gas) emissions: A case study on electricity productions in South Italy. J. Clean. Prod. 2015, 99, 129–139. [Google Scholar] [CrossRef]
  28. Zhang, F.; Johnson, D.; Johnson, M.; Watkins, D.; Froese, R.; Wang, J. Decision support system integrating GIS with silumation and optimisation for a biofuel supply chain. Renew. Energy 2016, 85, 740–748. [Google Scholar] [CrossRef]
  29. Crandall, M.S.; Adams, D.M.; Montgomery, C.A.; Smith, D. The potential rural development impacts of utilising non-merchantable forest biomass. For. Policy Econ. 2017, 74, 20–29. [Google Scholar] [CrossRef] [Green Version]
  30. Sanchez-Garcia, S.; Athanassiadis, D.; Alonso, C.M.; Tolosana, E.; Majada, J.; Canga, E. A GIS methodology for optimal location of a wood-fired power plant: Quantification of available woodfuel, supply chain costs and GHG emissions. J. Clean. Prod. 2017, 157, 201–212. [Google Scholar] [CrossRef]
  31. Vanzetti, N.; Corsano, G.; Montagna, J.M. A comparison between individual factories and industrial clusters location in the forest supply chain. For. Policy Econ. 2017, 83, 88–98. [Google Scholar] [CrossRef]
  32. Bordon, M.R.; Montagna, J.M.; Corsano, G. An exact mathematical formulation for the optimal log transportation. For. Policy Econ. 2018, 95, 115–122. [Google Scholar] [CrossRef]
  33. Duc, D.N.; Nananukul, N. Supply chain model for renewable energy resource from biomass in Vietnam. In Proceedings of the 5th International Conference on Industrial Engineering and Applications, Singapore, 26–28 April 2018; pp. 520–525. [Google Scholar]
  34. Flatberg, T.; Norstebo, V.S.; Bjorkelo, K.; Astrup, R.; Sovde, N.E. A mathematical model for infrastructure investments in the forest sector of coastal Norway. For. Policy Econ. 2018, 92, 202–209. [Google Scholar] [CrossRef]
  35. Jenkins, T.L.; Jin, E.; Sutherland, J.W. Effect of harvest region shape, biomass yield, and plant location on optimal biofuel facility size. For. Policy Econ. 2020, 111, 102053. [Google Scholar] [CrossRef]
  36. Lin, W.; Carino, H.F.; Muehlenfeld, K.J. OSB/LOCATION: A computer model for determining optimal oriented strandboard plant location and size. For. Prod. J. 1996, 46, 71–79. [Google Scholar]
  37. Maturana, S.; Pizani, E.; Vera, J. Scheduling production for a sawmill: A comparison of a mathematical model versus a heuristic. Comput. Ind. Eng. 2010, 59, 667–674. [Google Scholar] [CrossRef]
  38. Kong, J.; Ronnqvist, M.; Frisk, M. Modeling an integrated market for sawlogs, pulpwood, and forest bioenergy. Can. J. For. Res. 2012, 42, 315–332. [Google Scholar] [CrossRef] [Green Version]
  39. Melo, M.T.; Nickel, S.; Saldanha-da-Gama, F. Facility location and supply chain management—A review. Eur. J. Oper. Res. 2009, 196, 401–412. [Google Scholar] [CrossRef]
  40. Arnold, R.J.; Xie, Y.J.; Midgley, S.J.; Luo, J.Z.; Chen, X.F. Emergence and rise of eucalypt veneer production in China. Int. For. Rev. 2013, 15, 33–47. [Google Scholar] [CrossRef]
  41. Venn, T.J.; McGavin, R.L. A decision-support system to assist forest industry planning and investment when data are scarce: The case of hardwood veneering in subtropical eastern Australia. Aust. For. 2021, 84, 59–72. [Google Scholar] [CrossRef]
  42. Venn, T.J.; Dorries, J.W.; McGavin, R.L. A mathematical model to support investment in veneer and LVL manufacturing in subtropical eastern Australia. For. Policy Econ. 2021, 128, 102476. [Google Scholar] [CrossRef]
  43. Francis, B.; Venn, T.; Lewis, T. A review of the private native forest resource, with a focus on economic contributions. In Improving Productivity of the Private Native Forest Resource in Southern Queensland and Northern New South Wales; Lewis, T., Venn, T., Francis, B., Ryan, S., Brawner, J., Cameron, N., Kelly, A., Menzies, T., Schulke, B., Eds.; Forest and Wood Products Australia: Melbourne, Australia, 2020; pp. 60–95. Available online: https://www.fwpa.com.au/images/resources/-2020/Final_Report_PNF_PNC379-1516.pdf (accessed on 6 February 2022).
  44. Florence, R.G. Ecology and Silviculture of Eucalypt Forests; CSIRO: Collingwood, Australia, 1996. [Google Scholar]
  45. Ryan, S.; Taylor, D. Sustainable Native Forest Management: Case Studies in Managing Private Native Forest in South-east Queensland; Department of Primary Industries and Fisheries: Brisbane, Australia, 2006. Available online: http://era.daf.qld.gov.au/id/eprint/1640/1/Sustainable_native_forestf_final-sec.pdf (accessed on 20 September 2017).
  46. Department of Natural Resources and Mines. Managing a Native Forest Practice: A Self-Asessable Vegetation Clearing Code; Department of Natural Resources and Mines: Brisbane, Australia, 2014.
  47. Carron, L.T. A History of Forestry in Australia; Australian National University Press: Canberra, Australia, 1985. [Google Scholar]
  48. DPI Forestry. An Overview of the Queensland Forest Industry; Department of Primary Industries: Brisbane, Australia, 1998.
  49. Jay, A.; Dillon, A. Modelling the outcomes of different silvicultural approaches in the private native forests of north-eastern New South Wales. Aust. For. 2016, 79, 85–95. [Google Scholar] [CrossRef]
  50. State of Queensland. Queensland Forest and Timber Industry. An Overview; Department of Agriculture and Fisheries: Brisbane, Australia, 2016.
  51. Queensland Government. Palaszczuk Government Takes Action to Support Timber Industry Jobs; Queensland Cabinet and Ministerial Directory; 2019. Available online: http://statements.qld.gov.au/Statement/2019/11/4/palaszczuk-government-takes-action-to-support-timber-industry-jobs (accessed on 19 December 2019).
  52. Francis, B.; Venn, T.; Lewis, T.; Brawner, J. Case Studies of the Financial Performance of Silvopastoral Systems in Southern Queensland, Australia. Forests 2022, 13, 186. [Google Scholar] [CrossRef]
  53. Lewis, T.; Pachas, N.; Venn, T.J. How can we grow the plantation estate and improve private native forest management in Australia? Silvopastoral systems provide a solution. Aust. For. 2022, 85, 55–59. [Google Scholar] [CrossRef]
  54. Lewis, T.; Brawner, J.; Menzies, T.; Ryan, S.; Schulke, B.; Francis, B.; Venn, T. Chapter 5: The effect of silvicultural treatments on forest growth rates and development of a decision support tool to determine forest value. In Improving the Productivity of the Subtropical Private Native Forest Resource in Southern Queensland and Northern New South Wales; Lewis, T., Venn, T., Francis, B., Ryan, S., Brawner, J., Cameron, N., Kelly, A., Menzies, T., Catchpoole, K., Eds.; Forest and Wood Products Australia: Melbourne, Australia, 2020; pp. 96–118. Available online: https://www.fwpa.com.au/images/resources/-2020/Final_Report_PNF_PNC2379-1516.pdf (accessed on 1 July 2020).
  55. Leggate, W.; McGavin, R.L.; Lewis, T. An assessment of native forests in Queensland for the potential supply of small-diamter, peeler logs for spindleless lathe rotary-veneer processing. BioResources 2019, 14, 9485–9499. [Google Scholar] [CrossRef]
  56. Venn, T.J.; McGavin, R.L.; Ergashev, A. Accommodating log dimensions and geometry in log procurement decisions for spindleless rotary veneer production. BioResources 2020, 15, 2385–2411. [Google Scholar] [CrossRef]
  57. Venn, T.; Dorries, J.; McGavin, R. Chapter 18: Financial performance of veneer and laminated veneer lumber (LVL) production using sub-optimum quality log resources. In Increasing the Value of Forest Resources through the Development of Advanced Engineered Wood Products; Forest and Wood Products Australia: Melbourne, Australia, 2020; pp. 429–466. Available online: https://www.fwpa.com.au/images/processing/2020/PNB407-1516_Advanced_EWP_Final_Report.pdf (accessed on 8 November 2020).
  58. MBAC Consulting Pty Ltd. South East Queensland Private Native Forest Inventory; A Report Prepared for the Commonwealth Government Department of Agriculture, Fisheries and Forestry, and Timber Queensland, Natural Heritage Trust and Bureau of Rural Sciences: Canberra, Australia, 2003. Available online: http://www.agriculture.gov.au/abares/publications/display?url=http://143.188.17.20/anrdl/DAFFService/display.php?fid=pe_brs90000002636.xml (accessed on 17 July 2017).
  59. MBAC Consulting Pty Ltd. Western Hardwoods Region Queensland Private Native Forest Inventory; A Report Prepared for the Commonwealth Government Department of Agriculture, Fisheries and Forestry, and Timber Queensland, Natural Heritage Trust and Bureau of Rural Sciences: Canberra, Australia, 2003.
  60. Venn, T.; McGavin, R. Chatper 17: Mill-delivered log costs and gross margins. In Increasing the Value of Forest Resources through the Development of Advanced Engineered Wood Products; McGavin, R., Leggate, W., Dorries, J., Eds.; Forest and Wood Products Australia: Melbourne, Australia, 2020; pp. 398–428. Available online: https://www.fwpa.com.au/images/processing/2020/PNB407-1516_Advanced_EWP_Final_Report.pdf (accessed on 1 July 2020).
  61. Kewilaa, B. Effects of wood species and log diameter on veneer recovery. J. Trop. Wood Sci. Technol. 2007, 5, 49–56. [Google Scholar]
  62. Wang, B.J.; Dai, C. Impact of mountain pine beetle-attacked lodgepole pine logs on veneer processing. Wood Fiber Sci. 2008, 40, 397–411. [Google Scholar]
  63. Belleville, B.; Redman, A.; Chounlamounty, P.; Phengthajam, V.; Xiong, S.; Boupha, L.; Ozarska, B. Potential of veneer peeled from young eucalypts in Laos. BioResources 2018, 13, 7581–7594. [Google Scholar] [CrossRef]
  64. Roos, A.; Flinkman, M.; Jappinen, A.; Lonner, G.; Warensjo, M. Production strategies in the Swedish softwood sawmilling industry. For. Policy Econ. 2001, 3, 189–197. [Google Scholar] [CrossRef]
  65. Lahtinen, K.; Toppinen, A. Financial performance of Finnish large-and medium-sized sawmills: The effects of value-added creation and cost-efficiency seeking. J. For. Econ. 2008, 14, 289–305. [Google Scholar] [CrossRef]
  66. Brege, S.; Nord, T.; Sjostrom, R.; Stehn, L. Value-added strategies and forward integration in the Swedish sawmill industry: Positioning and profitability in the high-volume segment. Scand. J. For. Res. 2010, 25, 482–493. [Google Scholar] [CrossRef]
  67. Srai, J.S.; Kumar, M.; Graham, G.; Phillips, W.; Tooze, J.; Ford, S.; Beecher, P.; Raj, B.; Gregory, M.; Tiwari, M.K.; et al. Distributed manufacturing: Scope, challenges and opportunities. Int. J. Prod. Res. 2016, 54, 6917–6935. [Google Scholar] [CrossRef]
  68. Rauch, E.; Dallasega, P.; Matt, D.T. Distributed manufacturing network models of smart and agile mini-factories. Int. J. Agil. Syst. Manag. 2017, 10, 185–207. [Google Scholar] [CrossRef]
  69. MacCormack, A.D.; Newmann, L.J.; Rosenfield, D.B. The new dynamics of global manufacturing site location. MIT Sloan Manag. Rev. 1994, 35, 69. [Google Scholar]
  70. Holl, A. Manufacturing location and impacts of road transport infrastructure: Empircal evidence from Spain. Reg. Sci. Urban Econ. 2003, 34, 341–363. [Google Scholar] [CrossRef]
Figure 1. Case study area. Note: There are sawmills at Theodore and Toowoomba. Source: [43].
Forests 13 01903 g001
Figure 2. NPV for integrated production of one-stage LVL. (a) Facility location A. (b) Facility location B.
Forests 13 01903 g002
Figure 3. NPV for integrated production of two-stage LVL. (a) Facility location A. (b) Facility location B.
Forests 13 01903 g003
Figure 4. Average costs of production and profit after tax for integrated production of one-stage LVL. (a) Facility location A. (b) Facility location B.
Forests 13 01903 g004
Figure 5. Average costs of production and profit after tax for integrated production of two-stage LVL. (a) Facility location A. (b) Facility location B.
Forests 13 01903 g005
Figure 6. After-tax profit of distributed production for (a) one-stage and (b) two-stage LVL. Note: High S&H was $40/m3 of dry veneer. Low S&H was $20/m3 of dry veneer. Missing bars and dots indicate scenarios that were not technically feasible.
Forests 13 01903 g006aForests 13 01903 g006b
Table 1. Decision variables (Dec), derived parameters (Der), vector or matrix parameters (P), binary parameters (Bin), and scalar parameters (SP) for the mathematical model.
NameVariable or ParameterDescription
LViltDecHarvested log volume (m3 ha−1)
AHitDecArea harvested (ha)
ARtDerAnnual revenues ($)
ACtDerAnnual costs ($)
MDLCtDerMill-delivered log cost ($)
MVtDerMarketable volume of final product (m3)
LCtDerLabour cost ($)
LRtDerPrincipal and interest repayment on a bank loan for buildings, equipment and machinery taken out in year zero ($). The model uses the PMT function in Excel. The principal is BBCap. In the case study, the loan term is 10 years and interest rate is 6% per annum.
CapPBuildings, equipment, and machinery costs in year zero ($)
LYCaptPLater year capital and equipment costs ($)
FTEjsPNumber of full-time equivalent workers
HAiPTotal area of commercially important and harvestable native forest (ha)
HLjsPHourly cost of labour, including on-costs ($ h−1)
MPPMarket price of the final product being evaluated ($ m−3 of product)
NLPSPAnnual non-labour operating costs that vary by processing scale ($ m−3 of log processed)
NLMVPAnnual non-labour operating costs that vary by marketable volume of final product ($ m−3 of final product)
PRslPProcessing rate of inputs per hour at a 100% utilisation rate of equipment and machinery (m3 h−1);
RFslPRecovery of final marketable product from log volume (%)
SlPStumpage price paid to the landholder ($ m−3 of log)
ScalePVeneer plant processing scale examined (m3 y−1 of log)
URsPUtilisation rate of equipment and machinery (% of work hours)
SLVilPStanding harvestable log volume for the selection harvest regime permitted in the study area (m3 ha−1)
CSLlPCut snig and load cost ($ m−3 of log)
HFCiPHaul fixed cost ($ m−3 of log)
HVCiPHaul variable cost ($ m−3 km−1 of log)
DistiPStraight-line haul distance to the veneer facility from haul zone i (km)
CFiPCompetition factor, defined as the percent of total commercially important and harvestable forest area potentially available to the processing facility being modelled (%).
FPFreight cost ($ m−3 of final product)
rSP 7%Real (net of inflation) discount rate (%)
ALSP 20Asset life of Cap (years)
BBSP 70%Proportion of Cap borrowed from the bank (%)
AMSP 5%Annual maintenance costs in parts (not labour) (% of Cap)
AISP 1.5%Annual insurance costs (% of Cap)
WRFSP 30%‘Windy road factor’, which accounts for roads not being in straight lines from the forest to the mill (% increase in haul distance relative to a straight-line haul)
HRISP 30 yearsHarvest return interval, which is the minimum time between commercially viable harvests (years)
DeptBin 1, 0A dummy variable that tracks whether depreciation can be claimed on Cap. If tAL, then Dept is 1, else Dept is 0.
TAXBin 30%, 0%Company tax rate. If ARt > ACt, then TAX is 30%, otherwise TAX is 0%.
Table 2. Index sets used in the mathematical model.
NameDescription
i   NHaul zone. In the case study, there are 40 haul zones radiating out from the facility location in 10 km increments to a maximum of 400 km.
j  JPosition or job type.
l   LLog type. In the case study these are: A-grade sawlog; B-grade sawlog; small peeler log; and top log.
t   TTime period since initial capital investment (years).
s  SStage of production. In this case study there are four: green veneer production; dry veneer production; one-stage LVL production and two-stage LVL production.
Table 3. Log and harvest cost parameters.
ParameterLog Type
Small Peeler or Top LogB-Grade SawlogA-Grade Sawlog
Small-end diameter under bark (SEDUB, cm)253545
Log volume (m3/log)0.1380.2640.432
Log volume loss due to rounding (%)8.05.64.4
SLVil (m3/ha)3.4/0.63.51.1
Sl ($/m3)4055110
CSLl ($/m3)66/4843.543.5
Table 4. Forest area, competition factor and haul costs by haul distance from the facility.
Disti (km)HAi by Facility Location Scenario (ha)CFi (%)HFCi ($/m3)HVCi ($/m3/km)
AB
0–30030,0005910.330.3856
31–50053,3335921.900.3153
51–8021,667130,0002628.210.2355
81–10020,000120,0002635.280.2007
101–200347,222288,889839.290.1731
201–300578,704481,482456.600.1731
301–400810,185674,074273.910.1731
Total1,777,7781,777,778
Table 5. Final product dimensions.
Final ProductLength (m)Width (mm)Thickness (mm)
One-stage LVL2.412035
Two-stage LVL2.4150100
Table 6. Optimal proportion of log types in log procurement scenario 3 by processing scale and facility location.
Log TypeProportion (%) of Logs by Log Type to Maximise NPV for Each Processing Scale (m3/y of Log) and Facility Location.
750015,00030,000
ABABAB
A-grade sawlog005.60n.a.2.2
B-grade sawlog73.995.354.690.7n.a.55.3
Small peeler or top log26.14.739.89.3n.a.42.5
Note: ‘n.a.’ indicates this combination of log processing scale and facility location was not technically feasible due to insufficient log volume over the 30-year investment period.
Table 7. Average mill-delivered log cost over 30 years.
Log Procurement ScenarioAverage Mill-Delivered Log Cost ($/m3) by Processing Scale (m3/y of Log) and Facility Location
750015,00030,000
ABABAB
1163131n.a.138n.a.n.a.
2155131166135n.a.141
3152126164132n.a.137
Note: ‘n.a.’ indicates this combination of log processing scale and facility location was not technically feasible due to insufficient log volume over the 30-year investment period.
Publisher’s Note: MDPI stays neutral with regard to jurisdictional claims in published maps and institutional affiliations.

