Abstract
Fire modifies vegetation dynamics in terrestrial ecosystems. Abundant literature has studied the post-fire effects with satellite sensors; however, relatively fewer studies have used unmanned aerial vehicles (UAVs) to assess the dynamics of greenness prior to and immediately following prescribed fires. Using multispectral sensors mounted on UAVs, we documented the results of the normalized difference vegetation index (NDVI) as a proxy for pre- and post-fire greenness in a natural forest stand in northern Mexico. Using spectral reflectance techniques and the statistical analyses of Kruskal–Wallis and pairwise Wilcoxon rank-sum tests, statistically significant differences were found in the NDVI values, measured before and after controlled burning (p < 0.05). The results showed an increase in post-fire “greenness” from 0.57 to 0.65. This was interpreted as an immediate change in vegetation activity in the canopy, which could be attributable as a stimulus to heat stress. Complementary spectral indices also reinforce our findings; we recognize that further research is required, for instance, to address the timing of image capture. Our findings demonstrate the potential and some of the challenges associated with the use of UAVs to monitor prescribed fires, while also suggesting the need for more detailed physiological and phenological studies. High spatial and spectral resolution maps of greenness represent a valuable starting point for subsequent temporal monitoring and contribute to the knowledge of fire effects at fine spatial resolutions.
1. Introduction
Fire is recognized as a component that configures the ecology of forest ecosystems [1]. Different studies have documented the influence of fire on forest structure [2,3,4,5], with impacts such as accelerated soil erosion [6] and increased post-fire flood risk [7], among other disturbances [8].
However, there are still aspects that merit exploration in greater detail; for example, the reaction to fire in terms of greenness as a proxy of vigor merits a thorough investigation, particularly in natural forests where the coexistence of multiple species and diverse structures constitute natural laboratories of great value for discerning the ecological mechanisms that underlie the natural responses to such events [9].
With the advent of unmanned aerial vehicles (UAVs) or drones, the monitoring of tree health has been refined, overcoming the observational spatiotemporal, atmospheric, and radiometric limitations often presented by satellite technology [10,11]. The ability to record behavioral photosynthetic activity in near-real time, by means of spectral reflectance, thus offers promising prospects as a potential indicator of vigor for monitoring forest health on an individual tree scale [12].
The normalized difference vegetation index (NDVI) is the most commonly documented indicator of health status, although, in the majority of cases, this has been monitored at the macro-scale level [13,14,15], and the use of NDVI at a finer spatial resolution has been limited [16]. However, the novel findings of a previous study document that NDVI values that are recorded using UAVs can be a valuable tool for monitoring post-fire vegetation dynamics [17]. Moreover, NDVI is useful for the evaluation of the quantities of active biomass, atmospheric effects, and soil moisture content, the detection of which is more difficult with satellite sensors [15]. By taking advantage of contrasts between the electromagnetic bands and chlorophyll pigments, NDVI is a dominant and effective index that is capable of distinguishing the potential photosynthetic capacity of trees, which, in turn, is affected by fires. To our knowledge, there are also few studies that report any variation in greenness over short temporal scales (i.e., days or hours) or at a detailed resolution level (i.e., pixels of centimetric size).
Recognizing the ecological processes operating at this scale is fundamental for subsequent ecological research [9]. Moreover, these forests are subject to droughts [18]; thus, they exhibit abrupt changes in productivity that are temporally and spatially indiscernible in satellite images. In the face of these observational discrepancies, UAVs are useful for addressing the ecological questions and challenges presented by these ecosystems.
Understanding the responses of photosynthetic activity through reflectance, as an immediate reaction to fire, represents an opportunity to refine our understanding of the physiological mechanisms performed by trees when a fire occurs. Although it is hypothesized, a priori, that fire can reduce vigor and even cause mortality, quantitative variations in NDVI as a potential proxy for vigor in natural forests has yet to be documented at such a detailed level. By using multiple sensors via UAV, the multispectral resolution is enhanced, producing multispectral indices [12,17] such as the green NDVI (GNDVI), leaf chlorophyll index (LCI), normalized difference red-edge index (NDRE), optimized soil adjusted vegetation index (OSAVI), ratio vegetation index (RVI), transformed vegetation index (TVI), and normalized difference greenness index (NDGI), among others. These indices might be complementary indicators of crown vigor, phenology, structural characteristics, defoliation risk, and potential photosynthesis rates among other ecological variables, the comparative analysis of which is beyond of the scope of our study.
Monitoring pre-fire and post-fire conditions in natural forests remains a challenge. As a strategy for testing such changes, prescribed burning is a tool that the fire management community has used to improve ecosystem conditions [19,20,21,22]. The proper planning of fires ensures controlled execution, enabling the design of experiments that can provide new scientific knowledge.
The Sierra Madre Occidental (SMO) region is home to a great diversity of taxa, such as Quercus, Pinus, and Arbutus. Pine and pine-oak forests are the most widely distributed types in the SMO and constitute sources of goods and services for the inhabitants, in addition to providing environmental services for neighboring communities [23,24]. In this study, we report the results of an experiment conducted in a pilot area that was representative of uneven-aged mixed forests in northern Mexico, comprising pine–oak associations. Here, we demonstrate variations in reflectance properties, using NDVI as a proxy for forest greenness before and after fire events. We hypothesized that greenness, as a proxy for photosynthetic activity, will show an immediate and statistically significant change in response to the application of fire, which is attributable as a stimulus to heat stress.
2. Materials and Methods
2.1. Study Area
The study area is located in Mesa de Pawiranachi, of the municipality of Guachochi, in the mountain massif known as the Sierra Madre Occidental (SMO) (Figure 1). The topography of the site is irregular, with a maximum slope of 30%. The trees that are present in the burned area comprise mixed species of the genus Pinus, Quercus, Juniperus, and Arbutus, and the area is considered a juvenile site (Figure 1 and Table 1). The grass species growing in the area include Bouteloua gracilis, Lycurus phleoides, Aristida divaricata, and Eragrostis pilosa, among other herbaceous plants [23]. The data pertaining to the fire behavior and to the effects of burning at individual tree level (e.g., flame height and flame intensity) were unavailable. This area is a natural forest that is subject to timber forest management and is classified as a Pinus-Juniperus area.
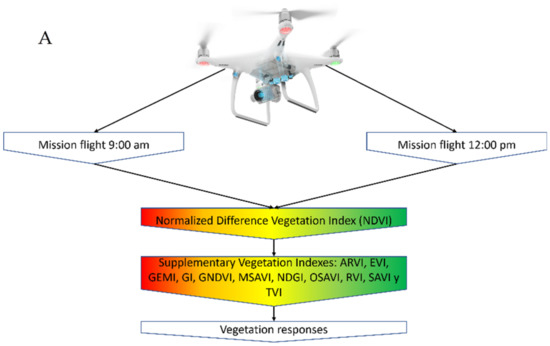
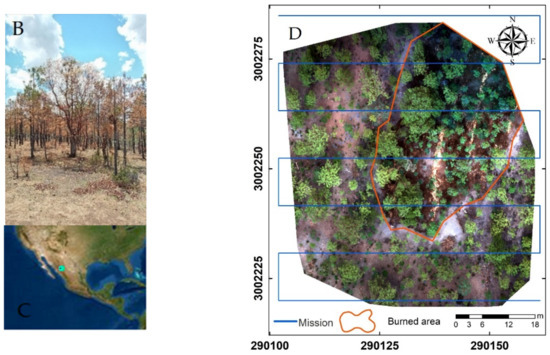
Figure 1.
Workflow of the processing stages of images taken from UAV (A). Location (B,D) and view of the study area in Chihuahua, Mexico (C).

Table 1.
Statistical estimators of the recorded trees in the study site.
According to the methodology used by the authors of [25], the fuel load included 18.5 Mg ha−1 for grasses, forbs, and shrubs, as well as 2.5 Mg ha−1 for the litter and fermentation layer. The relative humidity was 26% (“Comisión Nacional del Agua”, e.g., CNA, personal communication).
2.2. Workflow
Prior to burning the area, the UAV flight was conducted on 4 March 2022 at 9:00 a.m., using a DJI Phantom 4 quadcopter carrying an RGB digital camera and a multispectral set of five cameras (Figure 1, left), covering blue (450 nm ± 16 nm), green (560 nm ± 16 nm), red (650 nm ± 16 nm), red edge, 730 nm ± 16 nm) and near-infrared (840 nm ± 26 nm) spectra, all with a global obturator of 2 MP [26]. The flight was conducted at an altitude of 50 m in an east–west direction (Figure 1).
A prescribed burn was then conducted on 4 March 2022, beginning at 9:00 a.m. under the responsibility of the personnel of the Comisión Nacional Forestal (CONAFOR, the Mexican National Forestry Commission), as can be seen in Figure 2A. Established protocols for this activity (Figure 2B) were considered. The fire left an average trunk scar height of 1.8 m, and the average degree of crown scorch (volume) was visually estimated at 60% (Appendix B Figure A12). Finally, three hours after initiating the burn, the mopping-up phase was executed. Once the smoke had cleared (Figure 2D), the UAV was flown over the site again to obtain post-fire aerial photographs.
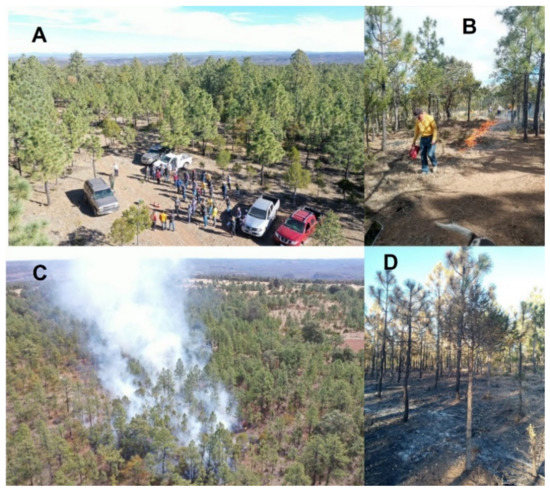
Figure 2.
(A) = Planning of the burn, in coordination with the personnel of CONAFOR, Chihuahua state official representation, (B) = initiation of the prescribed burning, (C) = aerial view of the fire, and (D) = view of the area post-fire.
2.3. Multispectral Processing
The images were processed and analyzed using photogrammetric procedures, with the free and open-source software, OpenDroneMap (ODM) [27]. This software implements the algorithm structure from motion and multi-view stereo (SfM and MVS) to produce 3D clouds of points of 1000–20,000 points per m−2. This process generated the RGB and multispectral orthomosaics (Appendix C, Table A1, Table A2, Table A3 and Table A4).
To analyze the effect of the prescribed burn, the normalized difference vegetation index (NDVI) was used along with the QGIS program, version 3.16.15 (QGIS.org, 2020. Available online: https://qgis.org/en/site/ (accessed on 7 November 2022)). This index highlights the vegetation traits and is calculated using the reflectance obtained using the sensitive bands in the portion of the electromagnetic spectrum of red and near-infrared. The NDVI was calculated for each image, before and after the fire.
2.4. Comparative Procedure for the Pre- and Post-Fire NDVI Values
The values of the NDVI were extracted for each of the pixels of the generated orthomosaics. To test the hypothesis that the data would present a normal distribution, a Kolmogorov–Smirnov test with Lilliefors correction was carried out [28]. To compare the pre- and post-fire scenarios, a Kruskal–Wallis test was performed. This calculates paired comparisons in order to evaluate whether or not a significant difference exists between mean values [29]. Moreover, the Kruskal–Wallis test was applied to evaluate whether the distributions of the values pre- and post-fire correspond to those of an identical population. For the comparisons of pairs between group levels, with corrections for multiple tests, pairwise Wilcoxon rank-sum tests were used, given that they involve less stringent assumptions than their parametric counterparts [30]. These nonparametric tests are useful for comparing two unpaired groups of data, and all tests compute the p-values for testing the null hypothesis, depending on the discrepancy between the mean ranks of the two groups and the distributions, as studied here [31]. All these analyses were conducted with the program R Studio (R Core Team, Vienna, Austria. Available on: https://www.R-project.org/, accessed on 3 October 2022), using the library “normtest” [32].
The effects of noise through photosynthesis rates and the presence of smoke and shadows were eliminated using the same procedures, considering the adjacent area as a control (see Figure 3). This strategy allowed us to clearly distinguish the effects of the NDVI in the study area. Given there are more spectral indices that could support the results from NDVI [12,17], we consider it appropriate to calculate these individually in order to reinforce our findings. It is also plausible that each can be affected by sensor type and atmospheric effects; consequently, multi-index analysis provides an effective tool with which to further our understanding of vegetation dynamics (Appendix A).
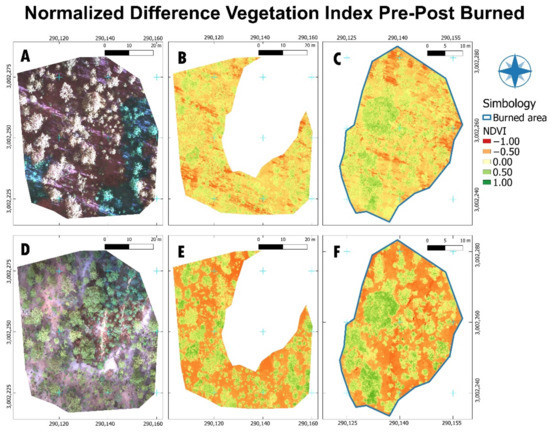
Figure 3.
(A,D): Orthomosaic pre- and post-fire, respectively, of the burned area. (B,E): NDVI values pre- and post-fire, respectively, of the adjacent control area. (C,F): NDVI values pre- and post-fire, respectively, of the burned area. The time that elapsed between the pre- and post-fire UAV flights was three hours.
3. Results
Figure 3 presents the orthomosaics derived from the photogrammetric process with the ODM software, as well as the NDVI values before and after the prescribed burning, including an adjacent area that was utilized as a control.
It can be seen that the distribution of the pre- and post-fire NDVI values in the study area differ significantly (see Table 2). It is therefore evident that the sensor recorded a change in greenness, with values of 0.57 to 0.65, respectively. However, the negative values were also lower following the fire, for which reason, the burned area presented the lowest NDVI values (−0.64 > −0.91; Figure 3). These results are complemented by Figure 4, which presents the histograms and boxplots of the pre- and post-fire NDVI values for the area of the prescribed burn and the adjacent control area.

Table 2.
Normality tests, the tests of the origin of the data, and comparisons of pairs for the burned area and the adjacent control area, before and after the prescribed burn.
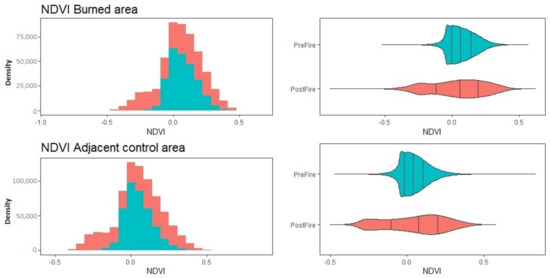
Figure 4.
Boxplots and histograms of frequency before and after the prescribed burn for the burned area (above) and the adjacent control area (below).
Given that the Kolmogorov–Smirnov test with Lilliefors correction demonstrated that the data presented a non-normal distribution (p-value = 2.20 × 10⁻¹⁶), the non-parametric pairwise Wilcoxon rank-sum test was applied. This test demonstrated that the medians of these two distributions differ significantly (p-value = 2.2 × 10⁻¹⁶). The Kruskal–Wallis test showed that at least one distribution in the samples is different (p-value = 2.2 × 10⁻¹⁶).
Specifically, it was categorically demonstrated that the pre- and post-fire NDVI values translate into a statistically significant change in greenness. The control area also differed significantly in terms of greenness before and after the prescribed burn (Table 2); however, the maximum and minimum values were greater in the burned area than in the adjacent control area (0.58 and −0.63, Figure 3).
The EVI, GEMI, GI, GNDVI, MSAVI, NDGI, OSAVI, RVI, SAVI, TVI, and ARVI showed important differences in terms of their values. Appendix A shows the different indices calculated for the study area from the multispectral orthomosaic derived from the photogrammetric process (see histograms and violin plots Appendix A). The values of these indices reinforced the discrimination between the pre-fire and post-fire effects. We speculate that such variation is hypothetically attributable to different levels of photosynthetic activity, as well as to the open burned spaces; however, this should be demonstrated through plant physiological and detailed reflectance experiments. Our study is focused solely on the green indices derived from reflectance.
4. Discussion
This is a pioneering study on the post-fire responses in the greenness of trees in natural forest stands, particularly given the relative scarcity of related studies using UAVs (e.g., [33,34]. As hypothesized, it shows that there would be a variation in NDVI levels; moreover, the magnitude and direction of such variations are documented here.
Firstly, assuming that the sensor records the photosynthetic activity in the canopy, we can speculate that fire was a stimulus for photosynthetic activation and promoted a potential, immediate change in vegetation activity. In the area subjected to fire, our findings show that the NDVI tends to increase (0.57 to 0.65) three hours after exposure to controlled burning. This could be interpreted as a physiological activity in response to heat stress. In previous studies, it has been documented that heat activates photosynthesis as a survival strategy since undamaged leaves can use the available water to increase stomatal conductance and photosynthetic rates [35,36], presenting unaffected or even enhanced post-fire growth and production [37,38]. However, these levels of photosynthesis may be limited or eliminated when the intensity of burning is high and for prolonged periods [39].
However, these results should be treated with some caution. Although the NDVI of the trees increased in response to fire, this does not necessarily mean that they can maintain or prolong this rate of increase over a prolonged period of time. We believe that this response could change temporally, on scales from days to months or years [40], although this aspect was not addressed in our study. We propose to design and run further experiments, although the technical and economic viability of this proposal depends on financial and institutional efforts. CONAFOR is the institution involved in prescribed and controlled burns in Mexico; this differs according to the social stakeholders present in each region [41].
Photographs of the leaf structures that show obvious changes are presented in Appendix B Figure A12. Moreover, a few juvenile trees that appeared to have been killed by the fire subsequently recovered through resprouting, as observed in the field some weeks later (see Appendix B Figure A12).
The response recorded in our experiment was almost automatic (e.g., 3 h), but we have no data to indicate that this trend is maintained and is not reversed. In some cases, the ultimate fate of tree vigor may be individual mortality or a rate of decay [39,42], depending on tree size, species, and the level of effect from fire [43]. Further measurements are, therefore, required to understand the dynamics and effects of vigor change, as well as to associate these with exogenous effects, such as drought episodes, pests, and forest management, among other factors [44]. It is also possible that those trees with predominance and better comparative health can enhance their physiological capacities to increase their photosynthetic rates [44].
We recommend the subsequent monitoring of such levels of damage and relating these temporally to the NDVI values. Another factor to consider is the quantification of burned structures in the lower part of the canopy branches, which, when burned, limit their photosynthetic efficiency compared to those in the middle and upper part of the canopy. Therefore, as the lower and less productive leaves are eliminated by fire, such a balance can also influence the NDVI value.
We consider that the immediate increase in NDVI values in sites affected by a fire at low intensity and low severity may also be related to the temporary increase in CO2 (as part of the smoke generated), since this gas is used in photosynthesis and, according to [45], is the most important component of fire smoke after water vapor. The increase in temperature may also have contributed to the values since black colors absorb infrared radiation. After the fire, the surface temperature may have been higher than in the unburned control area, particularly at the height of the juvenile trees, and could have contributed to approaching or reaching the optimum temperature for photosynthesis.
It is well known that one of the objectives of prescribed burning is to improve stand health [46]. However, further study is also recommended to investigate the effects of burning, not only temporally but also in structural terms. These results are of great importance to silvicultural stand management, given that residual densities can enhance silvicultural development, not only with thinning [47] but also with the application of prescribed burns [40].
Regarding the results from the adjacent unburned area, the incorporation of this control area was strategic since it allowed the discrimination of noise from smoke, the time of burning, and photosynthetic activity. It seems that it can be ruled out that the results in the burned area were influenced by smoke since the trend is the same in both scenarios; this effect needs to be considered, as reported in [48,49]. However, the effect of shadow and of energy reflectance, which is graphically evident in both areas, cannot be ruled out. Although the causes were not studied here, we attribute them to the time of image acquisition, since there was a large number of shadows prior to burning. The timing of the captured images, which affects the amount of sunlight and, hence, differences in spectral reflectance signals, still requires further research.
Similar studies advise the avoidance of shadows [50], but this requires further analysis since burning should be carried out in the early hours of the day [51]. In any case, it is recommended to carry out continuous flights on the same day, to determine the optimal time for acquiring NDVI data. It has been documented that photosynthesis also varies, depending on the time of day and night [52]. For instance, the authors of [34] used diurnal and nocturnal images to measure seasonal changes in crop morphology.
The use of remote sensing was ideal for monitoring NDVI behavior in near real-time. The literature reports NDVI as a reliable estimator of fire severity in forest environments [33], not only for vegetation but also for burning soil [53]. Thus, when the sensor is linked to the UAV, the multispectral images are of very high resolution and are crucial for fire monitoring [33].
It is recognized that photosynthetic activity in the canopy plays a crucial role in understanding pre-fire and post-fire effects. To date, an evaluation of the magnitude of photosynthetic variability in natural forest species remains a challenge that merits further analysis. Although we did not aim to compare the rates and thresholds of vegetation activity, we argue that multiple spectral reflectance results provided trends similar to those revealed by the NDVI. However, further research is required in terms of exploring the ground-level photosynthetic measurements, considering the tree-canopy level and seasonality of image capture. Each index presents differences in its spectral reflectance, but the best combination of these indicators remains to be determined.
Furthermore, several models have recently been developed by integrating more regional-scale satellite data and UAV images [54]. For instance, information obtained using UAVs can be used as precise ground truth information but, for large-scale monitoring, Sentinel-2 imagery could be the only feasible solution. We, therefore, suggest exploring a fusion approach between these sensors, in order to enhance the results of future research. In addition, there is great potential for the calculation of various indices associated with other machine learning algorithms, such as random forest [55].
5. Conclusions
Tree NDVI values tend to change after a prescribed burn, a finding that has been attributed to the response in terms of photosynthetic activity. However, to test the sustainability of this pattern, a long-term study is needed to understand the recovery response of the community. The inclusion of an adjacent control area is recommended in subsequent studies, to discern the statistical differences before and after burning. It is recommended that spectroscopy data be associated with the fields of phenology and physiology, in order to discern the effect on the greenness values of factors such as temperature, CO2, tree size, acceptance level, and flight time. The heterogeneous stand proved to be a suitable area in which to assess the community response to a fire event since these findings are pioneering in northern Mexican forests. Subsequent research at the individual tree level could improve the vegetation responses to prescribed fire planning and evaluation. In addition, these results can be used to improve fire ecology research.
Author Contributions
Conceptualization, M.P.-G.; methodology, M.P.-G. and D.A.R.-T.; software, M.P.-G. and J.A.M.-R.; validation, C.A.A.-S. and L.M.-A.; formal analysis, F.d.J.R.-F.; investigation, D.J.V.-N.; resources, F.d.J.R.-F.; data curation, F.d.J.R.-F. and M.P.-G.; writing—original draft preparation, M.P.-G., R.D.V.-C. and F.d.J.R.-F.; writing—review and editing, C.A.A.-S., L.M.-A. and D.A.R.-T.; visualization, J.A.M.-R.; supervision, F.d.J.R.-F.; project administration, M.P.-G.; funding acquisition, F.d.J.R.-F. All authors have read and agreed to the published version of the manuscript.
Funding
This research was funded by CONACYT through project A1-S-21471.
Institutional Review Board Statement
Not applicable.
Informed Consent Statement
Not applicable.
Data Availability Statement
Not applicable.
Acknowledgments
We thank DendroRed, (http://dendrored.ujed.mx; accessed on 20 August 2022). We also acknowledge Ejido Papajichi, Dirección Forestal of the municipality of Guachochi, CONAFOR Chihuahua, and the Dirección Forestal of the Chihuahua State Government. Our thanks go to the Facultad de Ciencias Forestales y Ambientales of the Universidad Juárez del Estado de Durango for facilitating and supporting the collection of field data.
Conflicts of Interest
The authors declare no conflict of interest.
Appendix A
In this section, we provide additional spectral indices to support the results from NDVI.
The calculation was performed using the raster calculator of the QGIS program through the following expressions (Equations (A1)–(A11)):
where EVI = the enhanced vegetation index, GEMI = the global environment monitoring index, GI = the greenness index, GNDVI = the green NDVI, MSAVI = the modified soil-adjusted vegetation index, NDGI = the normalized difference greenness index, OSAVI = the optimized soil adjusted vegetation index, RVI = the ratio vegetation index, SAVI = the soil-adjusted vegetation index, TVI = the transformed vegetation index, ARVI = the atmospherically resistant vegetation index, NIR = the near-infrared band, RED = the red band, RedEdge = the red-edge band, and GREEN = the green band.
The enhanced vegetation index (EVI) shows atmospheric effects. This method is a useful complement to the NDVI since it does not involve the saturation of dense canopies. In this way, the burned area shows an activity change after the occurrence of fire (Figure A1).
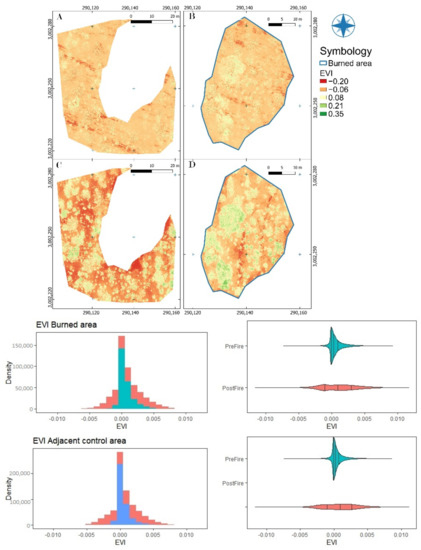
Figure A1.
The enhanced vegetation index (EVI) before and after the prescribed burn, in histograms and violin plots. (A,C): EVI pre- and post-fire, respectively, of the adjacent control area. (B,D): EVI pre- and post-fire, respectively, of the burned area.
The global environment monitoring index (GEMI) reduced the atmospheric and edaphic changes, mainly where dark surfaces were present. The estimation of this index is useful to test the increase in vegetation activity and the discrimination of the burned area (Figure A2).
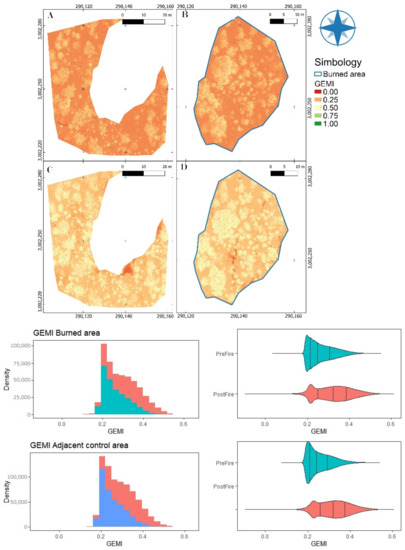
Figure A2.
The global environment monitoring index (GEMI) before and after the prescribed burn, in histograms and violin plots. (A,C): GEMI pre- and post-fire, respectively, of the adjacent control area. (B,D): GEMI pre- and post-fire, respectively, of the burned area.
The greenness index (GI), as a proxy of vigor and biomass, shows coherence between vegetation changes before and after the prescribed burn (Figure A3).
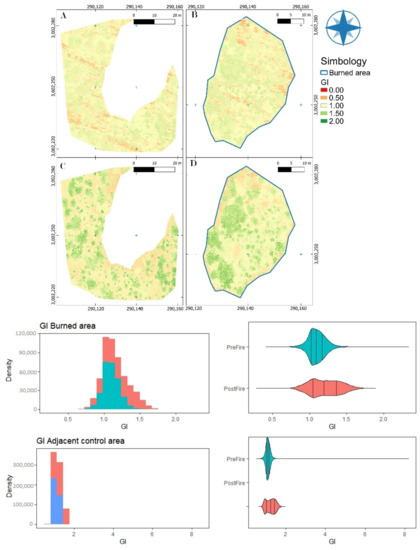
Figure A3.
The greenness index (GI) before and after the prescribed burn, histograms, and violin plots. (A,C): GI pre- and post-fire, respectively, of the adjacent control area. (B,D): The GI pre- and post-fire, respectively, of the burned area.
The green NDVI (GNDVI) supplements the results considering the chlorophyll content linked to photosynthetic activity. This index shows an increase in canopy photosynthetic activity that is potentially caused by the effects of fire. The lowest values of GI belong to sites within the affected area (Figure A4).
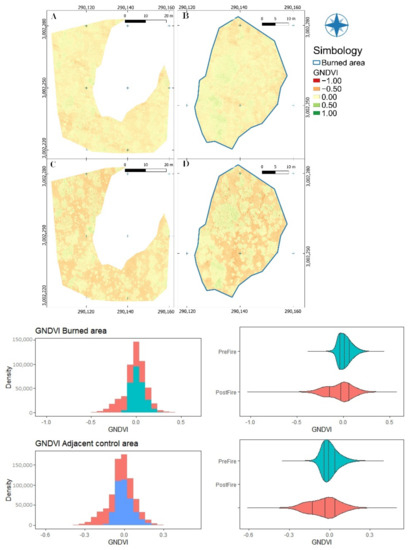
Figure A4.
The green NDVI (GNDVI) before and after the prescribed burn, histograms, and violin plots. (A,C): GNDVI pre- and post-fire, respectively, of the adjacent control area. (B,D): GNDVI pre- and post-fire, respectively, of the burned area.
The modified soil-adjusted vegetation index (MSAVI) and the NDVI allow improved precision. The results are useful to identify differences between images taken before and after the prescribed burn (Figure A5).
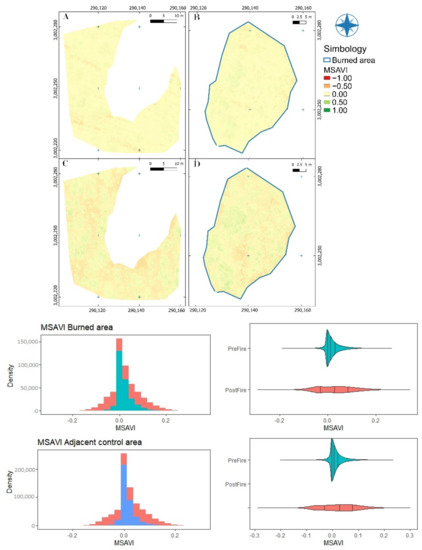
Figure A5.
The modified soil-adjusted vegetation index (MSAVI) before and after the prescribed burn, histograms and violin plots. (A,C): MSAVI pre- and post-fire, respectively, of the adjacent control area. (B,D): MSAVI pre- and post-fire, respectively, of the burned area.
The normalized difference greenness index (NDGI) shows changes in the vegetation status quo following perturbation. The changes indicate the reflectant attributes of the plants. An important advantage of the NDGI is its sensitivity to high and low deviations (Figure A6).
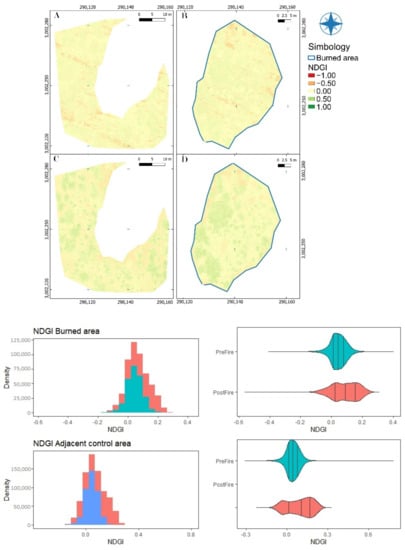
Figure A6.
The normalized difference greenness index (NDGI) before and after the prescribed burn, in histograms and violin plots. (A,C): NDGI pre- and post-fire, respectively, of the adjacent control area. (B,D): NDGI pre- and post-fire, respectively, of the burned area.
The optimized soil-adjusted vegetation index (OSAVI) is recommended for monitoring areas of bare soil through the canopy. The NDVI evidenced the changes of the vegetation related to fire, especially in areas with a low density of trees (Figure A7).
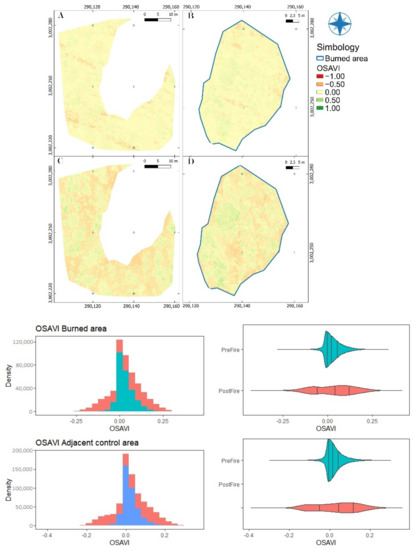
Figure A7.
The optimized soil adjusted vegetation index (OSAVI) before and after the prescribed burn, in histograms and violin plots. (A,C): OSAVI pre- and post-fire, respectively, of the adjacent control area. (B,D): OSAVI pre- and post-fire, respectively, of the burned area.
The ratio vegetation index (RVI) allowed spatial comparisons to be made as an alternative to NDVI monitoring. This index reduced atmospheric effects and provided a better perception of contrast between soil and vegetation by reducing the effects of lighting conditions (Figure A8).
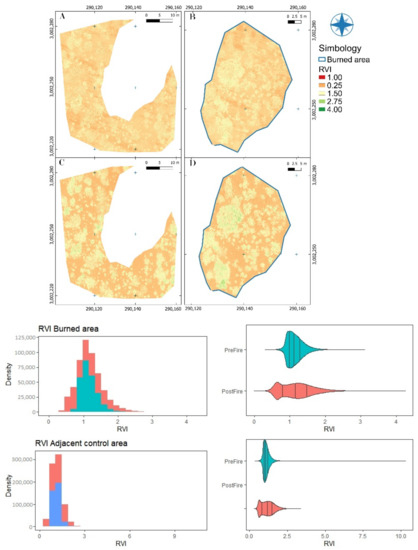
Figure A8.
The ratio vegetation index (RVI) before and after the prescribed burn, in histograms and violin plots. (A,C): RVI pre- and post-fire, respectively, of the adjacent control area. (B,D): RVI pre- and post-fire, respectively, of the burned area.
The soil-adjusted vegetation index (SAVI) was estimated to mitigate the impact of brightness of the soil since this affects the NDVI results. This index is useful when the vegetation that is present is young (Figure A9).
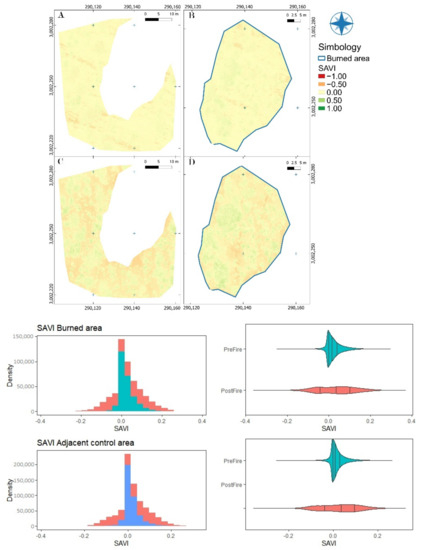
Figure A9.
The soil-adjusted vegetation index (SAVI) before and after the prescribed burn, in histograms and violin plots. (A,C): SAVI pre- and post-fire, respectively, of the adjacent control area. (B,D): SAVI pre- and post-fire, respectively, of the burned area.
The transformed vegetation index (TVI) is sensitive to canopy structure. This index is useful to monitor vegetation changes because it contrasts reflectance values. Here, it segregated the treetops and removed noise associated with the soil (Figure A10).
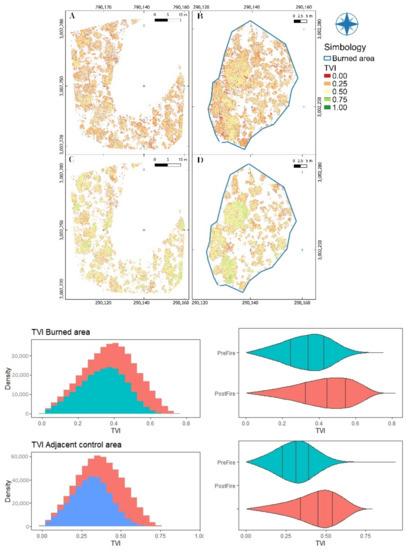
Figure A10.
The transformed vegetation index (TVI) before and after the prescribed burn, in histograms and violin plots. (A,C): TVI pre- and post-fire, respectively, of the adjacent control area. (B,D): TVI pre- and post-fire, respectively, of the burned area.
Given that the study area was influenced by fire at the end of the burn, the atmospherically resistant vegetation index (ARVI) was calculated. This allows mitigation of the effects of atmospheric dispersion (Figure A11). Differences before and after burning can be seen in the results.
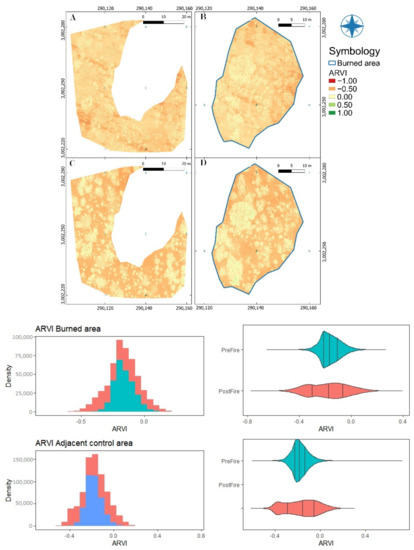
Figure A11.
The atmospherically resistant vegetation index (ARVI) before and after the prescribed burn, histograms and violin plots. (A,C): ARVI pre- and post-fire, respectively, of the adjacent control area. (B,D): ARVI pre- and post-fire, respectively, of the burned area.
Appendix B
Photographic records of the burned area, showing changes in tree structure. Recovery is visually evident in the first and second months after burning.

Figure A12.
Vegetation dynamics after a prescribed fire: (A) Pinus genus; (B) Junniperus genus; (C) burned soil; (D–F) Arbutus genus.
Appendix C
Appendix C.1. Metadata of the Generated RGB and Multispectral Ortho-Mosaics
The UAV was flown in order to obtain and subsequently process 180 aerial photographs of the study area. These were taken from an altitude of 50 m, with overlaps between the images and lines of 80 and 75%, respectively. The flights were performed on a sunny day, with suitable wind conditions (<25 kph) and at a mean temperature of 19 °C. The UAV used had a georeferencing system on board during the flight; the use of the real-time-kinematic (RTK) system was not necessary since the georeferencing system could attain vertical and horizontal location pressures of ±0.1 and ±0.3 m, respectively. For processing, we used a computer with an AMD Ryzen 3900x processor with 24 cores at 3.8 GHz, with an integrated NVIDIA Quadro p620 quad-core 2 GHz video card and 32 GB of RAM. This was used in a Linux operating system environment, based on the Ubuntu distribution Pop!_OS version 22.04 LTS. Images were processed and analyzed with photogrammetric procedures, using the open-source software OpenDroneMap (ODM version: 2.8.4; Cleveland Metroparks, OH, USA [23]). This software implements the algorithm structure from motion and multi-view stereo (SfM and MVS), producing 3D point clouds of 1000–20,000 points m−2. We used VisualSfM to achieve the 3D reconstruction, given its versatility in terms of reduced processing time. We then generated the RGB and multispectral orthomosaics. The digital surface (DSM) was generated, considering the maximum elevation values from the trees in a point cloud. Gaps in the point cloud were filled using the dem-gap fill-steps process and the local gridding method.
Appendix C.2. ODM Quality Report- Processed with ODM Version 2.8.0

Table A1.
Dataset Summary.
Table A1.
Dataset Summary.
| Date | 08/03/2022 at 02:37:07 |
| Area Covered | 0.004659 km2 |
| Processing Time | 6.0 m:9.0 s |
| Capture Start | 04/03/2022 at 09:11:40 |
| Capture End | 04/03/2022 at 09:14:58 |

Table A2.
Processing Summary.
Table A2.
Processing Summary.
| Reconstructed Images | 36 over 36 shots (100.0%) |
| Reconstructed Points (Sparse) | 22,092 over 22,610 points (97.7%) |
| Reconstructed Points (Dense) | 457,645 points |
| Average Ground Sampling Distance (GSD) | 2.9 cm |
| Detected Features | 10,262 features |
| Reconstructed Features | 1521 features |
| Geographic Reference | GPS |
| GPS errors | 0.91 m |

Table A3.
Dataset Summary.
Table A3.
Dataset Summary.
| Date | 08/03/2022 at 03:35:55 |
| Area Covered | 0.004511 km2 |
| Processing Time | 34.0 m:42.0 s |
| Capture Start | 04/03/2022 at 13:35:25 |
| Capture End | 04/03/2022 at 13:39:07 |

Table A4.
Processing Summary.
Table A4.
Processing Summary.
| Reconstructed Images | 36, over 36 shots (100.0%) |
| Reconstructed Points (Sparse) | 19621, over 19,993 points (98.1%) |
| Reconstructed Points (Dense) | 465,442 points |
| Average Ground Sampling Distance (GSD) | 2.8 cm |
| Detected Features | 10,321 features |
| Reconstructed Features | 1,576 features |
| Geographic Reference | GPS |
| GPS errors | 0.84 m |
References
- Furnas, B.J.; Goldstein, B.R.; Figura, P.J. Intermediate fire severity diversity promotes richness of forest carnivores in California. Divers. Distrib. 2022, 28, 493–505. [Google Scholar] [CrossRef]
- Turner, M.G.; Braziunas, K.H.; Hansen, W.D.; Hoecker, T.J.; Rammer, W.; Ratajczak, Z.; Westerling, A.L.; Seidl, R. The magnitude, direction, and tempo of forest change in Greater Yellowstone in a warmer world with more fire. Ecol. Monogr. 2022, 92, e01485. [Google Scholar] [CrossRef]
- Mansoor, S.; Farooq, I.; Kachroo, M.M.; Mahmoud, A.E.D.; Fawzy, M.; Popescu, S.M.; Alymeni, M.N.; Sonne, C.; Rinklebe, J.; Ahmad, P. Elevation in wildfire frequencies with respect to the climate change. J. Environ. Manag. 2022, 301, 113769. [Google Scholar] [CrossRef]
- Larson, A.J.; Jeronimo, S.M.; Hessburg, P.F.; Lutz, J.A.; Povak, N.A.; Cansler, C.A.; Kane, V.R.; Churchill, D.J. Tamm Review: Ecological principles to guide post-fire forest landscape management in the Inland Pacific and Northern Rocky Mountain regions. For. Ecol. Manag. 2022, 504, 119680. [Google Scholar] [CrossRef]
- Cardille, J.A.; Perez, E.; Crowley, M.A.; Wulder, M.A.; White, J.C.; Hermosilla, T. Multi-sensor change detection for within-year capture and labelling of forest disturbance. Remote Sens. Environ. 2022, 268, 112741. [Google Scholar] [CrossRef]
- Stefanidis, S.; Alexandridis, V.; Spalevic, V.; Mincato, R.L. Wildfire Effects on Soil Erosion Dynamics: The Case of 2021 Megafires in Greece. Agric. For. 2022, 68, 49–63. [Google Scholar] [CrossRef]
- Wilder, B.A.; Lancaster, J.T.; Cafferata, P.H.; Coe, D.B.; Swanson, B.J.; Lindsay, D.N.; Short, W.R.; Kinoshita, A.M. An analytical solution for rapidly predicting post-fire peak streamflow for small watersheds in southern California. Hydrol. Process. 2021, 35, e13976. [Google Scholar] [CrossRef]
- Stefanidis, S.; Alexandridis, V.; Mallinis, G. A cloud-based mapping approach for assessing spatiotemporal changes in erosion dynamics due to biotic and abiotic disturbances in a Mediterranean Peri-Urban forest. Catena 2022, 218, 106564. [Google Scholar] [CrossRef]
- Cadena, Z.D.A.; Flores, G.J.G.; Lomeli, Z.M.E.; Flores, R.A.G. Does the severity of a forest fire modify the composition, diversity and structure of temperate forests in Jalisco? Rev. Chapingo Ser. Cienc. For. 2022, 28, 1341. [Google Scholar] [CrossRef]
- Harris, R.C.; Kennedy, L.M.; Pingel, T.J.; Thomas, V.A. Assessment of Canopy Health with Drone-Based Orthoimagery in a Southern Appalachian Red Spruce Forest. Remote Sens. 2022, 14, 1341. [Google Scholar] [CrossRef]
- Jurado, J.M.; Ortega, L.; Cubillas, J.J.; Feito, F.R. Multispectral mapping on 3D models and multi-temporal monitoring for individual characterization of olive trees. Remote Sens. 2020, 12, 1106. [Google Scholar] [CrossRef]
- Näsi, R.; Honkavaara, E.; Lyytikäinen, S.P.; Blomqvist, M.; Litkey, P.; Hakala, T.; Vijanen, N.; Kantola, T.; Tanhuanpää, T.; Holopainen, M. Using UAV-based photogrammetry and hyperspectral imaging for mapping bark beetle damage at tree-level. Remote Sens. 2015, 7, 15467–15493. [Google Scholar] [CrossRef]
- Touhami, I.; Moutahir, H.; Assoul, D.; Bergaoui, K.; Aouinti, H.; Bellot, J.; Andreu, J.M. Multi-year monitoring land surface phenology in relation to climatic variables using MODIS-NDVI time-series in Mediterranean forest, Northeast Tunisia. Acta Oecol. 2022, 114, 103804. [Google Scholar] [CrossRef]
- Zelený, J.; Mercado, B.D.; Müller, F. Towards the evaluation of regional ecosystem integrity using NDVI, brightness temperature and surface heterogeneity. Sci. Total Environ. 2021, 796, 148994. [Google Scholar] [CrossRef]
- Spruce, J.P.; Hicke, J.A.; Hargrove, W.W.; Grulke, N.E.; Meddens, A.J.H. Use of MODIS NDVI Products to Map Tree Mortality Levels in Forests Affected by Mountain Pine Beetle Outbreaks. Forests 2019, 10, 811. [Google Scholar] [CrossRef]
- Kahaer, Y.; Shi, Q.; Shi, H.; Peng, L.; Abudureyimu, A.; Wan, Y.; Li, H.; Zhang, W.; Yang, N. What Is the Effect of Quantitative Inversion of Photosynthetic Pigment Content in Populus euphratica Oliv. Individual Tree Canopy Based on Multispectral UAV Images? Forests 2022, 13, 542. [Google Scholar] [CrossRef]
- Talucci, A.C.; Forbath, E.; Kropp, H.; Alexander, H.D.; DeMarco, J.; Paulson, A.K.; Loranty, M.M. Evaluating post-fire vegetation recovery in Cajander Larch Forests in Northeastern Siberia using UAV derived vegetation indices. Remote Sens. 2020, 12, 2970. [Google Scholar] [CrossRef]
- Pompa, G.M.; Hevia, A.; Camarero, J.J. Minimum and maximum wood density as proxies of water availability in two Mexican pine species coexisting in a seasonally dry area. Trees 2021, 35, 597–607. [Google Scholar] [CrossRef]
- Molina, J.R.; Ortega, M.; Rodriguez, S.F. Scorch height and volume modeling in prescribed fires: Effects of canopy gaps in Pinus pinaster stands in Southern Europe. For. Ecol. Manag. 2022, 506, 119979. [Google Scholar] [CrossRef]
- Gowravaram, S.; Chao, H.; Zhao, T.; Parsons, S.; Hu, X.; Xin, M.; Flanagan, H.; Tian, P. Prescribed grass fire evolution mapping and rate of spread measurement using orthorectified thermal imagery from a fixed-wing UAS. Int. J. Remote Sens. 2022, 43, 2357–2376. [Google Scholar] [CrossRef]
- Schwarm, K.; Nair, A.P.; Wei, C.; Spearrin, R.M.; Ozen, E.; Gonzalez, E.; Kriesel, J. Three-dimensional real-time mapping of CO and CO2 concentrations in active forest burns with a UAV spectrometer. In Proceedings of the AIAA SCITECH 2022 Forum, San Diego, CA, USA, 3–7 January 2022; p. 2291. [Google Scholar] [CrossRef]
- Carrà, B.G.; Bombino, G.; Lucas, B.M.E.; Plaza, A.P.A.; D’Agostino, D.; Zema, D.A. Prescribed fire and soil mulching with fern in Mediterranean forests: Effects on surface runoff and erosion. Ecol. Eng. 2022, 176, 106537. [Google Scholar] [CrossRef]
- González, E.M.S.; González, E.M.; Tena, F.J.A.; Ruacho, G.L.; López, E.I.L. Vegetación de la sierra madre occidental, México: Una síntesis. Acta Botánica Mex. 2012, 100, 351–403. [Google Scholar] [CrossRef]
- García, G.S.A.; Narváez, F.R.; Olivas, G.J.M.; Hernández, S.J. Diversidad y estructura vertical del bosque de pino-encino en Guadalupe y Calvo, Chihuahua. Rev. Mex. de Cienc. For. 2019, 10, 41–63. [Google Scholar] [CrossRef]
- Cruz, P.C.; Juárez, W.S.; Santiago, D.M.; Santiago, O.L.C.; Silva, E.R.P.; Calderón, O.A.A. Combustibles forestales y susceptibilidad a incendios de un bosque templado en la mixteca alta, Oaxaca, México. For. Veracruzana 2018, 20, 9–14. [Google Scholar]
- DJI P4 Multispectral Specs. Available online: https://www.dji.com/p4-multispectral/specs (accessed on 27 August 2022).
- OpenDroneMap/ODM. Available online: https://github.com/OpenDroneMap/ODM (accessed on 22 August 2022).
- Dallal, G.E.; Wilkinson, L. An analytic approximation to the distribution of Lilliefors’s test statistic for normality. Am. Stat. 1986, 40, 294–296. [Google Scholar] [CrossRef]
- Tomczak, M.; Tomczak, E. The need to report effect size estimates revisited. An overview of some recommended measures of effect size. Trends Sport Sci. 2014, 1, 19–25. [Google Scholar]
- Pohlert, T. The pairwise multiple comparison of mean ranks package (PMCMR). R Package 2014, 27, 9. [Google Scholar]
- Gaddis, G.M.; Gaddis, M.L. Introduction to biostatistics: Part 5, Statistical inference techniques for hypothesis testing with nonparametric data. Ann. Emerg. Med. 1990, 19, 1054–1059. [Google Scholar] [CrossRef]
- Pusev, R.; Gavrilov, I. Package “normtest”. Tests for Normality. 2014. Available online: https://dspace.spbu.ru/bitstream/11701/1021/1/normtest%20manual.pdf (accessed on 9 October 2022).
- Carvajal, R.F.; Marques da Silva, J.R.; Agüera, V.F.; Martínez, C.P.; Serrano, J.; Moral, F.J. Evaluation of fire severity indices based on pre-and post-fire multispectral imagery sensed from UAV. Remote Sens. 2019, 11, 993. [Google Scholar] [CrossRef]
- Pérez, R.L.A.; Quintano, C.; Marcos, E.; Suarez, S.S.; Calvo, L.; Fernández, M.A. Evaluation of prescribed fires from unmanned aerial vehicles (UAVs) imagery and machine learning algorithms. Remote Sens. 2020, 12, 1295. [Google Scholar] [CrossRef]
- Reich, P.B.; Abrams, M.D.; Ellsworth, D.S.; Kruger, E.L.; Tabone, T.J. Fire affects ecophysiology and community dynamics of central Wisconsin oak forest regeneration. Ecology 1990, 71, 2179–2190. [Google Scholar] [CrossRef]
- Wallin, K.F.; Kolb, T.E.; Skov, K.R.; Wagner, M.R. Effects of crown scorch on ponderosa pine resistance to bark beetles in northern Arizona. Environ. Entomol. 2003, 32, 652–661. [Google Scholar] [CrossRef]
- Valor, T.; González, O.J.R.; Piqué, M. Assessing the impact of prescribed burning on the growth of European pines. For. Ecol. Manag. 2015, 343, 101–109. [Google Scholar] [CrossRef]
- Valor, T.; Ormeño, E.; Casals, P. Temporal effects of prescribed burning on terpene production in Mediterranean pines. Tree Physiol. 2017, 37, 1622–1636. [Google Scholar] [CrossRef] [PubMed]
- Bär, A.; Michaletz, S.T.; Mayr, S. Fire effects on tree physiology. New Phytol. 2019, 223, 1728–1741. [Google Scholar] [CrossRef] [PubMed]
- Bonanomi, G.; Idbella, M.; Abd, E.A.M.; Motti, R.; Ippolito, F.; Santorufo, L.; Adamo, P.; Agrelli, D.; De Marco, A.; Maisto, G.; et al. Impact of prescribed burning, mowing and abandonment on a Mediterranean grassland: A 5-year multi-kingdom comparison. Sci. Total Environ. 2022, 834, 155442. [Google Scholar] [CrossRef]
- D. O. de la Federación, Norma Oficial Mexicana NOM-015-Semarnat/Sagarpa-2007. Que establece las especificaciones técnicas de métodos de uso del fuego en los terrenos forestales y en los terrenos de uso agropecuario, 2009, 1–15. Available online: https://www.gob.mx/profepa/documentos/norma-oficial-mexicana-nom-015-semarnat-sagarpa-2007 (accessed on 10 September 2022).
- Kerns, B.K.; Day, M.A. Prescribed fire regimes subtly alter ponderosa pine forest plant community structure. Ecosphere 2018, 9, e02529. [Google Scholar] [CrossRef]
- Trejo, R.; Arturo, D. Incendios de Vegetación. Su Ecología, Manejo e Historia; Colegio de Postgraduados, Universidad Autónoma Chapingo: Guadalajara, Jalisco, México, 2014; p. 891. [Google Scholar]
- Westlind, D.J.; Kerns, B.K. Repeated fall prescribed fire in previously thinned Pinus ponderosa increases growth and resistance to other disturbances. For. Ecol. Manag. 2021, 480, 118645. [Google Scholar] [CrossRef]
- Scott, K.; Setterfield, S.A.; Douglas, M.M.; Parr, C.L.; Schatz, J.O.N.; Andersen, A.N. Does long-term fire exclusion in an Australian tropical savanna result in a biome shift? A test using the reintroduction of fire. Austral Ecol. 2012, 37, 693–711. [Google Scholar] [CrossRef]
- Harper, A.R.; Doerr, S.H.; Santin, C.; Froyd, C.A.; Sinnadurai, P. Prescribed fire and its impacts on ecosystem services in the UK. Sci. Total Environ. 2018, 624, 691–703. [Google Scholar] [CrossRef]
- Silva, G.E.; Aguirre, C.O.A.; Treviño, G.E.J.; Alanís, R.E.; Corral, R.J.J. Efecto de tratamientos silvícolas en la diversidad y estructura forestal en bosques templados bajo manejo en Durango, México. Madera Y Bosques 2021, 27, 1–14. [Google Scholar] [CrossRef]
- De Moura, M.L.; Galvão, L.S. Smoke effects on NDVI determination of savannah vegetation types. Int. J. Remote Sens. 2003, 24, 4225–4231. [Google Scholar] [CrossRef]
- Kobayashi, H.; Dye, D.G. Atmospheric conditions for monitoring the long-term vegetation dynamics in the Amazon using normalized difference vegetation index. Remote Sens. Environ. 2005, 97, 519–525. [Google Scholar] [CrossRef]
- Moran, C.J.; Hoff, V.; Parsons, R.A.; Queen, L.P.; Seielstad, C.A. Mapping Fine-Scale Crown Scorch in 3D with Remotely Piloted Aircraft Systems. Fire 2022, 5, 59. [Google Scholar] [CrossRef]
- Ramos, R.M.P.; Albán, V.D.O.; Jiménez, G.A.; Mero, J.O.F.; Ganchozo, Q.M.T. Planificación de una quema prescrita en una plantación de Tectona grandis Linn F. Rev. Cuba. de Cienc. For. 2018, 6, 184–194. [Google Scholar]
- Zhitao, Z.; Lan, Y.; Pute, W.; Wenting, H. Model of soybean NDVI change based on time series. Int. J. Agric. Biol. Eng. 2014, 7, 64–70. [Google Scholar]
- Sakamoto, T.; Shibayama, M.; Takada, E.; Inoue, A.; Morita, K.; Takahashi, W.; Miura, S.; Kimura, A. Detecting seasonal changes in crop community structure using day and night digital images. Photogramm. Eng. Remote Sens. 2010, 76, 713–726. [Google Scholar] [CrossRef]
- Maurya, A.K.; Singh, D.; Singh, K.P. Development of fusion approach for estimation of vegetation fraction cover with drone and sentinel-2 data. In Proceedings of the IGARSS 2018—2018 IEEE International Geoscience and Remote Sensing Symposium, Valencia, Spain, 22–27 July 2018; pp. 7448–7451. [Google Scholar] [CrossRef]
- Belgiu, M.; Drăguţ, L. Random Forest in remote sensing: A review of applications and future directions. ISPRS J. Photogramm. Remote Sens. 2016, 114, 24–31. [Google Scholar] [CrossRef]
Publisher’s Note: MDPI stays neutral with regard to jurisdictional claims in published maps and institutional affiliations. |
© 2022 by the authors. Licensee MDPI, Basel, Switzerland. This article is an open access article distributed under the terms and conditions of the Creative Commons Attribution (CC BY) license (https://creativecommons.org/licenses/by/4.0/).