Article

SLAF-Seq Technology-Based Genome-Wide Association and Population Structure Analyses of Ancient Camellia sinensis (L.) Kuntze in Sandu County, China

1
The Key Laboratory of Plant Resources Conservation and Germplasm Innovation in Mountainous Region (Ministry of Education), College of Tea Sciences, Guizhou University, Guiyang 550025, China
2
College of Life Sciences, Guizhou University, Guiyang 550025, China
*
Author to whom correspondence should be addressed.
These authors contributed equally to this work.
Forests 2022, 13(11), 1885; https://doi.org/10.3390/f13111885
Submission received: 20 September 2022 / Revised: 3 November 2022 / Accepted: 3 November 2022 / Published: 10 November 2022
(This article belongs to the Section Genetics and Molecular Biology)

Abstract

:
Guizhou is one of the centers of origin for the tea plant (Camellia sinensis (L.) Kuntze). The location contains highly diverse ancient tea plant germplasms in its Sandu Aquarium Autonomous County. After a prolonged course of continuous evolution, these ancient plants have gained a wealth of genetic diversity. Their resources could be harnessed for the selection and breeding of fine varieties of tea plant, as well as for the effective utilization and protection of germplasm resources. In this study, the specific locus-amplified fragment (SLAF) sequencing method was used to analyze the population structure and conduct a genome-wide association study (GWAS) for the three traits of 125 ancient tea plants in the Sandu County of Guizhou province, China. A total of 807,743 SLAF tags and 9,428,309 population single-nucleotide polymorphism (SNP) tags were obtained. The results of the phylogenetic tree analysis, cluster analysis, and principal component analysis showed that 125 germplasms were clustered into four groups, and the heterozygosity rates for groups I, II, III, and IV, were 0.211, 0.504, 0.144, and 0.192, respectively. Additionally, GWAS analysis suggested that seven candidate genes were related to altitude at the origin of the plants, eight were related to tree shape, and three were associated with leaf color. In this study, we clarified genetic relationships between four ancient tea plant-producing areas in Sandu County and obtained candidate genes related to their development associated with altitude, tree shape, and leaf color. The study provides useful information for tea plant-breeding development and molecular identification.

1. Introduction

The tea plant (Camellia sinensis (L.) O. Kuntze) is China’s most important woody economic crop. Guizhou is one of the centers of origin of the tea plant [1]. Ancient tea plant germplasm refers to a tea tree that is more than 100 years old [2]. Sandu Aquarium Autonomous County, Guizhou, China, is known to be rich in diversity of ancient tea plant germplasms. This county is located on the Yunnan-Guizhou Plateau, where geographical factors such as high altitude and lower latitude, as well as environmental conditions associated with low sunshine, provide a suitable habitat for the ancient germplasm of the tea plant [3]. After a prolonged evolution, these ancient tea plants might have retained some unique biochemical components and several desirable genes, such as tolerance to drought and cold, as well as resistance to diseases and insects. Therefore, these are important genetic resources of the tea plant and a treasure house for the development of new tea products, and they have high scientific, cultural, and economic value [4]. Ancient tea plants are often conserved and enriched through germplasm resource identification and variety selection. However, traditional classification and identification methods have not been sufficient to advance the research and development of these plant resources due to their complex genetic background, including frequent modification of traits associated with long-term genetic hybridization. With the development of molecular markers such as RAPD [5], RFLP [6], AFLP [7], SSR [8], ISSR [9], and EST-SSR [10], rapid progress is reflected in germplasm resources and the varietal identification of tea, as well as assessment of their genetic diversity, relationship, and evolution.
Specific-locus amplified fragment sequencing (SLAF-seq) is a simplified and effective genome sequencing technology that utilizes bioinformatics to analyze a reference genome and design a suitable enzymatic cleavage scheme. In the process, SLAF libraries are constructed according to the digestion scheme. SLAF fragments of a specific length are selected for sequencing, and the information obtained from sequencing is compared with the reference genome to develop a large number of single-nucleotide polymorphism (SNP) sites with high stability and specificity [11]. SLAF-seq is cost-effective and offers the advantages of high throughput with precision and a short cycle time [12]. This technique has been widely used in genetic diversity analysis [13,14], high-density genetic map construction, and germplasm resource identification [15,16,17]. In this context, genome-wide association studies (GWASs) perform control or association analyses using a large number of SNPs to screen genetic variants that are most likely to affect a trait at the genome-wide level, followed by mining the genes associated with the trait variation. Many important functional genes have been screened in Camellia sinensis [4,18], Oryza sativa L. [19,20], Hordeum vulgare L. [21,22], Vitis vinifera L. [23,24], Picea crassifolia Kom. [25], and Glycine max (Linn.) Merr [26,27], using the molecular markers developed by SLAF-seq for GWAS analysis.
The tea plant’s genomes are characterized by weak self-compatibility, high heterozygosity, and large size. However, screening and functional analysis of the genes related to important agronomic traits in tea plants are rather limited so far. This study used the SLAF-seq technology to analyze the phylogeny and population structure of 125 ancient tea plants from four ancient tea-producing areas in Sandu County, including Zenya, Yangmeng, Guqi, and Landong Village. The obtained SNPs were further used for GWAS analysis of ancient tea plant-related traits. The study provides a necessary framework for revealing ancient tea plants’ genetic basis and molecular mechanisms of important traits. A reference for the identification of germplasm resources is also obtained, together with a basis for the selection of the varieties of ancient tea plants.

2. Materials and Methods

2.1. Plant Material and Phenotypic Statistics

A total of 125 individual plants were selected from the groups identified as ancient tea plants by forestry staff in Sandu County. Tender buds with one bud and one leaf or one bud and two leaves were picked and placed in a self-sealed bag and then filled with dried silica gel. The fifth mature and fully developed leaf of the germplasm of each ancient tea plant was collected and brought to the laboratory for assessing phenotypic characterization statistics. Meanwhile, three traits were recorded, including altitude at origin, tree shape, and leaf color, from these 125 ancient tea plants. According to the “Tea Germplasm Resources Description Specification and Data Standard” [28], the tea plant type includes shrubs, trees and small trees, and the leaf color, which is divided into dark green, green, yellow-green, etc. The height of shrub-type tea plants is between 1.0–3.0 m, the tree-type tea plants are more than 6 m high, and the small tree-type tea plants are between them. According to China’s macro-geomorphic zoning scheme [29], altitudes are generally divided into five categories: low altitude (<1000 m), medium altitude (1000–2000 m), middle-high altitude (2000–4000 m), high altitude (4000–6000 m), and very high altitude (>6000 m). This experiment used the ancient tea plants from Pu’an County, TuanShan County, SanQiao County, Dejiang Village, and ShiPing Village as external reference tea plants. Experiments were carried out at the Tea College of Guizhou University and the Crop Germplasm Resource Center, Institute of Agricultural Bioengineering, Guizhou University (Guizhou, China).

2.2. DNA Isolation

Genomic DNA from 125 tea samples was extracted by CTAB using the following procedure: (1) 0.5 g fresh tea leaves were placed into a 2 mL centrifuge tube, frozen with liquid nitrogen, and ground with a ball mill. (2) One milliliter of CTAB extract was pre-heated to 65 °C and added with 2% mercaptoethanol. The mixture was shaken and mixed on a vortex oscillator to suspend the sample completely. (3) The sample was placed in a 65 °C oven warm bath for 40–60 min, shaken well 2–3 times during the warm bath, and later cooled down to room temperature. It was then centrifuged at 12,000 rpm for 5 min. An amount of 900 µL supernatant was added to a new 2 mL sterile centrifuge tube with an equal volume of chloroform/isoamyl alcohol (24:1), mixed by inverting the centrifuge tube several times, and centrifuged at 12,000 rpm for 20 min. (4) An amount of 700 µL of supernatant was collected into a new 2-mL sterile centrifuge tube, and an equal volume of chloroform isoamyl alcohol (24:1) was added, mixed by inverting the centrifuge tube several times, and centrifuged at 12000 rpm for 20 min. Then, 450 µL of supernatant was collected in a new 1.5 mL sterile centrifuge tube and mixed with 300 µL isopropanol and 45 µL of 3M sodium acetate, mixed well, and placed at −20 °C for 1 h. (5) The tube was centrifuged at 12,000 rpm for 10 min, and the supernatant was discarded. The tube was instantaneously centrifuged again, and excess liquid at the gun head was discarded. (6) One milliliter of 75% ethanol solution was added to the precipitation and flicked until the precipitation was suspended. It was then centrifuged at 12,000 rpm for 5 min, and the supernatant was discarded. (7) Instantaneous centrifugation was performed, the gun head was absorbed and the excess liquid discarded, and the centrifuge tube was opened and dried at room temperature for 3-5 min until the DNA precipitation was translucent. (8) An appropriate amount of ultrapure water containing 10 ng/µL RNaseA was added to dissolve the DNA precipitation. (9) DNA concentration and purity were determined by a nanodrop spectrophotometer (Thermo Scientific, Waltham, MA, USA) and stored in a −20 °C refrigerator as a standby [30].

2.3. SLAF-Seq Library Construction and High-Throughput Sequencing

Through the tea plant reference genome (ftp://ftp.ncbi.nlm.nih.gov/genomes/all/GCF/004/153/795/GCF_004153795.1_AHAU_CSS_1/, accessed on 15 April 2019), the electronic restriction enzyme digestion scheme was predicted by restriction digest method, and the HaeIII + EcoRV-HF® (Biomarker Biotechnology Co., Ltd., Beijing, China) enzyme digestion was selected. The genomic DNA of the tea plants was digested with a restriction endonuclease, and sequences of 364–394 bp length were defined as SLAF tags. The 3′-end of the enzyme slice was sequentially added with Poly(A), ligated with a dual-index adapter, and polymerase chain reaction amplification, purification, sample mixing, and gel cutting were used to select the target fragments to construct the SLAF-seq library [31]. Illumina HiSeq X Ten system was used for paired-end sequencing. Oryza sativa ssp. japonica (http://rapdb.dna.affrc.go.jp/, accessed on 2 June 2019) was selected as a control for sequencing to evaluate the accuracy of the digestion experiment. This part was assigned to Biomarker Biotechnology Co., Ltd., Beijing, China.

2.4. SNPs Development

Biomarker Biotechnology Co., Ltd. used the BWA-MEMM method of the BWA software (ver.0.7.15, Illumina, Inc., San Diego, CA, USA) [32] to compare the reads obtained by sequencing with the tea reference genome. GATK (ver.3.8, Illumina, Inc., San Diego, CA, USA) [33] and SAMTOOLs software (ver.1.4, Illumina, Inc., San Diego, CA, USA) [34] were used to develop SNPs. The SNPs intersection obtained by these two methods was used as the final reliable SNPs dataset. To annotate SNPs results, the company used SnpEff software (ver.4.3i, Illumina, Inc., San Diego, CA, USA) [35].

2.5. Phylogenetic and Population Structure Analyses

Based on the obtained SNPs, the clustering of 125 samples was analyzed using Admixture software (ver.1.22, Illumina, Inc., San Diego, CA, USA) [36]. The number of clusters (K) was predefined as 1–10, and the clustering results were cross-validated. We determined an optimal number of clusters based on the value of the cross-validation error rate.
Based on the neighborhood connection method and using MEGA X software (MEGA X, Molecular Evolutionary Genetics Analysis, State College, PA, USA) [37], the Kimura 2-parameter model was used, and the bootstrap was repeated 1000 times to construct the phylogenetic tree of each sample. Principal component analysis (PCA) was carried out by EIGENSOFT software (ver.6.0, Harvard Genetics Department and the Broad Institute, Cambridge, MA, USA) [38] to obtain the clustering of 125 ancient tea plants.

2.6. Genome-Wide Association Analysis

The association analysis of the traits was carried out using GEMMA (The National Institutes of Health, Maryland, MD, USA) [39], FaST-LMM (Microsoft Research, Los Angeles, CA, USA) [40], and EMMAX (Center for Statistical Genetics, Los Angeles, CA, USA) [41] software. The p-value of each SNP locus was obtained, and the SNP loci with a p-value < 10−6 were defined as significant associations. The mixed linear model formula of GEMMA software is y = Wα + xβ + µ + e. Here, the genetic relationship µ between samples calculated by GEMMA software is used as a random effect. If there is a covariate, the covariate W is used as a fixed effect, X is the genotype, and Y is referred to as the phenotype. Therefore, each variation locus can obtain an association result.

3. Results

3.1. Descriptive Statistics of Ancient Tea Plant Traits

The traits of 125 ancient tea plant samples were statistically analyzed. There were six phenotypes of tree shape and leaf color (Figure 1). The leaf colors were divided into yellow-green (21.6%), green (38.4%), and dark green (40.0%). The tree shapes were mainly tree-type (48.9%) and shrub-type (37.5%), and a few were small tree-type (13.6%). Most of the tea plants (62.4%) were located in low-altitude areas below 1000 m, and the rest (37.6%) were located in middle-altitude areas between 1000–2000 m (Table 1).

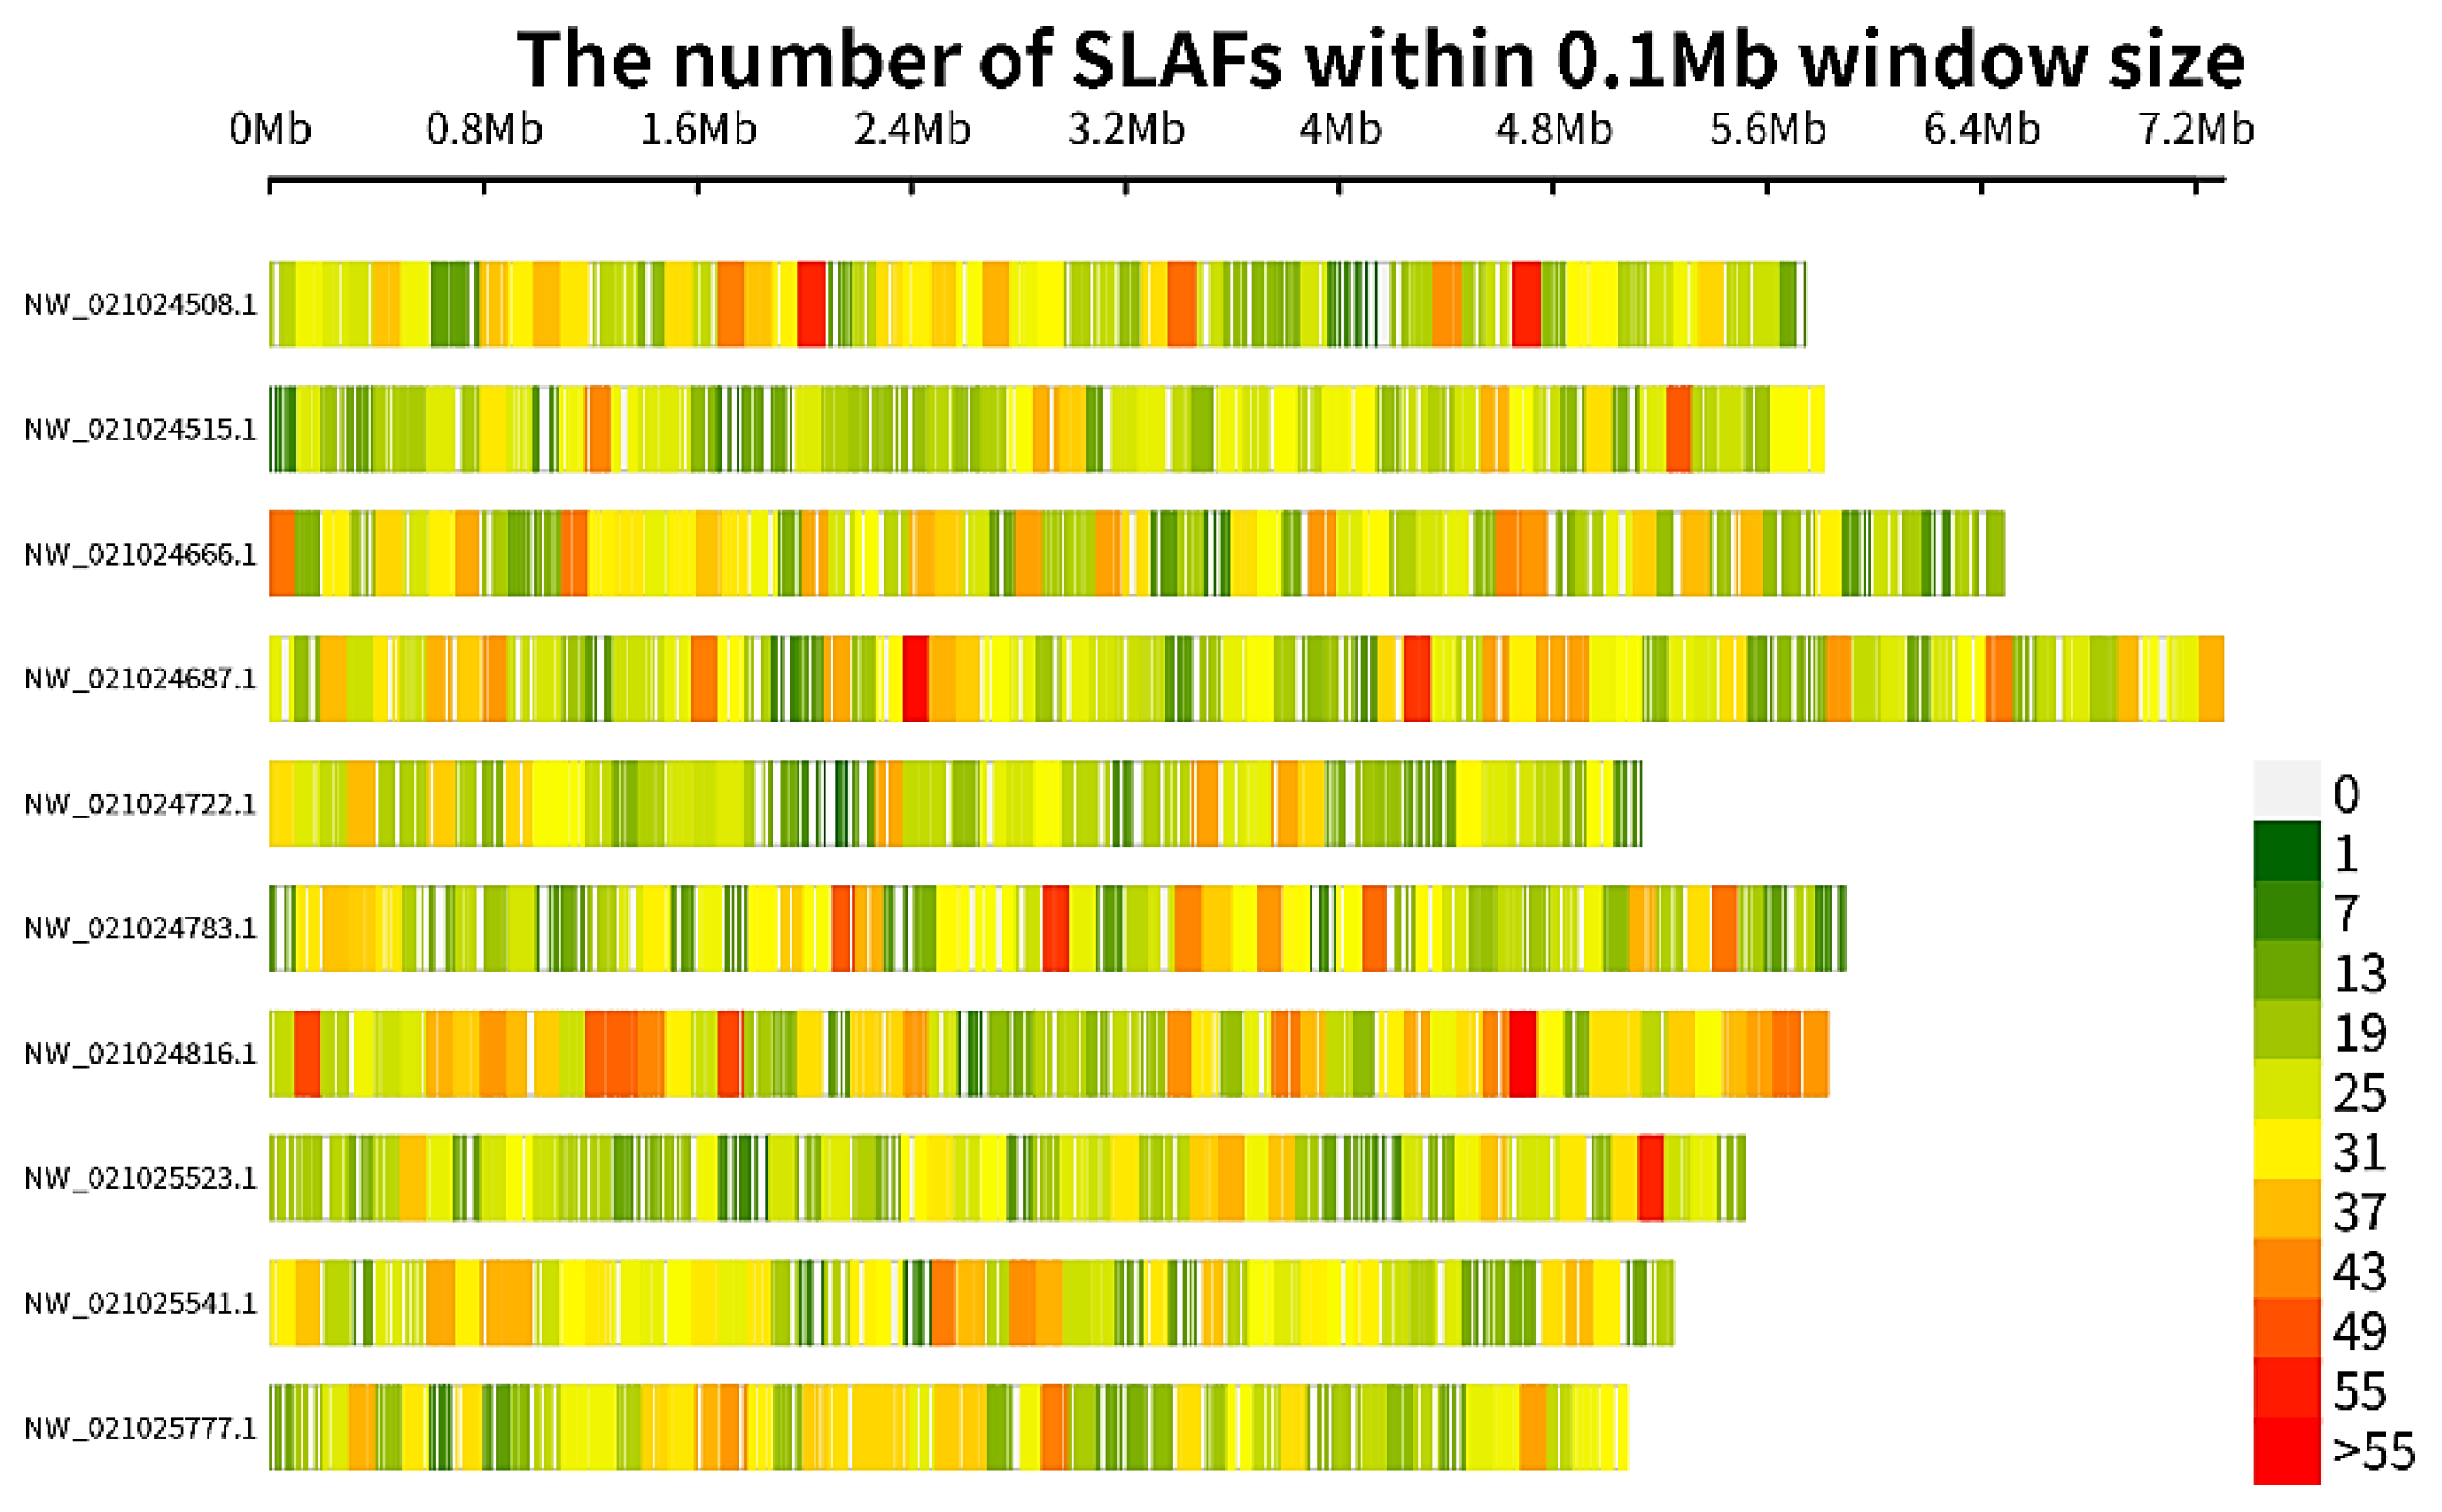
3.2. SLAF-Seq and SNPs

A total of 352.33 MB of reading data were obtained by sequencing; the base-calling accuracy (Q score > 30) was 93.53%, and the average GC content was 43.27%. After comparison, 807,743 SLAF were obtained, out of which 716,810 were polymorphic SLAF tags, with an average polymorphism rate of 88.74% and an average sequencing depth of 10.16×. SLAF tags in each ancient tea sample ranging from 137,364 to 257,487. The distribution map of SLAF tags on some chromosomes (Figure 2) revealed a uniform distribution pattern.
According to the alignment of the sequence between the reads and the reference genome of the tea plant, a total of 9,428,309 population SNPs were detected, with an average heterozygosity of 5.82%. The number of SNPs in each tea plant ranged from 2,418,538 to 4,167,257. Furthermore, the SNPs distribution map on the part of the chromosomes (Figure 3) showed that the SNPs were uniformly distributed on the chromosomes.

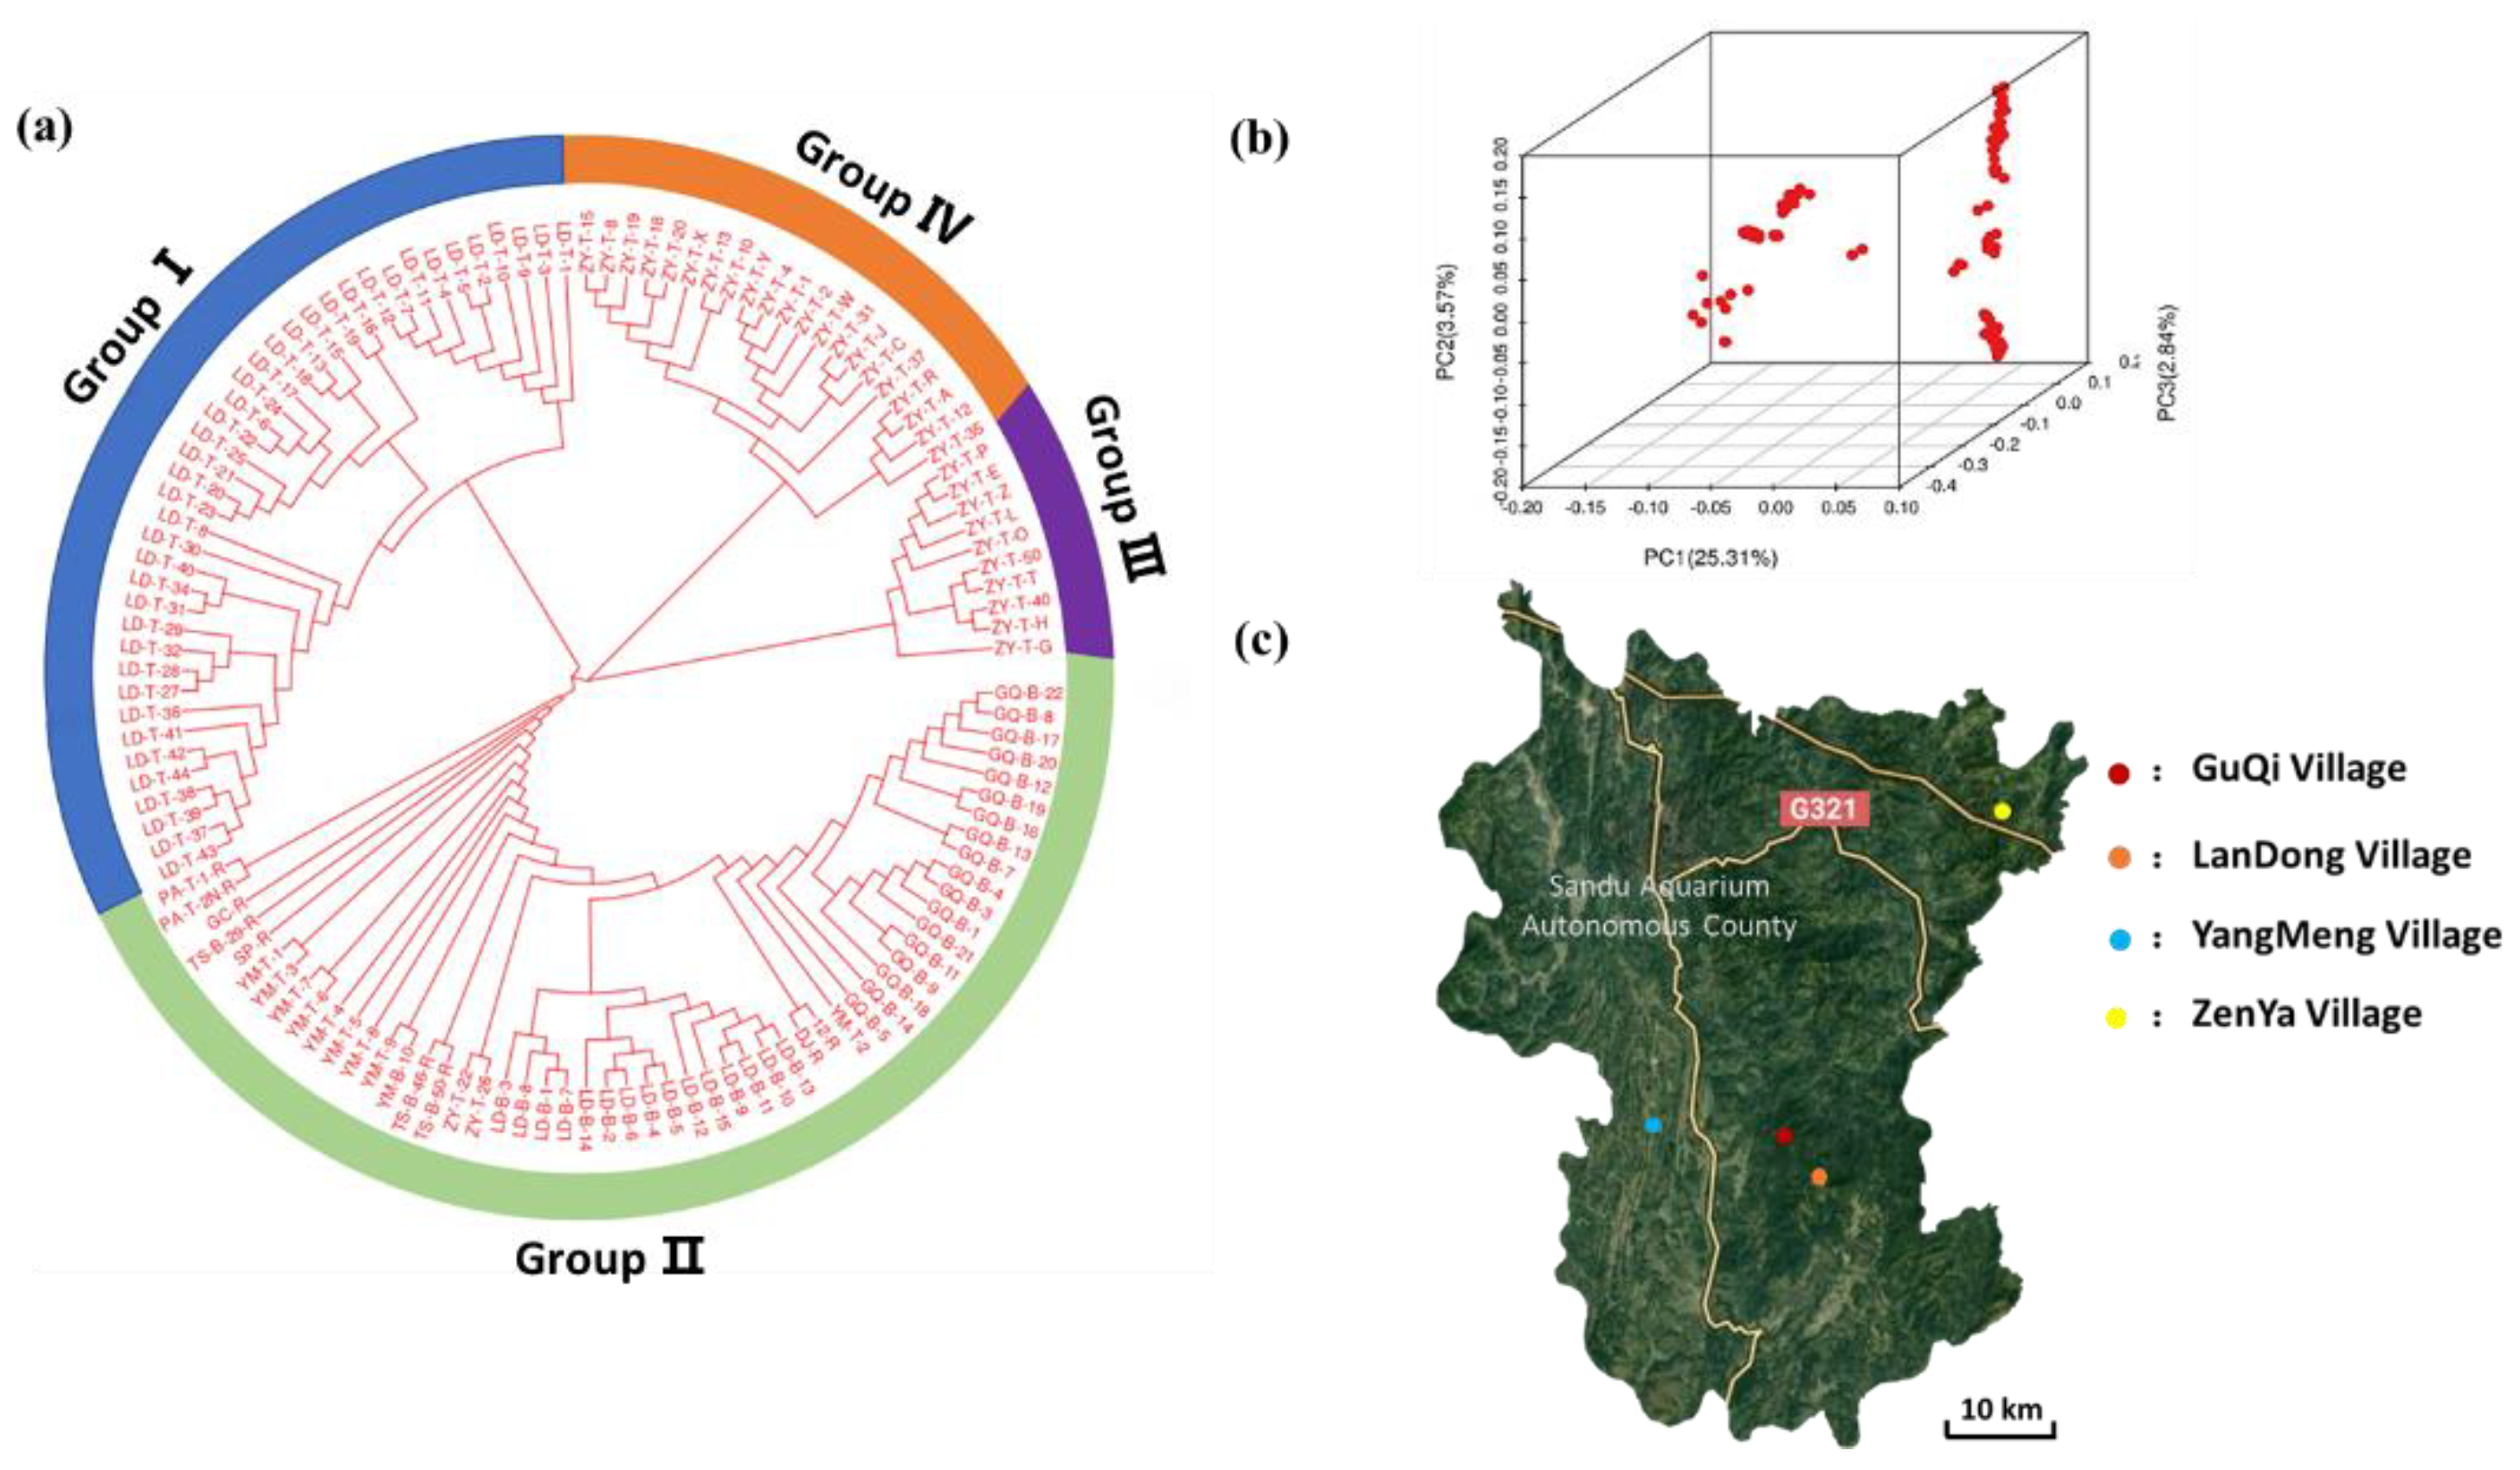
3.3. Population Structure Analyses

A total of 125 ancient tea plants were analyzed by population structure analysis, where several subgroups (K value) were pre-set as 1–10 (Figure 4a). The results showed that when K = 4, CV is the lowest (Figure 4b), indicating that 125 tea plants should be divided into four groups. This finding was consistent with the results of phylogenetic tree analysis (Figure 5a) and PCA analysis (Figure 5b).
The heterozygosity rates of groups I, II, III, and IV were 0.211, 0.504, 0.144, and 0.192, respectively. The heterozygosity rate of group III (including 10 ancient tea plants) was the lowest, and the heterozygosity of group I (including 40 ancient tea plants) was similar to that of group IV (including 21 ancient tea plants), indicating that the genetic diversity within the two groups was similar and both were low. Group II (containing 54 ancient tea plants) had the highest heterozygosity, indicating a high genetic diversity within the group. The results of the phylogenetic tree analysis (Figure 5a) showed that 40 ancient tea plants from Landong (LD) constituted group I, and 21 ancient tea plants from Zenya (ZY) were clustered into group IV. All 18 ancient tea plants from Guqi (GQ), ten from Yangmeng (YM), 15 plants from Landong (LD), two from Zenya (ZY), and nine external reference tea plants constituted group II. Ten ancient tea plants from Zenya (ZY) were clustered into group III. These results were consistent with the PCA results (Figure 5b).
The analysis of four ancient tea plant production areas suggested average heterozygosity values of GQ, LD, YM, and ZY as 0.125, 0.153, 0.177, and 0.144, respectively. All of these were lower than their average expected heterozygosity values, which indicated an inbreeding phenomenon in the ancient tea population to a certain extent, resulting in excess homozygotes. Furthermore, the level of genetic diversity of ancient tea populations in LD and YM production areas was higher, whereas that in the GQ production area was the lowest (Figure 5c).

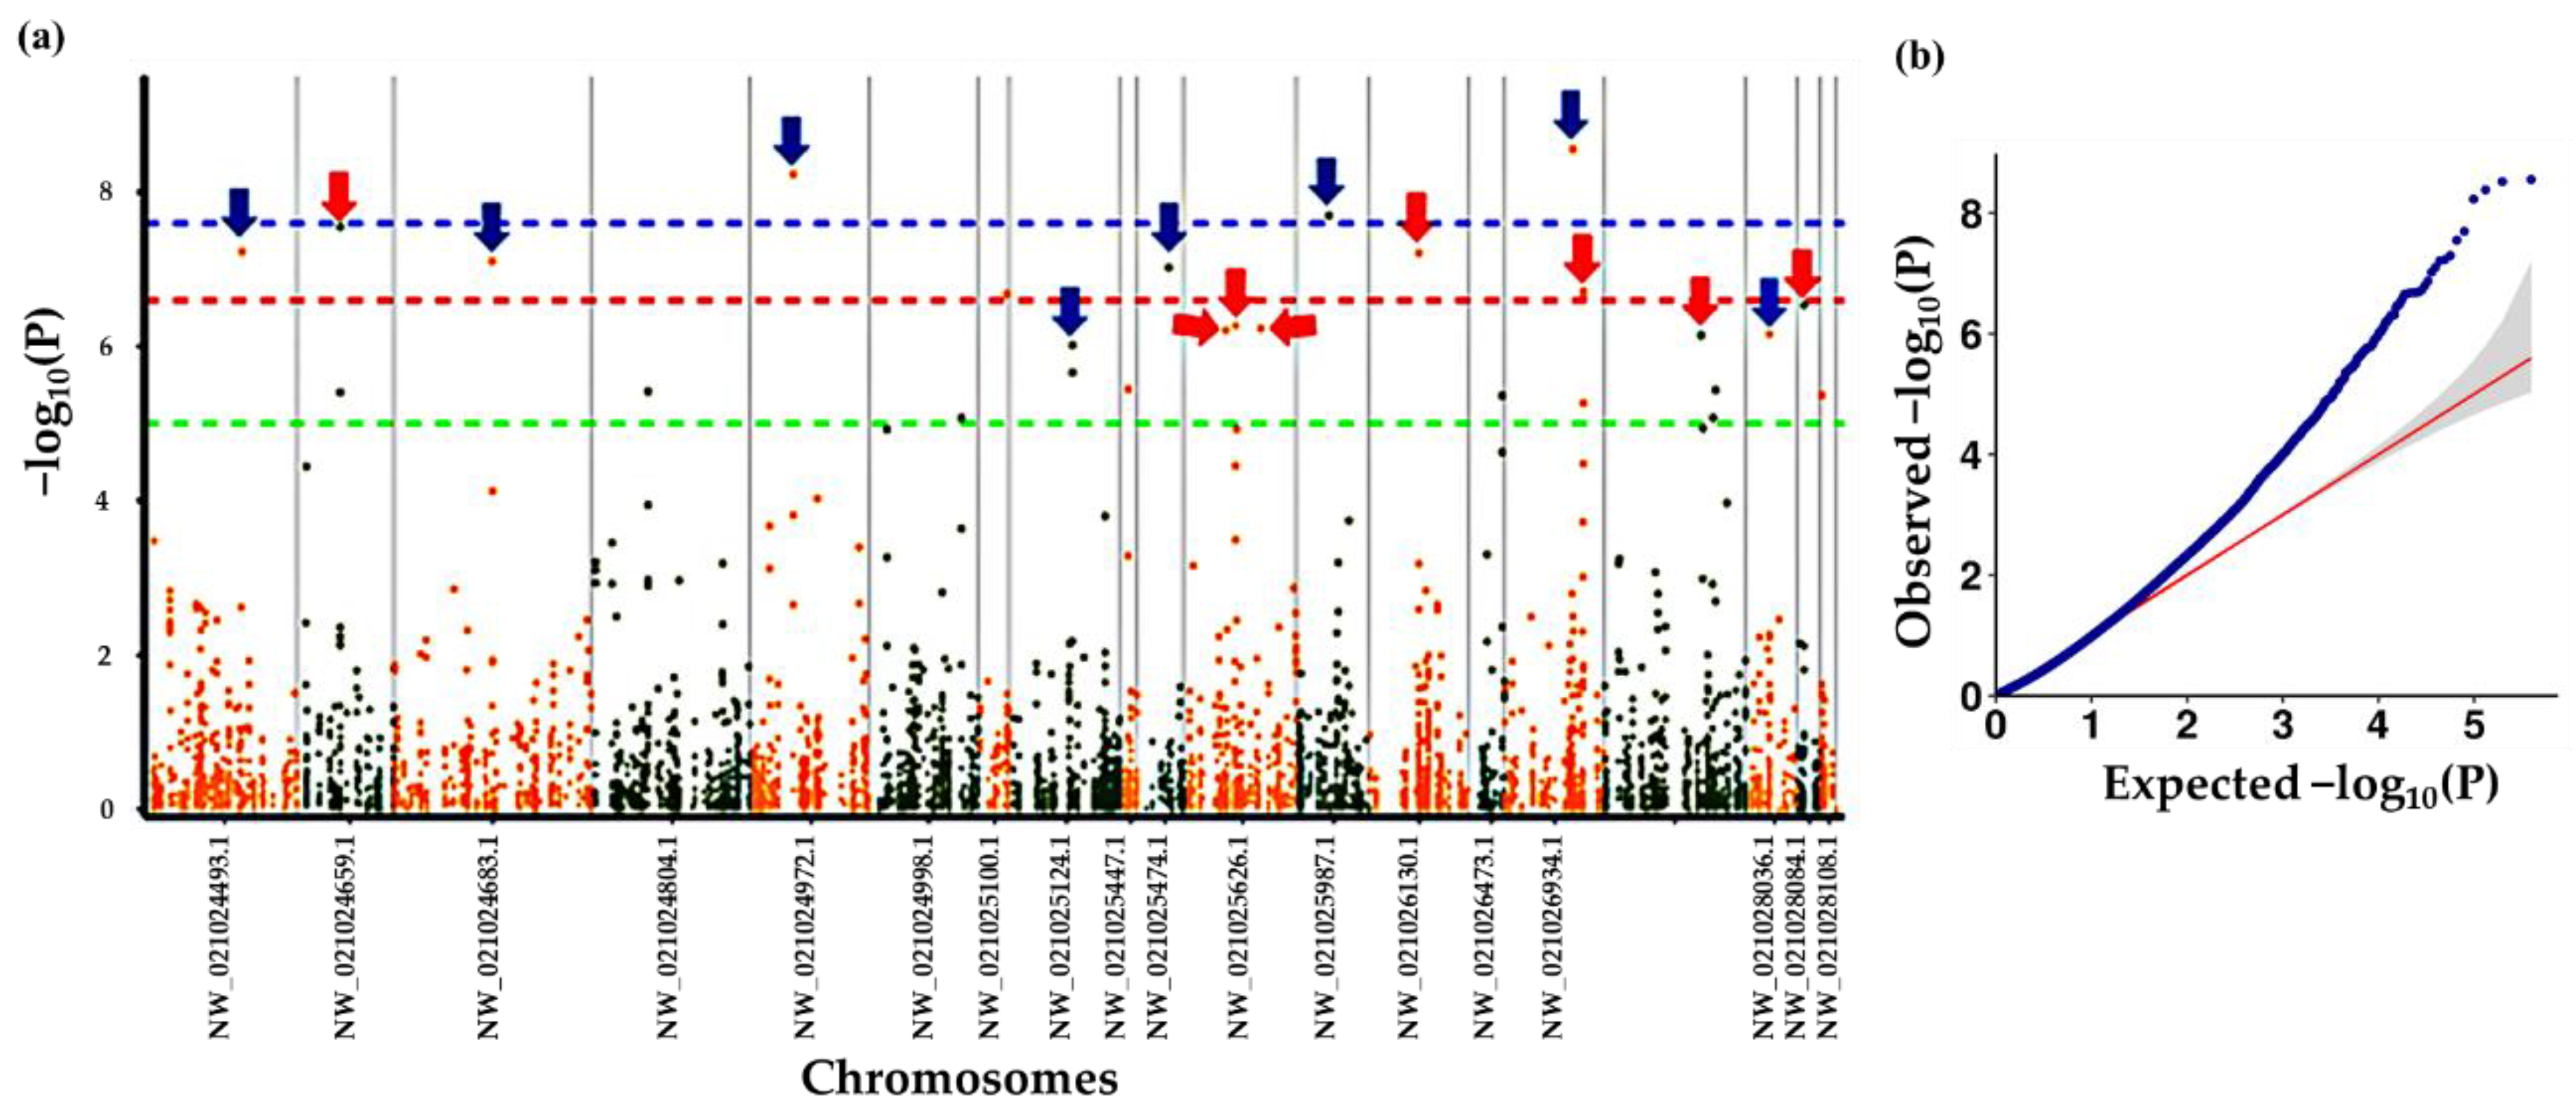
3.4. Association Analysis with Altitude at Origin of Plants

The SNPs were used to analyze the whole genome association of three traits in the ancient tea plant. A −log10(P) > 6 represented a strong association between a gene and a trait. It was found that there were association signal sites related to altitude on chromosome NW_021024511.1, NW_021024514.1, NW_021024776.1, NW_021024867.1, NW_021024952.1, NW_021025062.1, NW_021025419.1, NW_021025653.1, NW_021025692.1, NW_021025778.1, NW_021026109.1, NW_021028633.1, and NW_021028891.1 (Figure 6 indicated by the arrows). Combined with the previous research results of others, 17 significantly associated signal sites were selected in this study (Table 2) [42,43,44,45]. Through the SwissProt database annotation (https://www.expasy.org/resources/uniprotkb-swiss-prot, 1 July 2022), seven candidate genes were obtained related to ancient tea plants’ altitude. These were: WDL3, MYBP1, ERF4, GST, HSP70, bZIP18, and MMK2 (Table 3).

3.5. Association Analysis of Tree Shape

There were association signal sites related to tree shape development on chromosome NW_021024493.1, NW_021024659.1, NW_021024683.1, NW_021024972.1, NW_021025124.1, NW_021025474.1, NW_021025626.1, NW_021025987.1, NW_021026130.1, NW_021026834.1, NW_021028036.1, NW_021028084.1, and NW_021026995.1 (Figure 7, indicated by the arrows). Combined with the previous research results of others, 13 significantly associated signal sites were selected in this study (Table 4) [46,47,48,49,50]. Through the SwissProt database annotation, eight candidate genes were related to tree shape development: GLP1, THIS1, SWC4, GA20ox2, PMEI28, SGL, GRDP2, and ERF8 (Table 5).

3.6. Association Analysis of Leaf Color

It was found that there were association signal sites related to the development of leaf color on chromosomes NW_021024756.1, NW_021025169.1, and NW_021026114.1 (Figure 8, indicated by the arrows). In combination with previous research results of others, five significantly associated signal sites were selected (Table 6) [51,52]. Three candidate genes related to leaf color development, including ABCI7, bHLH, and SIG2A, were obtained from the annotation of the SwissProt database (Table 7).

4. Discussion

SNPs are the markers of choice for many applications in population ecology, evolution, and conservation genetics, and they are particularly useful for GWAS analysis. This study obtained a total of 807,743 SLAF tags by SLAF-seq, and 9,428,309 high-quality SNPs were developed. Based on developed SNPs, candidate genes related to three traits of the ancient tea plant, i.e., altitude at origin, tree shape, and leaf color, were screened. Interestingly, most of the seven candidate genes related to altitude are also related to the plant responses under abiotic stress. The factors causing these stress responses included temperature, humidity, rainfall, solar radiation, and soil conditions. Temperature increases can alter the content of taste-related compounds, including catechin and L-theanine [53,54]. Further, both solar radiation intensity and quality modulate the catechin and aroma compound compositions and contents [55,56]. This indicated that changes in tea quality components at different altitudes were related to the corresponding stress response. In this study, the AP2/ERF and bZIP transcription factors screened played important roles in plant responses to abiotic stress [57,58,59]. Recently, it has been identified that ethylene-responsive transcription factor 4 (ERF4) is an important regulator of low-altitude adaptation in Rhododendron species. In contrast, mitogen-activated protein kinase MMK2 was a key regulator of high-altitude adaptation in Rhododendron species [42]. CsbZIP6 [43] and CsbZIP18 [44] were found to be involved in ABA-mediated abiotic stress response. Again, microtubule-binding protein WDL3 participated in ABA-induced stomatal closure by interacting with the microtubule skeleton and Ca2+ [45]. Thus, both contributed to adaptation to high-altitude cold and drought-prone environments. It is known that under drought conditions, the main bioactive components of tea plants, such as polyphenols (especially catechins), flavonoids, caffeine, theanine, and other free amino acids accumulate, thereby reducing the quality of the tea [60]. In response to low-temperature stress, tea catechins, anthocyanins, and soluble sugar increased significantly with temperature decrease [61]. These physiological and ecological differences in tea plants are caused by the combined effects of various environmental factors (such as topography, temperature, water, and radiation) in different altitude gradients. Further, in different altitude areas, the effects of various environmental factors are significantly different, so plants show a diversity of physiological and ecological characteristics with changes in altitude [62,63]. Based on these findings, we speculate that plants have evolved different regulatory mechanisms to cope with biotic and abiotic stresses in different ecological environments created due to altitudinal differences. However, few studies focus on the tea plant’s functional aspect of ERF4, MMK2, bZIP18, and WDL3 genes. In addition, the association between these genes and the altitude of the tea plant is also poorly understood.
Phytohormones are critical in many aspects of plant growth and development [64]. Synthesis analysis has suggested that alterations in hormone synthesis, regulation, perception, or signaling have the potential to induce changes in tree architecture [65]. A recent study confirmed that the manipulation of MdIAAs can control the architecture of the apple tree [66]. In our study, some candidate genes selected for the development of tree shape were found to be associated with phytohormone. It has been also found that AtGRDP2 modulated the expression of auxin-related genes, and overexpression of the AtGRDP2 gene could accelerate growth [46]. A new ERF gene, TaERF8–2B, was identified in wheat, which was related to wheat height and heading date [47]. In barley, the deletion of 7-bp in the HvGA20ox2 gene resulted in a decrease of about 13 cm plant height [48]. The above results suggest that phytohormones might affect tree shape development by regulating plant height. Studies have reported that the shape and growth of plants were affected by the activity of PMEIs, and it was generally believed that specific PME/PMEI pairs regulated the degree of methyl esterification in cell-wall microdomains [67,68,69]. Further research has indicated that overexpression of OsPMEI28 caused dwarfing in rice [49]. THIS1 has also been related to plant height, encoding a class III lipase, and its rice mutant aa (this1) has the most striking phenotype of tiller height, reduced height, and sterile spikelets [50]. Some genes with THIS1 function are believed to be regulated during shrub evolution, making shrubs clustered and dwarfed. Therefore, GRDP2, ERF8, GA20ox2, PMEI28, and THIS1 genes may be related to the tree shape of tea plants, but their specific functions in tea plants have not yet been determined.
The leaf color of tea plants is an important factor in determining the fate of tea products, which is mainly influenced by the chlorophyll and anthocyanin content [70]. In Arabidopsis, chloroplast-localized AtABCI10 and AtABCI11 (AtNAP14) proteins participated in regulating chloroplast metal homeostasis, and the loss of these gene products led to impaired chloroplast biogenesis. It deregulated metal homeostasis [71,72]. Furthermore, a single base substitution followed by a 6-bp deletion in OsABCI7 was found to result in chlorotic and necrotic leaves in rice characterized by degradation of the thylakoid membrane, chlorophyll breakdown, and impairment of photosynthesis [51]. The bHLH proteins were critical transcriptional regulators in the anthocyanin pathway [52]. Analysis of the protein profiling of purple and green leaves of Zijuan tea showed the abundance of transcription factors bHLH and HY5, which regulate anthocyanin biosynthesis at the transcriptional level [73]. Therefore, it was highly likely that ABCI protein and the bHLH transcription factor could affect leaf color development by regulating chloroplast metal homeostasis and anthocyanin biosynthesis. However, their specific roles in the development of tea leaf color have not yet been characterized.

5. Conclusions

This study obtained 807,743 SLAF tags by SLAF-seq, and 9,428,309 high-quality SNPs were developed. The population structure analysis suggested that 125 ancient tea plants could be clustered into four groups. The average observed heterozygosity values of GQ, LD, YM, and ZY were lower than their average expected heterozygosity values, indicating probable incidences of inbreeding in the ancient tea population. This resulted in an excess of homozygotes. The genetic diversity level of ancient tea plant populations in the LD and YM production areas was higher, whereas it was lowest in the GQ production area. GWAS analysis indicated seven candidate genes related to altitude, eight candidate genes related to tree shape development, and three candidate genes associated with leaf color development. Our results provide a reference for further resource identification and selection of ancient tea plants from Sandu County.

Author Contributions

Y.Z. conceived and planned the experiments. L.C., X.D. and R.W. conducted data analysis. Q.L. and Y.L. collected the ancient tea leaf samples. L.C. wrote the manuscript. Y.Z., X.H. and X.D. edited the manuscript. All authors have read and agreed to the published version of the manuscript.

Funding

This work was supported by the National Natural Science Foundation of China (32160077), Zunyi Tea Industry Supporting Projects NS (2020)25, and the Science and Technology Support Program (Agriculture) of Guizhou, China. Qian Ke He Zhi Cheng No. (2020)1Y001.

Data Availability Statement

The raw sequence information that supports the findings of this study is available from (Beijing Biomarker Biotechnology Co., Ltd., Beijing, China), but restrictions apply to the availability of these data, which were used under license for the current study and so are not publicly available. Data are, however, available from the corresponding authors upon reasonable request and with permission of (Beijing Biomarker Biotechnology Co., Ltd., Beijing, China). Other datasets supporting the conclusions of this article are included within the article.

Acknowledgments

The authors would like to acknowledge Xianxiang Chen and Xuanhua Pan, teachers of Sandu County Tea Office, for leading us in the collection of samples of ancient tea germplasm.

Conflicts of Interest

The authors declare no conflict of interest.

References

  1. Chen, Z.; Liu, H.; Cao, Y. Protection and utilization of variation type of wild tea resources and local tea varieties in Guizhou. Guizhou Agric. Sci. 2009, 21, 188–190. [Google Scholar]
  2. Zhao, Y.; Wang, R.; Liu, Q.; Dong, X.; Zhao, D. Genetic diversity of ancient Camellia sinensis (L.) O. Kuntze in Sandu County of Guizhou Province in China. Diversity 2021, 13, 276. [Google Scholar] [CrossRef]
  3. Lu, L.; Chen, H.; Wang, X.; Zhao, Y.; Yao, X.; Xiong, B.; Deng, Y.; Zhao, D. Genome-level diversification of eight ancient tea populations in the Guizhou and Yunnan regions identifies candidate genes for core agronomic traits. Hortic. Res. 2021, 8, 2559–2568. [Google Scholar] [CrossRef]
  4. Niu, S.; Koiwa, H.; Song, Q.; Qiao, D.; Chen, J.; Zhao, D.; Chen, Z.; Wang, Y.; Zhang, T. Development of core-collections for Guizhou tea genetic resources and GWAS of leaf size using SNP developed by genotyping-by-sequencing. PeerJ 2020, 8, e8572. [Google Scholar] [CrossRef] [PubMed] [Green Version]
  5. Kaundun, S.S.; Park, Y.G. Genetic Structure of Six Korean Tea Populations as Revealed by RAPD-PCR Markers. Crop Sci. 2002, 42, 594–601. [Google Scholar]
  6. Matsumoto, S.; Kiriiwa, Y.; Takeda, Y. Differentiation of Japanese green tea cultivars as revealed by RFLP analysis of phenylalanine ammonia-lyase DNA. Theor. Appl. Genet. 2002, 104, 998–1002. [Google Scholar] [CrossRef]
  7. Mishra, R.K.; Chaudhury, S.; Ahmad, A.; Pradhan, M.; Siddiqi, T.O. Molecular analysis of tea clones (Camellia sinensis) using AFLP markers. Int. J. Integr. Biol 2009, 5, 130–136. [Google Scholar]
  8. Fang, W.; Cheng, H.; Duan, Y.; Jiang, X.; Li, X. Genetic diversity and relationship of clonal tea (Camellia sinensis) cultivars in China as revealed by SSR markers. Plant Syst. Evol. 2012, 298, 469–483. [Google Scholar] [CrossRef]
  9. Wang, J.B. ISSR markers and their applications in plant genetics. Yi Chuan 2002, 24, 613–616. [Google Scholar]
  10. Zhen, L.; Xin-Chao, W.; Liping, Z. Genetic diversity and relationship analysis of tea germplasms originated from South Western China based on EST-SSR. Mol. Plant Breed. 2008, 6, 100–110. [Google Scholar]
  11. Sun, X.; Liu, D.; Zhang, X.; Li, W.; Liu, H.; Hong, W.; Jiang, C.; Guan, N.; Ma, C.; Zeng, H. SLAF-seq: An efficient method of large-scale de novo SNP discovery and genotyping using high-throughput sequencing. PLoS ONE 2013, 8, e58700. [Google Scholar] [CrossRef] [PubMed] [Green Version]
  12. Zhang, Y.; Wang, L.; Xin, H.; Li, D.; Ma, C.; Ding, X.; Hong, W.; Zhang, X. Construction of a high-density genetic map for sesame based on large scale marker development by specific length amplified fragment (SLAF) sequencing. BMC Plant Biol. 2013, 13, 1086. [Google Scholar] [CrossRef] [PubMed] [Green Version]
  13. Degen, B.; Yanbaev, Y.A.; Ianbaev, R.Y.; Bakhtina, S.Y.; Gabitova, A.A.; Tagirova, A.A. Genetic diversity and differentiation of northern populations of pedunculate oak based on analysis of new SNP markers. Russ. J. Genet. 2021, 57, 374–378. [Google Scholar] [CrossRef]
  14. Wang, Y.; Jiao, Z.; Zheng, J.; Zhou, J.; Wang, B.; Zhuge, Q.; He, X. Population genetic diversity and structure of an endangered salicaceae species in Northeast China: Chosenia arbutifolia (Pall.) A. Skv. Forests 2021, 12, 1282. [Google Scholar] [CrossRef]
  15. Jue, D.; Liu, L.; Sang, X.; Shu, B.; Wang, J.; Wang, Y.; Zhang, C.; Shi, S. SNP-based high-density genetic map construction and candidate gene identification for fruit quality traits of Dimocarpus longan Lour. Sci. Hortic. Amsterdam 2021, 284, 110086. [Google Scholar] [CrossRef]
  16. Lyu, Y.; Dong, X.; Huang, L.; Zheng, J.; He, X.; Sun, H.; Jiang, Z. SLAF-seq uncovers the genetic diversity and adaptation of Chinese Elm (Ulmus parvifolia) in Eastern China. Forests 2020, 11, 80. [Google Scholar] [CrossRef] [Green Version]
  17. Liu, J.; Li, X.; Liu, Y.; Xing, C.; Xie, Y.; Cai, G.; Lu, J. Evaluation of genetic diversity and development of core collections of industrial brewing yeast using ISSR markers. Arch. Microbiol. 2021, 203, 1001–1008. [Google Scholar] [CrossRef]
  18. Lin, Y.; Yu, W.; Zhou, L.; Fan, X.; Wang, F.; Wang, P.; Fang, W.; Cai, C.; Ye, N. Genetic diversity of oolong tea (Camellia sinensis) germplasms based on the nanofluidic array of single-nucleotide polymorphism (SNP) markers. Tree Genet. Genomes 2020, 16, 1–14. [Google Scholar] [CrossRef]
  19. Li, Y.; Zeng, X.; Li, G.; Zhao, Y.; Li, J.; Zhao, D. Population structure analysis and genome-wide association study of rice landraces from Qiandongnan, China, using specific-locus amplified fragment sequencing. Int. J. Agric. Biol. 2021, 25, 388–396. [Google Scholar] [CrossRef]
  20. Li, Y.; Zeng, X.; Zhao, Y.; Li, J.; Zhao, D. Identification of a new rice low-tiller mutant and association analyses based on the SLAF-seq method. Plant Mol. Biol. Rep. 2017, 35, 72–82. [Google Scholar] [CrossRef]
  21. Jia, Y.; Westcott, S.; He, T.; Mcfawn, L.A.; Angessa, T.; Hill, C.; Tan, C.; Zhang, X.; Zhou, G.; Li, C. Genome-wide association studies reveal QTL hotspots for grain brightness and black point traits in barley. Crop J. 2021, 9, 154–167. [Google Scholar] [CrossRef]
  22. Thabet, S.G.; Moursi, Y.S.; Sallam, A.; Karam, M.A.; Alqudah, A.M. Genetic associations uncover candidate SNP markers and genes associated with salt tolerance during seedling developmental phase in barley. Environ. Exp. Bot. 2021, 188, 104499. [Google Scholar] [CrossRef]
  23. Shahzad, A.; Qian, M.; Sun, B.; Mahmood, U.; Li, S.; Fan, Y.; Chang, W.; Dai, L.; Zhu, H.; Li, J. Genome-wide association study identifies novel loci and candidate genes for drought stress tolerance in rapeseed. Oil Crop Sci. 2021, 6, 12–22. [Google Scholar] [CrossRef]
  24. Wang, X.; Long, Y.; Wang, N.; Zou, J.; Ding, G.; Broadley, M.R.; White, P.J.; Yuan, P.; Zhang, Q.; Luo, Z. Breeding histories and selection criteria for oilseed rape in Europe and China identified by genome wide pedigree dissection. Sci. Rep. UK 2017, 7, 1–11. [Google Scholar] [CrossRef] [PubMed]
  25. Zhou, C.; Guo, Y.; Chen, Y.; Zhang, H.; El-Kassaby, Y.A.; Li, W. Genome wide association study identifies candidate genes related to the earlywood tracheid properties in Picea crassifolia Kom. Forests 2022, 13, 332. [Google Scholar] [CrossRef]
  26. Yang, Q.; Jin, H.; Yu, X.; Fu, X.; Zhi, H.; Yuan, F. Rapid identification of soybean resistance genes to soybean mosaic virus by SLAF-seq bulked segregant analysis. Plant Mol. Biol. Rep. 2020, 38, 666–675. [Google Scholar] [CrossRef]
  27. Ren, H.; Han, J.; Wang, X.; Zhang, B.; Yu, L.; Gao, H.; Hong, H.; Sun, R.; Tian, Y.; Qi, X. QTL mapping of drought tolerance traits in soybean with SLAF sequencing. Crop J. 2020, 8, 977–989. [Google Scholar] [CrossRef]
  28. Chen, L.; Yang, Y.J.; Yu, F.L. Tea Germplasm Resources Description Specification and Data Standard, 1st ed.; China Agriculture Press: Beijing, China, 2005. [Google Scholar]
  29. Li, B.Y.; Pan, B.; Cheng, W.; Han, J.; Qi, D.; Zhu, C. Research on geomorphological regionalization of China. Acta Geogr. Sin. 2013, 68, 291–306. [Google Scholar]
  30. Chen, S.; Borza, T.; Byun, B.; Coffin, R.; Coffin, J.; Peters, R.; Wang-Pruski, G. DNA markers for selection of late blight resistant potato breeding lines. Am. J. Plant Sci. 2017, 8, 1197–1209. [Google Scholar] [CrossRef]
  31. Kozich, J.J.; Westcott, S.L.; Baxter, N.T.; Highlander, S.K.; Schloss, P.D. Development of a dual-index sequencing strategy and curation pipeline for analyzing amplicon sequence data on the MiSeq Illumina sequencing platform. Appl. Environ. Microb. 2013, 79, 5112–5120. [Google Scholar] [CrossRef] [Green Version]
  32. Li, H.; Durbin, R. Fast and accurate short read alignment with Burrows–Wheeler transform. Bioinformatics 2009, 25, 1754–1760. [Google Scholar] [CrossRef] [PubMed] [Green Version]
  33. Mckenna, A.; Hanna, M.; Banks, E.; Sivachenko, A.; Cibulskis, K.; Kernytsky, A.; Garimella, K.; Altshuler, D.; Gabriel, S.; Daly, M. The Genome Analysis Toolkit: A MapReduce framework for analyzing next-generation DNA sequencing data. Genome Res. 2010, 20, 1297–1303. [Google Scholar] [CrossRef] [PubMed] [Green Version]
  34. Li, H.; Handsaker, B.; Wysoker, A.; Fennell, T.; Ruan, J.; Homer, N.; Marth, G.; Abecasis, G.; Durbin, R. The sequence alignment/map format and SAMtools. Bioinformatics 2009, 25, 2078–2079. [Google Scholar] [CrossRef] [PubMed] [Green Version]
  35. Cingolani, P.; Platts, A.; Wang, L.L.; Coon, M.; Nguyen, T.; Wang, L.; Land, S.J.; Lu, X.; Ruden, D.M. A program for annotating and predicting the effects of single nucleotide polymorphisms, SnpEff: SNPs in the genome of Drosophila melanogaster strain w1118; iso-2; iso-3. Fly 2012, 6, 80–92. [Google Scholar] [CrossRef] [PubMed] [Green Version]
  36. Alexander, D.H.; Novembre, J.; Lange, K. Fast model-based estimation of ancestry in unrelated individuals. Genome Res. 2009, 19, 1655–1664. [Google Scholar] [CrossRef] [PubMed] [Green Version]
  37. Kumar, S.; Stecher, G.; Li, M.; Knyaz, C.; Tamura, K. MEGA X: Molecular evolutionary genetics analysis across computing platforms. Mol. Biol. Evol. 2018, 35, 1547–1549. [Google Scholar] [CrossRef]
  38. Price, A.L.; Patterson, N.J.; Plenge, R.M.; Weinblatt, M.E.; Shadick, N.A.; Reich, D. Principal components analysis corrects for stratification in genome-wide association studies. Nat. Genet. 2006, 38, 904–909. [Google Scholar] [CrossRef]
  39. Zhou, X.; Stephens, M. Genome-wide efficient mixed-model analysis for association studies. Nat. Genet. 2012, 44, 821–824. [Google Scholar] [CrossRef] [Green Version]
  40. Lippert, C.; Listgarten, J.; Liu, Y.; Kadie, C.M.; Davidson, R.I.; Heckerman, D. FaST linear mixed models for genome-wide association studies. Nat. Methods 2011, 8, 833–835. [Google Scholar] [CrossRef]
  41. Sul, J.H.; Eskin, E. Mixed models can correct for population structure for genomic regions under selection. Nat. Rev. Genet. 2013, 14, 300. [Google Scholar] [CrossRef] [Green Version]
  42. Liu, X.; Wang, Y.; Shen, S. Transcriptomic and metabolomic analyses reveal the altitude adaptability and evolution of different-colored flowers in alpine Rhododendron species. Tree Physiol. 2022, 42, 1100–1113. [Google Scholar] [CrossRef] [PubMed]
  43. Wang, L.; Cao, H.; Qian, W.; Yao, L.; Hao, X.; Li, N.; Yang, Y.; Wang, X. Identification of a novel bZIP transcription factor in Camellia sinensis as a negative regulator of freezing tolerance in transgenic arabidopsis. Ann. Bot. London 2017, 119, 1195–1209. [Google Scholar] [CrossRef] [PubMed] [Green Version]
  44. Yao, L.; Hao, X.; Cao, H.; Ding, C.; Yang, Y.; Wang, L.; Wang, X. ABA-dependent bZIP transcription factor, CsbZIP18, from Camellia sinensis negatively regulates freezing tolerance in Arabidopsis. Plant Cell Rep. 2020, 39, 553–565. [Google Scholar] [CrossRef] [PubMed]
  45. Xi, X.; Wang, P.; Wang, Z.; Yu, R. The microtubule-associated protein WDL3 mediates ABA-induced stomatal closure in Arabidopsis. Chin. Sci. Bull. 2018, 64, 95–106. [Google Scholar] [CrossRef] [Green Version]
  46. Wang, L.; Liu, Y.; Aslam, M.; Jakada, B.H.; Qin, Y.; Cai, H. The glycine-rich domain protein GRDP2 regulates ovule development via the auxin pathway in Arabidopsis. Front. Plant Sci. 2021, 12, 698487. [Google Scholar] [CrossRef]
  47. Zhang, L.; Liu, P.; Wu, J.; Qiao, L.; Zhao, G.; Jia, J.; Gao, L.; Wang, J. Identification of a novel ERF gene, TaERF8, associated with plant height and yield in wheat. BMC Plant Biol. 2020, 20, 263. [Google Scholar] [CrossRef]
  48. Teplyakova, S.; Lebedeva, M.; Ivanova, N.; Horeva, V.; Voytsutskaya, N.; Kovaleva, O.; Potokina, E. Impact of the 7-bp deletion in HvGA20ox2 gene on agronomic important traits in barley (Hordeum vulgare L.). BMC Plant Biol. 2017, 17, 1989. [Google Scholar] [CrossRef] [Green Version]
  49. Nguyen, H.P.; Jeong, H.Y.; Jeon, S.H.; Kim, D.; Lee, C. Rice pectin methylesterase inhibitor28 (OsPMEI28) encodes a functional PMEI and its overexpression results in a dwarf phenotype through increased pectin methylesterification levels. J. Plant Physiol. 2017, 208, 17–25. [Google Scholar] [CrossRef]
  50. Liu, W.; Zhang, D.; Tang, M.; Li, D.; Zhu, Y.; Zhu, L.; Chen, C. THIS1 is a putative lipase that regulates tillering, plant height, and spikelet fertility in rice. J. Exp. Bot. 2013, 64, 4389–4402. [Google Scholar] [CrossRef] [Green Version]
  51. He, Y.; Shi, Y.; Zhang, X.; Xu, X.; Wang, H.; Li, L.; Zhang, Z.; Shang, H.; Wang, Z.; Wu, J. The OsABCI7 transporter interacts with OsHCF222 to stabilize the thylakoid membrane in rice. Plant Physiol. 2020, 184, 283–299. [Google Scholar] [CrossRef]
  52. Heim, M.A.; Jakoby, M.; Werber, M.; Martin, C.; Weisshaar, B.; Bailey, P.C. The basic helix–loop–helix transcription factor family in plants: A genome-wide study of protein structure and functional diversity. Mol. Biol. Evol. 2003, 20, 735–747. [Google Scholar] [CrossRef] [PubMed] [Green Version]
  53. Li, X.; Wei, J.; Ahammed, G.J.; Zhang, L.; Li, Y.; Yan, P.; Zhang, L.; Han, W. Brassinosteroids attenuate moderate high temperature-caused decline in tea quality by enhancing theanine biosynthesis in Camellia sinensis L. Front. Plant Sci. 2018, 9, 1016. [Google Scholar] [CrossRef] [PubMed] [Green Version]
  54. Xiang, P.; Wilson, I.W.; Huang, J.; Zhu, Q.; Tan, M.; Lu, J.; Liu, J.; Gao, S.; Zheng, S.; Lin, D. Co-regulation of catechins biosynthesis responses to temperature changes by shoot growth and catechin related gene expression in tea plants (Camellia sinensis L.). J. Hortic. Sci. Biotechnol. 2021, 96, 228–238. [Google Scholar] [CrossRef]
  55. Fu, X.; Chen, Y.; Mei, X.; Katsuno, T.; Kobayashi, E.; Dong, F.; Watanabe, N.; Yang, Z. Regulation of formation of volatile compounds of tea (Camellia sinensis) leaves by single light wavelength. Sci. Rep. UK 2015, 5, 16858. [Google Scholar] [CrossRef] [PubMed] [Green Version]
  56. Zhao, X.; Zeng, X.; Lin, N.; Yu, S.; Fernie, A.; Zhao, J. CsbZIP1-CsMYB12 mediates the production of bitter-tasting flavonols in tea plants (Camellia sinensis) through a coordinated activator-repressor network. Hortic. Res. 2021, 8, 110. [Google Scholar] [CrossRef]
  57. Wu, Z.; Li, X.; Liu, Z.; Li, H.; Wang, Y.; Zhuang, J. Transcriptome-based discovery of AP2/ERF transcription factors related to temperature stress in tea plant (Camellia sinensis). Funct. Integr. Genomic. 2015, 15, 741–752. [Google Scholar] [CrossRef]
  58. Liu, C.; Ou, S.; Mao, B.; Tang, J.; Wang, W.; Wang, H.; Cao, S.; Schläppi, M.R.; Zhao, B.; Xiao, G. Early selection of bZIP73 facilitated adaptation of japonica rice to cold climates. Nat. Commun. 2018, 9, 1–12. [Google Scholar] [CrossRef]
  59. Ma, H.; Liu, C.; Li, Z.; Ran, Q.; Xie, G.; Wang, B.; Fang, S.; Chu, J.; Zhang, J. ZmbZIP4 contributes to stress resistance in maize by regulating ABA synthesis and root development. Plant Physiol. 2018, 178, 753–770. [Google Scholar] [CrossRef] [Green Version]
  60. Wang, W.; Xin, H.; Wang, M.; Ma, Q.; Wang, L.; Kaleri, N.A.; Wang, Y.; Li, X. Transcriptomic analysis reveals the molecular mechanisms of drought-stress-induced decreases in Camellia sinensis leaf quality. Front. Plant Sci. 2016, 7, 385. [Google Scholar] [CrossRef] [Green Version]
  61. Sun, Y.; Zhou, J.; Guo, J. Advances in the knowledge of adaptive mechanisms mediating abiotic stress responses in Camellia sinensis. Front. Biosci.-Landmrk. 2021, 26, 1714–1722. [Google Scholar] [CrossRef]
  62. Körner, C.; Life, A.P. Functional plant ecology of high mountain ecosystems. Alp. Plant Life 2003, 3, 202. [Google Scholar]
  63. Barry, R.G. Mountain Weather and Climate, 3rd ed.; Cambridge University Press: Cambridge, UK, 1992. [Google Scholar]
  64. Ljung, K. Auxin metabolism and homeostasis during plant development. Development 2013, 140, 943–950. [Google Scholar] [CrossRef] [PubMed] [Green Version]
  65. Hollender, C.A.; Dardick, C. Molecular basis of angiosperm tree architecture. New Phytol. 2015, 206, 541–556. [Google Scholar] [CrossRef] [PubMed] [Green Version]
  66. Wang, L.; Xu, K.; Li, Y.; Cai, W.; Zhao, Y.; Yu, B.; Zhu, Y. Genome-wide identification of the Aux/IAA family genes (MdIAA) and functional analysis of MdIAA18 for apple tree ideotype. Biochem. Genet. 2019, 57, 709–733. [Google Scholar] [CrossRef] [PubMed]
  67. Liu, T.; Yu, H.; Xiong, X.; Yu, Y.; Yue, X.; Liu, J.; Cao, J. Genome-wide identification and characterization of pectin methylesterase inhibitor genes in Brassica oleracea. Int. J. Mol. Sci. 2018, 19, 3338. [Google Scholar] [CrossRef] [Green Version]
  68. Hongo, S.; Sato, K.; Yokoyama, R.; Nishitani, K. Demethylesterification of the primary wall by PECTIN METHYLESTERASE35 provides mechanical support to the Arabidopsis stem. Plant Cell 2012, 24, 2624–2634. [Google Scholar] [CrossRef] [Green Version]
  69. Reca, I.B.; Lionetti, V.; Camardella, L.; D Avino, R.; Giardina, T.; Cervone, F.; Bellincampi, D. A functional pectin methylesterase inhibitor protein (SolyPMEI) is expressed during tomato fruit ripening and interacts with PME-1. Plant Mol. Biol. 2012, 79, 429–442. [Google Scholar] [CrossRef]
  70. Yang, Y.; Chen, X.; Xu, B.; Li, Y.; Ma, Y.; Wang, G. Phenotype and transcriptome analysis reveals chloroplast development and pigment biosynthesis together influenced the leaf color formation in mutants of Anthurium andraeanum ‘Sonate’. Front. Plant Sci. 2015, 6, 139. [Google Scholar] [CrossRef] [Green Version]
  71. Shimoni Shor, E.; Hassidim, M.; Yuval Naeh, N.; Keren, N. Disruption of Nap14, a plastid-localized non-intrinsic ABC protein in Arabidopsis thaliana results in the over-accumulation of transition metals and in aberrant chloroplast structures. Plant Cell Environ. 2010, 33, 1029–1038. [Google Scholar] [CrossRef]
  72. Voith Von Voithenberg, L.; Park, J.; Stübe, R.; Lux, C.; Lee, Y.; Philippar, K. A novel prokaryote-type ECF/ABC transporter module in chloroplast metal homeostasis. Front. Plant Sci. 2019, 10, 1264. [Google Scholar] [CrossRef] [Green Version]
  73. Wang, L.; Pan, D.; Liang, M.; Abubakar, Y.S.; Li, J.; Lin, J.; Chen, S.; Chen, W. Regulation of anthocyanin biosynthesis in purple leaves of zijuan tea (Camellia sinensis var. kitamura). Int. J. Mol. Sci. 2017, 18, 833. [Google Scholar] [CrossRef] [PubMed]
Figure 1. Leaf color and tree shape of ancient tea plants. (a) The leaf colors of 125 ancient tea plants were categorized into yellow-green, green, and dark green. (b) The tree shapes included tree, small tree, and shrub types.
Forests 13 01885 g001
Figure 2. Distribution of SLAF tags on the chromosomes. The abscissa is the length of the chromosomes, and each band represents a chromosome. The genome is divided according to the size of 0.1MB. The more SLAF tags in each window, the darker the color. Fewer SLAF tags are indicated in a lighter color. The darker area is the area where SLAF tags are concentrated.
Forests 13 01885 g002
Figure 3. Distribution of SNPs on the chromosomes. The abscissa is the length of chromosomes, and each band represents a chromosome. The genome is divided according to the size of 0.1 MB. The more SNPs in each window, the darker the color. Fewer SNPs are indicated in a lighter color. The darker area is the area where SNPs are concentrated.
Forests 13 01885 g003
Figure 4. Population structure analysis and cluster cross-validation error analysis of 125 ancient tea samples. (a) The horizontal coordinates represent 125 ancient tea samples in order, and the vertical coordinates represent the number of subgroups K values (K = 1–10). Different colors represent subgroups with different gene frequencies in the 125 ancient tea plant samples, and ancient tea plants in the same subgroup are closely related. The color corresponding to each sample and the color proportion represent the subgroup this sample belongs to and the proportion of the source of genetic material. (b) The x-axis represents the K-value (1–10), and the y-axis is the cross-validation error values.
Forests 13 01885 g004
Figure 5. Phylogenetic tree analysis, principal component analysis, and four ancient tea-producing areas in Sandu County. (a) Phylogenetic tree analysis of 125 ancient tea plants. Each branch represents an ancient tea plant. The 125 ancient tea plants were also presented in Table 1. (b) Principal component analysis of 125 ancient tea plants. PCA three-dimensional cluster diagram of 125 ancient tea plants showing PC1 (first principal component), PC2 (second principal component), and PC3 (third principal component). A dot represents an ancient tea plant. (c) The location map of four ancient tea plant-producing areas in Sandu County. The red dot represents Guqi Village, the orange dot represents Lankan Village, the blue dot represents Yangmeng Village, and the yellow dot represents Zenya Village.
Forests 13 01885 g005
Figure 6. Manhattan plot (a) and quantile–quantile plot (b) for the altitude of 125 ancient plants. The abscissa represents scaffold position, and the ordinate represents p-value (−log10(P)), with a negative logarithm (base 10). Scattered points (or lines) on the graph represent −log10(P) corresponding to each SNP loci. The green horizontal dashed line corresponds to −log10(P) = 5, the red horizontal dashed line corresponds to −log10(P) = 7, and the blue horizontal dashed line corresponds to −log10(P) =7.5. Red arrows indicate candidate gene loci obtained by screening, and blue arrows show the significant association signal peaks.
Forests 13 01885 g006
Figure 7. Manhattan plot (a) and quantile–quantile plot (b) for tree shape of 125 ancient plants. The abscissa represents scaffold position, and the ordinate represents p-value (−log10(P)), with a negative logarithm (base 10). Scattered points (or lines) on the graph represent the −log10(P) corresponding to each SNP loci. The green horizontal dashed line corresponds to −log10(P) = 5, the red horizontal dashed line corresponds to −log10(P) = 7, and the blue horizontal dashed line corresponds to −log10(P) =7.5. Red arrows indicate candidate gene loci obtained by screening, and blue arrows show the significant association signal peaks.
Forests 13 01885 g007
Figure 8. Manhattan plot (a) and quantile–quantile plot (b) for the leaf color of 125 ancient plants. The abscissa represents scaffold position, and the ordinate represents p-value (−log10(P)), with a negative logarithm (base 10). Scattered points (or lines) on the graph represent −log10(P) corresponding to each SNP loci. The green horizontal dashed line corresponds to −log10(P) = 5, the red horizontal dashed line corresponds to −log10(P) = 7, and the blue horizontal dashed line corresponds to −log10(P) =7.5. Red arrows indicate candidate gene loci obtained by screening, and blue arrows show the significant association signal peaks.
Forests 13 01885 g008
Table 1. Basic information about 125 ancient tea plants.
Sample NumberCollection LocationAltitude(m)Tree ShapeLeaf Color
GQ-B-1Guqi680shrubyellow-green
GQ-B-3Guqi680shrubdark green
GQ-B-4Guqi680shrubdark green
GQ-B-5Guqi690shrubdark green
GQ-B-7Guqi680shrubgreen
GQ-B-9Guqi630shrubdark green
GQ-B-11Guqi690shrubdark green
GQ-B-13Guqi680shrubdark green
GQ-B-14Guqi700shrubgreen
GQ-B-16Guqi690shrubgreen
GQ-B-18Guqi710shrubgreen
GQ-B-19Guqi710shrubgreen
GQ-B-20Guqi710shrubdark green
GQ-B-21Guqi710shrubgreen
LD-B-1Landong970shrubdark green
LD-B-2Landong990shrubdark green
LD-B-3Landong990shrubdark green
LD-B-4Landong990shrubdark green
LD-B-5Landong1000shrubdark green
LD-B-6Landong1000shrubdark green
LD-B-7Landong1000shrubdark green
LD-B-8Landong990shrubdark green
LD-B-9Landong990shrubdark green
LD-B-10Landong990shrubgreen
LD-B-12Landong990shrubgreen
LD-B-13Landong980shrubdark green
LD-B-14Landong980shrubdark green
LD-B-15Landong980shrubdark green
YM-T-1Yangmeng890shrubdark green
YM-T-3Yangmeng890shrubgreen
YM-T-4Yangmeng880shrubdark green
YM-T-5Yangmeng880shrubdark green
YM-T-7Yangmeng880shrubdark green
YM-T-9Yangmeng880shrubdark green
YM-B-10Yangmeng880treedark green
LD-T-1Landong980small treeyellow-green
LD-T-2Landong960small treeyellow-green
LD-T-4Landong1010treegreen
LD-T-6Landong1000small treedark green
LD-T-7Landong980small treegreen
LD-T-9Landong980small treeyellow-green
LD-T-10Landong980small treegreen
LD-T-11Landong1000treegreen
LD-T-12Landong990treegreen
LD-T-13Landong930treeyellow-green
LD-T-16Landong920treegreen
LD-T-18Landong910treegreen
LD-T-19Landong910treeyellow-green
LD-T-20Landong920treegreen
LD-T-22Landong920treegreen
LD-T-23Landong900treeyellow-green
LD-T-25Landong920treeyellow-green
LD-T-28Landong860treegreen
LD-T-29Landong850treegreen
LD-T-30Landong870treeyellow-green
LD-T-32Landong850treegreen
LD-T-34Landong870treegreen
LD-T-36Landong830treegreen
LD-T-38Landong840small treegreen
LD-T-39Landong860small treeyellow-green
LD-T-40Landong800treedark green
LD-T-41Landong830treeyellow-green
LD-T-42Landong830treeyellow-green
LD-T-44Landong810treeyellow-green
ZY-T-AZenya1320treedark green
ZY-T-CZenya1310treedark green
ZY-T-EZenya1310treedark green
ZY-T-HZenya1300treegreen
ZY-T-JZenya1326treegreen
ZY-T-LZenya1340treedark green
ZY-T-OZenya1300treedark green
ZY-T-PZenya1300small treegreen
ZY-T-RZenya1290treegreen
ZY-T-TZenya1290treegreen
ZY-T-WZenya1250treeyellow-green
ZY-T-XZenya1250treeyellow-green
ZY-T-1Zenya1250treegreen
ZY-T-4Zenya1280treegreen
ZY-T-8Zenya1270treeyellow-green
ZY-T-10Zenya1270treegreen
ZY-T-13Zenya1270treedark green
ZY-T-15Zenya1300treedark green
ZY-T-31Zenya1300treegreen
ZY-T-35Zenya1300treedark green
ZY-T-37Zenya1330treegreen
ZY-T-40Zenya1300small treedark green
PA-T-1-RPu’an1210treeyellow-green
PA-T-2N-RPu’an1230treeyellow-green
TS-B-29-RTuanshan1117shrubdark green
TS-B-46-RTuanshan1192shrubgreen
TS-B-50-RTuanshan1190shrubdark green
SP-RShiping880shrubdark green
DJ-RDejiang990shrubyellow-green
GC-RSanqiao960shrubgreen
12-RSanqiao1080treegreen
LD-T-27Landong720treedark green
GQ-B-8Guqi680shrubdark green
GQ-B-12Guqi680shrubgreen
GQ-B-17Guqi710shrubdark green
GQ-B-22Guqi710shrubdark green
LD-B-11Landong990shrubdark green
YM-T-2Yangmeng890treedark green
YM-T-6Yangmeng880treeyellow-green
YM-T-8Yangmeng890treeyellow-green
LD-T-3Landong1010small treegreen
LD-T-5Landong1010small treeyellow-green
LD-T-8Landong980treegreen
LD-T-15Landong990small treedark green
LD-T-21Landong900treegreen
LD-T-24Landong940small treedark green
LD-T-31Landong850treedark green
LD-T-37Landong840treedark green
LD-T-43Landong820treeyellow-green
ZY-T-GZenya1300treegreen
ZY-T-YZenya1250treegreen
ZY-T-ZZenya1250treeyellow-green
ZY-T-2Zenya1280treegreen
ZY-T-12Zenya1270treegreen
ZY-T-18Zenya1380treedark green
ZY-T-19Zenya1380treegreen
ZY-T-20Zenya1380treeyellow-green
ZY-T-22Zenya1300treegreen
ZY-T-26Zenya1300treeyellow-green
ZY-T-50Zenya1300treeyellow-green
Table 2. Strong association signal sites and annotation information of altitude.
ChrPosGene ID−log10(P)DistanceAllele
NW_021024511.11773825gene-LOC1143065667.893′_7454G/A
NW_021024511.11773907gene-LOC1143060517.573′_6491C/T
NW_021024514.1254831gene-LOC1143070848.113′_42943C/A
NW_021024514.1254900gene-LOC1143070848.203′_43012G/A
NW_021024776.1114996gene-LOC1143065136.283′_96230A/G
NW_021024867.1495842gene-LOC1143093629.235′_37266C/T
NW_021024867.1495876gene-LOC1143093627.865′_37300C/G
NW_021024952.1420845gene-LOC1143119267.105′_37614C/T
NW_021025062.1271971gene-LOC1143157826.435′_28419G/A
NW_021025062.1271975gene-LOC1143157826.035′_28423T/C
NW_021025419.1765188gene-LOC1142569936.855′_39798T/C
NW_021025653.1768001gene-LOC1142620916.995′_33301A/G
NW_021025692.11703135gene-LOC1142627516.133′_28405T/A
NW_021025778.170220gene-LOC1142646168.285′_88872C/T
NW_021026109.11237022gene-LOC1142715098.733′_66332G/A
NW_021028633.1425237gene-LOC1142982539.095′_58469G/A
NW_021028891.1183040gene-LOC1142992526.233′_41369C/T
Chr, Chromosomes. Pos, Physical position of SNP. Gene ID, gene number. −log10(P) represents the degree of association between traits and genes. Distance, the distance between SNPs (SNPs in the intergenic region) is 5′ or 3′. Allele, allele (major allele/minor allele).
Table 3. Candidate genes related to altitude.
Candidate TranscriptCorresponding Candidate GeneSwissProt AnnotationSpecies Name
gene-LOC114307084ERF4Ethylene-responsive transcription factor 4Nicotiana tabacum
gene-LOC114306513WDL3Protein Wave-dampende 2-like 3 Arabidopsis thaliana
gene-LOC114309362MMK2Mitogen-activated protein kinase homolog MMK2Medicago sativa
gene-LOC114262751bZIP18bZIP transcription factor 18Arabidopsis thaliana
gene-LOC114271509MYBP1Transcription factor MYBP1Oryza sativa subsp. japonica
gene-LOC114298253GTSGlutathione S-transferaseArabidopsis thaliana
gene-LOC114299252HSP70Heat shock protein 70Helianthus annuus
Table 4. Strong association signal sites and annotation information of tree shape development.
ChrPosGene ID−log10(P)DistanceAllele
NW_021024493.12051435gene-LOC1143136707.235′_17193C/T
NW_021024659.1976560gene-LOC1142801777.553′_18973C/T
NW_021024683.12219147gene-LOC1142874207.103′_97898C/T
NW_021024972.1976930gene-LOC1143127888.235′_29338C/G
NW_021025124.11428384gene-LOC1143174536.013′_83111C/T
NW_021025474.1716828gene-LOC1142580217.025′_74073G/A
NW_021025626.11177505gene-LOC1142612096.275′_94084C/A
NW_021025626.11177505gene-LOC1142612106.275′_38692C/A
NW_021025626.11177505gene-LOC1142612126.275′_33377C/A
NW_021025987.1742920gene-LOC1142690187.703′_3237G/A
NW_021026130.11127861gene-LOC1142719537.215′_91916G/A
NW_021026834.11782507gene-LOC1142830356.665′_3360T/C
NW_021028036.1538795gene-LOC1142953716.163′_58473C/T
NW_021028084.1154517gene-LOC1142956496.533′_65378G/A
NW_021026995.12509736gene-LOC1142852216.433′_16206G/A
Chr, chromosomes. Pos, pphysical position of SNP. Gene ID, gene number. −log10(P) represents the degree of association between traits and genes. Distance, the distance between SNPs (SNPs in the intergenic region) is 5′ or 3′. Allele, allele (major allele/minor allele).
Table 5. Candidate genes related to the development of tree shape.
Candidate TranscriptCorresponding Candidate GeneSwissProt AnnotationSpecies Name
gene-LOC114280177GLP1Germin-like protein1Oryza sativa
gene-LOC114261209THIS1A putative lipaseOryza sativa
gene-LOC114261210SWC4SWR1-complex protein 4Arabidopsis thaliana
gene-LOC114261212GA20ox2Gibberellin 20-dioxygenase 2Pisum sativum
gene-LOC114271953PMEI28Pectinesterase inhibitor 28Arabidopsis thaliana
gene-LOC114283035SGLKinesin-like protein SGLGossypium hirsutum
gene-LOC114295649GRDP2Glycine-rich domain protein 2Arabidopsis thaliana
gene-LOC114285221ERF8Ethylene-responsive transcription factor 8Arabidopsis thaliana
Table 6. Strong association signal sites and annotation information of leaf color.
ChrPosGene ID−log10(P)DistanceAllele
NW_021024756.156383gene-LOC1143060636.083′_13784G/A
NW_021025169.12005114gene-LOC1143187506.085′_88588C/T
NW_021026114.1386575gene-LOC1142715606.135′_94608G/T
NW_021026114.1386575gene-LOC1142715926.133′_5585G/T
NW_021026114.1386575gene-LOC1142715956.133′_79759G/T
Chr, chromosomes. Pos, physical position of SNP. Gene ID, gene number. −log10(P) represents the degree of association between traits and genes. Distance, the distance between SNPs (SNPs in the intergenic region) is 5′ or 3′. Allele, allele (major allele/minor allele).
Table 7. Candidate genes related to the development of leaf color.
Candidate TranscriptCorresponding Candidate GeneSwissProt AnnotationSpecies Name
gene-LOC114271560ABCI7Protein ABC transporter I7Arabidopsis thaliana
gene-LOC114271592bHLHBasic helix-loop-helix type transcription factorOryza sativa
gene-LOC114271595SIG2ANuclear-encoded sigma (σ) factor 2AOryza sativa
Publisher’s Note: MDPI stays neutral with regard to jurisdictional claims in published maps and institutional affiliations.

