Article

Influence of Four Spacings between Trees and Four Samplings Heights on Selected Wood Quality Attributes of White Spruce (Picea glauca (Moench) Voss)

1
Natural Resources Canada, Canadian Forest Service, Canadian Wood Fibre Centre, Edmonton, AB T6H 3S5, Canada
2
Institut de Recherche sur les Forêts, Université du Québec en Abitibi-Témiscamingue, 445 boul. de l’Université, Rouyn-Noranda, QC J9X 5E4, Canada
3
Département des Sciences Biologiques, Université du Québec à Montréal, Montréal, QC H3C 3P8, Canada
*
Author to whom correspondence should be addressed.
Forests 2022, 13(11), 1807; https://doi.org/10.3390/f13111807
Submission received: 6 October 2022 / Revised: 27 October 2022 / Accepted: 27 October 2022 / Published: 30 October 2022
(This article belongs to the Special Issue Silviculture and Management of Boreal Forests)

Abstract

:
Four Picea glauca (Moench) Voss trees grown at each of four square spacing intensities between trees: 1.2 m, 1.8 m, 4.3 m, and 6.1 m in a plantation established in 1967 in the Petawawa Research Forest, Ontario, Canada (lat. 45.59° N, long. 77.25° W, elev. 168 m) and sampled at four different heights (1.3 m, 4.3 m, 7.3 m, 10.3 m) were used to study the impact of spacing between trees and sampling height on nine wood quality attributes (ring width, ring density, tracheid length, tracheid diameter, latewood proportion, intra-ring density variation, ring area, earlywood width, and latewood width). In the juvenile wood, ring width was wider and ring density higher than in the mature wood. Tracheid length was longer and tracheid diameter wider in the mature wood compared to the juvenile wood. The variation of ring density between the two wood zones was limited, and latewood proportion did not show any difference with wood zone. Sampling height induced variation in more wood quality attributes than did spacing. Except for growth rate, spacing between trees did not significantly impact wood quality attributes. Most of these variations were registered between widely different spacings.

1. Introduction

Often called “circumpolar” because it circles the Northern hemisphere, forming a ring around the North Pole, just south of the Arctic Circle, the boreal zone covers 1.9 billion ha, 14% of earth’s land, and 33% of earth’s forested area. Canada, Russia, the United States, Norway, Sweden, China and a few others are the countries with forests and land in the boreal zone. Most of Canadian forests and woodlands (75%) is located in the Canadian boreal area, which represents 28% of the world’s boreal zone [1].
Silvicultural management such as spacing between trees is used to improve forests productivity, shorten rotation age and meet the increasing demand in woody raw material [2,3,4,5]. Although intensive studies have been done to determine the impact of spacing between trees on tree growth and wood volume [6], studies of the effects of spacing on wood properties have been limited to wood density (ring density (RD), all acronyms used in this text are listed in Table 1) and some macroscopic characteristics, or, for many species, absent [5]. As for many commercial tree species in the Canadian boreal forests, impacts of spacing between trees on many Wood Quality Attributes (WQA) of white spruce (Picea glauca (Moench) Voss) remain to be clarified.
Ring width (RW) is often used to evaluate growing performances at tree level [7] and, although easy to measure and often related to WQA, it is insufficient to evaluate wood quality [8]. RD is probably the most studied WQA [3]. It is the key property affecting both the stiffness and strength of structural timber [9], guides raw material selection in veneers and appearance products manufacturing [9,10], determine the pulp yield and the quality of paper products [11,12], and also the biomass calorific value and carbon sequestration [13,14]. Less investigated WQA include tracheid length (TL), tracheid diameter (TD), latewood proportion (LWP), intra-ring density variation (IDV), ring area (RA), earlywood width (EWW) and latewood width (LWW). Tracheids represent 92.5% of wood volume in white spruce [15]. TL and TD have significant impacts on the quality of the pulp and paper and fibre-based products [16].
The radial pattern of variation in wood properties is usually designated by the number of annual rings counting from the pith outward (RFP), also known as the cambial age of the ring. Changes in the radial trends are used to define the juvenile wood (JW) and mature wood (MW) zones [17]. TD radial and longitudinal variations explain a tree’s adaptation strategy to overcome hydraulic resistance [18,19]. Variations in TL and TD have not often been addressed [20] because measuring anatomical properties is both time consuming and expensive [21]. LWP is the key property determining RD value [5,22,23,24,25]. IDV is an indication of the uniformity of wood density inside a growth ring, and is highly correlated with RD and RW components, especially in the latewood [24]. A greater uniformity (lower IDV) is valuable for veneer production [10]. RA tells us about tree growth in both the radial and tangential directions [4]. Growth-related (RW, EWW, LWW, RA and LWP), anatomical (TL and TD) and physical (RD and IDV) WQA are known to change from pith to bark [26], with tree height [27], and in the tree’s juvenile and mature wood zones [26]. These changes are mainly due to cambium aging and the proximity of the active living crown [2].
Within ring growth variation is due to transition from earlywood to latewood [28]. The earlywood zone is produced under the strong influence of growth hormones, especially indole-3-acetic-acid (IAA, auxin) at the beginning of the growth season, when newly formed buds are actively elongating, and earlywood production proceeds downward towards the tree [3,29]. Latewood production coincides with the cessation of shoot elongation, proceeds upward towards the crown, and has thicker cell walls, as a result of greater photosynthate availability [3,29]. Earlywood width (EWW) is more correlated with RW than latewood width (LWW) [23].
RW increases with increasing spacing in white spruce [30], black spruce (Picea mariana (Mill.) B.S.P.) [4,6,31], and radiata pine (Pinus radiata D. Don) [5]. With increasing RW, a significant decrease has been observed in TL for Norway spruce (Picea abies (L.) Karst) [32,33], radiata pine [5], and Jack pine (Pinus banksiana Lamb.) [34]. RD is also negatively influenced by increasing RW in white spruce [30,35], black spruce [6,23,31], Norway spruce [36] and Jack pine [34]. However, other researchers rather found positive relationships between increased RW and RD in balsam fir (Abies balsamea Mill) [24] and jack pine [37]. Similarly, a positive relationship between RW and TL was documented for white spruce [30]. Brändström [38] reported an increase in TD with RW in Norway spruce. Yang and Hazenberg [31] found both an increase and a decrease of TL with RW for black spruce depending on the spacing. Similarly, Dinwoodie [39] found both an increase and a decrease of TL with RW, for Sitka spruce (Picea sitchensis (Bong.) Carr.) depending on the position (juvenile, transition and mature wood) in the tree core. Some of the discrepancies may be related to species-specific differences, sampling strategies or age factor [40].
Sampling height and its relationship with living crown also affects changes in WQA [18]. Although an increased RW could be associated with significant variations in other WQA, many researchers found that the variations in RD [2,3,41,42], TL [2,30,33,43], and TD [5] with the growth rate is limited and without practical implications. Furthermore, even when significant variations due to silvicultural management were found for RD and tracheid dimensions, they were within the range of variations caused by age, height, genotype and geographic locations [40]. These observations have led to the conclusion that stand productivity may be improved without sensible loss of wood quality [2,43,44]. However, one must keep in mind the highly relevant age effects and avoid generalizing results of the fast-grown young trees with a high JW proportion to older trees with comparable dimensions but lower JW proportion [40].
In comparison to MW, JW is composed of shorter, smaller tracheids with thinner walls, larger microfibril angles, larger spiral grain angles, lower tangential and higher longitudinal shrinkage, lower holocellulose and alpha cellulose content, higher lignin and hemicellulose content, and lower strength properties [7]. JW is found near the pith and transitions to MW toward the bark of older trees. It is formed under the strong regulatory influence of the active living crown, where growth hormones, particularly auxin, are synthesized [45]. Therefore, isolated or very widely spaced trees with a deep crown as well as the top of all trees are generally assumed to be composed entirely of JW [3,46]. The impact of spacing between trees on WQA was found to change between JW and MW [30,47,48], with JW being more sensitive to spacing than MW [30,31], supporting the suggestion that these wood zones should be considered as distinct populations [49].
White spruce has a broad ecological niche and occurs in pure stands as well as in mixed stands in association with a wide variety of both coniferous and deciduous species in the boreal forests [50]. As such, it is widely distributed across North America, extending from Newfoundland in the east to northwestern Alaska in the west. Its latitudinal range is from the northern treeline across the continent, south (in the Western Cordillera) to southern British Columbia and Alberta, following the southern boreal boundary in the prairie provinces (Alberta, Saskatchewan, Manitoba) and east along the northern tier states from Minnesota to Maine [51]. The impact of spacing on WQA may be species- specific in nature and not showing any universal trend [30]. Therefore, establishing accurate relationships between white spruce growth as affected by spacing between trees and WQA in both JW and MW would contribute to better-informed decisions about spacing selection for specific end uses.
The objectives of this study were: to evaluate the impacts of spacing intensities on selected WQA of white spruce, to evaluate the impacts of sampling heights on these WQA, and to compare trends in JW and MW zones. Radial variations of white spruce selected WQA were also explored. To our knowledge, the influence of spacing between trees on IDV in white spruce has not yet been assessed.

2. Materials and Methods

2.1. Stand Description

The material used in this study comes from a spacing experiment. The study site consisted of a plantation established in 1967 in the Petawawa Research Forest, Ontario, Canada (lat. 45.59° N, long. 77.25° W, elev. 168 m) with four square spacing intensities between trees: 1.2 m, 1.8 m, 4.3 m, and 6.1 m. Four apparently healthy trees were randomly sampled within each spacing treatment. All 16 trees used in this study were felled and pruned once on the ground in July 2008 [18].

2.2. Sample Collection, Preparation, and Wood Quality Attribute Assessments

Stem discs were collected from felled trees at 1.3 m, 4.3 m, 7.3 m, and 10.3 m. Two 1.86 mm (tangential) adjacent strips centred on the pith were sawn bark to bark from each disc. One single radius per strip was carefully selected for the analyses. Direction was random, avoiding compression wood and knots. The first strip per disc was used for measurement of growth-related (RW, EWW, LWW, RA, and LWP) and physical properties (RD, maximum ring density and minimum ring density). These properties were measured at a 25 µm linear resolution step size with an X-ray densitometer (Quintek Measurements Systems QMS model QTRS-01X, Knoxville, TN, USA). The boundary between earlywood and latewood was delineated using the intra-ring wood density profile and the maximum derivative method [10]. Intra-ring density variation was computed as the difference between the maximum and minimum densities of the ring. Using the second wood strip, wood sticks from earlywood and latewood were taken at 3, 6, 9, 12, 15, 20, 25, and 30 growth rings. This sampling was performed at a fixed growth ring and not at determined calendar years [18]. Wood sticks were macerated using a Franklin [52] solution consisting of (1:1 v/v) hydrogen peroxide diluted to 30% and concentrated glacial acetic acid. Each stick was placed in a separate test tube of Franklin solution, and the tube immersed in hot distilled water (85–90 °C) for 5 to 6 h until complete lignin dissolution. Delignified wood sticks were gently shaken in water with a laboratory blender to obtain a tracheid suspension. Earlywood and latewood TL were measured with a Fibre Quality Analyzer, LDA02 FQA (Op Test Equipment Inc. Hawkesbury, Ontario, Canada). A total of 4000 tracheids were measured in every sample. The TL in each zone was measured as the weight weighted length, LWW = ΣniLi3/ΣniLi2 (where i = 1, 2, 3 … N categories; n = fibre count in the (ith) category; L = contour length). Using this method, measurements were similar to true TL measurements and controlled for the bias caused by the large number of fines generated during the preparation process [21,32]. Average ring TL and TD were computed by weighting TL and TD of each wood zone with the relative RW.

2.3. Statistical Analyses

Analyses of variance were performed using the lme function of the nlme package [53] of R-4.2.1with R Studio version 4.1.0 [54,55]. Prior to analyses, conditions for linear model, i.e., linearity, normality, and homogeneity of variances were tested by visual inspection using the plot function of R. When those conditions were not met, a natural logarithm transformation was performed to the concerned WQA, which were RW, LWP, RA, EWW, and LWW. All fitted models aimed to explain how a given wood quality attribute (RW, RD, IDV, LWP, TL, TD, RA, EWW, and LWW) varied: radially (i.e., inter-ring variation), longitudinally (i.e., intra-ring and inter-height variation) restricted to the juvenile wood section, from tree to tree (i.e., inter-tree variation) irrespective of the spacing treatment applied, and following spacing treatment performed (i.e., spacing between trees impact). Plot, i.e., spacing treatment, was the experimental unit, and all the analyses were performed at breast height (1.3 m) except for the intra-ring and inter-height variation of juvenile wood which included all the stem heights (1.3 m, 4.3 m, 7.3 m, and 10.3 m). Model 1 was used to test inter-ring, intra-ring, and inter-tree effects (at breast height) on WQA. Model 2 was used to test the effects of combined spacing treatment and height on WQA.
Yi = β0 + β1Xi + γi + εi
where Y is the response variable representing a wood quality attribute (WQA) and X the predictor variable explaining a WQA, for the ith Tree. The predictor X was RFP for the inter-ring effects, Height for the intra-ring effects, and Tree for the inter-tree effects. The predictors RFP and Height were considered as categorical variables. The models also included γ as a tree random effect (γi ~ N(0, σ i 2 )) and εi as an error term (εi ~ N(0, σ i 2 )). The intercept is β0 and the coefficient of the predictor is β1. For the inter-ring analysis, tree rings occurred each year, so that we considered a first-order autoregressive AR(1) correlation.
Spacing between trees and height effects on WQA were tested using the following model:
Yi = β0 + β1Si + β2Hi + β3SiHi + γi + εi,
where Y is a WQA, S the spacing between trees, H tree height, along with their interaction for the ith Tree, γ and εi are as previously described. β0 to β3 represent the intercept and the coefficients for spacing, height, and their interaction, respectively. The predictors S and H were considered as categorical variables.
For all models, predictors were considered significant at p < 0.05 based on F-test. Significant responses always prompted us to check which levels of this predictor variable were significant based on a t-test. t-tests were performed on estimated marginal means, with p-value adjustments for multiple comparisons using Bonferroni correction.

3. Results

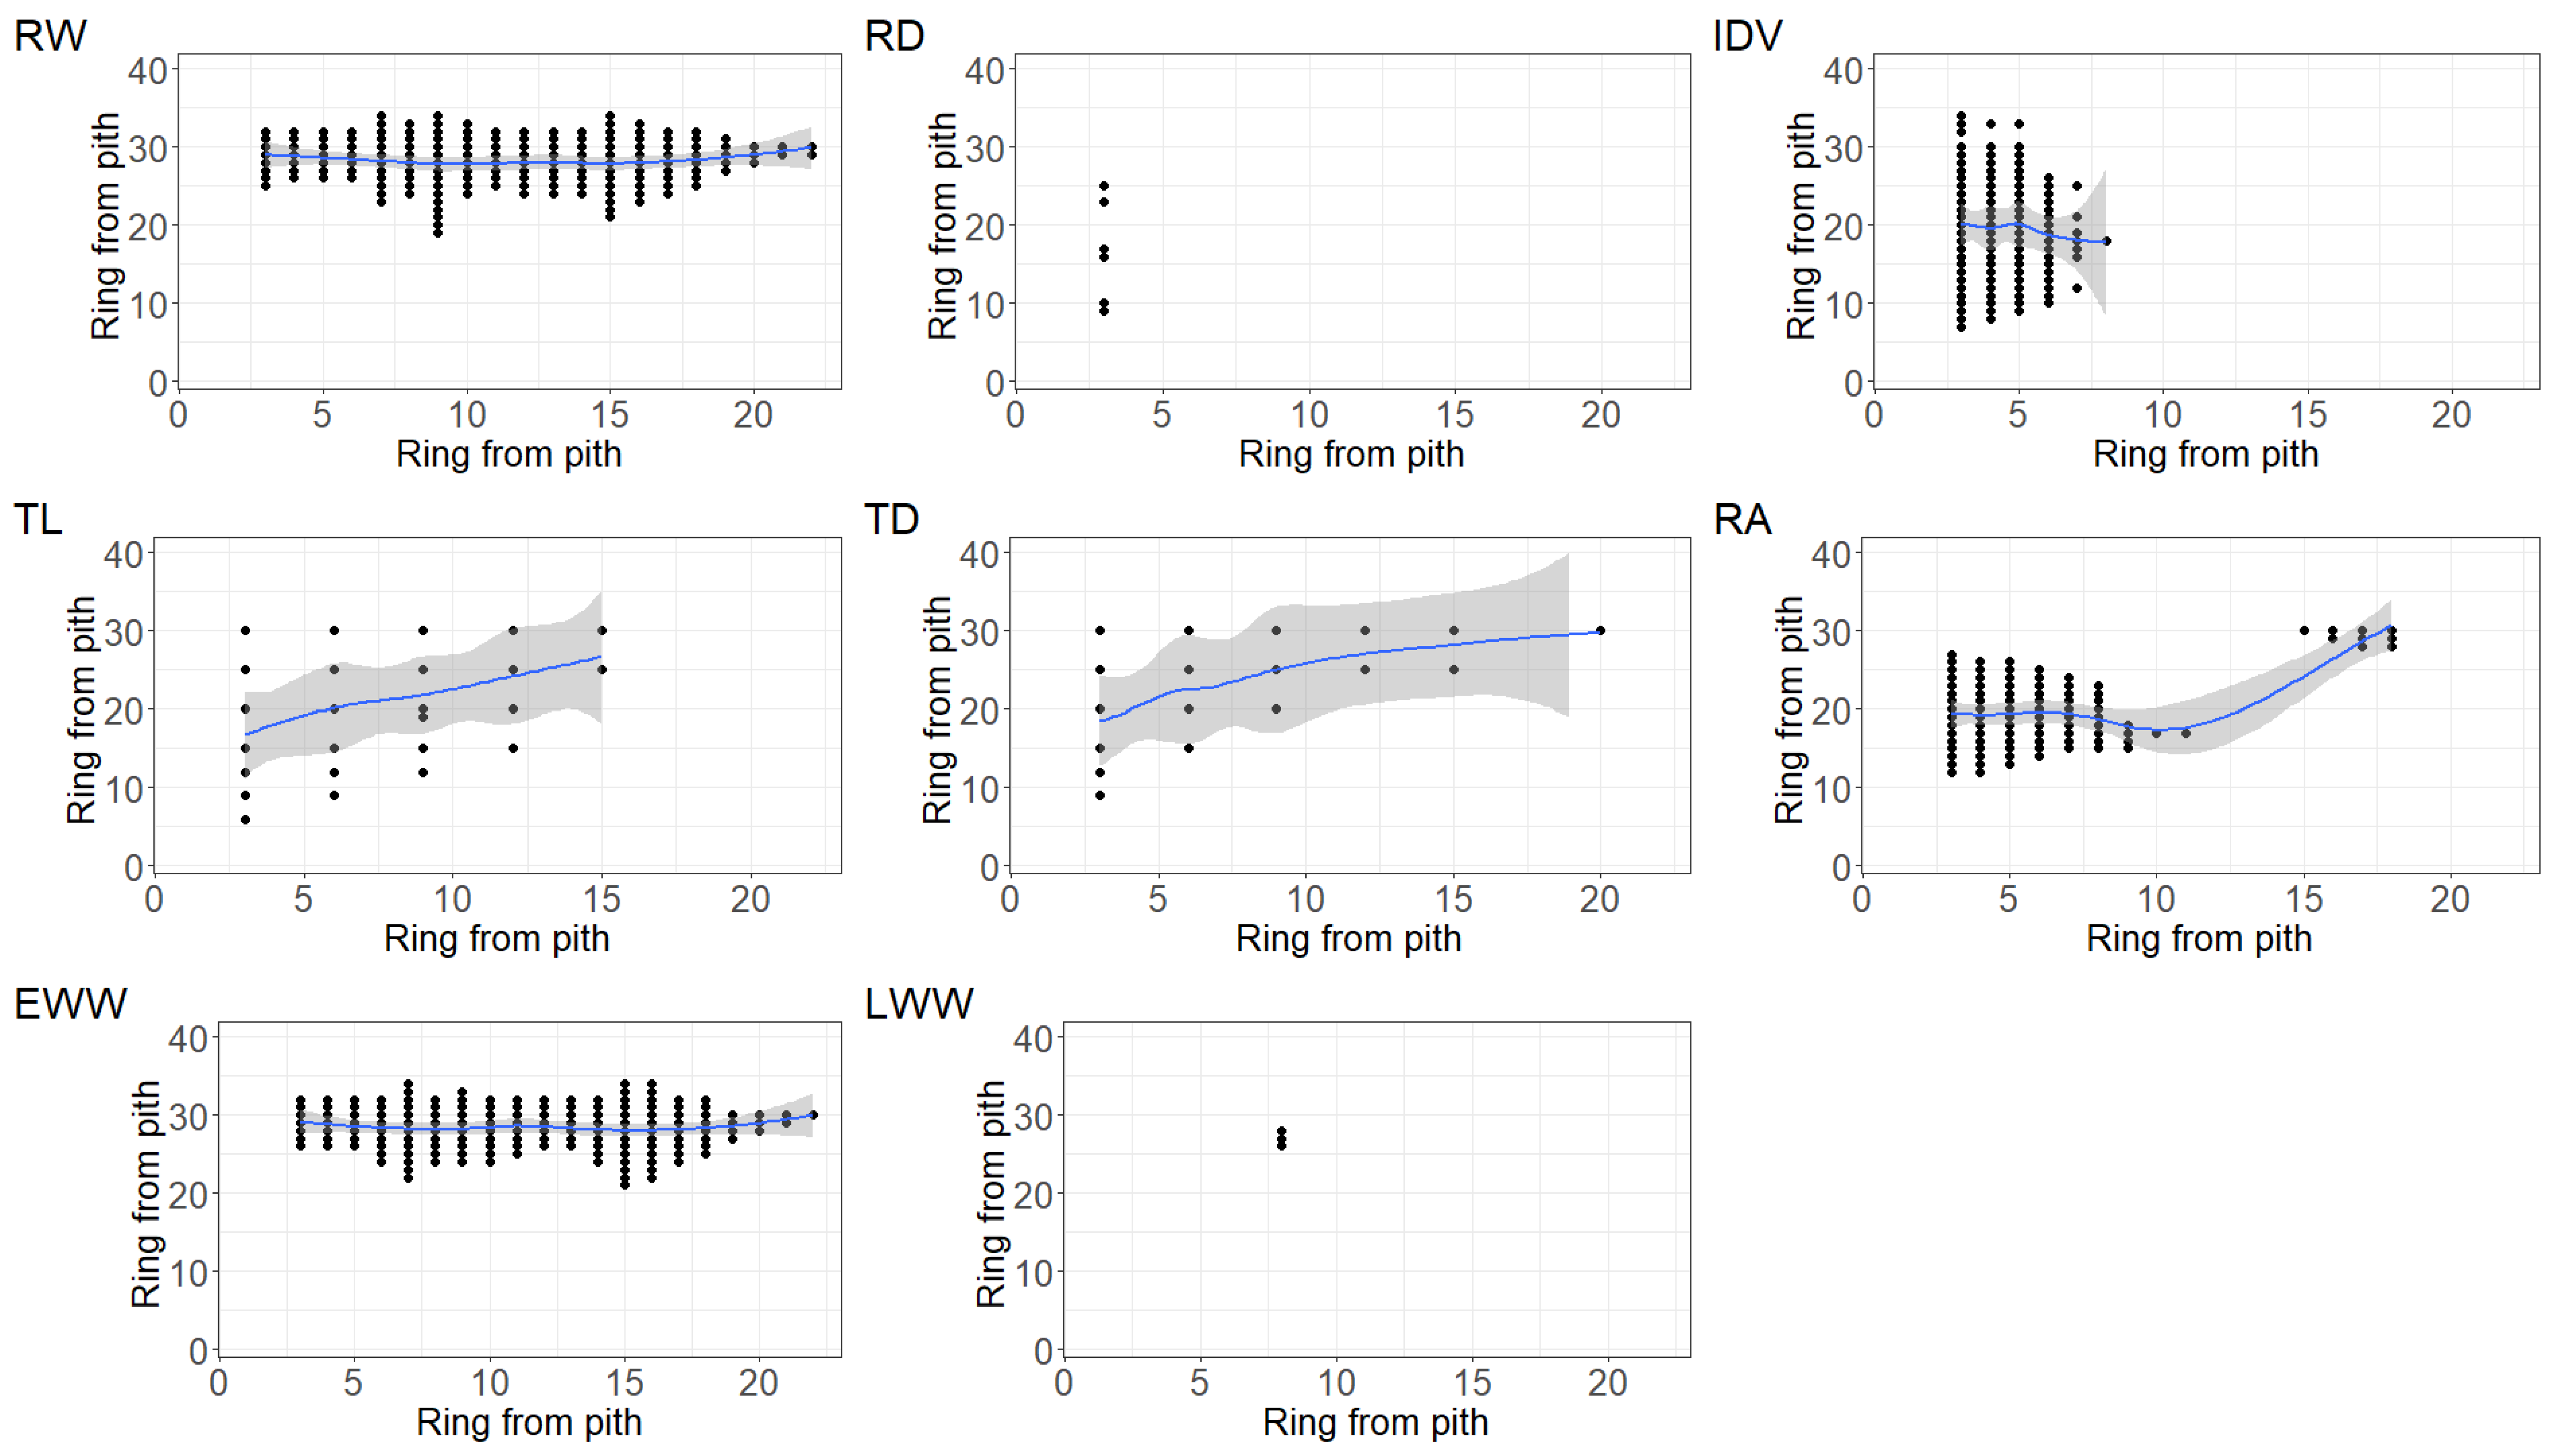
3.1. Inter-Ring Radial Variation at Breast Height

Inter-ring radial variation at breast height was significantly different for RW, RD, TL, TD, IDV, RA, EWW, and LWW whereas it did not vary for LWP (Table 2—Part 1). RW (and EWW) slightly increased from pith to the 7th ring (1.2 and 1.8 m spacing) and to the 15th ring (4.3 and 6.1 m spacing) before decreasing toward the bark. LWW decreased from pith to bark (1.2 and 1.8 m spacing), while no clear pattern was exhibited in wider spacings (4.3 and 6.1 m). RA slightly increased from pith to the 10th ring (1.2 and 1.8 m spacing) before levelling off. RA increase lasted until the 17th ring (4.3 and 6.1 m spacing) before decreasing toward the bark. While RD increased toward the bark in the 1.2 and 1.8 m spacing, a decreasing trend was observed at 4.3 and 6.1 m spacing. Increasing RFP was associated with longer and wider tracheids. IDV sharply increased for the first 10 rings and tended to level off thereafter (graph not shown).
Figure 1 gives an easy and quick overview of the paired comparisons between the 9 studied WQA. This figure also shows the relationships between juvenile and mature wood. In this figure, RFP is the label in both the x-axis and the y-axis, like the matrix representation of WQA one can find in a table. By doing so, we were able to compare all possible variations of a given WQA between rings. Only significant comparisons were represented with a dot in Figure 1, meaning that all blank spaces (and missing rings) are non-significant comparisons.
At a first glance, patterns of paired rings comparisons were different between wood quality attributes (Figure 1). For RW, no significant difference was noted between the first 23 rings (except for ring 9 vs. ring 19 and consecutive rings), while those later were generally different from the 25th ring onward. For EWW, rings between 3 and 22 were not different amongst them (except for ring 15 vs. ring 21). These rings were all different from ring 22 onwards. Ring 3 was significantly different from rings 26–30 and ring 22 was significantly different from only ring 30. For TL, there was no difference in the mature wood zone. There were few significant paired comparisons among TL in rings of the juvenile wood, but more were found between TL in the juvenile wood vs. TL in the mature wood. Except for a single significant paired comparison in the MW, TD behaves similarly to TL, but with fewer significant paired comparisons among TD in rings of the JW section. For IDV, with very few exceptions, most of the variations involved the first 7 rings against values in ring 10 onward. For RA, ring 3 was significantly different from ring 12 to 27, and all other rings between 3 and 12 were significantly different from rings 12 to 26, at the most. For these comparisons, the higher the rank of the ring, the fewer the differences from other rings. Few other RA differences were found between rings 15–18 vs. rings 28–30. For RD, the handful of significant paired comparisons all involved ring 3 (vs. rings 9, 10, 16, 17, 23 and 25). For LWW, only ring 8 was noted to be significantly different from rings 26, 27, and 28. LWP was purposely dropped from Figure 1 due to consistent patterns between rings (totally blank figure).

3.2. Variations between Wood Type

Mean values of all selected WQA are presented in Table 3—Part 1 for the four heights, Table 3—Part 2 for the four spacing between trees and Table 3—Part 3 for the JW and the MW zones. Diagnostics of WQA were performed by analyzing the data dispersion (Figure 2). In the following descriptions, range will refer to the interquartile range (25th–75th percentile) rather than the minimum and maximum values. For RW and EWW, radial variation was similar in the two wood types; however, the values of RW were higher in JW compared to MW (Figure 2). RD and LWP approximately had same ranges and median between juvenile and mature wood. More variability for TL and TD was observed in JW compared to MW. TL and TD were greater in the mature compared to the juvenile wood. The ranges of IDV were similar between wood types, but IDV values were higher in the MW compared to the JW. The range of RA was approximately twice as large for MW compared to JW, whereas the median of JW was lower than median of MW. LWW had a lower median value in MW.

3.3. Inter-Tree Variation of Wood Quality Attributes at Breast Height

Inter-tree variation at breast height of WQA were assessed according to their intercept or initial value and to the slope of the Tree predictor (Table 2—Part 2). Overall, the intercepts for inter-tree initial variations were significant for all WQA. As shown by their slopes, inter-tree effects were also significant for RW, RD, IDV, TD, RA, EWW, LWW, and LWP. By contrast, there were no significant tree effects on TL.

3.4. Effects of Spacing between Trees and Height on Juvenile Wood Quality Attributes

For RW, the ranges of intra-ring longitudinal variation of juvenile wood of WQA were quite similar between 4.3, 7.3 and 10.3 m, and lower at 1.3 m, with the median higher in 4.3 m compared to other tree heights (Figure 3). The two lower heights (1.3 m and 4.3 m) had comparable mean RW, and the two upper heights (7.3 and 10.3 m) comparable mean RW. RW was greater at lower heights compared to upper heights (Table 3—Part 1). Ranges (and medians) of RD were similar along the stem. Although a slight decreasing trend could be observed with increasing height, mean RD were comparable along the stem. Range of IDV was lower at 4.3 m and comparable for other heights. Their medians displayed a decreasing trend between 4.3 and 10.3 m height, while the value at 1.3 m was lower than its counterparts at 4.3 and 7.3 m, and higher at 10.3 m. Mean IDV were comparable between 1.3 and 10.3 m, and decreased with height starting at 4.3 m. For LWP, the largest range was observed at 4.3 m while it was comparable for the other heights. For all heights, LWP was right skewed due to higher frequency of high values above the median, especially at 4.3 m. Mean LWP were comparable along the stem. Ranges of TL hardly differed with height along the stem, with a left skew at 4.3 m, contrasting with small right skew at 1.3 m and 7.3 m. Mean TL was comparable along the stem. TD was left skewed at 1.3 m and 4.3 m height, contrasting with right skew at 7.3 m height. Mean TD was comparable along the stem. Ranges of RA were greater at 4.3 m followed by 1.3 m, 7.3 m, and 10.3 m, respectively. It was right skewed at all heights. Mean RA decreased with height starting at 4.3 m. Although smaller than the highest value (at 4.3 m), the value at 1.3 m was higher than values at 7.3 and 10.3 m. The range of LWW was greater at 4.3 m compared to the other heights, which were similar. It was right skewed at all height (Figure 3). Mean LWW were comparable along the stem (Table 3—Part 1).
Intra-ring longitudinal variation of juvenile wood was significant for RW, IDV, TL, RA, EWW, and LWW, whereas LWP, TD, and RD did not change, (Table 2—Part 3). Breast height RW did not show a linear trend, as it was significantly higher only compared to height 7.3 m. Similarly, RW was significantly higher for height 4.3 m when contrasted with height 7.3 m and 10.3 m, respectively. TL was significantly lower at breast height compared to height 4.3 m. There was also significant lower IDV in 1.3 m compared to 4.3 m. By contrast, IDV was significantly higher in 4.3 m compared to 10.3 m, and also 7.3 m compared to 10.3 m.
The effects of spacing and sampling height interacted for RA, IDV and LWW (Table 2—Part 4). While spacing did not show any significant effect on IDV, height and its interaction with spacing did significantly affect IDV. Both spacing and height independently affected the three components of radial growth (RW, EWW and LWW). By contrast, no significant effects of spacing between trees, height, or their interaction were found for RD, LWP, TL, and TD.
Contrast analyses for different spacings were performed on wood quality attributes significantly affected by spacing, height or their interaction. Hence, a pairwise comparison per spacing was conducted for RW for different heights. In summary, RW significantly increased at all heights between the spacings: 1.2 vs. 6.1, 1.8 vs. 6.1 and 1.2 vs. 4.3 (with the exception of height 10.3 m). The contrast 1.8 vs. 4.3 was also significant at heights 1.3 m and 4.3 m. Except for breast height, RW did not significantly increase between the spacings 4.3 vs. 6.1. No difference was found between the spacings 1.2 vs. 1.8. Except for the significantly (0.05) lower IDV in the spacing 1.8 compared to 6.1 at 7.3 m height, all other contrasts between spacings between trees and heights were not significant.

4. Discussion

4.1. Impact of Spacing on the Inter-Ring Radial Variation at Breast Height

The initial increase followed by a steady decrease of RW is in agreement with known pattern in white spruce [26,30] and black spruce [4,31]). The longer initial increase pattern with wider spacing agreed with Yang’s [30] study, which found an initial increase for the first 6 rings at square spacings of 1.8 m and 2.7 m, comparable to the increase during the first 7 rings we found at square spacings of 1.2 m and 1.8 m. At wider spacings, the phase of RW increase lasted longer, up to 10 rings at 3.6 m spacing (Yang’s [30] widest spacing), and up to 15 rings at square spacings of 4.3 m and 6.1 m of our study, both of which are wider than Yang’s [30] widest spacing. This longer period of increase may be caused by the elongated crown and delayed self-pruning in the wider spacings, which favours prolonged auxin production [3,40].
In closer spacings, RD presented the type II pattern (RD is high at the pith, decreases with increasing RFP to a minimum, before again increasing) as described by Panshin and de Zeuuw [49] and Schimleck, Dahlen and Auty [22], and reported for white spruce [26,30]. That pattern does not hold in wider spacings, which instead presented the Type III trend (monotonic decrease from pith to bark) [22,49]. It is not uncommon to find different RD patterns with different species, but the type II variation is the one most often reported for spruces. This differences between radial RD patterns of even-aged white spruce growing in the same environment is an interesting result of this study. It may explain why predicting wood density is challenging, compared to other WQA such as tracheid dimensions (TL and TD), RW, microfibril angle, and modulus of elasticity [56,57,58]. In western hemlock (Tsuga heterophylla (Raf.) Sarg.), Fabris [59] found the same type II pattern at different spacings, but age at minimum RD increased with spacing between trees, suggesting that even if spacing intensity does not change the RD pattern type as seen in this study, it may change the location of the inflection point of the radial trend, as seen with RW in this study.
Earlywood TL was found to behave similarly to ring TL [26], allowing comparing our ring TL to Yang’s [30] earlywood TL. As expected, TL and TD followed Sanio’s first law [60] with values increasing from pith to bark, as was also reported in other studies of white spruce [26,30].
LWP and IDV exhibited the same pith-to-bark radial patterns as described for another white spruce study by Mvolo et al. [26]. These consistent patterns suggest that cambium maturation had the same impact on these WQA irrespective of the spacing between trees. The significant impact of cambial age in most of the WQA was expected, as age (ring number from pith) is the first factor explaining WQA variation in the radial direction [26]. The fact that LWP did not vary with age suggest that the relative amounts of EWW and LWW produced over the year did not change significantly.

4.2. Differences between Juvenile Wood and Mature Wood Zones

The mean values presented in Table 3—Part 3, the comparisons summarized in Figure 1 for breast height data and the radial variations in Figure 2 for the whole stem highlight the differences between JW and MW. The higher RW (and EWW) found in the JW compared to the MW (Figure 2) agrees with earlier studies [30,31]. It is explained by the vigorous growth in early growth stages, caused by crown proximity and high production of growth hormones [3]. Figure 1 shows that growth rate (RW, EWW, and LWW) was comparable within the first 20 rings, and that these rings grew larger than rings starting at age 25 from pith (RW and EWW). Alteyrac, Zhang, Cloutier and Ruel [4] preferred RA over RW for transition age determination, and found clearly different maturation ages (i.e., significant differences between a WQA value along the radial profile) with RW and RA, as one can see in Figure 1. The comparable means in both zones and the similar range (Figure 2), as well as the absence of any significant difference in Figure 1, suggest that LWP does not change from JW to MW.
The mean values for RD were comparable in both zones, agreeing with earlier studies [30,31]. Only a handful of significant comparisons were found, all involving the very juvenile third ring. This agrees with an earlier finding that most of the negative impact of growth rate on RD happens in the JW zone [61]. The smaller IDV value near the pith suggests that higher growth rate favors wood uniformity.
Our observations of longer and wider tracheids in the mature wood agrees with earlier studies (Yang [30], Yang and Hazenberg [31]). It is known to be caused by maturation of cambium initial and rate of anticlinal divisions [62]. Most of the variation in TL and TD in Figure 1 involved the same samples. As a rule, the more the rank from pith of a ring increased, the less it showed significant difference with other rings (the opposite was also true).

4.3. Variations Caused by Tree, Sampling Height and Spacing between Trees

Both spacing intensity and sampling height significantly affected the four WQA that were growth rate proxies (RW, RA, EWW, and LWW). Spacing affected none of the other five WQA (RD, IDV, LWP, TL, and TD), although IDV was affected by height. This result is in agreement with findings on white spruce [30], black spruce [4,6] and radiata pine [5]. However, even for instances of significant growth rate (RW) variation, they were registered mostly between widely different spacing (1.2 vs. 6.1, 1.8 vs. 6.1 and 1.2 vs. 4.3), in agreement with finding in white spruce [30] and black spruce [6,31] of comparable age. In agreement with our study, Lasserre, Mason, Watt and Moore [5] also found no difference in tracheid width with spacing in juvenile radiata pine grown in New Zealand. On the other hand, Lasserre, Mason, Watt and Moore [5] observed significant change in TL and LWP, and Lindström [25] showed an increase in TD with ring width in mature Norway spruce grown in Sweden, which contradicted our results. Similar to Lasserre, Mason, Watt and Moore [5] who analyzed only juvenile wood, Yang [30] also found a significant impact of spacing on white spruce juvenile wood RD and TL when contrasting the widest and the narrowest spacings, but no spacing impact was found for their mature wood RD and TL. This suggests that Yang’s [30] significant impact may disappear if the whole pith-to-bark data are aggregated. Overall, this advocates for earlier findings that, except for growth features, stand density management does not significantly impact WQA [2,43,44].
The decreasing of RW with sampling height is in agreement with Alteyrac, Zhang, Cloutier and Ruel’s [4] demonstration that growth rate decreases from the base to the top of the stem. This was explained by reduced activity as cambium matures and, more probably, the reduction of crown proportion (and growth rate), together with increased competition associated with stand age [4]. Alteyrac, Zhang, Cloutier and Ruel [4] also found a significant variation of maximum ring density with sampling height, which can explain the significant variation we found for IDV. However, the lack of variation of RD with sampling height in this study contrasts with Alteyrac, Zhang, Cloutier and Ruel’s [4] finding.
Sampling height affected more WQA than did spacing intensity in our study. Alteyrac, Zhang, Cloutier and Ruel [4] found that variation due to sampling height is larger than that due to stand density. Although it varied less than EWW, the significant impact of both spacing between trees and height on LWW contradicts Zhang and Chauret’s [6] finding in black spruce that most of the variation in ring width is observed in EWW only, while no variation is observed in LWW. Given the reduced significance of the interactions between spacing intensity and sampling height, our study agreed with Alteyrac, Zhang, Cloutier and Ruel [4] in concluding that the influence of stand density on wood traits (mainly growth features) is additive and remains the same regardless of sampling height. By contrast, in our study, variations between moderately different spacing (1.8 vs. 4.3 and 4.3 vs. 6.1) applied only at given heights and may not represent a meaningful rationale to base decision on if increasing the whole tree/stand production is the main goal. This support Echols’ [47] and Yang’s [30] conclusion that optimal spacing for growth rate and volume production lies somewhere between wide (greatest diameter growth) and narrow (maximum tree number without inducing mortality due to competition) spacings.

5. Conclusions

The objective of this study was to improve our understanding of the relationship between growth rate in four square spacing intensities between trees (1.2 m, 1.8 m, 4.3 m, and 6.1 m) and nine selected wood quality attributes. Only growth rate proxies (ring width, earlywood width, latewood width and ring area) are affected by spacing between trees. Based on ring width, this happens only when widely different spacing (1.2 vs. 6.1, 1.8 vs. 6.1 and 1.2 vs. 4.3) are considered. One can therefore advise growing bigger trees through wider spacing to lower rotation age, after determining the optimal spacing for growth rate and volume production. Sampling height affected more wood quality attributes (ring width, earlywood width, latewood width, ring area and intra-ring density variation) than did spacing intensity. Some wood quality attributes were found to greatly change from juvenile wood to mature wood (ring width, earlywood width, ring area, tracheid length, tracheid diameter and intra-ring density variation) while other wood quality attributes showed a limited (ring density and latewood width) or totally absent (latewood proportion) variation. However, no significant effects of spacing between trees, height, and their interaction were found on the remaining (ring density, latewood proportion, tracheid length, and tracheid diameter) wood quality attributes. Since wood quality is a subjective judgment one makes based on the end use of the resource and preferably in economic terms, one must also keep in mind that other wood quality attributes not considered in this study (knots, taper, stem form, compression wood, spiral grain, juvenile wood proportion, lignin and extractive proportion, strength and stiffness) may be negatively impacted by wide spacing.

Author Contributions

Conceptualization, C.S.M.; methodology, C.S.M. and A.K.; formal analysis, V.G.; resources, C.S.M., A.K. and J.D.S.; data curation, C.S.M.; writing—original draft preparation, C.S.M. and V.G.; writing—review and editing, C.S.M., V.G., A.K. and J.D.S.; supervision, C.S.M.; funding acquisition, C.S.M., A.K., and J.D.S. All authors have read and agreed to the published version of the manuscript.

Funding

Natural Resources Canada funded this research through the Forest Innovation Program (FIP).

Institutional Review Board Statement

Not applicable.

Informed Consent Statement

Not applicable.

Data Availability Statement

Contact corresponding author for data sharing.

Acknowledgments

C.S.M. is grateful to M. Christopher Helmeste for constructive discussions in an earlier stage of this project.

Conflicts of Interest

The authors declare no conflict of interest.

References

  1. Natural Resources Canada. 8 Facts about Canada’s Boreal Forest. Available online: https://www.nrcan.gc.ca/our-natural-resources/forests/sustainable-forest-management/boreal-forest/8-facts-about-canadas-boreal-forest/17394 (accessed on 26 October 2022).
  2. Herman, M.; Dutilleul, P.; Avella-Shaw, T. Growth rate effects on temporal trajectories of ring width, wood density, and mean tracheid length in Norway spruce (Picea abies (L.) Karst.). Wood Fiber Sci. 1998, 30, 6–17. [Google Scholar]
  3. Larson, P.R.; Kretschmann, D.E.; Clark, A., III; Isebrands, J.G. Formation and Properties of Juvenile Wood in Southern Pines: A Synopsis; General Technical Report, FPL-GTR-129; Department of Agriculture, Forest Service, Forest Products Laboratory: Madison, WI, USA, 2001; p. 42. [Google Scholar]
  4. Alteyrac, J.; Zhang, S.Y.; Cloutier, A.; Ruel, J.C. Influence of stand density on ring width and wood density at different sampling heights in black spruce (Picea mariana (Mill.) B.S.P.). Wood Fiber Sci. 2005, 37, 83–94. [Google Scholar]
  5. Lasserre, J.-P.; Mason, E.G.; Watt, M.S.; Moore, J.R. Influence of initial planting spacing and genotype on microfibril angle, wood density, fibre properties and modulus of elasticity in Pinus radiata D. Don corewood. For. Ecol. Manag. 2009, 258, 1924–1931. [Google Scholar] [CrossRef]
  6. Zhang, S.Y.; Chauret, G. Impact of Initial Spacing on Tree and Wood Characteristics, Product Quality and Value Recovery in Black Spruce (Picea Mariana); Forintek Canada Corp: Fredericton, NB, Canada, 2001. [Google Scholar]
  7. Zobel, B.J.; Sprague, J.R. Juvenile Wood in Forest Trees; Springer Series in Wood Science: Berlin/Heidelberg, Germany, 1998; p. 300. [Google Scholar]
  8. Drew, D.M.; Downes, G.M.; Seifert, T.; Eckes-Shepard, A.; Achim, A. A Review of Progress and Applications in Wood Quality Modelling. Curr. For. Rep. 2022, 1–16. [Google Scholar] [CrossRef]
  9. Cown, D.J. Corewood (juvenile wood) in Pinus radiata—Should we be concerned? N. Z. J. For. Sci. 1992, 22, 87–95. [Google Scholar]
  10. Koubaa, A.; Zhang, S.Y.; Makni, S. Defining the transition from earlywood to latewood in black spruce based on intra-ring wood density profiles from X-ray densitometry. Ann. For. Sci. 2002, 59, 511–518. [Google Scholar] [CrossRef]
  11. Jozsa, L.A.; Middleton, G.R. A Discussion of Wood Quality Attributes and Their Practical Implications; FPInnovations; Special Publication SP-34: Vancouver, BC, Canada, 1994; p. 42. [Google Scholar]
  12. Molteberg, D.; Hoibo, O. Modelling of wood density and fibre dimensions in mature Norway spruce. Can. J. For. Res. 2007, 37, 1373–1389. [Google Scholar] [CrossRef]
  13. Bowyer, J.L.; Shmulsky, R.; Haygreen, J.G. Le Bois Et Ses Usages; Centre collégial de développement de matériel didactique: Montréal, QC, Canada, 2005; p. 528. [Google Scholar]
  14. Obernberger, I.; Thek, G. Physical characterisation and chemical composition of densified biomass fuels with regard to their combustion behaviour. Biomass Bioenergy 2004, 27, 653–669. [Google Scholar] [CrossRef]
  15. Law, K.N.; Lapointe, M. Chemimechanical pulping of boles and branches of white spruce, white birch, and trembling aspen. Can. J. For. Res. 1983, 13, 412–418. [Google Scholar] [CrossRef]
  16. Beaulieu, J. Genetic variation in tracheid length and relationships with growth and wood traits in eastern white spruce (Picea glauca). Wood Fiber Sci. 2003, 35, 609–616. [Google Scholar]
  17. Mvolo, C.S.; Koubaa, A.; Beaulieu, J.; Cloutier, A.; Mazerolle, M.J. Variation in Wood Quality in White Spruce (Picea Glauca (Moench) Voss). Part I. Defining the Juvenile—Mature Wood Transition Based on Tracheid Length. Forests 2015, 6, 183–202. [Google Scholar] [CrossRef] [Green Version]
  18. Mvolo, C.S.; Koubaa, A.; Defo, M.; Beaulieu, J.; Yemele, M.-C.; Cloutier, A. Prediction of tracheid length and diameter in white spruce (Picea glauca (Moench) Voss). IAWA J. 2015, 36, 186–207. [Google Scholar] [CrossRef]
  19. Olson, M.E.; Anfodillo, T.; Rosell, J.A.; Petit, G.; Crivellaro, A.; Isnard, S.; León-Gómez, C.; Alvarado-Cárdenas, L.O.; Castorena, M. Universal hydraulics of the flowering plants: Vessel diameter scales with stem length across angiosperm lineages, habits and climates. Ecol. Lett. 2014, 17, 988–997. [Google Scholar] [CrossRef] [PubMed]
  20. Anfodillo, T.; Petit, G.; Crivellaro, A. Axial conduit widening in woody species: A still neglected anatomical pattern. IAWA J. 2013, 34, 352–364. [Google Scholar] [CrossRef]
  21. Fries, A.; Ericsson, T.; Morling, T. Measuring relative fibre length in Scots pine by non-destructive wood sampling. Holzforschung 2003, 57, 400–406. [Google Scholar] [CrossRef]
  22. Schimleck, L.R.; Dahlen, J.; Auty, D. Radial patterns of specific gravity variation in North American conifers. Can. J. For. Res. 2022, 52, 889. [Google Scholar] [CrossRef]
  23. Koubaa, A.; Zhang, S.Y.; Isabel, N.; Beaulieu, J.; Bousquet, J. Phenotypic correlations between juvenile-mature wood density and growth in black spruce. Wood Fiber Sci. 2000, 32, 61–71. [Google Scholar]
  24. Koga, S.; Zhang, S.Y. Relationships between wood density and annual growth rate components in balsam fir (Abies balsamea). Wood Fiber Sci. 2002, 34, 146–157. [Google Scholar]
  25. Lindström, H. Fiber length, tracheid diameter, and latewood percentage in Norway spruce: Development from pith outwards. Wood Fiber Sci. 1997, 29, 21–34. [Google Scholar]
  26. Mvolo, C.S.; Koubaa, A.; Beaulieu, J.; Cloutier, A.; Defo, M.; Yemele, M.-C. Phenotypic correlations among growth and selected wood properties in white spruce (Picea glauca (Moench) Voss). Forests 2019, 10, 589. [Google Scholar] [CrossRef] [Green Version]
  27. Auty, D.; Achim, A.; Macdonald, E.; Cameron, A.D.; Gardiner, B.A. Models for predicting clearwood mechanical properties of scots pine. Forest science 2016, 62, 403–413. [Google Scholar] [CrossRef] [Green Version]
  28. Lenz, P.; Cloutier, A.; MacKay, J.; Beaulieu, J. Genetic control of wood properties in Picea glauca—An analysis of trends with cambial age. Can. J. For. Res. 2010, 40, 703–715. [Google Scholar] [CrossRef]
  29. Rossi, S.; Deslauriers, A.; Griçar, J.; Seo, J.W.; Rathgeber, C.B.K.; Anfodillo, T.; Morin, H.; Levanic, T.; Oven, P.; Jalkanen, R. Critical temperatures for xylogenesis in conifers of cold climates. Glob. Ecol. Biogeogr. 2008, 17, 696–707. [Google Scholar] [CrossRef]
  30. Yang, K.C. Impact of spacing on juvenile wood and mature wood properties of white spruce (Picea glauca). Taiwan J. For. Sci. 2002, 17, 13–29. [Google Scholar]
  31. Yang, K.C.; Hazenberg, G. Impact of spacing on tracheid length, relative density, and growth rate of juvenile wood and mature wood in Picea mariana. Can. J. For. Res. 1994, 24, 996–1007. [Google Scholar] [CrossRef]
  32. Herman, M.; Dutilleul, P.; Avella-Shaw, T. Intra-ring and inter-ring variations of tracheid length in fast-grown versus slow-grown Norway spruces (Picea abies). IAWA J. 1998, 19, 3–23. [Google Scholar] [CrossRef] [Green Version]
  33. Jaakkola, T.; Makinen, H.; Saren, M.P.; Saranpaa, P. Does thinning intensity affect the tracheid dimensions of Norway spruce? Can. J. For. Res. 2005, 35, 2685–2697. [Google Scholar] [CrossRef]
  34. Kang, K.Y.; Zhang, S.Y.; Mansfield, S.D. The effects of initial spacing on wood density, fibre and pulp properties in jack pine (Pinus banksiana Lamb.). Holzforschung 2004, 58, 455–463. [Google Scholar] [CrossRef]
  35. Corriveau, A.; Beaulieu, J.; Mothe, F. Wood density of natural white spruce populations in Quebec. Can. J. For. Res. 1987, 17, 675–682. [Google Scholar] [CrossRef]
  36. Dutilleul, P.; Herman, M.; Avella-Shaw, T. Growth rate effects on correlations among ring width, wood density, and mean tracheid length in Norway spruce (Picea abies). Can. J. For. Res. 1998, 28, 56–68. [Google Scholar] [CrossRef]
  37. Fu, S.; Chen, H.Y.H.; Bell, F.W.; Sharma, M.; Delaney, J.R.; Peterson, G. Effects of timing of glyphosate application on jack pine, black spruce, and white spruce plantations in northern Manitoba. For. Chron. 2008, 84, 37–45. [Google Scholar] [CrossRef] [Green Version]
  38. Brändström, J. Micro and ultrastructural aspects of Norway spruce tracheids: A review. IAWA J. 2001, 22, 333–353. [Google Scholar] [CrossRef] [Green Version]
  39. Dinwoodie, J.M. Variation in Tracheid Length in Picea Sitchensis CARR; Special Report No 16; Department of Scientific and Industrial Research, Forest products research Laboratory: Princes Risborough, United Kingdom, 1963; p. 60. [Google Scholar]
  40. Briggs, D.G.; Smith, W.R. Effect of silvicultural practices on wood properties of conifers: A review. In Douglas Fir: Stand Management for the Future; Oliver, C., Hanley, D., Johnson, J., Eds.; University of Washington Press: Seattle, WA, USA, 1986; pp. 108–117. [Google Scholar]
  41. Jaakkola, T.; Makinen, H.; Saranpaa, P. Wood density in Norway spruce: Changes with thinning intensity and tree age. Can. J. For. Res. 2005, 35, 1767–1778. [Google Scholar] [CrossRef]
  42. Pape, R. Influence of thinning and tree diameter class on the development of basic density and annual ring width in Picea abies. Scand. J. For. Res. 1999, 14, 27–37. [Google Scholar] [CrossRef]
  43. Erickson, H.D.; Harrison, A.T. Douglas-fir wood quality studies part I: Effects of age and stimulated growth on wood density and anatomy. Wood Sci. Technol. 1974, 8, 207–226. [Google Scholar] [CrossRef]
  44. Vincent, M.; Krause, C.; Koubaa, A. Variation in black spruce (Picea mariana (Mill.) BSP) wood quality after thinning. Ann. For. Sci. 2011, 68, 1115–1125. [Google Scholar] [CrossRef] [Green Version]
  45. Savidge, R. Intrinsic regulation of cambial growth. J. Plant Growth Regul. 2001, 20, 52–77. [Google Scholar] [CrossRef]
  46. Larson, P.R. A biological approach to wood quality. Tappi 1962, 45, 443–448. [Google Scholar]
  47. Echols, R.M. Effects of growing space on wood specific gravity in loblolly pine. In Proceedings of the Society of American Foresters; Society of American Foresters: Washington, DC, USA, 1960; pp. 140–143. [Google Scholar]
  48. Geyer, W.A.; Gilmore, A. Effect of Spacing on Wood Specific Gravity in Loblolly Pine in Southern Illinois; Department of Forestry, Agricultural Experiment Station, University of Illinois: Champaign, IL, USA, 1965. [Google Scholar]
  49. Panshin, A.J.; de Zeuuw, C. Textbook of Wood Technology: Structure, Identification, Properties, and Uses of the Commercial Woods of the United States and Canada, 4th ed.; McGraw-Hill Book Co.,: New York, NY, USA, 1980; p. 722. [Google Scholar]
  50. Nienstaedt, H.; Zasada, J.C. White spruce. In Sylvics—Volume 1: Conifers; Burns, R.M., Honkala, B.H., Eds.; USDA, forest service: Washington, DC, USA, 1990; Agriculture Handbook 654; pp. 389–442. [Google Scholar]
  51. Little, E.L., Jr. Checklist of United States Trees (Native and Naturalized); United States, Department of Agriculture, Forest Service: Washington, DC, USA, 1979; Agriculture Handbook, 541; p. 375. [Google Scholar]
  52. Franklin, G.L. Preparation of thin sections of synthetic resins and wood-resin composites, and a new macerating method for wood. Nature 1945, 155, 51. [Google Scholar] [CrossRef]
  53. Pinheiro, J.; Bates, D.; DebRoy, S.; Sarkar, D.; R Core Team. Nlme: Linear and Nonlinear Mixed Effects Models. 2016. Available online: https://svn.r-project.org/R-packages/trunk/nlme/ (accessed on 20 April 2016).
  54. RStudio Team. RStudio: Integrated Development for R; RStudio, Inc.: Boston, MA, USA, 2020. [Google Scholar]
  55. R Core Team. R: A Language and Environment for Statistical Computing. Available online: http://www.R-project.org/ (accessed on 30 August 2022).
  56. Ikonen, V.P.; Peltola, H.; Wilhelmsson, L.; Kilpeläinen, A.; Väisänen, H.; Nuutinen, T.; Kellomäki, S. Modelling the distribution of wood properties along the stems of Scots pine (Pinus sylvestris L.) and Norway spruce (Picea abies (L.) Karst.) as affected by silvicultural management. For. Ecol. Manag. 2008, 256, 1356–1371. [Google Scholar] [CrossRef]
  57. Mäkinen, H.; Hynynen, J. Predicting wood and tracheid properties of Scots pine. For. Ecol. Manag. 2012, 279, 11–20. [Google Scholar] [CrossRef]
  58. Mäkinen, H.; Jaakkola, T.; Piispanen, R.; Saranpaa, P. Predicting wood and tracheid properties of Norway spruce. For. Ecol. Manag. 2007, 241, 175–188. [Google Scholar] [CrossRef]
  59. Fabris, S.P. Influence of Cambial Ageing, Initial Spacing, Stem Taper and Growth Rate on the Wood Quality of Three Coastal Conifers. PhD Thesis, UBC Theses and Dissertations. The University of British Columbia, Vancouver, BC, Canada, 2000. [Google Scholar]
  60. Sanio, K. Über die Grösse der Holzzellen bei der gemeinen Kiefer (Pinus sylvestris), Jahrb. Wiss. Bot. 1872, 8, 401–420. [Google Scholar]
  61. Zhang, S.Y. Effect of age on the variation, correlations and inheritance of selected wood characteristics in black spruce (Picea mariana). Wood Sci. Technol. 1998, 32, 197–204. [Google Scholar]
  62. Bannan, M.W. Anticlinal divisions and cell length in conifer cambium. For. Prod. J. 1967, 17, 63–69. [Google Scholar]
Figure 1. Outcomes of the models comparing a given ring with, respectively all other rings at breast height. The blue line represents best fit and shaded region the 95% confidence level interval for predictions. Only significant differences (black dotes, p > 0.05) were shown (p-value adjustments for multiple comparisons using Bonferroni correction). RW: ring width, RD: ring density, IDV: intra-ring density variation, TL: tracheid length, TD: tracheid diameter, RA: ring area, EWW: earlywood width, and LWW: latewood width.
Forests 13 01807 g001
Figure 2. Radial variation of wood type (Juv: Juvenile, Mat: Mature), at the stem scale, of wood quality attributes of white spruce. For each wood type, the dispersion of data for a given wood quality attribute is represented by the interquartile range (distance between the upper and lower quartiles) and also the minimum and the maximum values. The wood quality attributes are: RW: ring width, RD: ring density, IDV: intra-ring density variation, LWP: latewood proportion, TL: tracheid length, TD: tracheid diameter, RA: ring area, EWW: earlywood width, and LWW: latewood width.
Forests 13 01807 g002
Figure 3. Intra-ring longitudinal variation of wood quality attributes of white spruce at different heights up the stem. The plots depict the interquartile range (the ‘box’) and individual data points in the first and fourth quartiles, including the minimum and the maximum values (the ‘whiskers’). The wood quality attributes are: RW: ring width, RD: ring density, IDV: intra-ring density variation, LWP: latewood proportion, TL: tracheid length, TD: tracheid diameter, RA = ring area, EWW = earlywood width, and LWW = latewood width.
Forests 13 01807 g003
Table 1. Acronyms used in the text and their description.
AcronymDescription
EWWEarlywood width
IDVIntra-ring density variation
JWJuvenile wood
LWPLatewood proportion
LWWLatewood width
MWMature wood
RARing area
RDRing density
RFPRing from pith
RWRing width
TDTracheid diameter
TLTracheid length
WQAWood quality attributes
Table 2. Analyses of variance.
Part 1: Inter-Ring Radial Variations at Breast Height.
WQAPredictorNum-DFDen-DFF-Value
log (RW) Ring from pith3240623.56 ***
RD324061.978 *
IDV3239810.6268 ***
log (LWP) 323971.17 ns
TL776116.92 ***
TD77513.10 ***
log (RA) 3240520.93 ***
log (EWW) 3239716.67 ***
log (LWW) 323976.62 ***
Part 2: Inter-tree variation at breast height
log (RW) Tree154345.66 ***
RD154352.351 *
IDV154276.74 ***
log (LWP) 154272.21 *
TL15801.36 ns
TD15792.19 *
log (RA) 154348.92 ***
log (EWW) 154264.82 ***
log (LWW) 154262.77 **
Part 3: Intra-ring longitudinal variation of juvenile wood
log (RW) Height369112.67 ***
RD36922.38 ns
IDV36877.741 ***
log (LWP) 36860.16 ns
TL31123.74 *
TD31110.28 ns
log (RA) 369115.24 ***
log (EWW) 36868.64 ***
log (LWW) 36864.08 *
Part 4: Inter-tree variation for different spacings between trees (I_Spacing) and heights
log (RW) I_Spacing31211.85 **
Height3106111.19 ***
I_Spacing × Height910611.69 ns
RDI_Spacing3121.24 ns
Height310621.33 ns
I_Spacing × Height910621.25 ns
IDVI_Spacing3121.73 ns
Height3104512.18 ***
I_Spacing × Height910455.13 ***
log (LWP) I_Spacing3120.48 ns
Height310440.14 ns
I_Spacing × Height910441.08ns
TLI_Spacing3120.16 ns
Height21340.21 ns
I_Spacing × Height61340.92 ns
TDI_Spacing3120.28 ns
Height21330.14 ns
I_Spacing × Height61331.05 ns
log (RA) I_Spacing31211.56 ***
Height3106127.63 ***
I_Spacing × Height910613.42 **
log (EWW) I_Spacing31210.39 *
Height310447.21 **
I_Spacing × Height910441.05 ns
log (LWW) I_Spacing31214.98 **
Height310442.91 **
I_Spacing × Height910441.70 *
All intercepts are highly significant (p-value < 0.0001) with Num-DF =1 and are not presented, WQA: Wood Quality Attributes, RW: ring width, RD: ring density, IDV: intra-ring density variation, LWP: Latewood Proportion, TL: tracheid length, TD: tracheid diameter, RA: ring area, EWW: earlywood width, and LWW: latewood width, : natural logarithm transformation, Num-DF: numerator degree of freedom, Den-DF: denominator degree of freedom, *, **, and ***, indicate significance at p < 0.05, p < 0.001, and p < 0.0001, respectively. ns indicates not significant at p ≤ 0.05.
Table 3. Mean values (and standard error) of wood quality attributes.
Part 1—with Height
Height (m)RD (kg/m3)IDV (kg/m3)LWP (%)RW (mm)TD (µm)TL (mm)RA (mm2)EWW (mm)LWW (mm)
1.3452.4 (1.6)507.9 (6.7)21.8 (0.6)3.9 (0.1)32.3 (0.2)2.2 (0.0)784.7 (37.8)3.0 (0.1)0.9 (0.0)
4.3447.9 (1.9)555.2 (7.4)22.0 (0.8)4.1 (0.1)33.4 (0.2)2.5 (0.0)855.6 (39.9)3.1 (0.1)0.9 (0.1)
7.3444.3 (2.6)537.1 (9.3)22.2 (1.0)3.5 (0.1)33.3 (0.2)2.4 (0.0)662.3 (38.7)2.7 (0.1)0.8 (0.1)
10.3443.5 (2.5)501.9 (13.0)22.4 (1.3)3.6 (0.1)--517.9 (34.5)2.9 (0.1)0.8 (0.1)
Part 2—with spacing
Spacing (m)RD (kg/m3)IDV (kg/m3)LWP (%)RW (mm)TD (µm)TL (mm)RA (mm2)EWW (mm)LWW (mm)
1.2445.6 (2.6)537.1 (9.9)21.6 (0.9)2.9 (0.1)31.9 (0.3)2.3 (0.0)429.7 (19.7)2.3 (0.1)0.6 (0.0)
1.8445.9 (2.0)473.5 (10.1)22.4 (0.9)2.9 (0.1)32.7 (0.2)2.3 (0.0)394.2 (15.7)2.3 (0.1)0.6 (0.0)
4.3453.4 (2.8)534.4 (10.0)20.1 (1.0)4.2 (0.1)33.5 (0.3)2.3 (0.0)812.9 (43.4)3.3 (0.1)0.9 (0.1)
6.1446.2 (2.7)568.7 (9.0)24.1 (1.2)5.4 (0.1)32.9 (0.4)2.2 (0.0)1323.0 (66.4)4.0 (0.1)1.4 (0.1)
Part 3—in the juvenile and mature wood zones
Wood zoneRD (kg/m3)IDV (kg/m3)LWP (%)RW (mm)TD (µm)TL (mm)RA (mm2)EWW (mm)LWW (mm)
JW447.5 (1.3)527.6 (5.2)22.1 (0.5)3.8 (0.1)32.8 (0.2)2.3 (0.0)727.4 (24.4)2.96 (0.0)0.84 (0.0)
MW442.0 (2.2)616.0 (6.9)21.9 (0.7)2.3 (0.1)36.0 (0.2)3.1 (0.0)1206.6 (58.0)1.86 (0.1)0.50 (0.0)
RD: ring density, IDV: intra-ring density variation, LWP: Latewood Proportion, RW: ring width, TD: tracheid diameter, TL: tracheid length, RA: ring area, EWW: earlywood width, LWW: latewood width, JW: juvenile wood, and MW: mature wood.
Publisher’s Note: MDPI stays neutral with regard to jurisdictional claims in published maps and institutional affiliations.

