Article

A 230-Year Summer Precipitation Variations Recorded by Tree-Ring δ18O in Heng Mountains, North China

1
The State Key Laboratory of Loess and Quaternary Geology, Institute of Earth Environment, Chinese Academy of Sciences, Xi’an 710061, China
2
Center for Excellence in Quaternary Science and Global Change, Chinese Academy of Sciences, Xi’an 710061, China
3
Qingdao National Laboratory for Marine Science and Technology, Qingdao 266237, China
4
Institute of Global Environmental Change, Xi’an Jiaotong University, Xi’an 712000, China
5
Department of Wugong Natural Resources, Xianyang 712000, China
6
College of Earth and Planetary Sciences, University of the Chinese Academy of Sciences, Beijing 100049, China
7
Open Studio for Oceanic-Continental Climate and Environment Changes, Pilot National Laboratory for Marine Science and Technology (Qingdao), Qingdao 266061, China
*
Author to whom correspondence should be addressed.
Forests 2022, 13(10), 1654; https://doi.org/10.3390/f13101654
Submission received: 3 September 2022 / Revised: 1 October 2022 / Accepted: 5 October 2022 / Published: 9 October 2022
(This article belongs to the Special Issue Forest Climate Change Revealed by Tree Rings and Remote Sensing)

Abstract

:
To explore the history of the changes in monsoon precipitation and their driving mechanisms in the context of global warming, climatology studies using tree-ring stable oxygen isotopes (δ18O) were carried out in Shanxi Province, China. Based on a tree-ring δ18O series from Pinus tabulaeformis Carr. on Heng Mountain, a 230-year June–July precipitation sequence from 1784 to 2013 AD was reconstructed that explained 45% of the total variance (44% after adjusting the degrees of freedom). The reconstructed sequence captured the characteristics of the variations in precipitation. Periods of drought occurred mainly in 1820–1840 AD, 1855–1865 AD, 1895–1910 AD, 1925–1930 AD, and 1970–1995 AD, and wet periods occurred mainly in 1880–1895 AD, 1910–1925 AD, and 1935–1960 AD. The dry and wet years in the precipitation reconstruction corresponded well to the years in which disaster events were documented in historical records. A spatial correlation analysis with Climatic Research Unit (CRU)-gridded precipitation data indicated that the reconstructed precipitation provided good regional representation and reflected large-scale June–July precipitation changes in northern China. In addition, the reconstructed precipitation sequence was also significantly correlated with the dry and wet index (DWI) and other tree-ring dry/wet reconstructions from the surrounding areas. The correlation between the reconstructed precipitation and the Asian monsoon index showed that the precipitation can indicate the intensity of the Asian summer monsoon. Moreover, a significant negative correlation was found between the El Niño–Southern Oscillation (ENSO) and the reconstructed precipitation. At the decadal scale, the negative phase of the Pacific Decadal Oscillation (PDO) and the positive phase of the Atlantic Multidecadal Oscillation (AMO) may co-promote summer precipitation in the study area.

1. Introduction

Tree rings provide high-resolution information over long time periods. Therefore, they play an important role in reconstructing past climate changes during time periods without recorded meteorological data. As dendroclimatology has developed, the indices of tree-ring width, density and stable isotopes have been widely used in global climate change research. In recent decades, with the progress of geochemistry analysis methods and the improvement of the accuracy of mass spectrometer tests [1,2], the study of stable isotopes in tree rings has developed rapidly. Stable oxygen isotopes (δ18O), when used in tree ring studies, have clear fractional distillation mechanisms, can provide robust data with small sample sizes, show insignificant age effects, and provide better retention of low-frequency signals than other stable isotopes, which makes them important for climate research [3].
The δ18O signal of the source water retained by the tree ring α-cellulose can be used not only to study local climate change but also to trace larger-scale water vapour cycles, and can even record the signal of the global hydrological cycle [4]. Tree ring δ18O isotopes also record information related to the relative humidity in the growing season [3,5,6]. The relative humidity changes the cellulose δ18O in tree rings mainly by influencing the transpiration of leaf water. As the main factor influencing tree-ring δ18O distillation, the signal of relative humidity is strongly recorded in the tree-ring δ18O [5]. Therefore, tree-ring δ18O can be used to reconstruct different aspects of climate including temperature [7] and precipitation [8] as well as relative humidity [5], the Palmer drought severity index (PDSI) [9], and cloud cover [10].
The climate in most parts of China is significantly affected by monsoons. The spatial and temporal distribution of monsoon precipitation affects the living environment of plants and animals, and has a remarkable impact on agricultural production as well. The strength of the unstable summer monsoon causes frequent drought and flood disasters. For example, in the spring and summer of 2015, millions of people in Xinzhou, Shanxi Province, were affected by drought, resulting in a direct agricultural economic loss of 2.23 billion yuan (http://cz.sxgov.cn/content/2015-09/11/content_6267161.htm accessed on 16 November 2021). In 2017, Shanxi Province experienced both drought and flooding that affected more than 3 million people and caused an economic loss of nearly 2.3 billion yuan. In the spring of 2018, an unusual synoptic process that caused sharp decreases in temperature, high winds, rain, and snow impacted many parts of Shanxi Province, affecting an area of 134 thousand hectares of crops and causing direct economic losses of over 1.7 billion yuan (http://finance.sina.com.cn/7x24/2018-04-10/doc-ifyteqtq7151965.shtml accessed on 16 November 2021).
North of the 600 mm annual precipitation isoline area in northern China, tree rings are generally positively correlated with precipitation and thus can be used as records of Asian Monsoon activity [6]. Liu et al. (2019) reconstructed the past 450 years of precipitation in the Asian Monsoon marginal area based on 310 trees in the western Loess Plateau of China and found that the increase in manmade sulfate aerosols was the main factor accounting for the weakening trend of the monsoon in the last 80 years [11]. However, the accuracy and breadth of tree-ring research are still insufficient on the eastern Loess Plateau of China, which is located north of the 600 mm annual precipitation isoline.
The study area in this paper is Heng Mountain in Shanxi Province, which is on the edge of the East Asian summer monsoon-influenced area. To date, dendroclimatic studies in Shanxi Province have been mostly based on tree-ring width [12,13], and the study of tree-ring isotopes is far from sufficient; there is only one report of a climatic study that used tree-ring δ18O from Larix principis-rupprechtii Mayr [14] and identified a strong precipitation signal there. Therefore, we conducted a tree-ring oxygen isotope study using Pinus Tabulaeformis Carr.. samples from Heng Mountain with the goals of (1) reconstructing historical climate change in this area with a tree-ring δ18O series to distinguish our results from those of the tree ring width study, especially with regard to the acquisition of low-frequency climate signals; (2) analysing the spatial representation of the reconstructed sequence and its relationship with the Asian Summer Monsoon; and (3) exploring the periods of the reconstructed sequence with multi-taper method (MTM) analysis, and investigating the multiscale models of the reconstruction by adopting ensemble empirical mode decomposition (EEMD) to extract the main period of each mode, in order to explore the possible driving factors affecting the climate in the region.

2. Materials and Methods

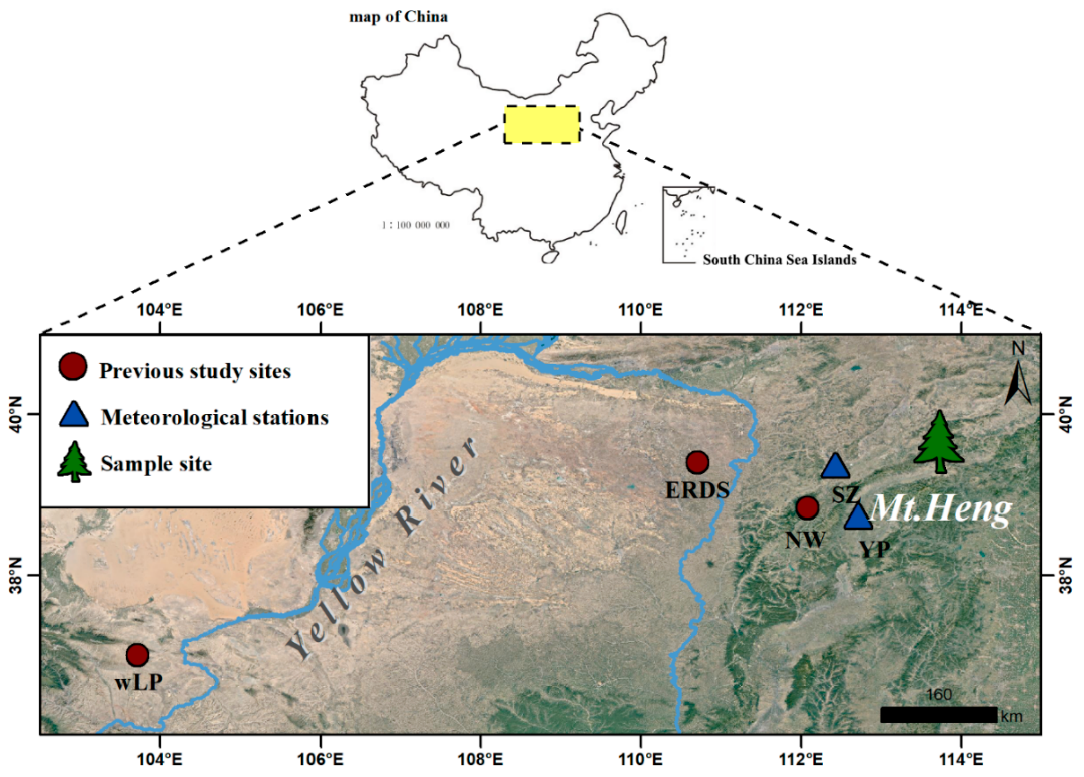
2.1. Study Area, Sample Acquisition, and Pretreatment

Heng Mountain (39°23′–39°44′ N, 113°36′–113°57′ E), located in the northern Shanxi Province (Figure 1), extends roughly from southwest to northeast, with a length of nearly 300 km from east to west. The highest peak is on Mantou Mountain, at 2426 m in altitude. There are tremendous topography fluctuations in Heng Mountain, which has a very steep north slope and a relatively gentle south slope. The Heng Mountain region lies in the transition zone between the northwestern semi-arid region and the eastern monsoon region. It is part of the temperate semi-arid continental climate zone and has four distinct seasons. The region is cold in winter, dry and windy in spring, rainy mostly in summer, and sunny in short autumn. The annual average temperature in this area (according to the records of meteorological stations from 1957–2013 AD in Shuozhou and Yuanping near the sampling site) is 8.18 °C, with an average minimum temperature of −8.92 °C in January, and an average maximum temperature of 22.7 °C in July. The average annual precipitation is 422 mm, and the precipitation from June to September is 328 mm, accounting for 78% of the annual total. The annual relative humidity is lower in spring and higher in summer, with an average value of 53.8%.
The soil at the sampling site (39°40′ N, 113°44′ E, 1617 m above sea level) is brown soil, there are few tree species, and the canopy density is 0.4–0.5. Pinus tabulaeformis. is the dominant species in this area and grows mixed with Picea asperata and Larix principis-rupprechtii. In this study, we selected a group of living Pinus tabulaeformis trees growing on rocks or in thin soil layers. Sampling was performed at breast height and perpendicular to the trunk. We collected samples from 30 trees, for a total of 61 tree cores. All samples were taken back to the laboratory, naturally air-dried, fixed and polished. We used standard dendrochronological techniques for width measurements and cross-dating prior to isotope measurements on tree-ring samples [16]. The ring width was measured with a sliding stage micrometer with an accuracy of 0.01 mm (Lintab). Then, cross-dating was conducted by using the COFECHA program to ensure the accuracy of the dating results. Finally, six cores numbered 07A (1784–2013 AD), 19A (1764–2013 AD), 30A (1784–2013 AD), 31B (1814–2013 AD), 22A (1920–2013 AD), and 05B (1950–2013 AD) with clear ring boundaries and few missing rings were selected for the subsequent stable oxygen isotope experiments.

2.2. α-Cellulose Extraction and Oxygen Isotope Measurement

First, the samples were peeled, ring by ring, with a surgical blade under the microscope and sliced into thin sheets to ensure a complete chemical reaction process. The Jayme–Wise method was adopted to extract α-cellulose [17], and we referred to the improved method of Loader et al. (1997) as well [1]. The steps in detail were as follows: (1) organic extraction (oil removal): (a). A mixture of alcohol and toluene (1:1) was added to a sample and reacted for 1 h in a 60 °C water bath. This procedure was performed twice. (b). A total of 500 mL acetone was added to the previous sample and reacted for 1 h in a 60 °C water bath. (2) Acid reaction (removal of lignin): A total of 500 mL mixed acetic acid and sodium hypochlorite solution was added to the previous sample and reacted for 1 h in an 80 °C water bath. This procedure was performed three times. (3) Alkali reaction (removal of hemicellulose and polysaccharides): A total of 500 mL NAOH solution was added to the previous sample and reacted for 45 min in a water bath at 80 °C. This procedure was repeated three times. Then, the solution was rinsed with distilled water six times until it became neutral.
The extracted cellulose samples from the tree rings were smashed with an ultrasonic pulverizer to homogenize each annual sample. After freeze-drying, the cellulose samples were weighed into 120–160-μg subsamples on a high-precision electronic balance and placed into silver capsules. For the measurements, the samples were put into a high-temperature pyrolysis element analyser (ThermoQuest TC/EA) using He as the carrier gas. The cellulose samples were rapidly decomposed into CO gas at 1350 °C, and then the ratio (18O/16O) was determined with a stable isotope mass spectrometer (ThermoQuest Delta V Advantage) to obtain the tree-ring α-cellulose δ18O content [18]. We used Merck microcrystalline cellulose (δ18O = 27.4 ± 0.3‰, VSMOW; Merck KGaA, Darmstadt, Germany) as our laboratory standard. A Merck cellulose standard was inserted after every eight samples to correct the isotope values and ensure the quality of the measurements. The analytical uncertainty of the δ18O measurement associated with the repeated measurement of Merck cellulose was 0.2‰. Finally, the ratio of 18O/16O in tree-ring α-cellulose was expressed as the δ18OVSMOW after conversion. This value represents the relative micrometer deviation in the 18O/16O ratio between the sample and the Vienna Standard Mean Ocean Water:
δ O 18 VSMOW ( ) = [ ( O 18 / O 16 ) sample ( O 18 / O 16 ) VSMOW   1 ]   ×   1000
This value reflects the oxygen isotope composition of the tree-ring α-cellulose.

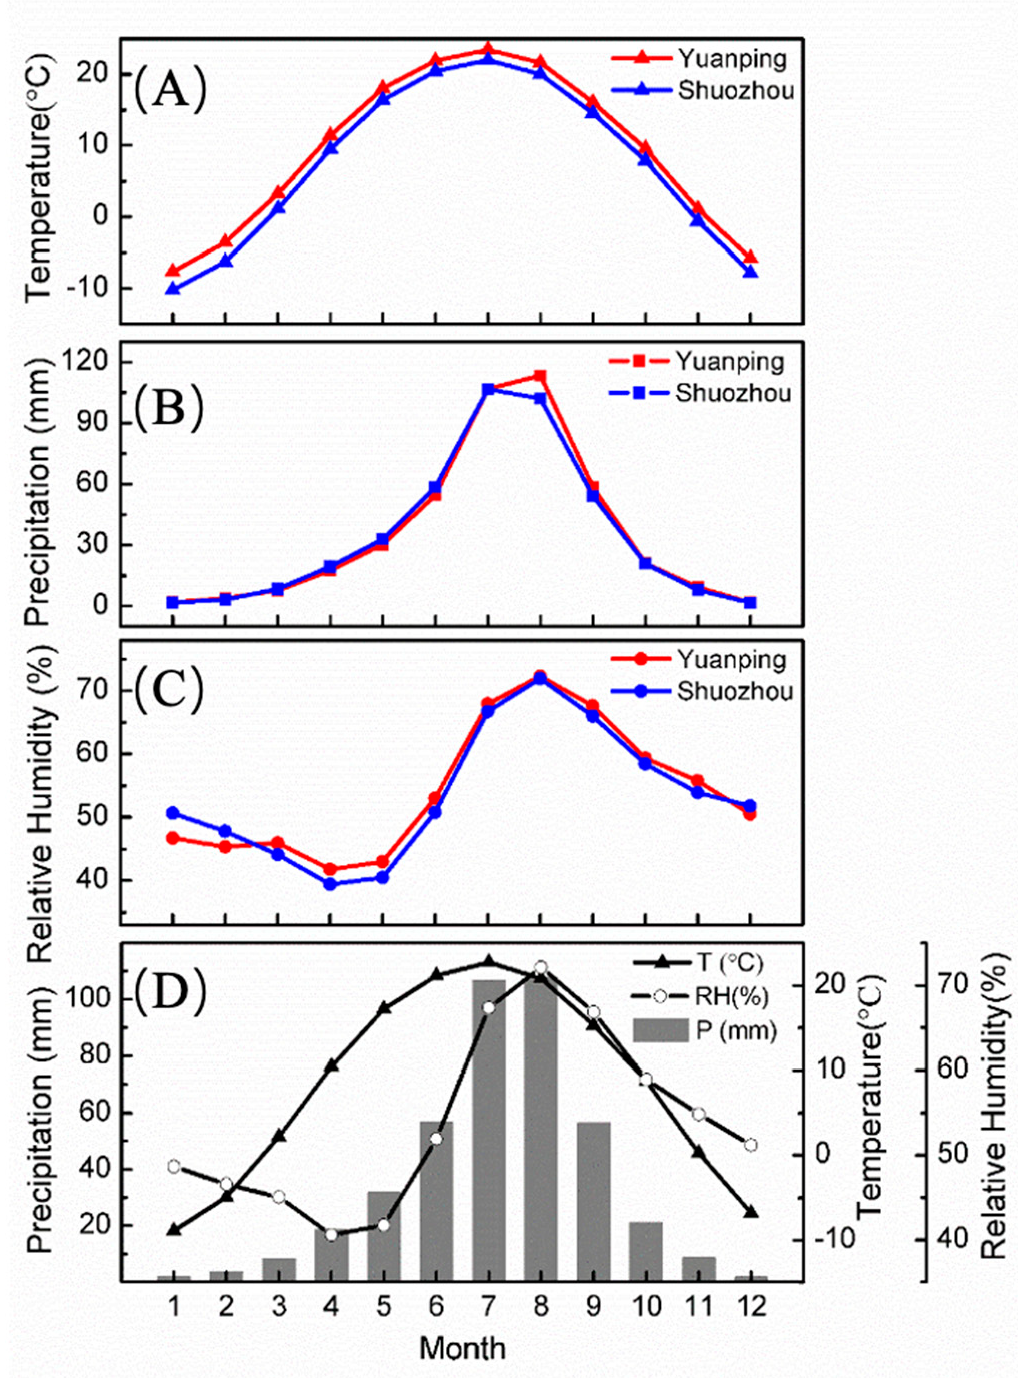
2.3. Meteorological Stations Data

To explore the relationship between tree-ring δ18O and climatic factors, two meteorological stations near the sampling site were selected (Figure 1): Yuanping (38°44′ N, 112°43′ E, altitude 828.2 m, 1957–2013 AD) and Shuozhou (39°22′ N, 112°26′ E, altitude 1114.8 m, 1957–2013 AD). Monthly mean temperature, total monthly precipitation, and monthly mean relative humidity data for the common interval between the two stations (1957–2013 AD) were obtained (http://data.cma.cn/ accessed on 18 November 2021). No obvious abrupt changes or discrepancies were found in the climate series data from the two stations, which indicates that these data reflect the actual changes in the climate around the sampling site. Figure 2 shows that the variation trends of the climatic records (annual average monthly temperature, annual monthly precipitation, and monthly mean relative humidity) from the two stations are similar to each other. The average monthly temperature at Yuanping is slightly higher than that at Shuozhou, and the records from both stations show concentrated rainfall and higher relative humidity in summer. Because of the consistent trends of the meteorological records from the two stations, we calculated the arithmetic average of the temperature, precipitation, and relative humidity data in the common period (1957–2013 AD) of the two stations for correlation analysis with the tree-ring δ18O chronology so that the meteorological data would have better regional representativeness.

3. Results

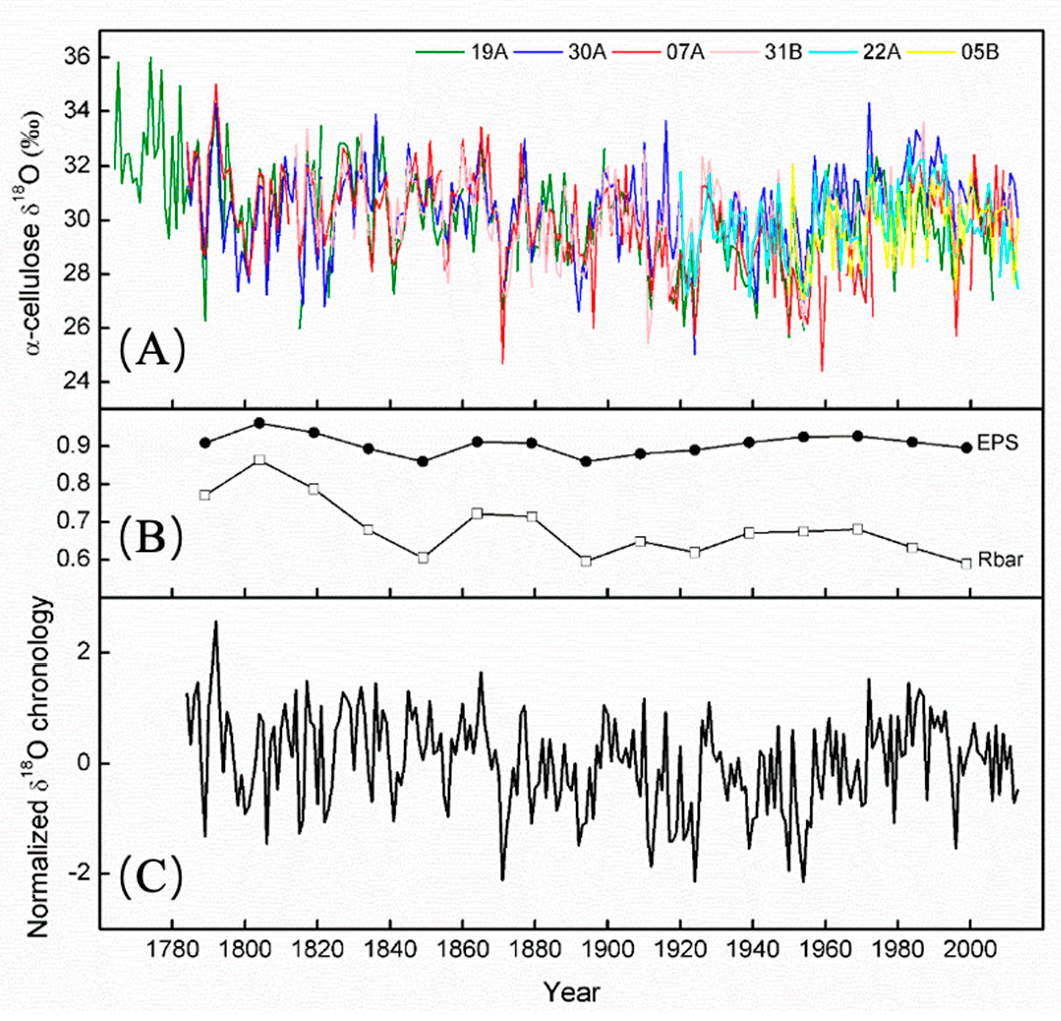
3.1. Tree Ring δ18O Chronology

The δ18O series of the six sample cores and their statistical characteristics are shown in Figure 3A and Supplementary Table S1. Of the samples, 19A started in 1764; 07A and 30A started in 1784; 31B, which was a short core, started in 1814; and 22A and 05B started in 1920 and 1950, respectively. All cores ended in 2013. The average values (standard deviation) of the δ18O series of 07A, 31B, 30A, 19A, 22A, and 05B were 29.89‰ (1.8‰), 30.08‰ (1.46‰), 30.47‰ (1.57‰), 30.14‰ (1.91‰), 29.79 (1.41%), and 29.67 (1.28%), respectively. The average values and the standard deviations for the six cores were relatively close to each other, indicating that the values for the six δ18O series are generally within the same range of variation. The six series are strongly correlated with one another; the correlation coefficients range from 0.55 to 0.78 (Supplementary Table S2), and the average correlation coefficient between sequences is 0.66 (p < 0.001) (Supplementary Table S3).
Because the six samples do not cover the same amount of time, their δ18O series were standardized and then arithmetically averaged by using the NMM method [10] to eliminate significant differences between the different periods of the sequences. Finally, a composite δ18Otree chronology representing the variation in tree-ring δ18O in the Heng Mountain region was generated (Figure 3C). We calculated the expressed population signal (EPS) of the δ18O series, taking every 30 years as the time window (Figure 3B). The effective length of the δ18O chronology was 230 years (1784–2013 AD); EPS values greater than 0.85 were used as the baseline to limit the starting year. A higher EPS indicates that the selected samples have a good commonality and a strong expressed population signal; thus, the δ18O series contains a high proportion of noiseless signals [19,20]. The EPS is calculated as follows,
EPS = (n × Rbar)/[1 + (n − 1) × Rbar],
where n is the number of time series, and Rbar is the mean inter-series correlation [20].

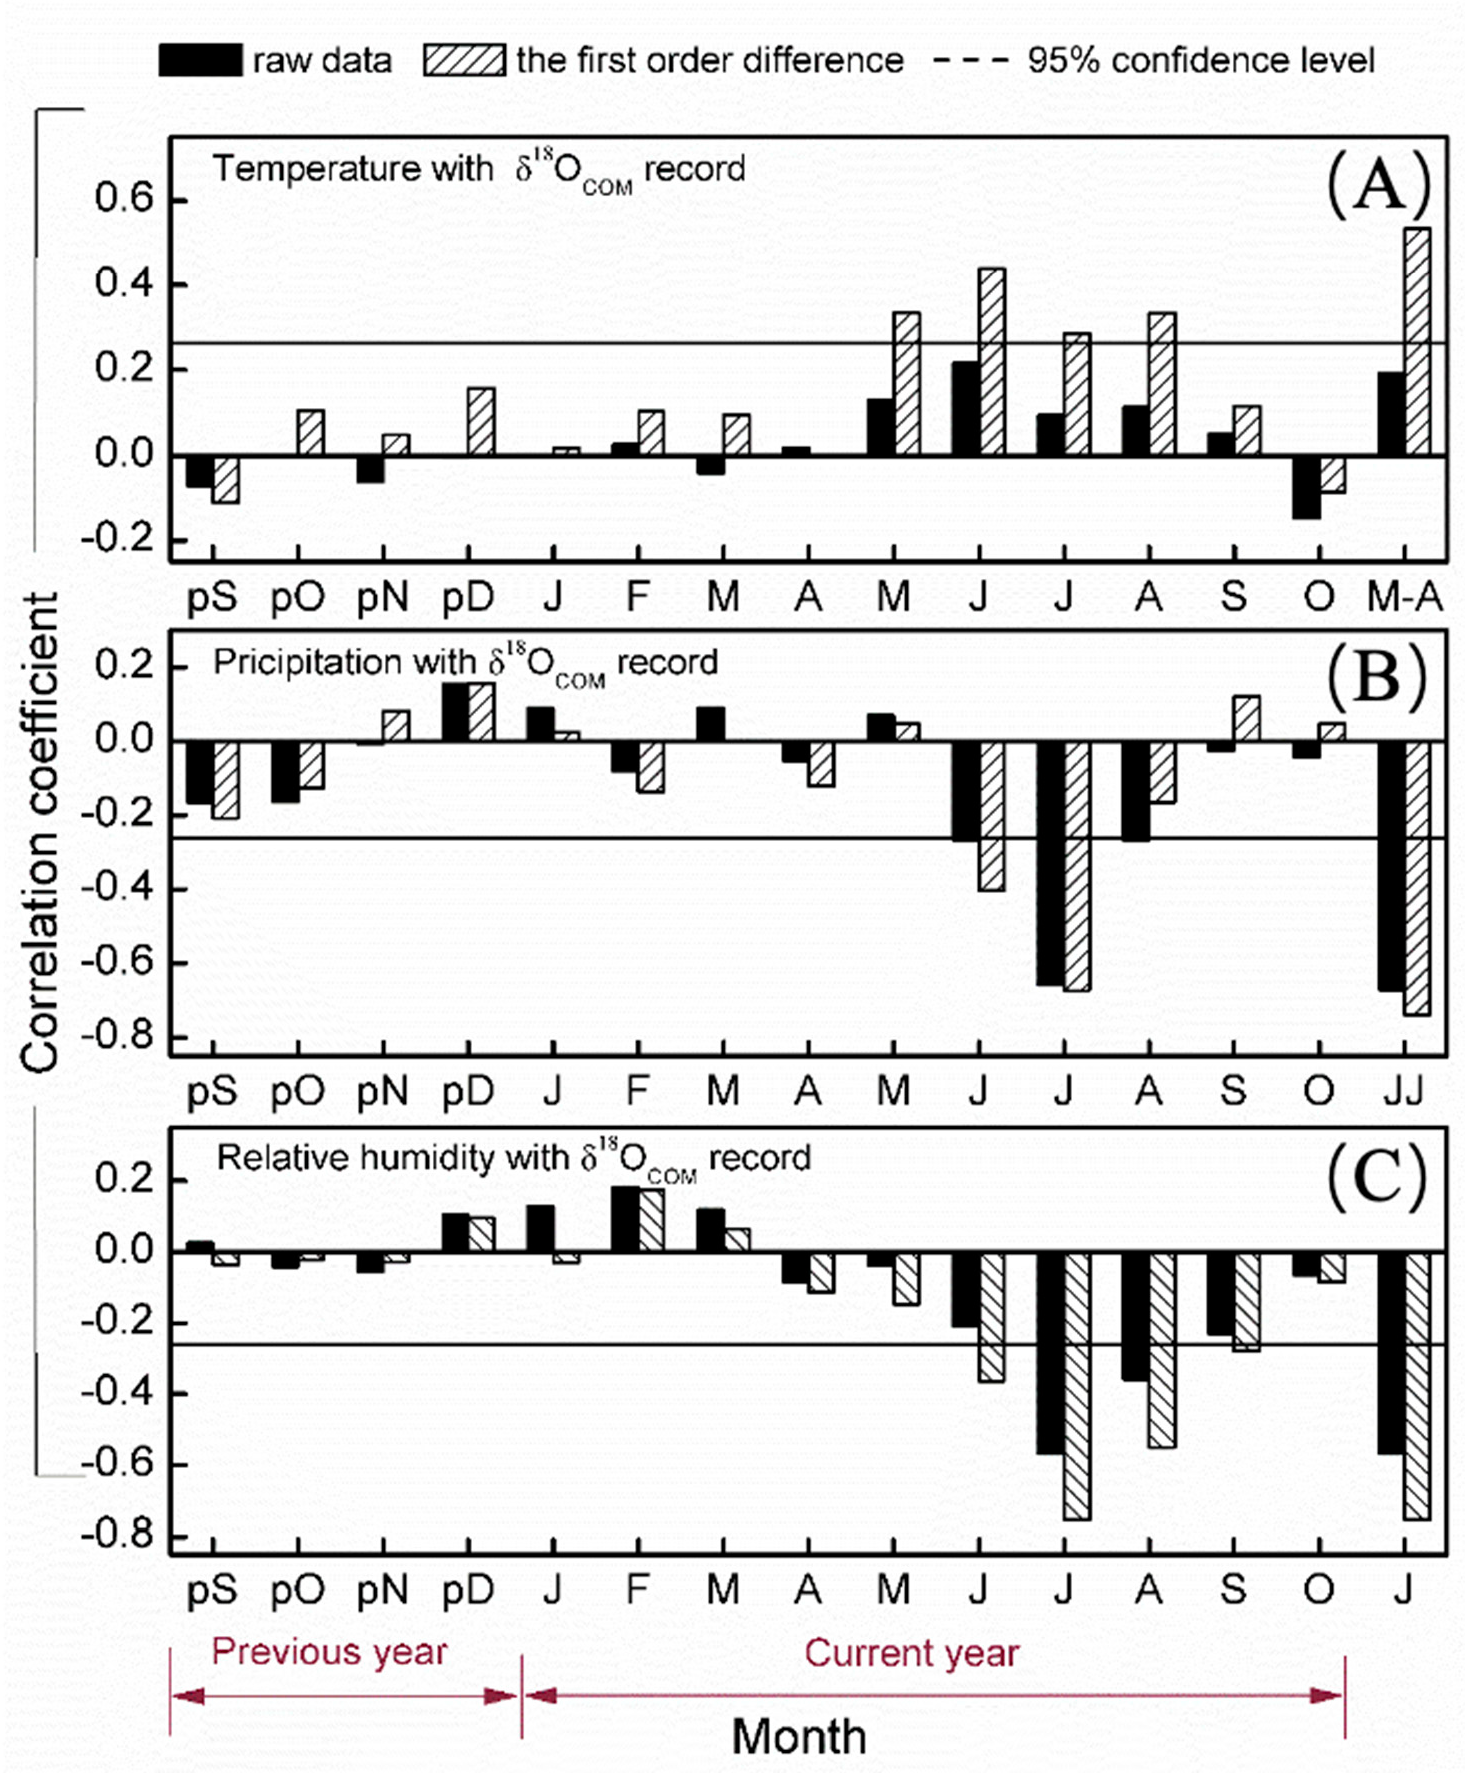
3.2. Climatic Response of the δ18Otree Chronology

The calculation results for the correlation between the δ18Otree chronology and the meteorological data (Figure 4) showed that δ18Otree has a significant response to the growing season precipitation (1957–2013 AD). Considering individual months, there were significantly negative correlations between δ18Otree and precipitation in June, July, and August of the current year; the correlation with total precipitation in June–July was the strongest throughout the year after the months were combined (r = −0.67, p < 0.001) (Figure 4B). The response of δ18Otree to temperature was not significant throughout the time series period (p > 0.05) (Figure 4A). For the relative humidity, the strongest correlation with δ18Otree was found in July of the current year (r = −0.57, p < 0.001) (Figure 4C).
After first-order difference processing was performed on all series, the correlations between the δ18Otree and the climatic factors increased, indicating that the δ18Otree sequence in this area is more sensitive to high-frequency signals. The correlation between δ18Otree and precipitation in June–July reached –0.74 (p < 0.001) after undergoing first-order difference processing.

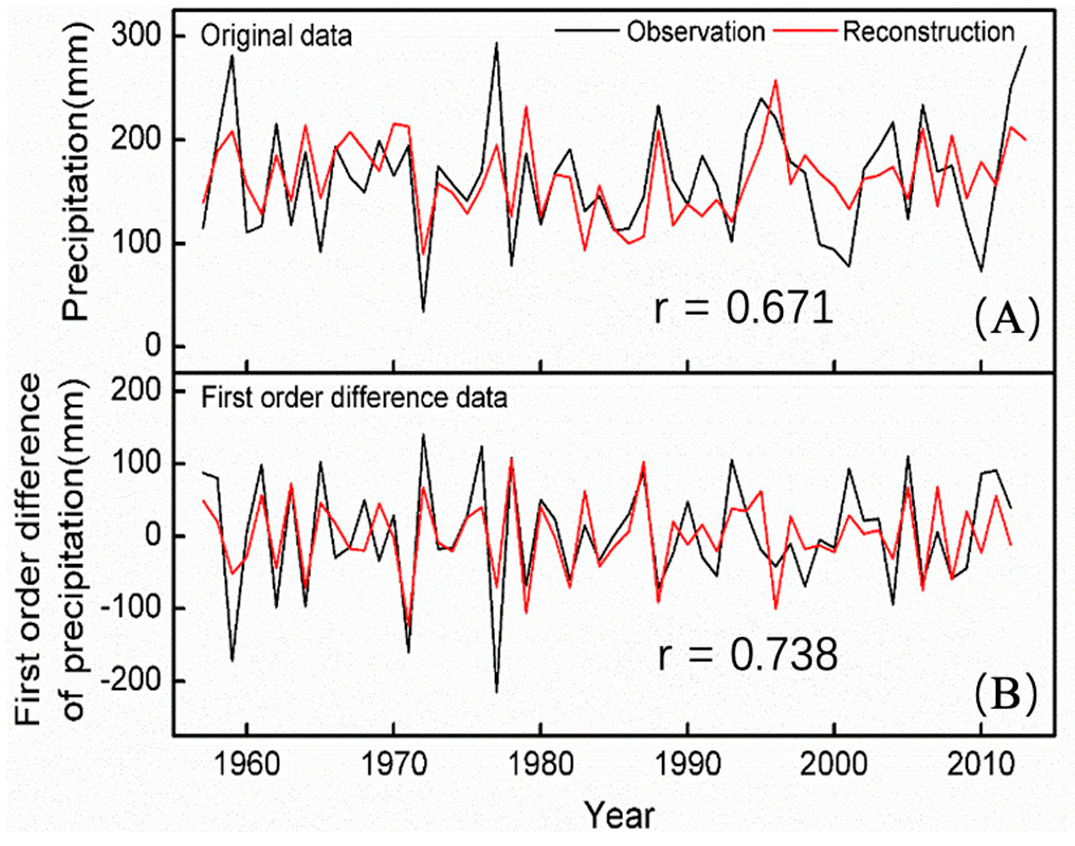
3.3. The Establishment of the Transfer Function, Model Calibration and Verification

Based on the significant linear correlation between δ18Otree and precipitation in June–July from 1957 to 2013, we designed the transfer function as follows,
PJ-J= −54.673 δ18Otree + 173.78
(N = 57, R = −0.671, R2 = 0.450, R2adj = 0.440, F = 44.981, P < 0.0001, D/W =1.582),
where δ18Otree represents the standardized tree ring δ18O chronology and PJ-J represents the total precipitation in June–July in Heng Mountain region. The reconstructed model accounts for 45.0% of the actual total precipitation in June–July (44.0% after adjusting the degree of freedom). In F-tests, a value of p < 0.0001 indicates that the linear relationship regression model has very high statistical significance; therefore, the linear relationship between precipitation in June–July and tree ring δ18O in the study area is significant. The result of the Durbin–Watson test was 1.582, and the range of its values included the value indicating a lack of auto-correlation (1.428–2.572, n = 55, p < 0.01); therefore, the data are independent of the residuals.
The reliability and stability of the reconstruction equation were tested by the split-verification method (Supplementary Table S4), and there were strong correlations in each period of the calibration and verification (p < 0.001) (Figure 5A). The results of the sign test (ST) and the product means test (t-test) both surpassed a significance level of 0.001, and the values for both the reduction of error test (RE) and the coefficient of efficiency (CE) were greater than 0, indicating the reliability and robustness of the modelling and the stability of the reconstruction [21]. After the first-order difference treatment, the correlation between the reconstructed and the observed sequences was 0.738 (n = 56, p < 0.001) (Figure 5B), indicating that the reconstruction in the study area captured both high- and low-frequency changes in the actual precipitation.

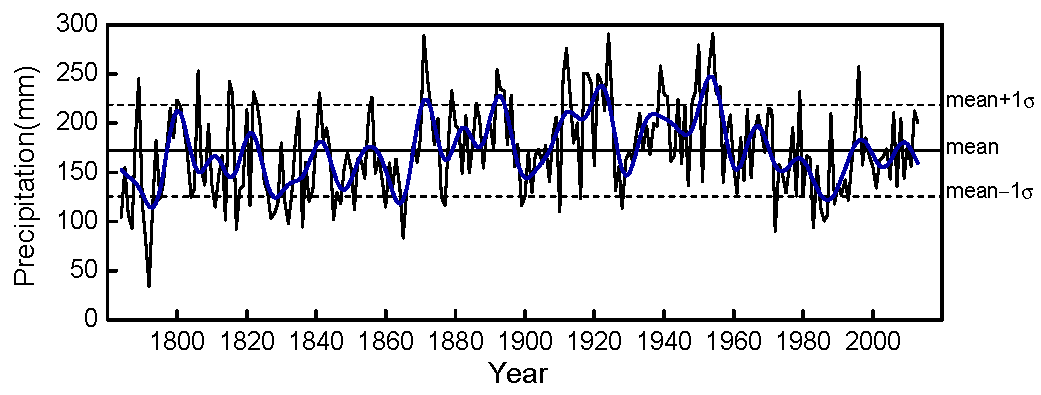
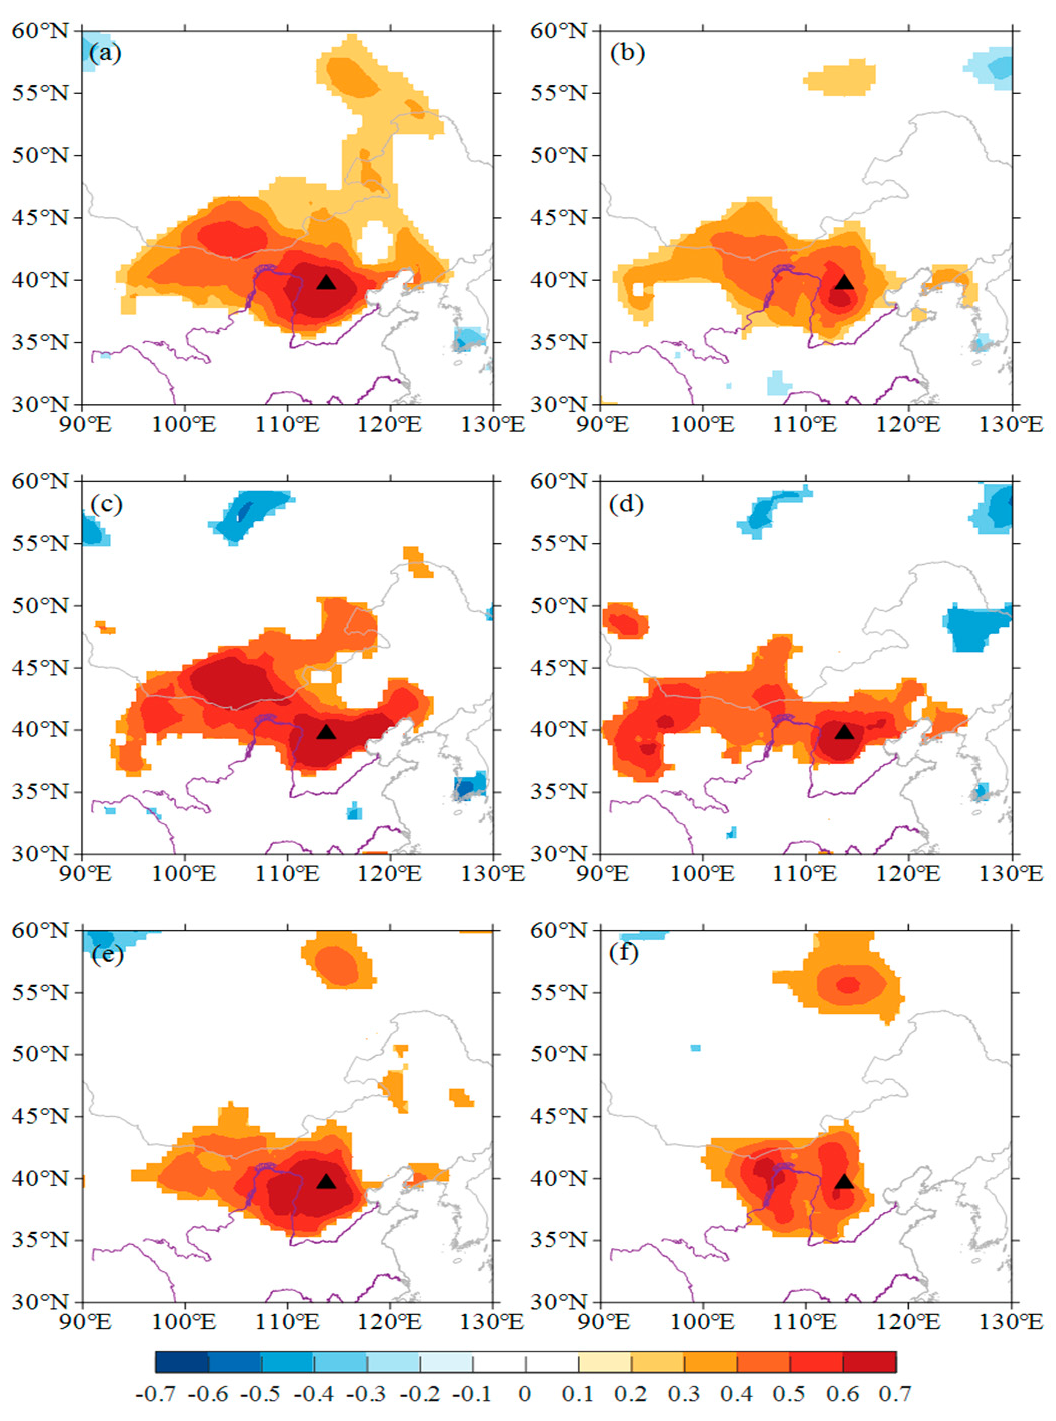
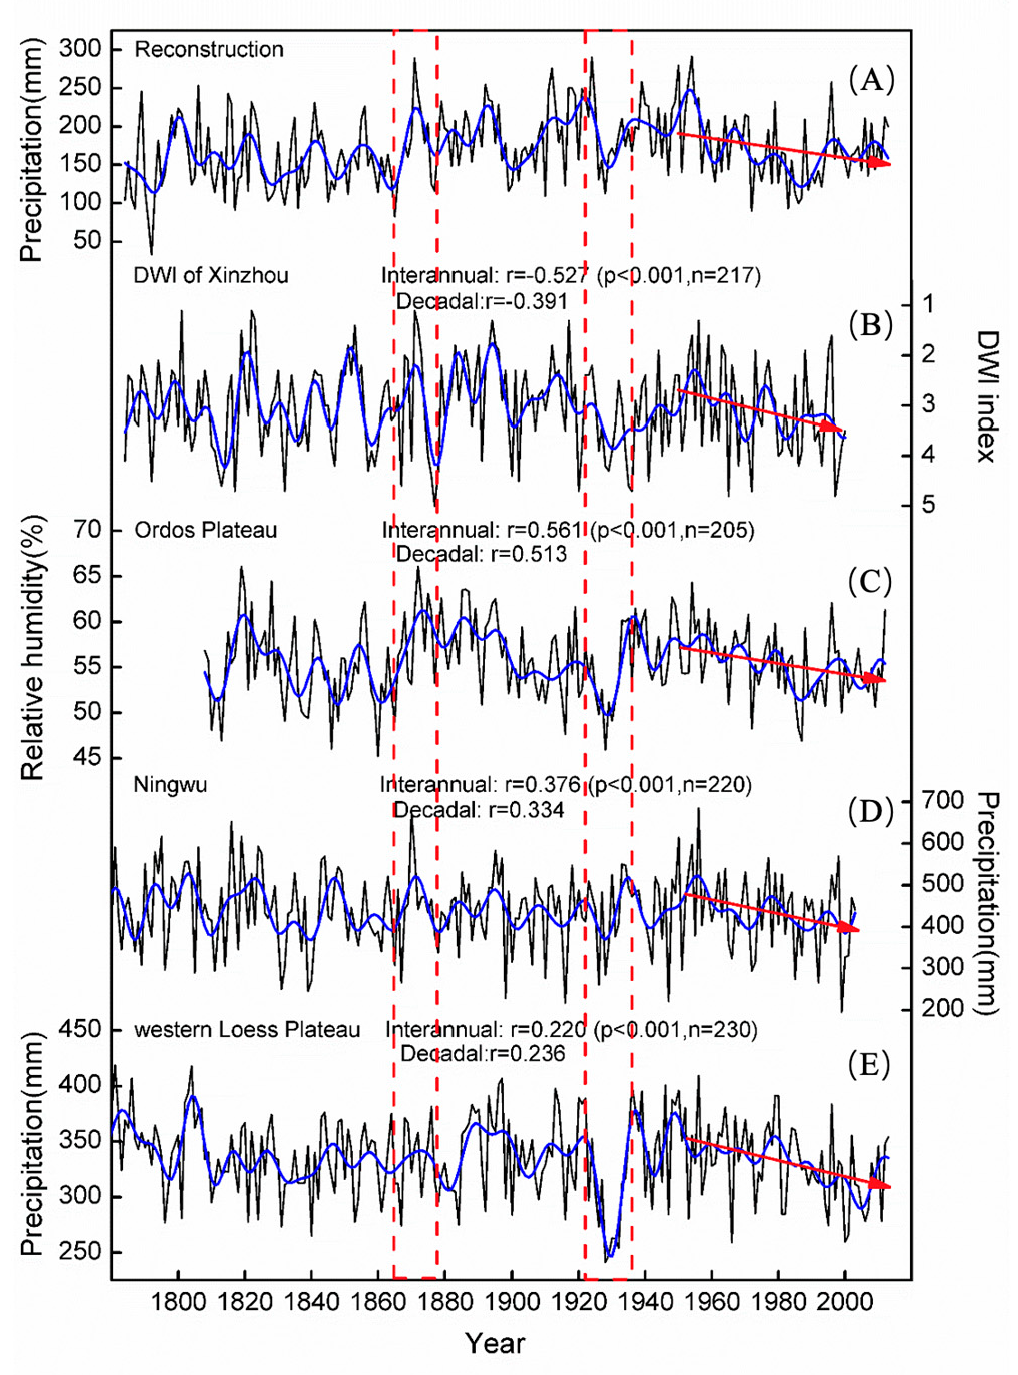
3.4. Characteristics and Spatial Representation of the Reconstructed PJ-J in 1784–2013 AD

The reconstructed June to July precipitation (PJ-J) at Heng Mountain from 1784 to 2013 is shown in Figure 6. The average value of PJ-J was 172.01 mm, and the standard deviation was 46.58. In this study, a wet/dry year is defined as the average value plus/minus one standard deviation. According to the statistical results, there were a total of 40 wet years (precipitation over 218.59 mm) and 39 dry years (precipitation under 125.42 mm), accounting for 17.4% and 17.0% of the whole period, respectively. After applying an 11-year moving average, the fluctuations on the decadal scale are shown. The drought periods were mainly concentrated in 1820–1840 AD, 1855–1865 AD, 1895–1910 AD, 1925–1930 AD, and 1970–1995 AD, and the wet periods were concentrated in 1880–1895 AD, 1910–1925 AD, and 1935–1960 AD. Most of these dry and wet periods have been observed many times in reconstruction records from tree rings in northern China [6,22,23,24].
Most of the dry and wet years identified in the reconstruction correspond well with historical records [25]. For example, the great drought and famine in 1792 led to grain prices soaring, and people had to sell their children to make a living according to the Datong County Annals. The records of Zuoyun County report that the droughts in 1832 and 1836 resulted in rapid locust breeding and a short-term “drought locust” outbreak that caused crop failures and widespread hunger. In 1877, the well-known “Ding Wu Strange Famine” influenced a wide area for a long time and affected most parts of northern China. No crops could grow, and people had to eat grass, roots and bark, resulting in a large number of deaths. In 1928, severe droughts prevailed in Shanxi Province, and people experienced great hardship due to the lack of food.
Excessive precipitation brings meteorological disasters as well, such as flooding, hail and other events. In terms of waterlogging records, in Shanxi Province, the floods in 1822 resulted in an outbreak of plague, and the flooded mountain streams caused many houses to collapse. In 1912, the Nanyang River in northern Shanxi flooded, followed by the Yellow River flooding some villages. In 1954, there were severe floods in the northern part of Shanxi Province, causing a reduction in production of 59.64 acres. A total of 1273 villages were affected by these floods, and 21,700 houses collapsed. The typical wet and dry years identified in this study and their corresponding historical events are summarized in Supplementary Table S5 for reference.
We established a spatial correlation diagram for the common reconstruction and observation period with June–July precipitation data from the Climatic Research Unit (CRU) datasets from the KNMI Climate Resource Manager (https://climexp.knmi.nl accessed on 8 January 2022) (Figure 7). The results showed that during the period from 1957 to 2013, the reconstructed and observed sequences both showed significant correlations with the CRU gridded precipitation data. The spatial correlation patterns of the two were basically the same, indicating that the reconstructed precipitation can represent the actual precipitation changes within the region. The high correlations were mainly concentrated in Shanxi, Hebei, Inner Mongolia, and northern Shaanxi, which further indicates that our reconstruction can represent a wide range of June–July precipitation changes in North China. In addition, the observed and reconstructed sequences had stronger correlations with the CRU gridded precipitation from 1957 to 1980, along with a wider range. Since 1981, there have been smaller, high-correlation ranges, indicating that the spatial representation of precipitation signals in this area becomes more concentrated after the 1980s.
We also compared the dry and wet index (DWI) [26] values from Xinzhou (38°45′ N, 113°45′ E), near the sampling site, as well as three other tree ring-based reconstructions from the edge of the northern monsoon area in China with the reconstructed precipitation time series in this paper (Figure 8). The results showed that our precipitation reconstruction was significantly correlated with the DWI at Xinzhou, the reconstructed June–August relative humidity on the Ordos Plateau [6], the reconstructed precipitation records from the previous August to the current July in Ningwu [15], and the precipitation record from the previous July to the current June using multipoint integrated tree ring sequences on the western Loess Plateau [11]. All the above sequences reflect the intensity of the Asian monsoon to some extent. For example, all the sequences showed significant wetting in 1865–1880 AD, which indicated that the Asian monsoon was stronger during that time. The period from 1920 to 1935 represented the most intense and widespread period of drought in the past 200 years [27,28,29], implying a significant large-scale weakening of the Asian monsoon during that period. Starting in the second half of the 20th century, the five sequences showed significant declines, indicating a drying trend in the edge of the monsoon area in China to varying degrees; this decline seems to go against expectations based on global warming. Liu et al., (2019) suggested that the increase in anthropogenic sulfate aerosol emissions in the Northern Hemisphere might be the main factor weakening the Asian monsoon [11].

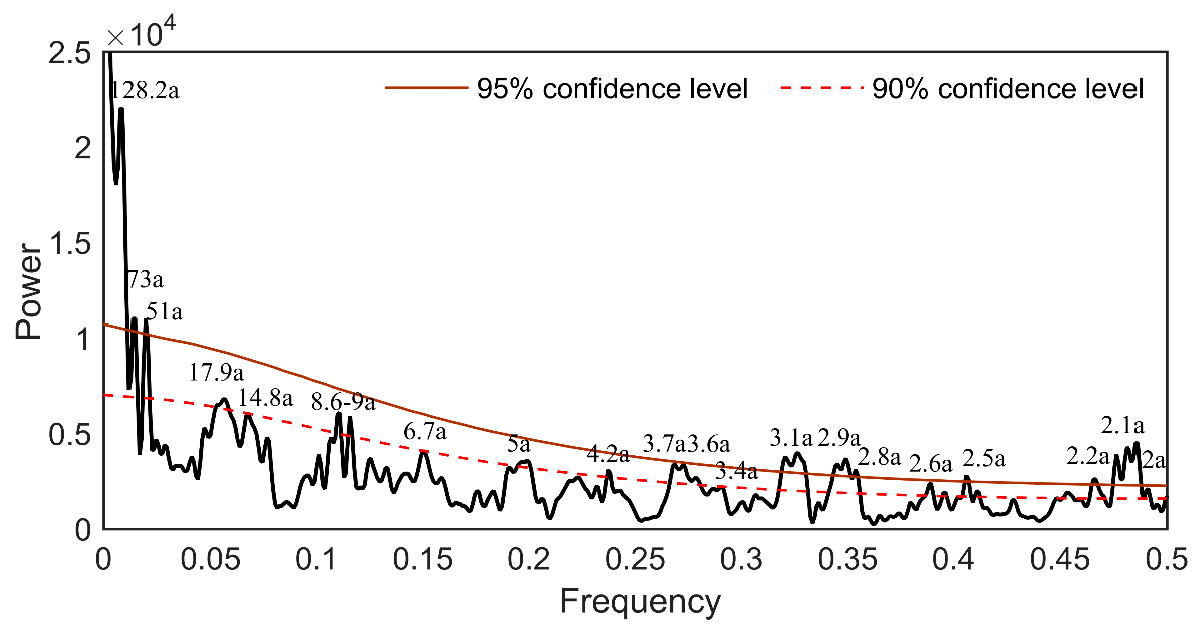
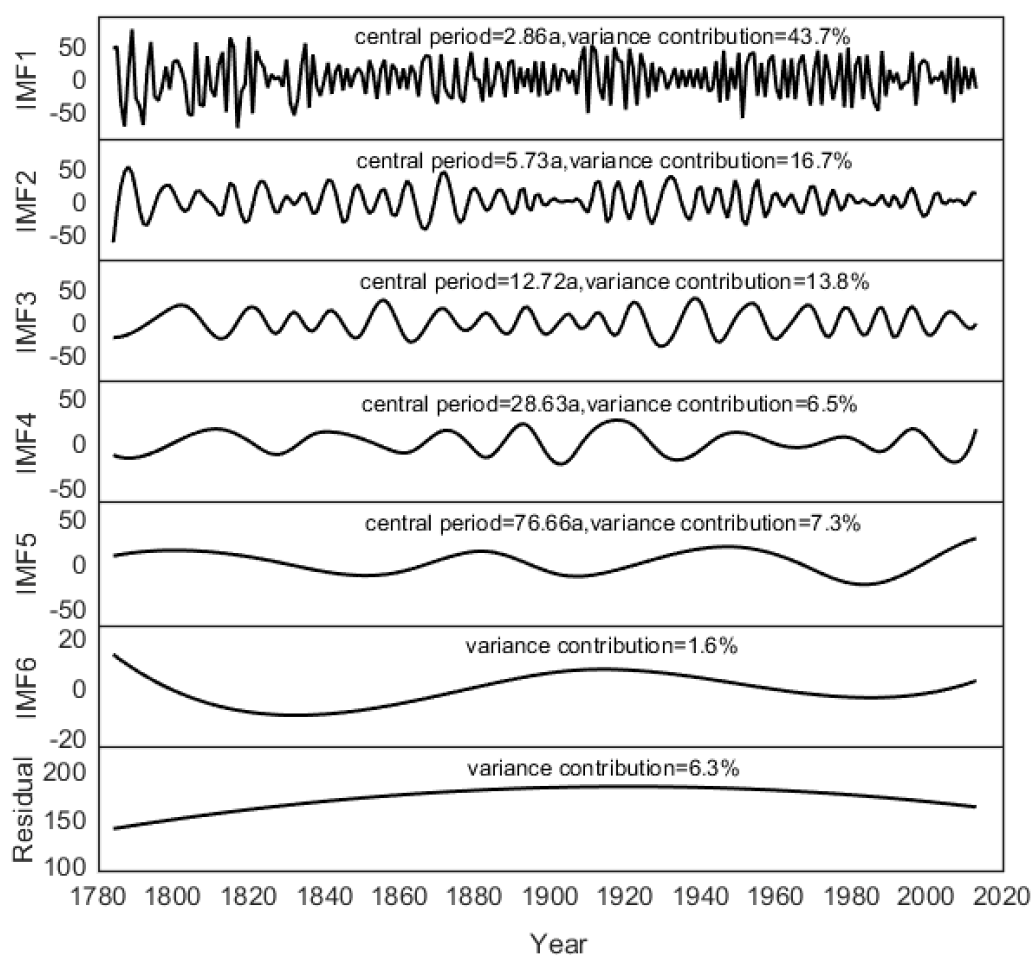
3.5. Periodic Analysis and Ensemble Empirical Modal Decomposition of the Reconstruction

The multi-taper method (MTM) [30] was used to conduct a periodic analysis of the reconstructed precipitation sequence. The power spectrum of the reconstructed sequence and the periods passing the 90% (red dotted line) and 95% (red solid line) red noise confidence levels are shown in Figure 9. Since 128.2a is more than 1/2 the length of the total series (230a), it is not considered to be a “period”. As a result, the quasi-cycle period of the reconstructed precipitation includes 73a, 51a, 17.9a, 14.8a, 8.6–9a, and 2–7a.
The EEMD results show that the sequence can be decomposed into seven components, IMF1–IMF6 and a residual trend, scaling from high frequency to low frequency (Figure 10). The main periods of IMF1 and IMF2 are 2.86a and 5.73a, respectively, reflecting the main high-frequency fluctuations of the reconstructed sequence; IMF1 is the strongest signal component in the original sequence, with a variance interpretation of 45.8%, and IMF2 provides a variance interpretation of 17.4%. IMF3 and IMF4 represent decadal oscillations, with main periods of 12.72a and 28.63a, corresponding to variance interpretations of 14.4% and 6.7%, respectively. IMF5 represents a relatively steady multigenerational oscillation with a main period of 76.66a and a variance interpretation of 7.6%. IMF6 is a century-scale oscillation with weak amplitudes and reflects the low-frequency drying–wetting–drying trend in Heng Mountain during 1784–2013 AD, with a variance interpretation of only 1.6%. The residual trend is the remaining component of the decomposition, with a variance interpretation of 6.5%; this trend reflects the precipitation increasing slowly in the early period and declining slowly in the late 20th century, which corresponds well to the results in Figure 8.
By combining the results of the MTM spectral analysis and EEMD, we found that the periods of 2–7a suggested by the MTM analysis and the 2.86a and 5.73a periods of IMF1 and IMF2 decomposed by EEMD may relate to the El Niño–Southern Oscillation (ENSO) period; in addition, the 2–3a period may also relate to the tropospheric biennial oscillation (TBO) [31], but the signals of the TBO and the ENSO could not be completely separated. The periods of 8.6–9a, 14.8a, and 17.9a from the MTM analysis and the IMF3 and IMF4 components of the EEMD decomposition, with periods of 12.72a and 28.63a, may be related to the Pacific decadal oscillation (PDO). The period of IMF3 is also close to the 11-year cycle of solar activity, indicating a possible relationship between them. In addition, the period of 73a indicated by the MTM and the IMF5 from the EEMD decomposition, with a period of 76.66a, are within the cycle range of 65–80a of the Atlantic multidecadal oscillation (AMO). This result has also been confirmed in a relative humidity reconstruction sequence from the Ordos Plateau [6], reflecting the remote correlation between the AMO and the dry/wet conditions in the Asian monsoon edge region.

3.6. Large-Scale Climate Signals Reflected in the Reconstructed Precipitation Series

Relationship between Reconstructed Precipitation and the Asian Summer Monsoon (ASM)

The Indian monsoon (SAM) and the East Asian monsoon (EAM), the two main subcomponents of the Asian summer monsoon (ASM) [32], are two independent circulation systems [33]. The EAM has a very complex spatiotemporal structure that spreads over tropical, subtropical, and mid-latitude regions, and one of its outstanding features is that precipitation is concentrated in a rain belt extending from east to west. Due to the large longitudinal variation in EAM precipitation, it is difficult to quantify changes in the EAM by using direct regional precipitation data [34]. Therefore, there are many ways to define an East Asian monsoon index. For the Indian monsoon, the All-India Rainfall Index (AIRI) has been widely accepted as an indicator of monsoon intensity. In this paper, we used several classic Asian monsoon indices to perform the correlation calculations with the reconstructed sequence to explore the relationship between the Asian monsoon and June–July precipitation in the study area. Accurate descriptions of the variables, levels (hPa) and regions defined by each index are provided in Supplementary Table S6, so we do not elaborate here.
Supplementary Table S6 shows that the precipitation in summer (June–July) at Heng Mountain was significantly positively correlated with various Asian monsoon indices and the monthly AIRI, indicating that the summer precipitation in this region originates from the combined water vapour transport of the summer monsoon in East Asia and South Asia. According to the regional scopes of the Asian monsoon indices defined by different authors, the influence of the South Asian monsoon on precipitation in this region is relatively stronger (with a high level of confidence) and starts earlier than that of the EAM. Comparing our reconstruction with the indices proposed by Zhu et al., (2000) and Webster and Yang (2010), AIRI, and other indices revealed that the South Asian monsoon has the strongest influence on precipitation at Heng Mountain generally starting in May, while tree-ring δ18O reflects the precipitation in June–July, indicating that the precipitation in the study area may experience a lag effect from the response of the South Asian monsoon [33,35]. However, this may also be due to the physiological fractionation signal of the tree-ring isotopes rather than the climate signal, i.e., the δ18O exchange rate between carbohydrates in plant stems and absorbed water in roots [36]. The period of correlation between the East Asian monsoon index (EAMI; IZTC and ILKY) [32,37] and the reconstructed precipitation in this region reflects the movement rate of the subtropical high in the West Pacific. The strongest correlations between the EAM and the reconstructed precipitation in this region were concentrated in June, when the subtropical high starts to move northwards and affect China, Japan, South Korea and surrounding waters [34]. In general, the summer precipitation at Heng Mountain was influenced by the joint action of the East Asian and South Asian monsoons. The stronger the monsoon is, the more water vapour it brings. However, the South Asian (Indian) monsoon had a greater influence on the June–July precipitation in the study area than the EAM.

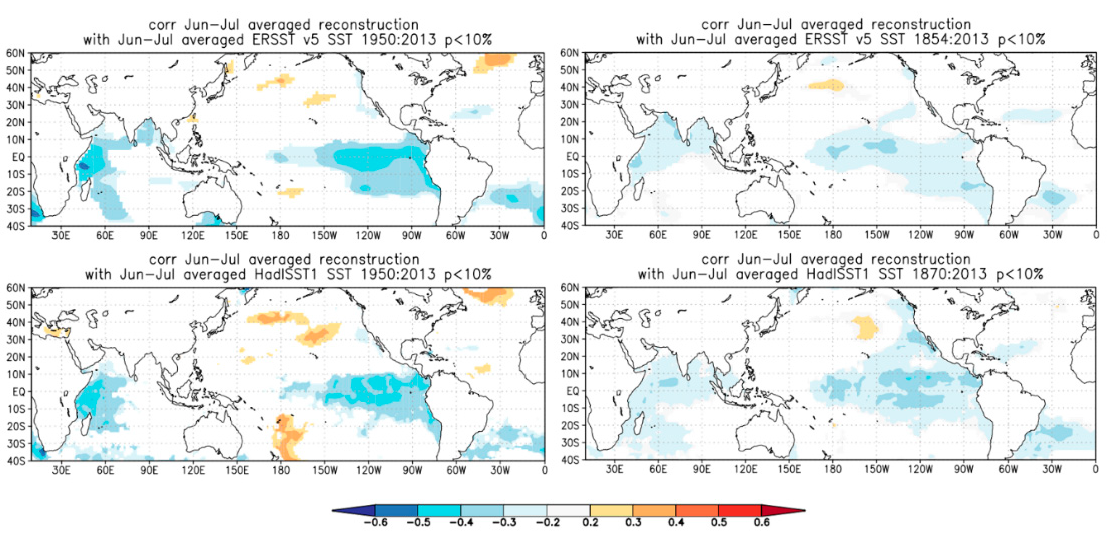
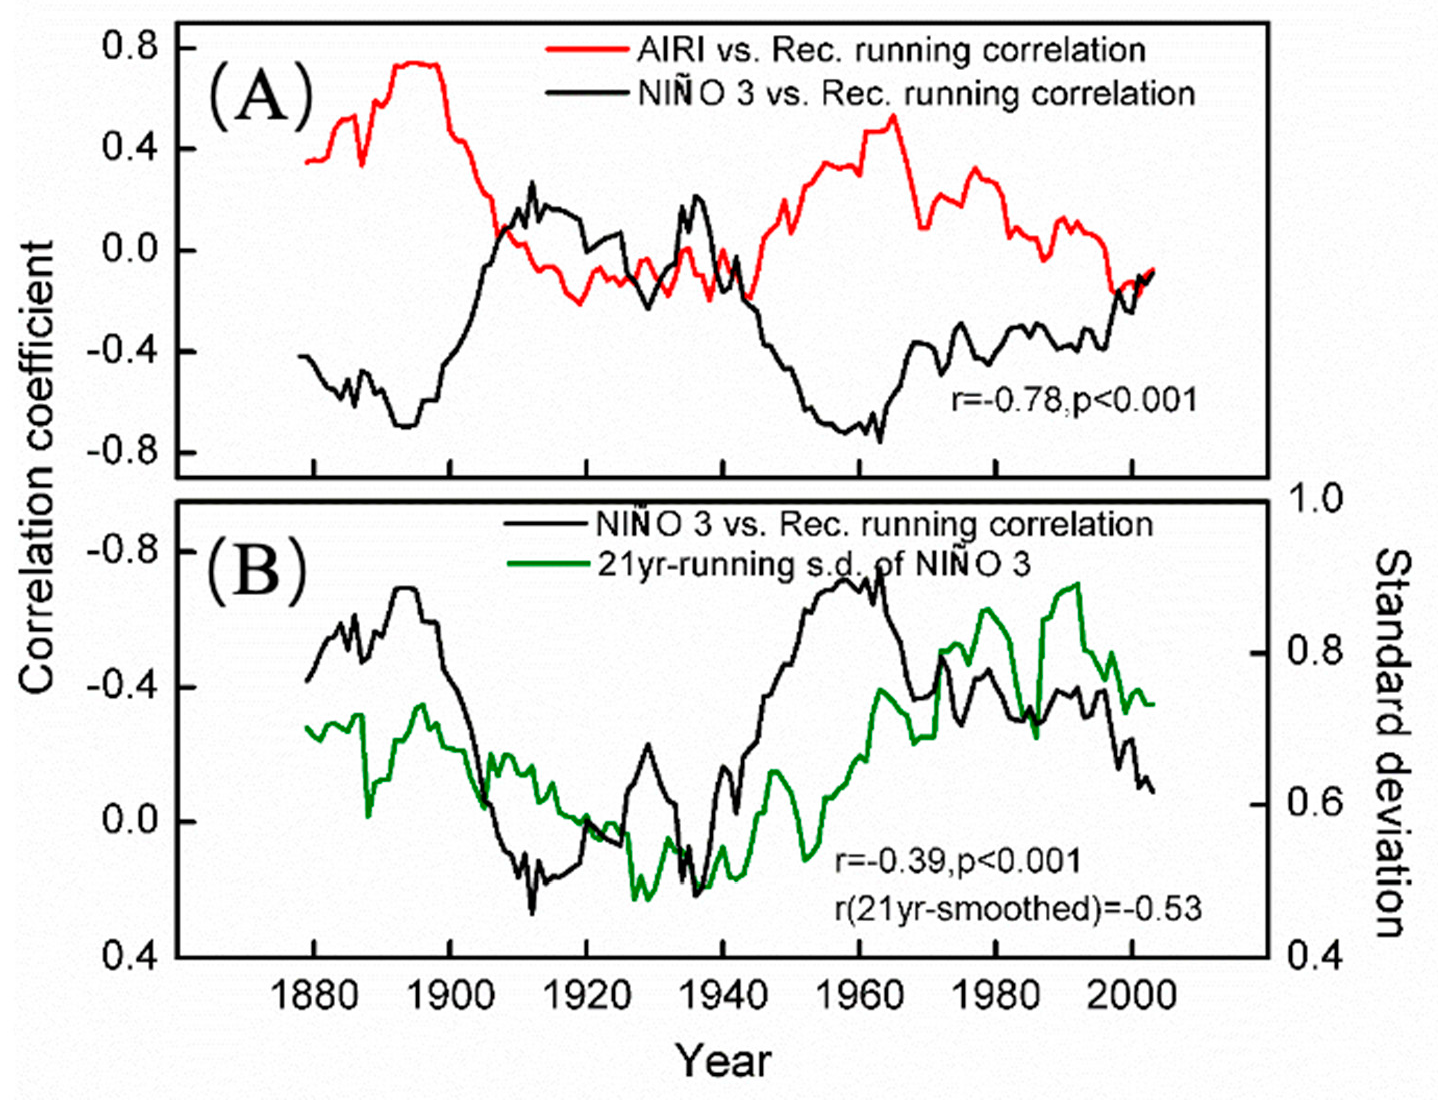
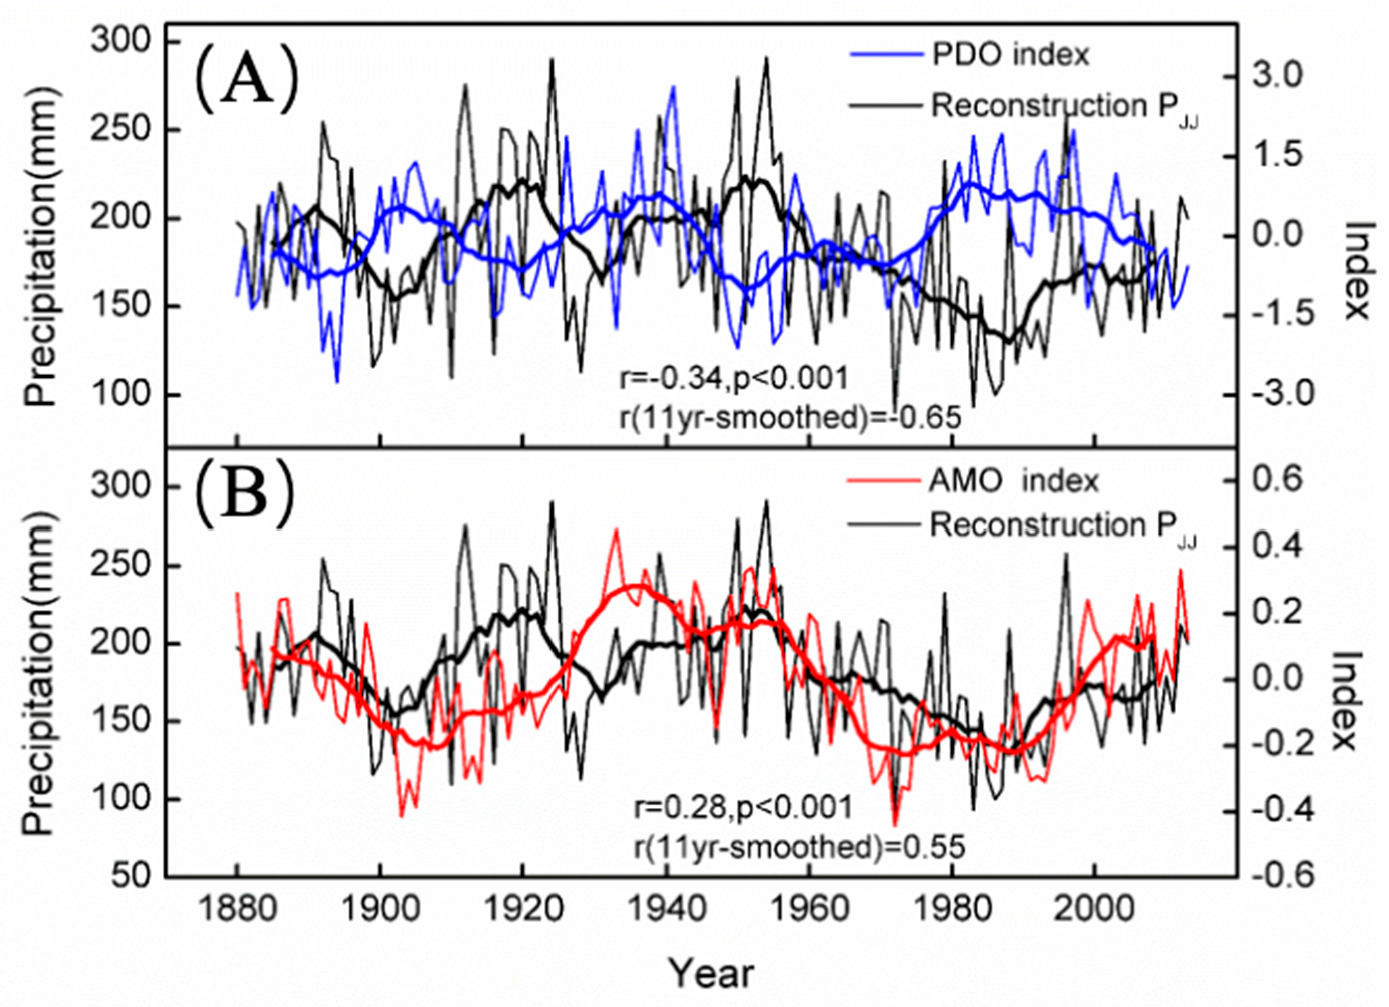
3.7. Teleconnection with Remote Oceans

We used sea surface temperature (SST) data from KNMI and HadISST datasets to perform spatial correlations with the reconstructed sequences by using the whole sequence and with the sequence after 1950 AD (Figure 11). It is generally believed that observed SST data from after 1950 AD are more accurate than earlier data [38]. There were significant correlations between the reconstructed precipitation at Heng Mountain and SST over the Pacific Ocean, Indian Ocean, and Atlantic Ocean. Of these correlations, the significant negative correlation between the reconstructed precipitation and the eastern equatorial Pacific Ocean reflects ENSO events, and the calculation results showed significant negative correlations between the reconstructed precipitation and the NIÑO3 index, multivariate ENSO index and Southern Oscillation Index (Table 1). The significant positive correlation between the SST of the North Pacific Ocean and the reconstructed precipitation reflects the PDO signal. The negative correlation between the SST of the North Atlantic and the reconstructed precipitation reflects the AMO signal. The negative correlation between the SST in the western equatorial Indian Ocean and the reconstructed precipitation may be due to the interaction between the ENSO and the Indian Ocean SST dipole; that is, there is consistent SST variation in the west (east) equatorial Indian Ocean and the east (west) equatorial Pacific Ocean.

4. Discussion

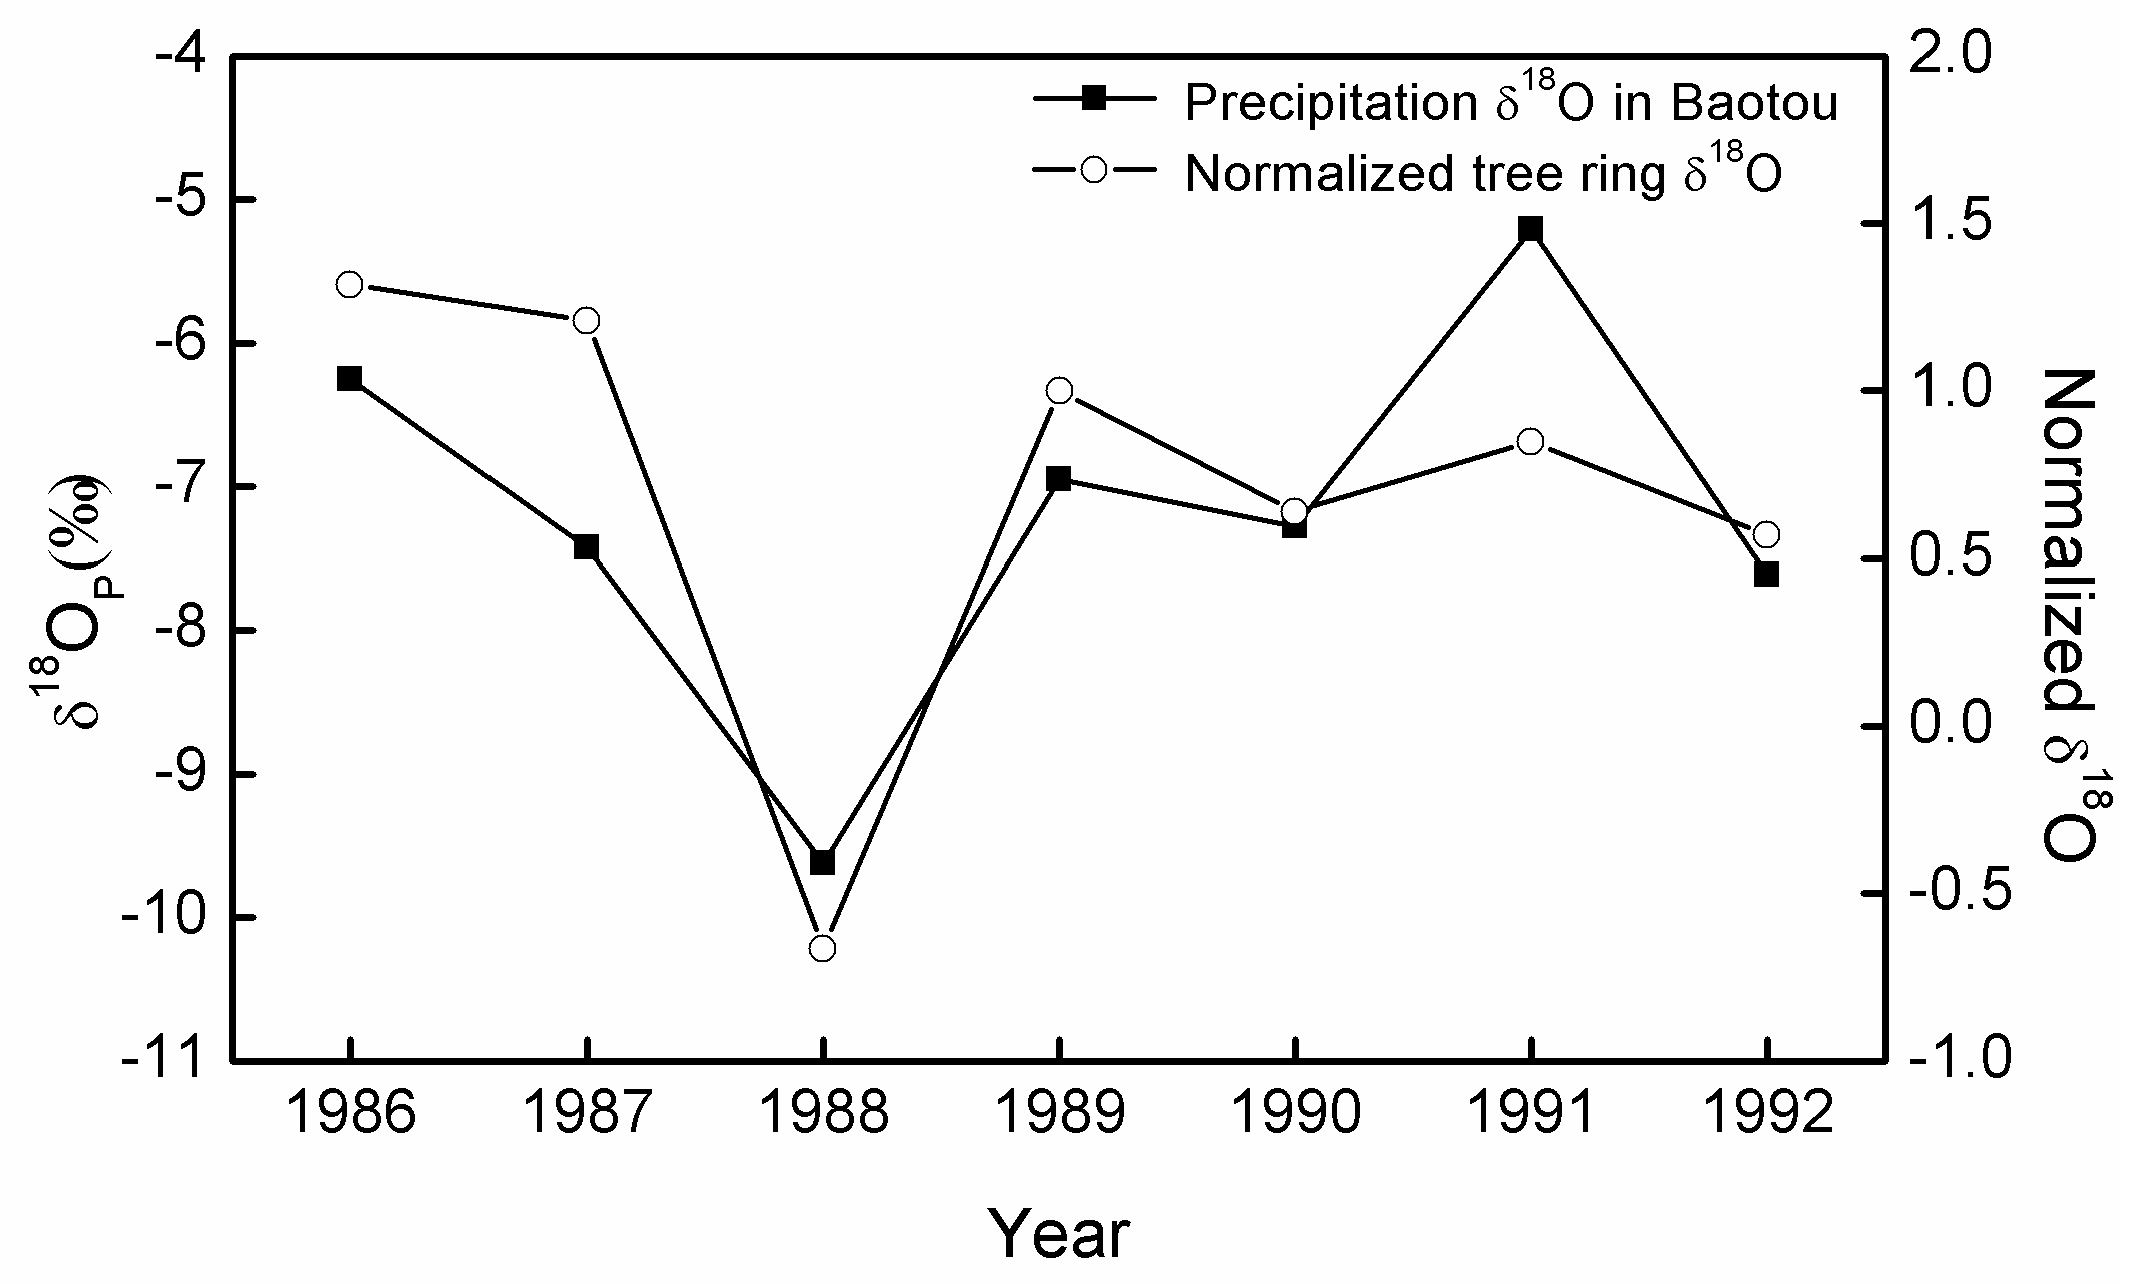
4.1. Amount Effect Reflected in δ18Otree Levels at Heng Mountain

δ18Otree was negatively correlated with precipitation, which was due to the amount effect in the isotope fractionation process [4,39]; namely, the precipitation δ18O decreases with the increase in the amount of precipitation. The study area is located in a semi-arid inland region and is located within the edge zone for monsoon activity. Although the amount effect of δ18O is not significant at the annual scale, the summer precipitation amount effect cannot be ignored [40]. The amount effect develops because of the seasonal concentrated precipitation, and the continuous Rayleigh fractionation leads to lighter isotopes occurring in rainfall. Theoretically, the water used for cellulose synthesis is provided by atmospheric precipitation, and δ18Otree reflects the precipitation δ18O level to some extent. To compare the relationship between δ18O in atmospheric precipitation and δ18Otree, the precipitation δ18O data from Baotou (40°40′ N, 109°51′ E, altitude 1067 m), which is close to the sampling site, were obtained from the global precipitation isotope network (https://nucleus.iaea.org/Pages/GNIPR.aspx accessed on 6 March 2022) for comparison with the δ18Otree sequence (Figure 12). The results show that the patterns of variation in the precipitation δ18O and in the δ18Otree were very consistent (r = 0.78, p < 0.02, n = 7).
On the other hand, precipitation had a very significant positive correlation with the relative humidity in June–July at Heng Mountain (r = 0.737, n = 57, p < 0.0001), and the correlation coefficient was 0.631 (df = 54, p < 0.0001) after the influence of temperature was excluded. This indicates that continuous precipitation or heavy rainfall can indirectly affect the relative humidity, leading to weak leaf transpiration and soil water evaporation; these processes result in the enrichment of lighter oxygen isotopes in leaf water and soil water. Thus, δ18O in tree rings is depleted, resulting in the negative correlation between precipitation and δ18Otree.

4.2. Large-Scale Circulations Affecting Precipitation in Heng Mountain

To explore the possible mechanisms affecting precipitation in this area, a 21-year sliding-window correlation between the NIÑO3 index from the HadI SST dataset and the reconstructed precipitation sequence was conducted (the black line in Figure 13). Except for weak correlations or a lack of correlation between the two series in 1910–1940 AD, a negative correlation existed for the rest of the study period. To explore the relationships among the ENSO, the ASM and the reconstructed precipitation in this study, 21-year sliding correlations were calculated between the AIRI (on behalf of the South Asian monsoon intensity) and the reconstruction sequence. The correlation coefficient curve between the Indian monsoon and the reconstructed precipitation and that between the ENSO and the reconstructed precipitation were consistently inversely correlated (r = −0.78, p < 0.001), which further indicates that the ENSO is a bridge connecting the Indian monsoon with the June–July precipitation at Heng Mountain.
For the Indian summer monsoon system, the correlation between the reconstructed precipitation and the ENSO is related to the variance of the ENSO [41]. In this paper, a significant negative correlation was found between the 21-year running standard deviation curve of the NIÑO3 index and the 21-year sliding correlation coefficient curve between NIÑO3 and the reconstructed precipitation (Figure 13B) (r = –0.45, p < 0.001). This indicates that the period of strong correlations between the ENSO and precipitation corresponds to a high standard deviation interval and that the period of weak correlations corresponds to a low standard deviation interval; these relationships explain the weak correlation between the ENSO and precipitation in the study area during 1910–1940 AD. Similar patterns have also been confirmed in studies on cloud cover changes in Southwest China [42] and precipitation reconstruction in central Thailand [43].
To clarify the relationships between the reconstructed sequence and the PDO and the AMO, correlation analysis was carried out (Figure 14). The PDO and the AMO indices were calculated from climexp.Knmi.NL based on the ERSST dataset. Then, an 11-year smoothed average was implemented for each sequence, and the correlations were calculated again. There was a significant negative correlation between the PDO index and the reconstructed precipitation (r = −0.34, p < 0.001), and the correlation coefficient increased with the 11-year smoothed average (r = −0.65). Previous studies have found that when the PDO is in the warm phase, precipitation in the eastern monsoon region (North and Northwest China) is abnormally low, and when the PDO is in the cold phase, the opposite conditions occur [44]. There was a positive correlation between the AMO index and the reconstructed precipitation sequence (r = 0.28, p < 0.001), and the correlation increased to 0.55 with the 11-year smoothed average. Feng et al., (2008) pointed out that the warm (positive) phase of the AMO heated the Tibetan Plateau and strengthened the thermal temperature gradient in the troposphere between the Tibetan Plateau and the low- to midlatitudes of the tropical Indian Ocean [45], thus strengthening the Indian summer monsoon and increasing the summer precipitation in the region affected by the South Asian summer monsoon. Yang et al. (2017) studied the influence of SST on climate change and found that the PDO dominates the distribution pattern in the eastern monsoon region of China on an interdecadal scale, that the AMO promotes or weakens the generation of this pattern, and that the AMO and PDO have a synergistic effect [46]. That is, when the PDO is in the warm phase, the basic pattern of southern flooding and northern drought in China develops. At the same time, the AMO in the cold phase promotes the development of this pattern, and vice versa. In summary, the PDO and the AMO have synergistic effects on the June–July precipitation at Heng Mountain at the decadal scale.

5. Conclusions

In this paper, a 230-year (1784–2013 AD) tree-ring δ18O chronology is established for Heng Mountain, Shanxi Province. δ18O is significantly negatively correlated with June–July precipitation in the study area (r = 0.67, p < 0.001), and the regional precipitation in June–July was reconstructed by using the tree-ring δ18O sequence. The reconstructed sequence captures the characteristics of the actual variation of the precipitation at both high and low frequencies and explains 45.0% of the observed variance. The drought periods mainly occurred in 1820–1840 AD, 1855–1865 AD, 1895–1910 AD, 1925–1930 AD, and 1970–1995 AD; the wet periods mainly occurred in 1880–1895 AD, 1910–1925 AD, and 1935–1960 AD.
The correlations of the reconstructed precipitation with the CRU grid data and comparisons with DWI and previous tree-ring reconstructions show that our reconstruction has good spatial representation and can serve as an indicator of the intensity of the Asian monsoon. The correlations between the reconstructed precipitation and the Asian monsoon indices show that the South Asian monsoon has a stronger influence on the precipitation in the study area than the EAM.
Through MTM and EEMD analyses, the potential periods of the reconstructed sequence and the possible factors affecting monsoon precipitation in the study area were identified. The spatial correlations between the reconstructed precipitation and SST and the correlations with ENSO, PDO and AMO indices showed that (1) the ENSO is a connection between the Asian monsoon and the precipitation at Heng Mountain and influences the precipitation in the study area mainly through the Indian monsoon and (2) when the PDO is in the warm (cold) phase, the study area is relatively dry (wet), and at that point, the cold (warm) phase of the AMO promotes the development of this pattern.

Supplementary Materials

The following supporting information can be downloaded at: https://www.mdpi.com/article/10.3390/f13101654/s1, Table S1: Statistical characteristics of tree ring δ18O time series. Table S2: Correlation coefficients among individual tree ring δ18O series. Table S3: Statistical characteristics of composite δ18O chronology. Table S4: Calibration and verification statistics for the PJ-J reconstruction in Heng Mountain. Table S5: Comparisons between the reconstructed precipitation and historical records. Table S6: Correlation between several Asian summer monsoon indices and the reconstructed precipitation.

Author Contributions

Conceptualization, Y.L. and W.S.; methodology, Y.L.; software, Y.L.; validation, W.S., Q.L. and W.L.; investigation, W.S. and Q.C.; resources, Y.L.; data curation, Q.L.; writing—original draft preparation, Y.L.; writing—review and editing, Q.L. and W.L.; project administration, Y.L.; funding acquisition, Y.L. All authors have read and agreed to the published version of the manuscript.

Funding

This research was funded by the National Natural Science Foundation of China (No. U1803245), the Chinese Academy of Sciences (XDA23070202, XDB40010300), the 2nd Tibetan Plateau Scientific Expedition and Research (2019QZKK0101), QYZDJ–SSW–DQC021 from CAS; DQGG0104, GJHZ1777 from the Key Project of IEECAS; and the project of the State Key Laboratory of Loess and Quaternary Geology, IEECAS (SKLLQG1822).

Conflicts of Interest

The authors declare that the research was conducted in the absence of any commercial or financial relationships that could be construed as a potential conflict of interest.

References

  1. Loader, N.J.; Robertson, I.; Barker, A.C.; Switsur, V.R.; Waterhouse, J.S. An improved technique for the batch processing of small wholewood samples to α-cellulose. Chem. Geol. 1997, 136, 313–317. [Google Scholar] [CrossRef]
  2. Brendel, O.; Iannetta, P.P.M.; Stewart, D. A rapid and simple method to isolate pure alpha-cellulose. Phytochem. Anal. 2000, 11, 7–10. [Google Scholar] [CrossRef]
  3. Mccarroll, D.; Loader, N.J. Stable isotopes in tree rings. Quat. Sci. Rev. 2004, 23, 771–801. [Google Scholar] [CrossRef]
  4. Dansgaard, W. Stable isotopes in precipitation. Tellus 1964, 16, 436–468. [Google Scholar] [CrossRef]
  5. Liu, Y.; Liu, H.; Song, H.M.; Li, Q.; Burr, G.S.; Wang, L.; Hu, S.L. A monsoon-related 174-year relative humidity record from tree-ring δ18O in the Yaoshan region, eastern central China. Sci. Total Environ. 2017, 593, 523–534. [Google Scholar] [CrossRef]
  6. Liu, Y.; Song, H.M.; Sun, C.F.; Song, Y.; Cai, Q.F.; Liu, R.S.; Lei, Y.; Li, Q. The 600-mm precipitation isoline distinguishes tree-ring width responses to climate in China. Natl. Sci. Rev. 2019, 6, 359–368. [Google Scholar] [CrossRef] [Green Version]
  7. Li, Q.; Liu, Y.; Nakatsuka, T.; Liu, R.S.; Cai, Q.F.; Song, H.M.; Wang, S.J.; Sun, C.F.; Fang, C.X. Delayed warming in Northeast China: Insights from an annual temperature reconstruction based on tree-ring δ18O. Sci. Total Environ. 2020, 749, 141432. [Google Scholar] [CrossRef]
  8. Sano, M.; Tshering, P.; Komori, J.; Fujita, K.; Xu, C.; Nakatsuka, T. May–September precipitation in the Bhutan Himalaya since 1743 as reconstructed from tree ring cellulose δ18O. J. Geophys. Res.-Atmos. 2013, 118, 8399–8410. [Google Scholar] [CrossRef]
  9. Xu, G.B.; Liu, X.H.; Qin, D.H.; Chen, T.; Wang, W.Z.; Wu, G.J.; Sun, W.Z.; An, W.L.; Zeng, X.M. Tree-ring δ18O evidence for the drought history of eastern Tianshan Mountains, northwest China since 1700 AD. Int. J. Climatol. 2015, 34, 3336–3347. [Google Scholar] [CrossRef]
  10. Liu, Y.; Wang, R.Y.; Leavitt, S.W.; Song, H.M.; Linderholm, H.W.; Li, Q.; An, Z.S. Individual and pooled tree-ring stable-carbon isotope series in Chinese pine from the Nan Wutai region, China: Common signal and climate relationships. Chem. Geol. 2012, 330, 17–26. [Google Scholar] [CrossRef]
  11. Liu, Y.; Cai, W.J.; Sun, C.F.; Song, H.M.; Cobb, K.M.; Li, J.P.; Leavitt, S.W.; Wu, L.X.; Cai, Q.F.; Liu, R.S.; et al. Anthropogenic aerosols cause recent pronounced weankening of Asian summer monsoon relative to last four centuries. Geophys. Res. Lett. 2019, 46, 5469–5479. [Google Scholar] [CrossRef] [Green Version]
  12. Cai, Q.; Liu, Y.; Tian, H. A dendroclimatic reconstruction of May–June mean temperature variation in the Heng Mounatins, north China, since 1767 AD. Quatern Int. 2013, 283, 3–10. [Google Scholar] [CrossRef]
  13. Sun, J.; Liu, Y. Responses of tree-ring growth and crop yield to drought indices in the Shanxi province, North China. Int. J. Biometeorol. 2013, 58, 1521–1530. [Google Scholar] [CrossRef]
  14. Li, Q.; Nakatsuka, T.; Kawamura, K.; Liu, Y.; Song, H.M. Hydroclimate variability in the North China Plain and its link with El Nino-Southern Oscillation since 1784 AD: Insights from tree-ring cellulose δ18O. J. Geophys. Res.-Atmos. 2011, 116, D22. [Google Scholar] [CrossRef] [Green Version]
  15. Li, Q.; Liu, Y.; Nakatsuka, T.; Song, H.M.; Mccarroll, D.; Yang, Y.K.; Qi, J. The 225-year precipitation variability inferred from tree-ring records in Shanxi Province, the North China, and its teleconnection with Indian summer monsoon. Glob. Planet Change 2015, 132, 11–19. [Google Scholar] [CrossRef] [Green Version]
  16. Speer, J.H. Fundamentals of Tree-Ring Research; The University of Arizona Press: Tucson, AZ, USA, 2010. [Google Scholar]
  17. Whistler, R.L.; Wolfrom, M.L.; Bemiller, J.N.; Shaw, D.H. (Eds.) Methods in Carbohydrate Chemistry; Academic Press: New York, NY, USA, 1964. [Google Scholar]
  18. Sharp, Z.D.; Atudorei, V.; Durakiewicz, T. A rapid method for determination of hydrogen and oxygen isotope ratios from water and hydrous minerals. Chem. Geol. 2001, 178, 197–210. [Google Scholar] [CrossRef]
  19. Fritts, H.C. Tree Rings and Climate: Calibration; Academic Press: New York, NJ, USA, 1976. [Google Scholar]
  20. Wigley, T.M.L.; Briffa, K.; Jones, G.P.D. On the average value of correlated time series, with applications in dendroclimatology and hydrometeorology. J. Appl. Meteorol. Clim. 1984, 23, 201–213. [Google Scholar] [CrossRef]
  21. Cook, E.R.; Meko, D.M.; Stahle, D.W.; Cleaveland, M.K. Drought reconstructions for the continental United States. J. Clim. 1999, 12, 1145–1162. [Google Scholar] [CrossRef]
  22. Liu, Y.; Cai, Q.F.; Shi, J.F.; Hughes, M.K.; Kutzbach, J.E.; Liu, Z.Y.; Ni, F.B.; An, Z.S. Seasonal precipitation in the south-central Helan Mountain region, China, reconstructed from tree-ring width for the past 224 years. Can. J. For. Res. 2005, 35, 2403–2412. [Google Scholar] [CrossRef]
  23. Li, Q.; Liu, Y.; Cai, Q.F.; Sun, J.Y.; Yi, L.; Song, H.M.; Wang, L. Reconstruction of annual precipitation since 1686 AD from Ningwu region, Shanxi province. Quat. Sci. 2006, 26, 999–1006. (In Chinese) [Google Scholar]
  24. Su, K.; Bai, H.Y.; Zhang, Y.; Huang, X.Y.; Qin, J. Reconstruction of precipitation history in Taibai Mountain of Qinling Mountains based on tree-ring width and meteorological data in recent 160 years. Chin. J. Ecol. 2018, 37, 1467–1475. (In Chinese) [Google Scholar]
  25. Wen, K.; Ding, Y. China Meteorological Disaster Compilation Committee; Meteorological Press: Beijing, China, 2006. (In Chinese) [Google Scholar]
  26. Shen, C.; Wang, W.C.; Hao, Z.; Gong, W. Characteristics of anomalous precipitation events over eastern China during the past five centuries. Clim. Dynam. 2008, 31, 463–476. [Google Scholar] [CrossRef]
  27. Liang, E.Y.; Liu, X.H.; Yuan, Y.J.; Qin, N.S.; Fang, X.Q.; Huang, L.; Zhu, H.F.; Wang, L.; Shao, X.M. The 1920s Drought Recorded by Tree Rings and Historical Documents in the Semi-Arid and Arid Areas of Northern China. Clim. Change 2006, 79, 403–432. [Google Scholar] [CrossRef]
  28. Dong, A.X.; Liu, Y.P.; Li, X.P.; Bai, H.Z. Characteristics and Influence of the Extreme Drought Event Lasting Eleven Years (1922–1932) in the Yellow River Valley. J. Arid. Meteorol. 2010, 28, 270–278. (In Chinese) [Google Scholar]
  29. Li, Y.J.; Gou, X.H.; Fang, K.Y.; Yang, T.; Deng, Y.; Man, Z.H. Reconstruction of precipitation of previous August to current June during 1821–2008 in the Eastern Qilian Mountains. J. Desert Res. 2012, 32, 1393–1401. (In Chinese) [Google Scholar]
  30. Mann, M.E.; Lees, J.M. Robust estimation of background noise and signal detection in climatic time series. Clim. Change 1996, 33, 409–445. [Google Scholar] [CrossRef]
  31. Miller, A.J.; Angell, J.K.; Korshove, J. Quasi-Biennial Oscillations in Tropospheric Energy. Mon. Weather. Rev. 1974, 102, 390–393. [Google Scholar] [CrossRef]
  32. Lau, K.M.; Kim, K.M.; Yang, S. Dynamical and Boundary Forcing Characteristics of Regional Components of the Asian Summer Monsoon. J. Clim. 2000, 13, 2461–2482. [Google Scholar] [CrossRef]
  33. Webster, P.J.; Yang, S. Monsoon and ENSO: Selectively interactive system. Q. J. R. Meteor. Soc. 2010, 118, 877–926. [Google Scholar] [CrossRef]
  34. Wang, B.; Wu, Z.; Li, J.; Jian, L.; Wu, G. How to Measure the Strength of the East Asian Summer Monsoon. J. Clim. 2008, 21, 4449–4463. [Google Scholar] [CrossRef]
  35. Zhu, C.W.; He, J.H.; Wu, G.X. East Asian monsoon index and its inter-annual relationship with largesca-le thermal dynamic circulation. Acta Meteorol. Sin. 2000, 58, 391–402. (In Chinese) [Google Scholar]
  36. Liu, Y.; Wang, L.; Li, Q.; Cai, Q.F.; Song, H.M.; Sun, C.F.; Liu, R.S.; Mei, R.C. Asian summer monsoon-related relative humidity record by tree-ring δ18O during last 205 years. J. Geophys. Res. Atmos. 2019, 124, 17–18. [Google Scholar] [CrossRef]
  37. Zhang, Q.Y.; Tao, S.Y.; Chen, L.T. The interannual variability of East Asian summer monsoon indices and its association with the pattern of general circulation over East Asia. Acta Meteorol. Sin. 2003, 61, 559–568. [Google Scholar]
  38. Xie, S.P.; Du, Y.; Huang, G.; Zheng, X.T.; Tokinaga, H.; Hu, K.M.; Liu, Q.Y. Decadal shift in el nino influences on indo-western pacific and east asian climate in the1970s. J. Clim. 2010, 23, 3352–3368. [Google Scholar] [CrossRef]
  39. Rozanski, K.; Luis, A.A.; Gonfiantini, R. Isotopic Patterns in Modern Global Precipitation[M]// Climate Change in Continental Isotopic Records; American Geophysical Union (AGU): Washington, DC, USA, 2013. [Google Scholar]
  40. Yamanaka, T.; Tsujimura, M.; Oyunbaatar, D.; Davaa, G. Isotopic variation of precipitation over eastern Mongolia and its implication for the atmospheric water cycle. J. Hydrol. 2007, 333, 21–34. [Google Scholar] [CrossRef]
  41. Torrence, C.; Webster, P.J. Interdecadal changes in the ENSO-monsoon system. J. Clim. 1999, 12, 2679–2690. [Google Scholar] [CrossRef]
  42. Liu, X.H.; An, W.L.; Treydte, K.; Shao, X.M.; Leavitt, S.; Hou, S.G.; Chen, T.; Sun, W.Z.; Qin, D.H. Tree-ring δ18O in southwestern China linked to variations in regional cloud cover and tropical sea surface temperature. Chem. Geol. 2012, 291, 104–115. [Google Scholar] [CrossRef]
  43. Xu, C.; Pumijumnong, N.; Nakatsuka, T.; Sano, M.; Guo, Z. Inter-annual and multi-decadal variability of monsoon season rainfall in central Thailand during the period 1804–1999, as inferred from tree ring oxygen isotopes. Int. J. Climatol. 2018, 38, 5766–5776. [Google Scholar] [CrossRef]
  44. Yu, M.; Jin, H. Influence of The Pacific Interdecadal Oscillation on summer Precipitation in the eastern Monsoon Region of China. Heilongjiang Meteorol. 2015, 32, 18–20. (In Chinese) [Google Scholar]
  45. Feng, S.; Hu, Q. How the North Atlantic Multidecadal Oscillation may have influenced the Indian summer monsoon during the past two millenia. Geophys. Res. Lett. 2008, 35, 548–562. [Google Scholar] [CrossRef]
  46. Yang, Q.; Ma, Z.; Xu, B. Modulation of monthly precipitation patterns over East China by the Pacific Decadal Oscillation. Clim. Change 2017, 144, 1–13. [Google Scholar] [CrossRef]
Figure 1. Sampling site, meteorological stations and previous study sites used for comparisons in this paper [6,11,15].
Forests 13 01654 g001
Figure 2. Monthly distribution of (A) temperature, (B) precipitation, (C) relative humidity and (D) arithmetical average of climatic factors from Yuanping and Shuozhou meteorological stations (1957–2013 AD).
Forests 13 01654 g002
Figure 3. (A) Tree ring δ18O series from the six samples in this study, (B) EPS and Rbar statistics and (C) composite normalized δ18O chronology of Heng Mountain.
Forests 13 01654 g003
Figure 4. Correlations between tree ring δ18Otree chronology and climatic factors. (A) Mean monthly temperature. (B) Total monthly precipitation. (C) Mean relative humidity. M–A: May–August; JJ: June–July.
Forests 13 01654 g004
Figure 5. Comparison between the observed and the reconstructed PJ-J (1957–2013 AD). (A) The original series. (B) The first order difference series.
Forests 13 01654 g005
Figure 6. Reconstructed June–July precipitation (black line) during 1784–2013 AD. The blue line is the 11-yr moving average.
Forests 13 01654 g006
Figure 7. The spatial correlation between PJ-J series and the CRU precipitation gridded data of corresponding years. (a) The observation during 1957–2013 AD, (b) the reconstruction during 1957–2013 AD, (c) the observation during 1957–1980 AD, (d) the reconstruction during 1957–1980 AD, (e) the observation during 1980–2013 AD, (f) the reconstruction during 1980–2013 AD.
Forests 13 01654 g007
Figure 8. Comparison between the reconstruction in this study and other records. (A) The reconstructed precipitation variations in this paper, (B) the DWI in Xinzhou [26], (C) the June–August relative humidity in Ordos Plateau [6], (D) the annual precipitation from previous-year August to current-year July in Ningwu [15], and (E) the annual precipitation from previous July to current June in western Loess Plateau [11]. Black lines: original data; blue lines: 10-yr low-passed filtered; dotted boxes: common wet or dry period; red arrows: drought trend.
Forests 13 01654 g008
Figure 9. Multi-taper method spectrum analysis of the reconstruction.
Forests 13 01654 g009
Figure 10. The ensemble empirical mode decomposition of the reconstruction precipitation.
Forests 13 01654 g010
Figure 11. Spatial correlations between the reconstructed precipitation and SST.
Forests 13 01654 g011
Figure 12. Comparison between tree-ring δ18O of Heng Mountain and precipitation δ18O from June to July in Baotou.
Forests 13 01654 g012
Figure 13. (A) The 21-yr sliding-window correlation (red line) between the reconstruction and all Indian Rainfall index, compared with the 21-yr sliding-window correlation (black line) between the reconstruction and the NIÑO3 SST index, (B) the 21-yr sliding-window correlation (black line) between the reconstruction and the NIÑO3 SST index, compared with the 21-yr running standard deviation of NIÑO3 SST index.
Forests 13 01654 g013
Figure 14. Comparisons of the reconstruction precipitation with (A) the PDO index (B) the AMO index.
Forests 13 01654 g014
Table 1. Correlations between the reconstructed precipitation of June–July and NIÑO4, NIÑO3.4, NIÑO3, NIÑO1+2, MEI, and SOI indices at the same months.
ENSO IndicesData Setr (Whole Period)r (1950–2013 AD)
NIÑO4ERSST(1854–)−0.31/160, 0.001−0.29/64, 0.05
HadISST(1870–)−0.32/144, 0.001−0.28/64, 0.05
NIÑO3.4ERSST(1854–)−0.29/1600, 0.001−0.40/64, 0.001
HadISST(1870–)−0.33/144, 0.001−0.39/64, 0.001
NIÑO3ERSST(1854–)−0.28/160, 0.001−0.45/64, 0.001
HadISST(1870–)−0.31/144, 0.001−0.44/64, 0.001
NIÑO1 + 2ERSST(1854–)−0.23/160, 0.01−0.43/64, 0.001
HadISST(1870–)−0.22/144, 0.01−0.36/64, 0.005
MEIESRL/PSD(1950–)−0.50/64, 0.001/
SOIJones(1866–)0.19/148, 0.050.38/64, 0.005
Publisher’s Note: MDPI stays neutral with regard to jurisdictional claims in published maps and institutional affiliations.

