Article

Drought Shapes Photosynthetic Production Traits and Water Use Traits along with Their Relationships with Leaves of Typical Desert Shrubs in Qaidam

Hebei Key Laboratory of Environmental Change and Ecological Construction, Hebei Technology Innovation Center for Remote Sensing Identification of Environmental Change, School of Geographical Sciences, Hebei Normal University, Shijiazhuang 050024, China
*
Author to whom correspondence should be addressed.
Forests 2022, 13(10), 1652; https://doi.org/10.3390/f13101652
Submission received: 21 August 2022 / Revised: 2 October 2022 / Accepted: 7 October 2022 / Published: 9 October 2022
(This article belongs to the Section Forest Ecophysiology and Biology)

Abstract

:
Leaf functional traits in drylands are sensitive to environmental changes, which are closely related to plant growth strategies and resource utilization ability and can reflect the balance of substance synthesis and water loss. However, the influence of environmental factors on photosynthetic production traits and water use traits is still unclear in drylands. In this study, nine environmental factors (climatic characteristics and soil physical and chemical properties), leaf net photosynthetic rate (A), transpiration rate (E), and stomatal conductance (GSW) were measured via 60 plant samples and 45 soil samples, which were collected at five sampling sites according to rainfall gradient. Redundancy analysis (RDA), structural equation model (SEM), and regression analysis were used to analyze the influencing mechanism of drought on photosynthetic production traits and water use traits. The results provided the following conclusions: (i) The hydrothermal condition determined A, E, and GSW by affecting the spatial distribution of soil nutrients (SN) and soil salinity (SS); meanwhile, temperature was able to affect A, E, and GSW directly. (ii) The water content (WC) was the key driver of the strength of the synergistic relationship between photosynthetic production traits and water use traits; soil salinity (SS) was the main driver of the synergistic relationship between E and GSW.

1. Introduction

On a global scale, land warming has increased the intensity of drought events, further degrading the terrestrial ecosystems [1,2,3,4]. The degradation of ecosystem function is exaggerated in drylands such as high-altitude deserts due to their high vulnerability to climate change [5,6]. Therefore, the desert ecosystem is an ideal area to study the effects of global climate change. Moreover, it is of great significance to explore how drylands respond to changes in climate in order to reveal the adaptive mechanism of plants to arid environments under global warming.
As the photosynthetic organ and the main dwelling place of plants, the functional traits of leaves are highly sensitive to environmental changes and are easy to measure, which is an effective indicator for better understanding of plant response to climate change. Reich et al. [7] have proposed the idea that leaf functional traits depend on plant genetic characteristics and are modified by various environmental factors. The conclusion has been increasingly accepted, including in arid desert areas. For example, Ma et al. [8] studied the relationship between leaf traits of desert plants and soil factors, finding that soil water content and soil pH were the critical factors affecting the leaf properties in the Hexi Corridor, Northwestern China. In another study, Lu et al. [9] found that temperature and precipitation had a significant interaction for leaf functional traits of zonal stipa from Inner Mongolian grassland. These studies have recorded the fact that the response patterns of plant functional traits to different environmental factors (climate factors and soil factors) were different in arid areas. However, the response mechanism of plant functional traits to these environmental factors is still unclear, and the relationships between various environmental factors also need to be clarified.
The relationship among plant functional traits is also reshaped by the environment [10,11]. Wright et al. [12] proposed the concept of “leaf economics spectrum” (LES) by using the global database of leaf functional traits, revealing the covariation among leaf functional traits. With the development of field observation, laboratory experiment, and model prediction, the leaf economic spectrum has been improved, and the study of plant water use traits and photosynthetic production traits has been strengthened. It has been suggested that plant photosynthetic production traits and water use traits vary synergistically [13], but it has also been shown that the relationship between photosynthetic and water use traits in plant leaves is not invariant [14,15,16,17]. Plant photosynthetic processes and water use are closely related. When leaf stomata open to obtain more CO2 for photosynthesis, plants reduce the efficiency of water use due to reduced stomatal resistance to transpiration and thus enhance transpiration [13]. Meanwhile, the stomata-forming guard cells are partially utilized by CO2 in the light, and the pH rises, forming malic acid [18]. Malic acid dissociates into H+ and malic acid root, and under the action of the H/K pump, intracellular K+ concentration increases, water potential decreases, stomata open, and transpiration efficiency is enhanced [19]. This will cause the plant to reduce its photosynthetic rate due to insufficient photosynthetic material. In other words, the efficiency of plant water utilization is reduced along with the photosynthetic rate. In addition, plants need to increase transpiration pull in order to ensure water supply in too dry or too hot areas, and should avoid too strong transpiration leading to dehydration and death [20]. Therefore, plants must adapt to the environment and maintain their normal growth and development process by maintaining the “carbon–water balance” in their bodies.
The degree and direction of the sensitivity of photosynthesis to water stress in arid areas are not consistent. Transpiration pull is the main driver of water transport in plants [21]. Locke and Ort [22,23] found that the reduction of water potential due to transpiration in soybean leaves under drought conditions was strongly correlated with the reduction of net photosynthetic rate through field and indoor water-controlled experiments. In another study, Yin et al. [24] observed the maximum net photosynthetic rate, transpiration efficiency, and stomatal opening of woody plants on the Loess Plateau. They found that some photosynthetic traits (leaf thickness, maximum net photosynthetic rate, etc.) and water use traits (leaf vein density, leaf edge material area ratio, etc.) were decoupled, although the two sets of traits were generally coupled in different drought gradients. In arid zones, plants may adapt to their environment along the water gradient by changing the strength and direction of the relationship between photosynthetic and water use traits for their own survival and reproduction.
On the basis of the above considerations, the two scientific hypotheses of this study were proposed: in arid areas, (i) how do environmental factors via interacting with each other directly or indirectly affect photosynthesis and water use traits? (ii) does water condition determine the tradeoff between photosynthetic production traits and water use traits of plant leaves? The typical desert shrub communities in the eastern Qaidam Basin were taken as the research object, and five sites along the precipitation gradient were selected, in which there was a total of nine typical desert shrub species. The maximum net photosynthetic rate (A) that indicates plant photosynthetic characteristics, as well as the transpiration efficiency (E) and stomatal conductance (GSW) that indicate water use characteristics, were determined to explore the remodeling of leaf photosynthetic production traits and water use traits in arid habitats, as well as to test the tradeoff between photosynthetic production traits and water use traits along the drought gradient.

2. Materials and Methods

2.1. Study Area

The study area is located in the east of the Qaidam Basin of the Qinghai–Tibetan Plateau (Figure 1), with a continental desert climate of the plateau, cold and dry, with scarce precipitation and being mostly concentrated in summer [25]. The vegetation types are mainly shrub and sub-shrub, and the soil types are brown calcium soil, chestnut soil, and gray-brown desert soil, with low nutrient content (Table 1) and significant spatial heterogeneity. Five sites were sampled in 2021 (Figure 1), and samples were collected during the plant growing season of July to August 2021. The plots ranged from 2857 to 3323 m above sea level. Growing season (from May to September) temperature (GST) and growing season precipitation (GSP) range from 10.64 to 15.08 ℃ and from 48.49 to 221.44 mm, respectively. The habitat aridity index (AI) ranges from 4.92 to 28.98, and the dominant species in the plant community involved nine species of C.k., S.r., K.g., etc. (Table 1).

2.2. Field Survey and Sampling

Field investigation was conducted from 27 July to 1 August 2021. A total of 60 leaf samples of 9 dominant plants were collected from 5 sites (Table 1, Figure 1). The sampling plots were selected in the open and flat area with the same vegetation type and no human interference. Three 10 × 10 m quadrats were randomly arranged in each plot according to the plant characteristics of the community [15,26]. Each plot consisted of 2 to 5 dominant species, and 3 to 5 healthy adult leaves were selected from each species to measure the maximum net photosynthetic rate (A), transpiration efficiency (E), and stomatal conductance (GSW) of plant leaves with the Li-6800 photosynthetic apparatus at 10:00–12:00 a.m. to ensure sampling uniformity.
Three soil profiles of 30 cm depth were set randomly at each site, and soil samples were collected at three depths (0–10 cm, 10–20 cm, and 20–30 cm). A total of 45 soil samples were collected from 5 sites. The fresh soil samples were first screened through a 2.0 mm sieve to remove roots and stones. Then, each soil sample was divided into two parts: one was dried in a 105 ℃ oven for 24 h for soil moisture measurement, and the other was air-dried for physical and chemical properties analysis. Soil moisture content was measured as the weight difference between fresh and oven-dried soils.

2.3. Experimental Method

In order to test the soil environment in the study area, total nitrogen (STN, g/kg) was measured by an Italian Euro Vector EA3000 elemental analyzer. Soil organic carbon (SOC, g/kg) was determined by the sulfuric acid–potassium dichromate oxidation method. Soil total potassium (STK, g/kg) was determined by a FP6440 alkali fusion flame photometer. Soil total phosphorus (STP, g/kg) was measured by the alkali fusion–molybdenum antimony anti colorimetric method. Soil soluble salts (SS) were measured by a conductivity meter in a mixture of soil and water with a soil-to-water ratio of 1:5.

2.4. Processing of Climate Data

Monthly temperature and precipitation data (the spatial resolution was 1 km) were downloaded from National Earth System Science Data Sharing Infrastructure, National Science and Technology Infrastructure of China (http://loess.geodata.cn, accessed on 4 May 2022), for the plant growing seasons between the years 1991 and 2020. The yearly potential evapotranspiration data (PET), whose spatial resolution was 250 m, was provided by the Chengdu Institute of Mountain Hazards and Environment, Chinese Academy of Sciences (http://sites.uea.ac.uk/cru/, accessed on 4 May 2022). PET data were downloaded from the years 1991 to 2020.
Monthly temperature and precipitation from the years 1991 to 2020 were integrated into GST, GSP, and mean annual precipitation (MAP). The ratio of PET to MAP describes the yearly AI. GST, GSP, and AI values in the most recent 30 years were extracted for each site according to its geographical coordinates in ArcGIS (The software is developed by the Environment System Research Institute in America and the version is 10.2).

2.5. Data Analysis

In this study, the relative coverage of species (Table 1) was used as the weight to calculate the community-weighted mean (CWM) of leaf functional traits. In order to eliminate the strong collinearity of environmental factors, the existing environmental factors were classified into four categories according to their characteristics: water content (WC), soil nutrients (SN), growing season temperature (GST), and soil salinity (SS). Among them, WC includes three indicators of growing season precipitation (GSP), soil water content (SWC), and aridity index (AI); soil nutrients include four indicators of STN, STP, STK, and STOC; growing season temperature includes one indicator of GST; and soil salinity includes one indicator of SS. To further analyze the relative contributions of each factor of moisture content (WC) and each factor of soil nutrients (SN), principal component analysis was used to score the moisture content index and soil nutrient indexes together (Table 2) and they were downscaled; the scored results were labeled as WC and SN (Table 2) to characterize the moisture characteristics and nutrient characteristics in the environment [27].
Redundancy analysis (RDA) was performed on leaf functional traits and environmental factors from different plant communities to derive the importance ranking of environmental factors [28], and we constructed a structural equation model (SEM) to derive the reticulation relationship between environmental factors and functional traits [29]. Personal correlation analysis was used to calculate the correlation between photosynthetic production traits and water use traits of plant leaves under different drought gradients [30]. Finally, regression analysis was conducted with the correlation between different leaf functional traits as response variables and environmental factors as explanatory variables to test the effects of different environmental factors on the relationship between leaf functional traits.
All of the above analysis and visualization was performed in R (The software is developed by R Core Team in Austria and the version is 4.0.2).

3. Results

3.1. Changes of Photosynthetic Production Traits and Water Use Traits of Plants along Precipitation Gradient

The community-weighted mean (CWM) of plant functional traits was selected to characterize the average trait characteristics of the community as a response to the differences in the same functional trait across the community (Figure 2). CWMA changed in a “V” shape with the precipitation gradient but decreased rapidly in the wettest Dulan region. CWMA in the Golmud and Delhi areas were significantly higher than that in the Nomuhong and Dulan areas. Both CWME and CWMGSW showed an upward trend with precipitation gradient. These results indicated that in addition to precipitation conditions, other environmental factors such as temperature (GST) and soil nutrients (SNs) during the growing season could also have important effects on leaf functional traits.
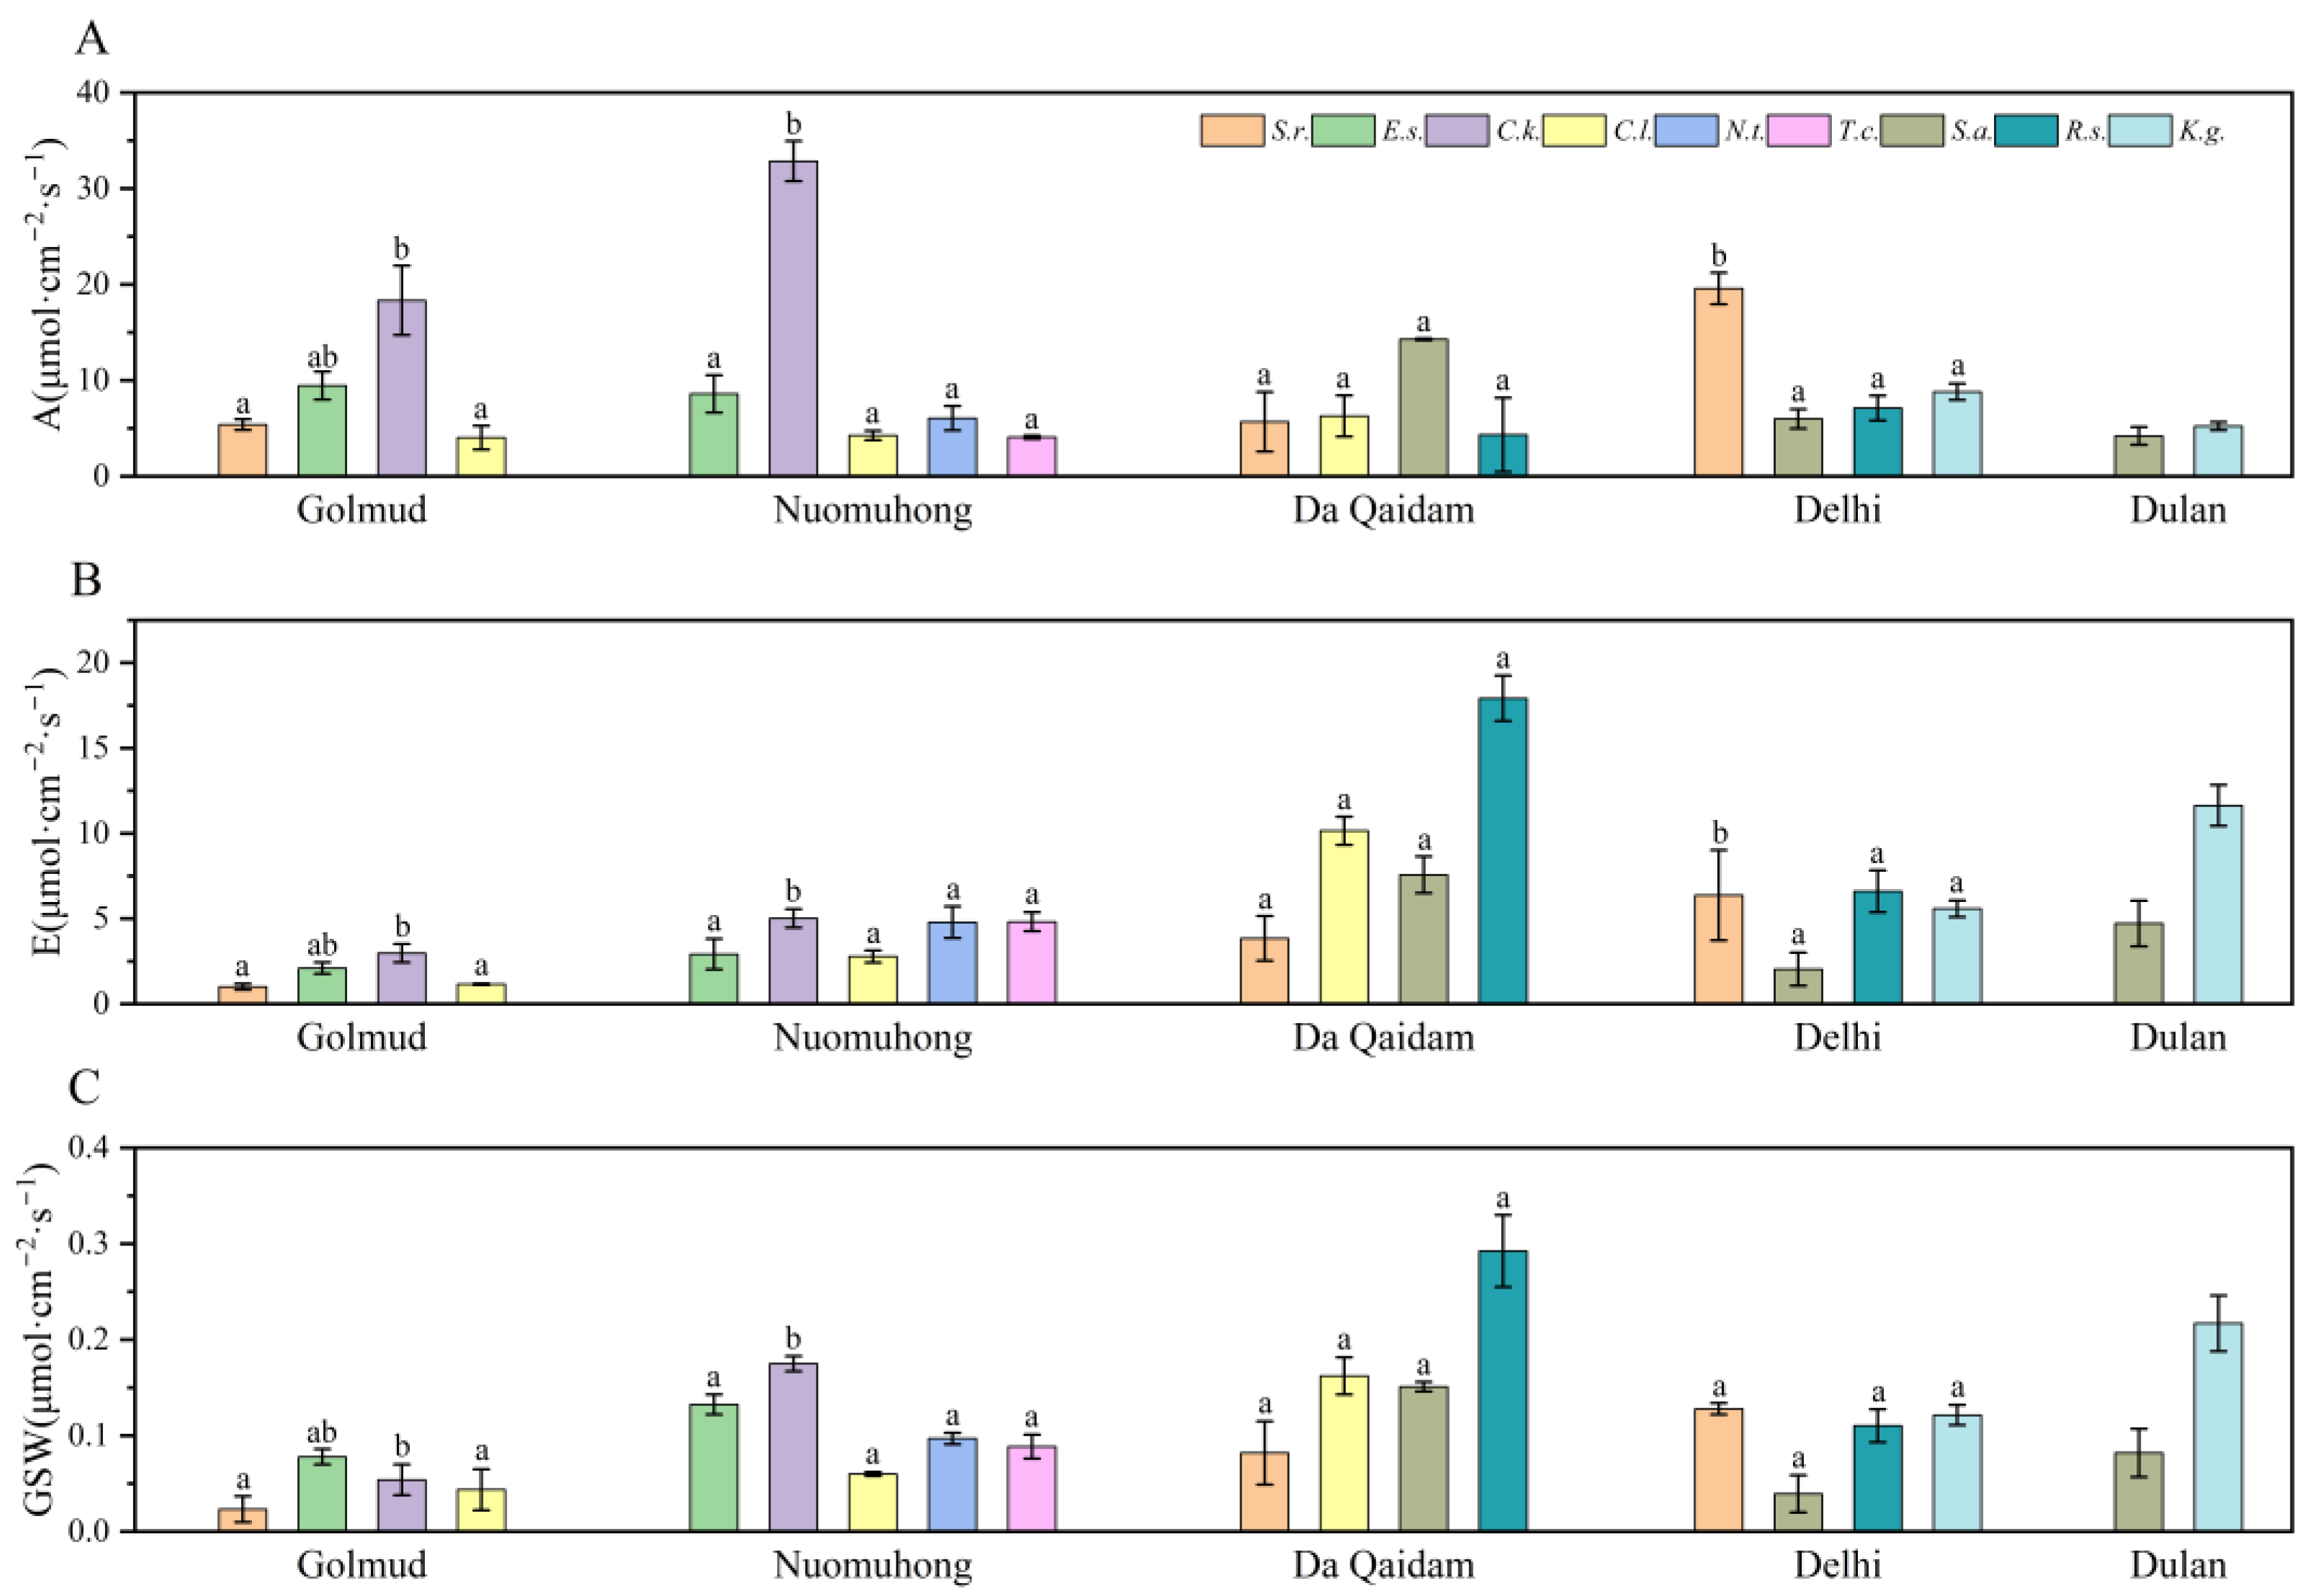
The trait differences at the species scale were examined (Figure 3), and A, E, and GSW of most species were higher in mildly arid communities such as Dulan and Delhi than in severely arid communities such as Golmud and Nuomuhong. The species of the largest relative covers in Delhi and Dulan were S.a. and K.g., respectively, with significantly higher E and GSW than other species, and the CWME and CWMGSW were higher in both sites than in other communities, suggesting that species attributes explained the differences in CWME and CWMGSW of different communities to some extent. The species of largest relative cover in the Golmud community was the C4 plant: C.k., whose A was significantly higher than that of other C3 plants, which may explain the higher CWMA in Golmud. However, S.a. (C3–C4) had a larger relative cover in Dulan, but its A was significantly lower than other species and had the lowest CWMA in Dulan, indicating that species attributes could not fully explain the differences in CWMA among communities, and thus we need to further explore the effects of other factors.

3.2. Relationship between Plant Functional Traits and Environmental Factors

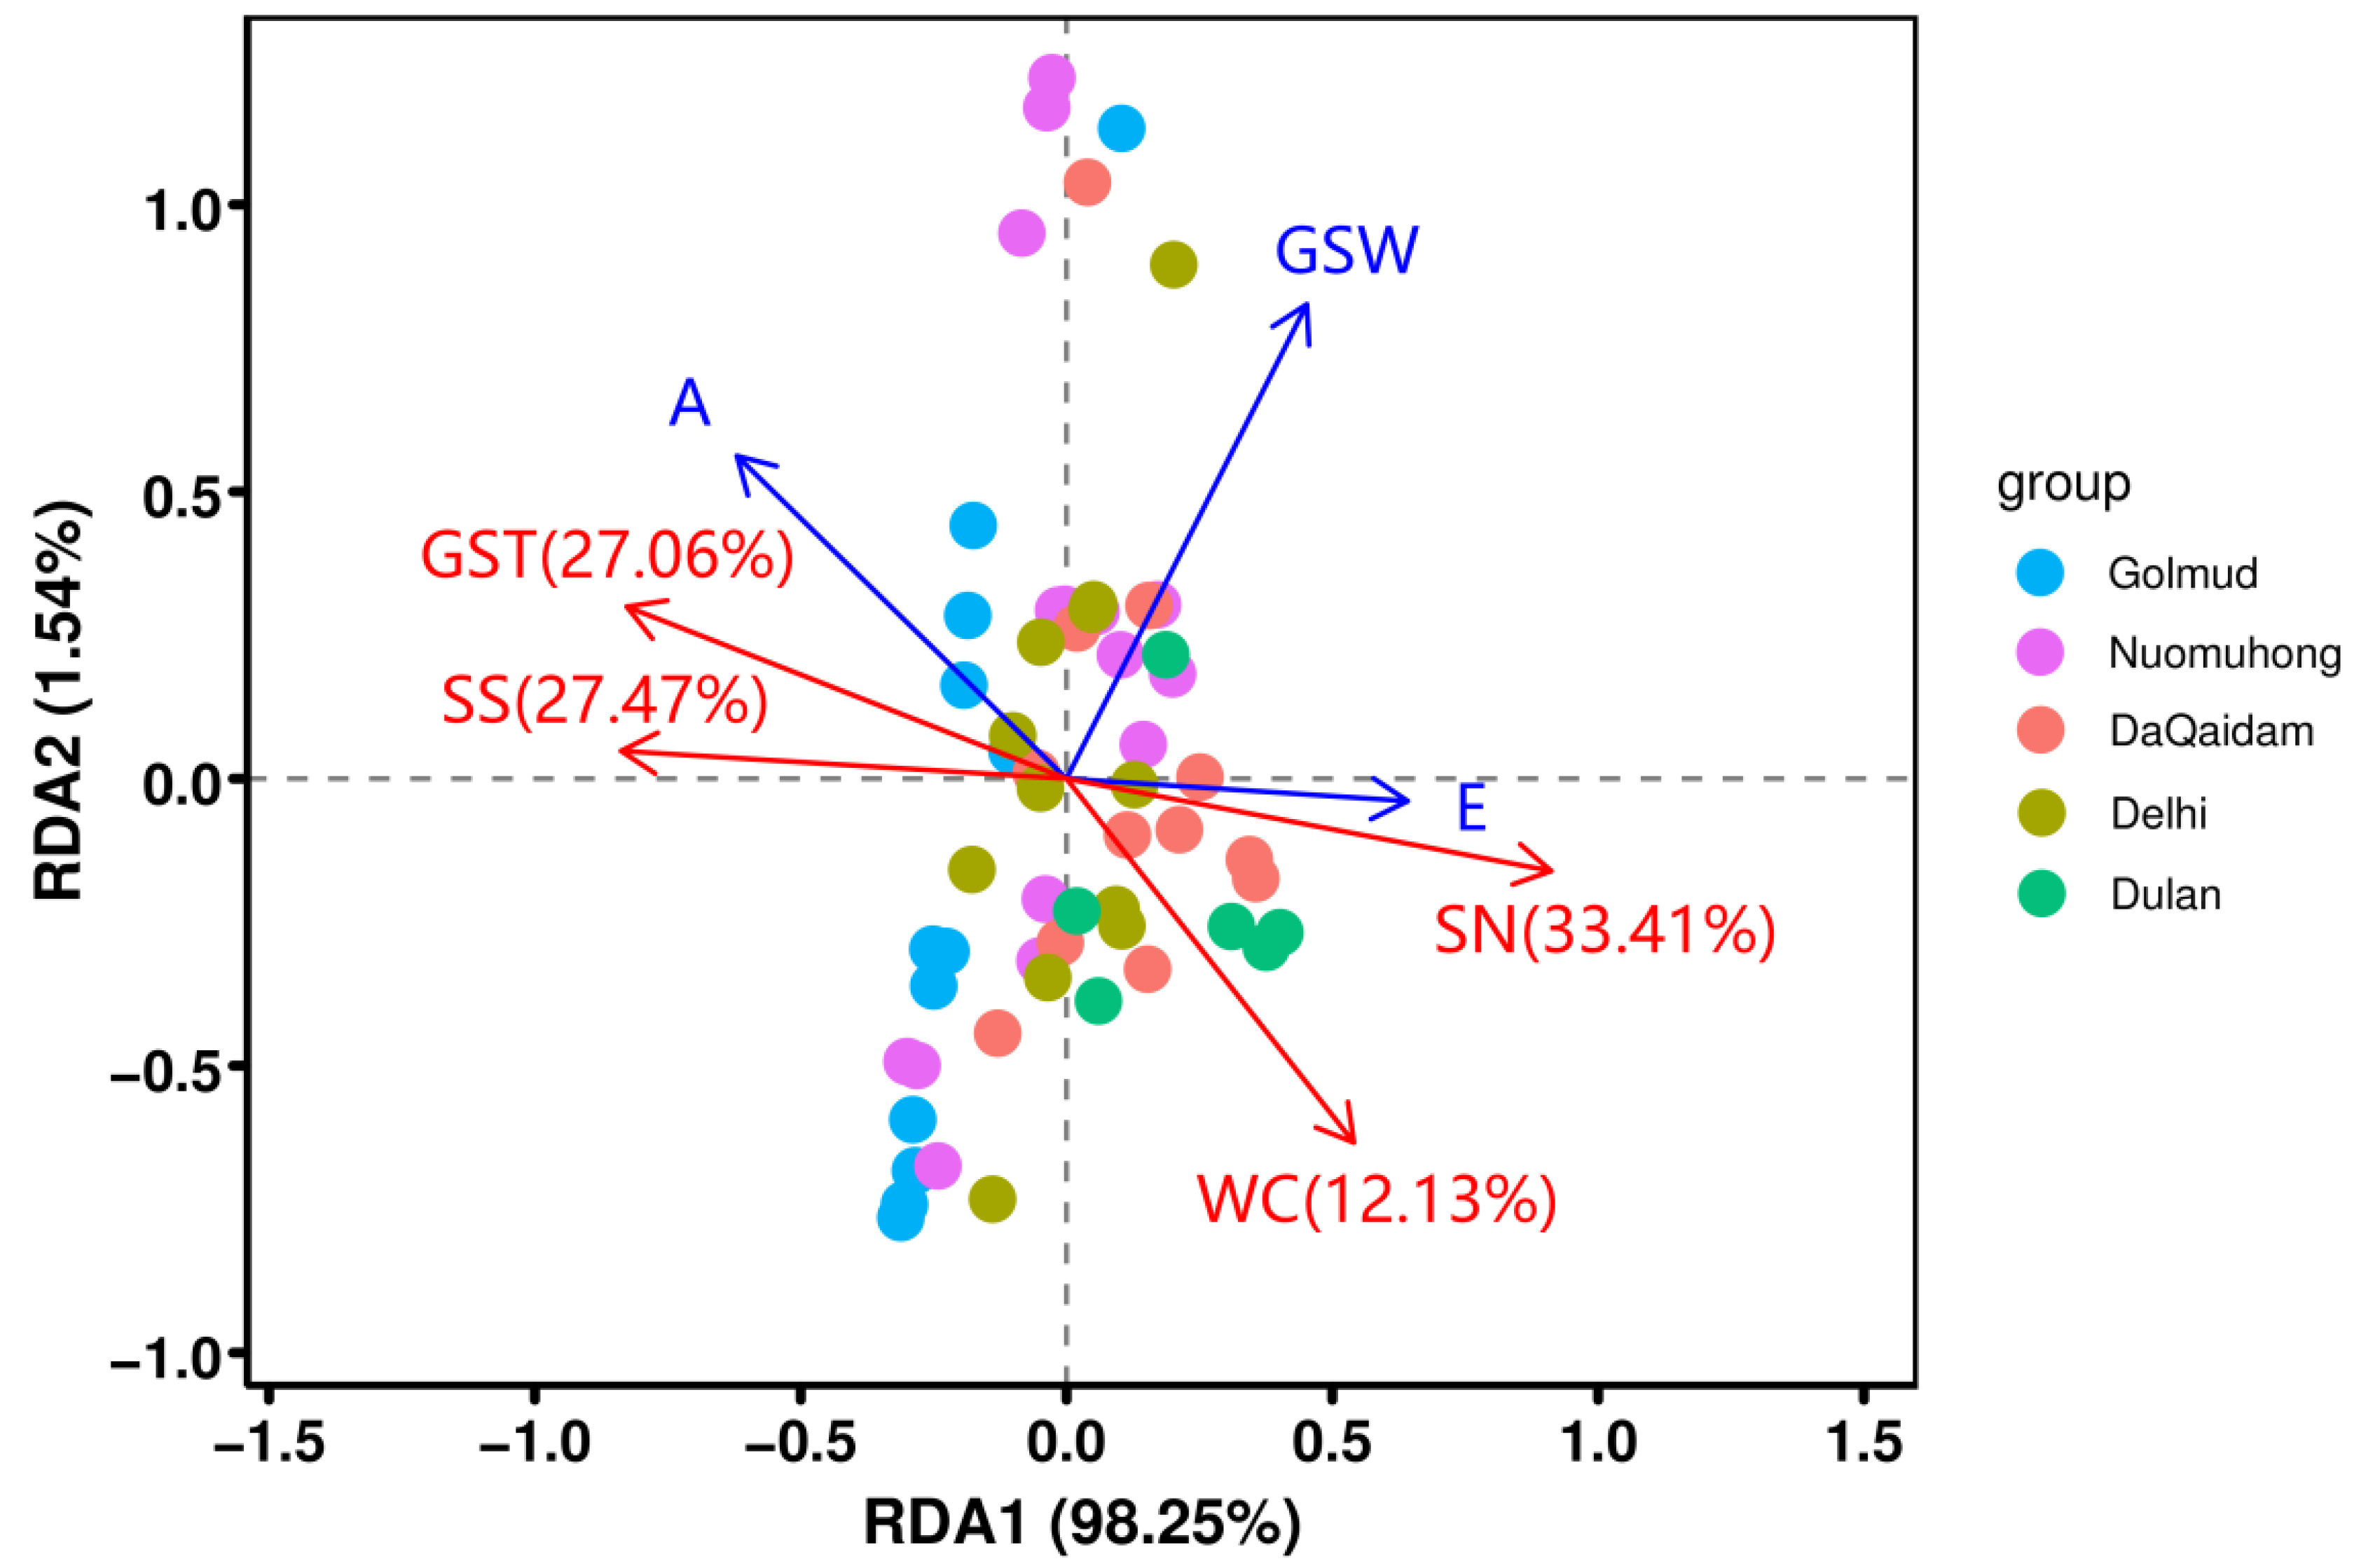
RDA analysis was conducted to further explore the relationship between leaf functional traits of plant communities and WC, SN, GST, and SS (Figure 4). The four environmental variables explained 53.44% of the total variation of leaf functional traits in plant communities. The explanatory information of the first two axes were 98.25% and 1.54%, respectively, and the cumulative explanatory amount was 99.79%, indicating that the first two axes can effectively reflect the relationship between leaf functional traits and environmental factors, being mainly determined by the first axis. The Monte Carlo test was conducted on WC, SN, GST, and SS, and the importance order of environmental factors was obtained. SN had the highest explanatory rate (33.41%) (p < 0.01), indicating that SN was a direct factor affecting leaf functional traits in plant communities.
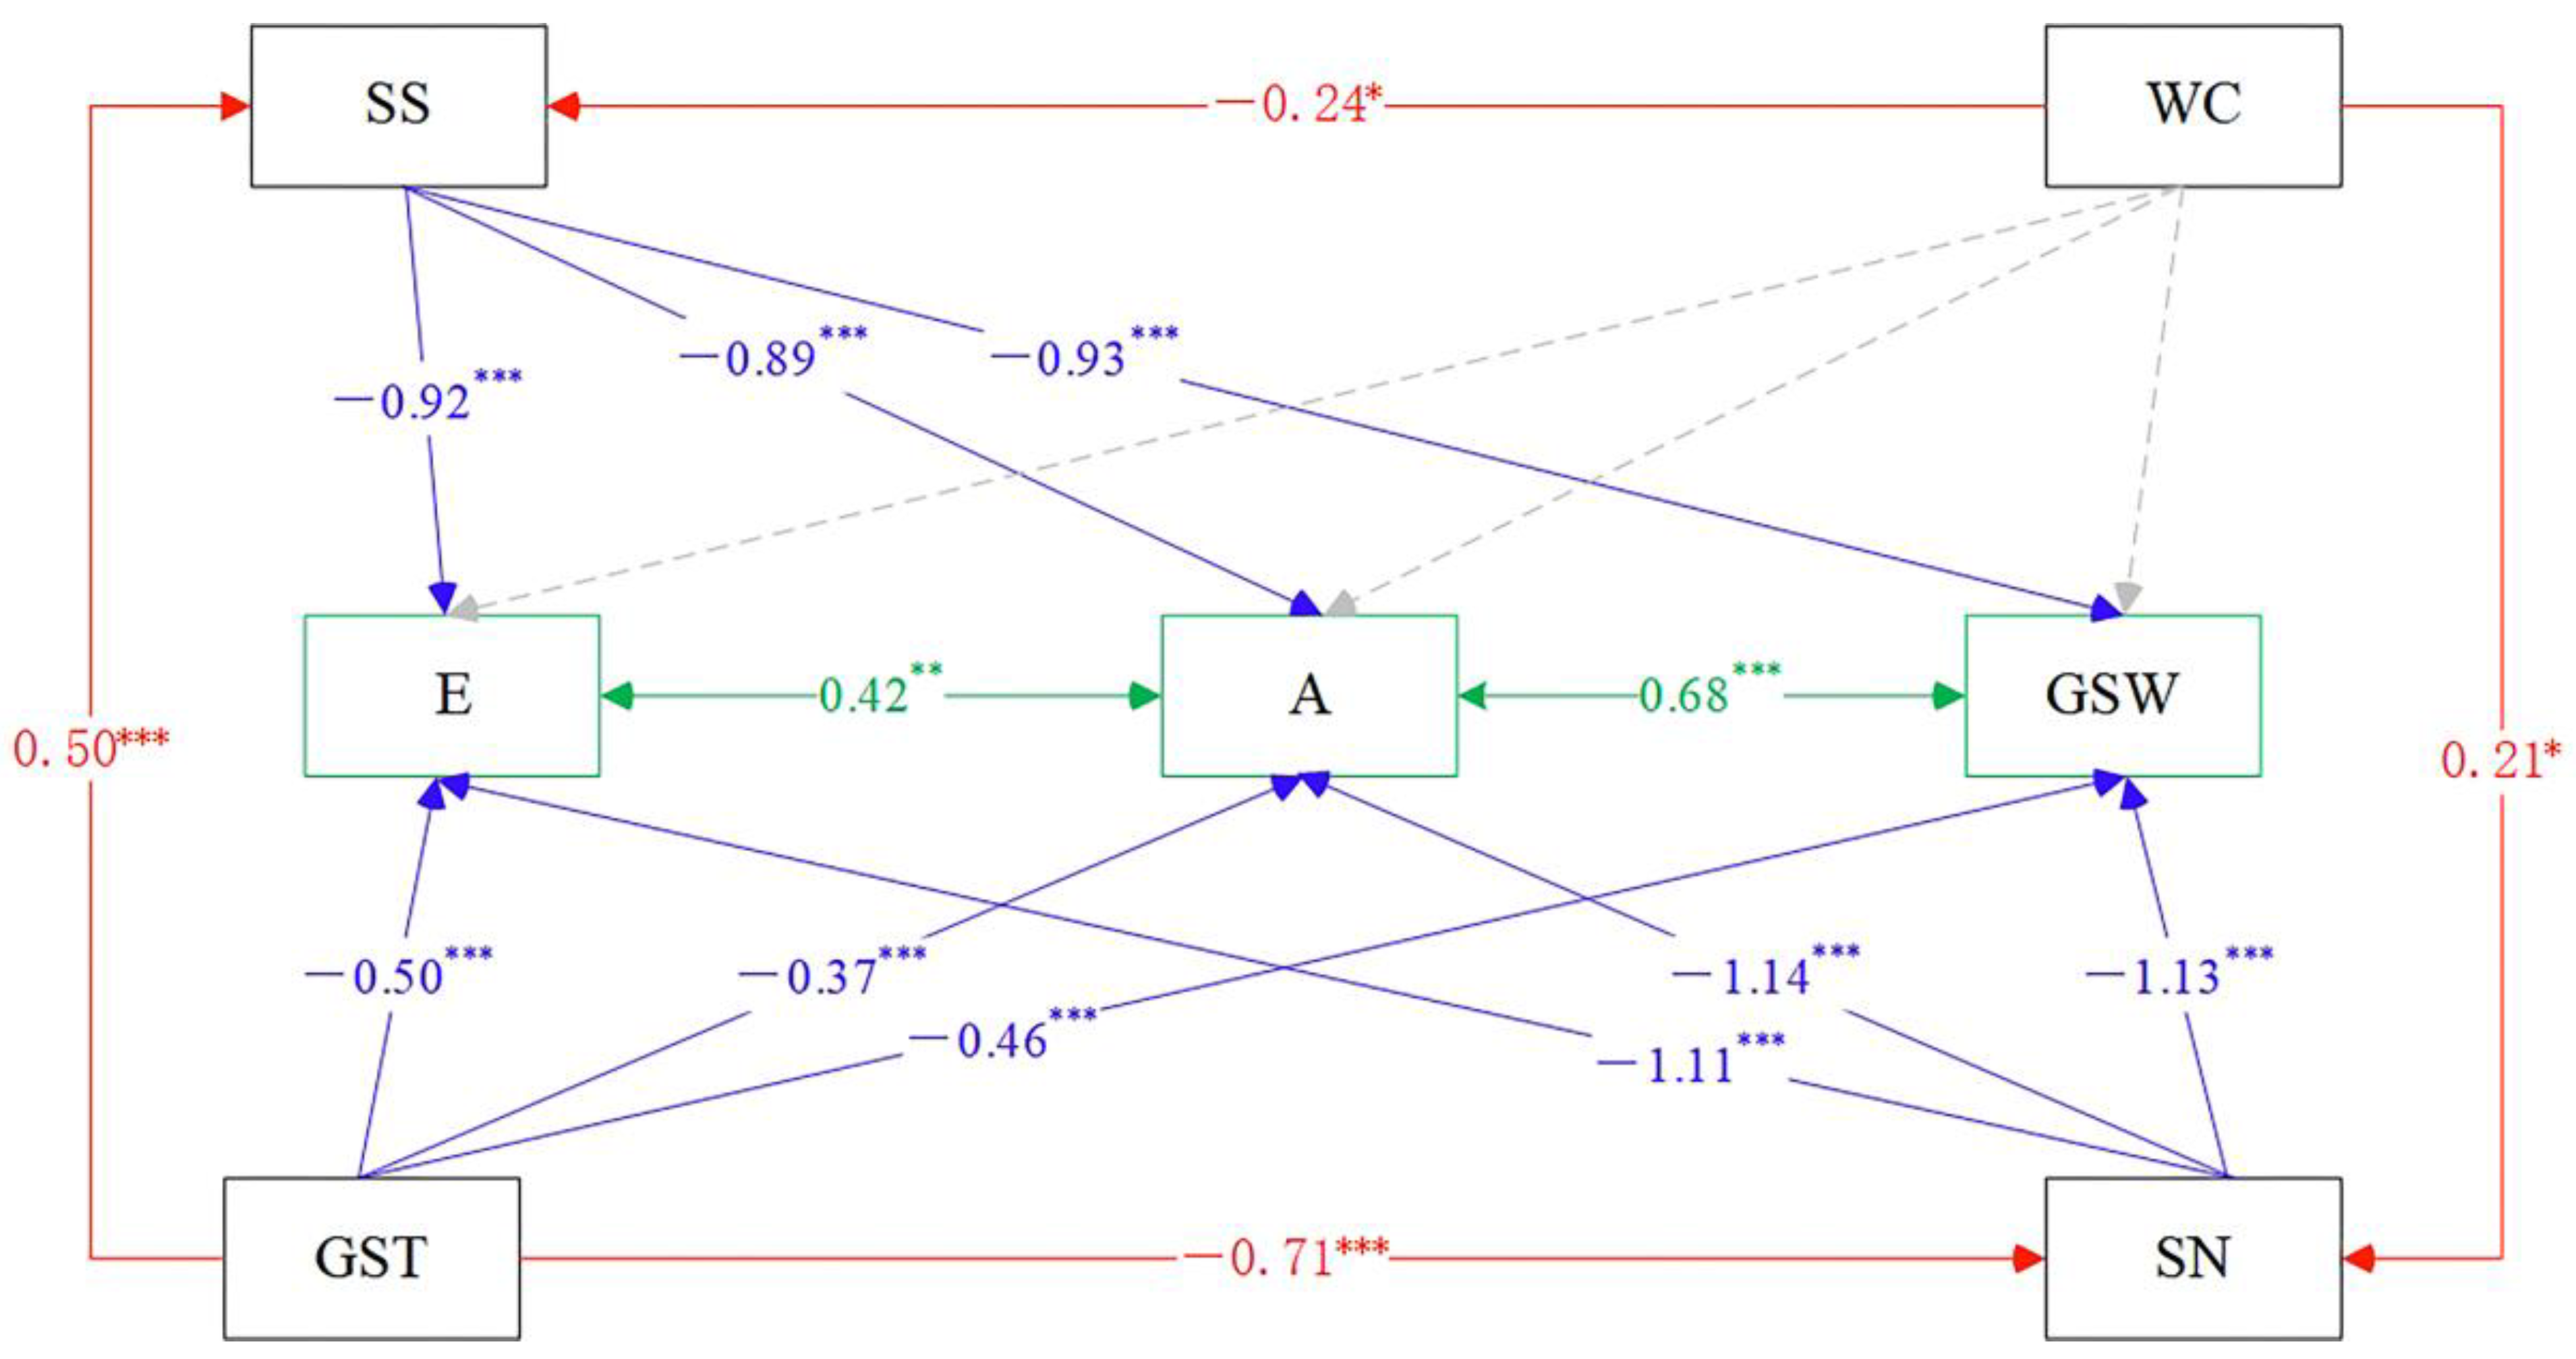
On the basis of RDA analysis, the structural equation model (SEM) was constructed for A, E, GSW, and environmental factors (Figure 5). Larger absolute values of the path coefficients in SEM represent a higher degree of explanation of the dependent variable on the independent variable; GFI (goodness of fit index) >0.6 represents a good fit of the model [31]. It was found that the absolute values of the path coefficients of SN and A, GSW, and E were 1.14 (p < 0.001), 1.13 (p < 0.001), and 1.11 (p < 0.001), respectively; the absolute values of the path coefficients of SS and A, GSW, and E were 0.89 (p < 0.001), 0.93 (p < 0.001), and 0.92 (p< 0.001), respectively, indicating that SN and SS could better explain the variation of A, GSW, and E. The path coefficients of WC, and SN and SS were 0.21 (p < 0.05) and −0.24 (p < 0.05), respectively. The path coefficients of GST, and SN and SS were −0.71 (p < 0.001) and 0.50 (p < 0.001), respectively, indicating that WC and GST could better explain the variation of SN and SS. These results indicate that WC and GST affect photosynthetic production traits and water use traits of plant leaves by affecting SN and SS in the Qaidam desert ecosystem.

3.3. Changes of Relationships among Plant Functional Traits along the Drought Gradient

Leaf photosynthetic production traits and leaf water use traits showed a synergistic relationship at different drought gradients, and the strength of the synergistic relationship showed regular changes with drought relief (Table 3). The synergistic relationship between plant transpiration efficiency (E) and net photosynthetic efficiency (A) and drought degree showed a linear relationship, and the synergistic relationship decreased with the alleviation of drought degree. Except for Golmud, the synergistic relationship between stomatal conductance (GSW) and net photosynthetic efficiency (A) decreased with drought relief, but was generally stronger in severely arid communities than in lightly arid communities. The synergistic relationship between transpiration efficiency (E) and stomatal conductance (GSW) changed in an “V” shape with drought relief, with the highest value occurring in Dulan and Golmud, and the lowest in Nuomuhong.
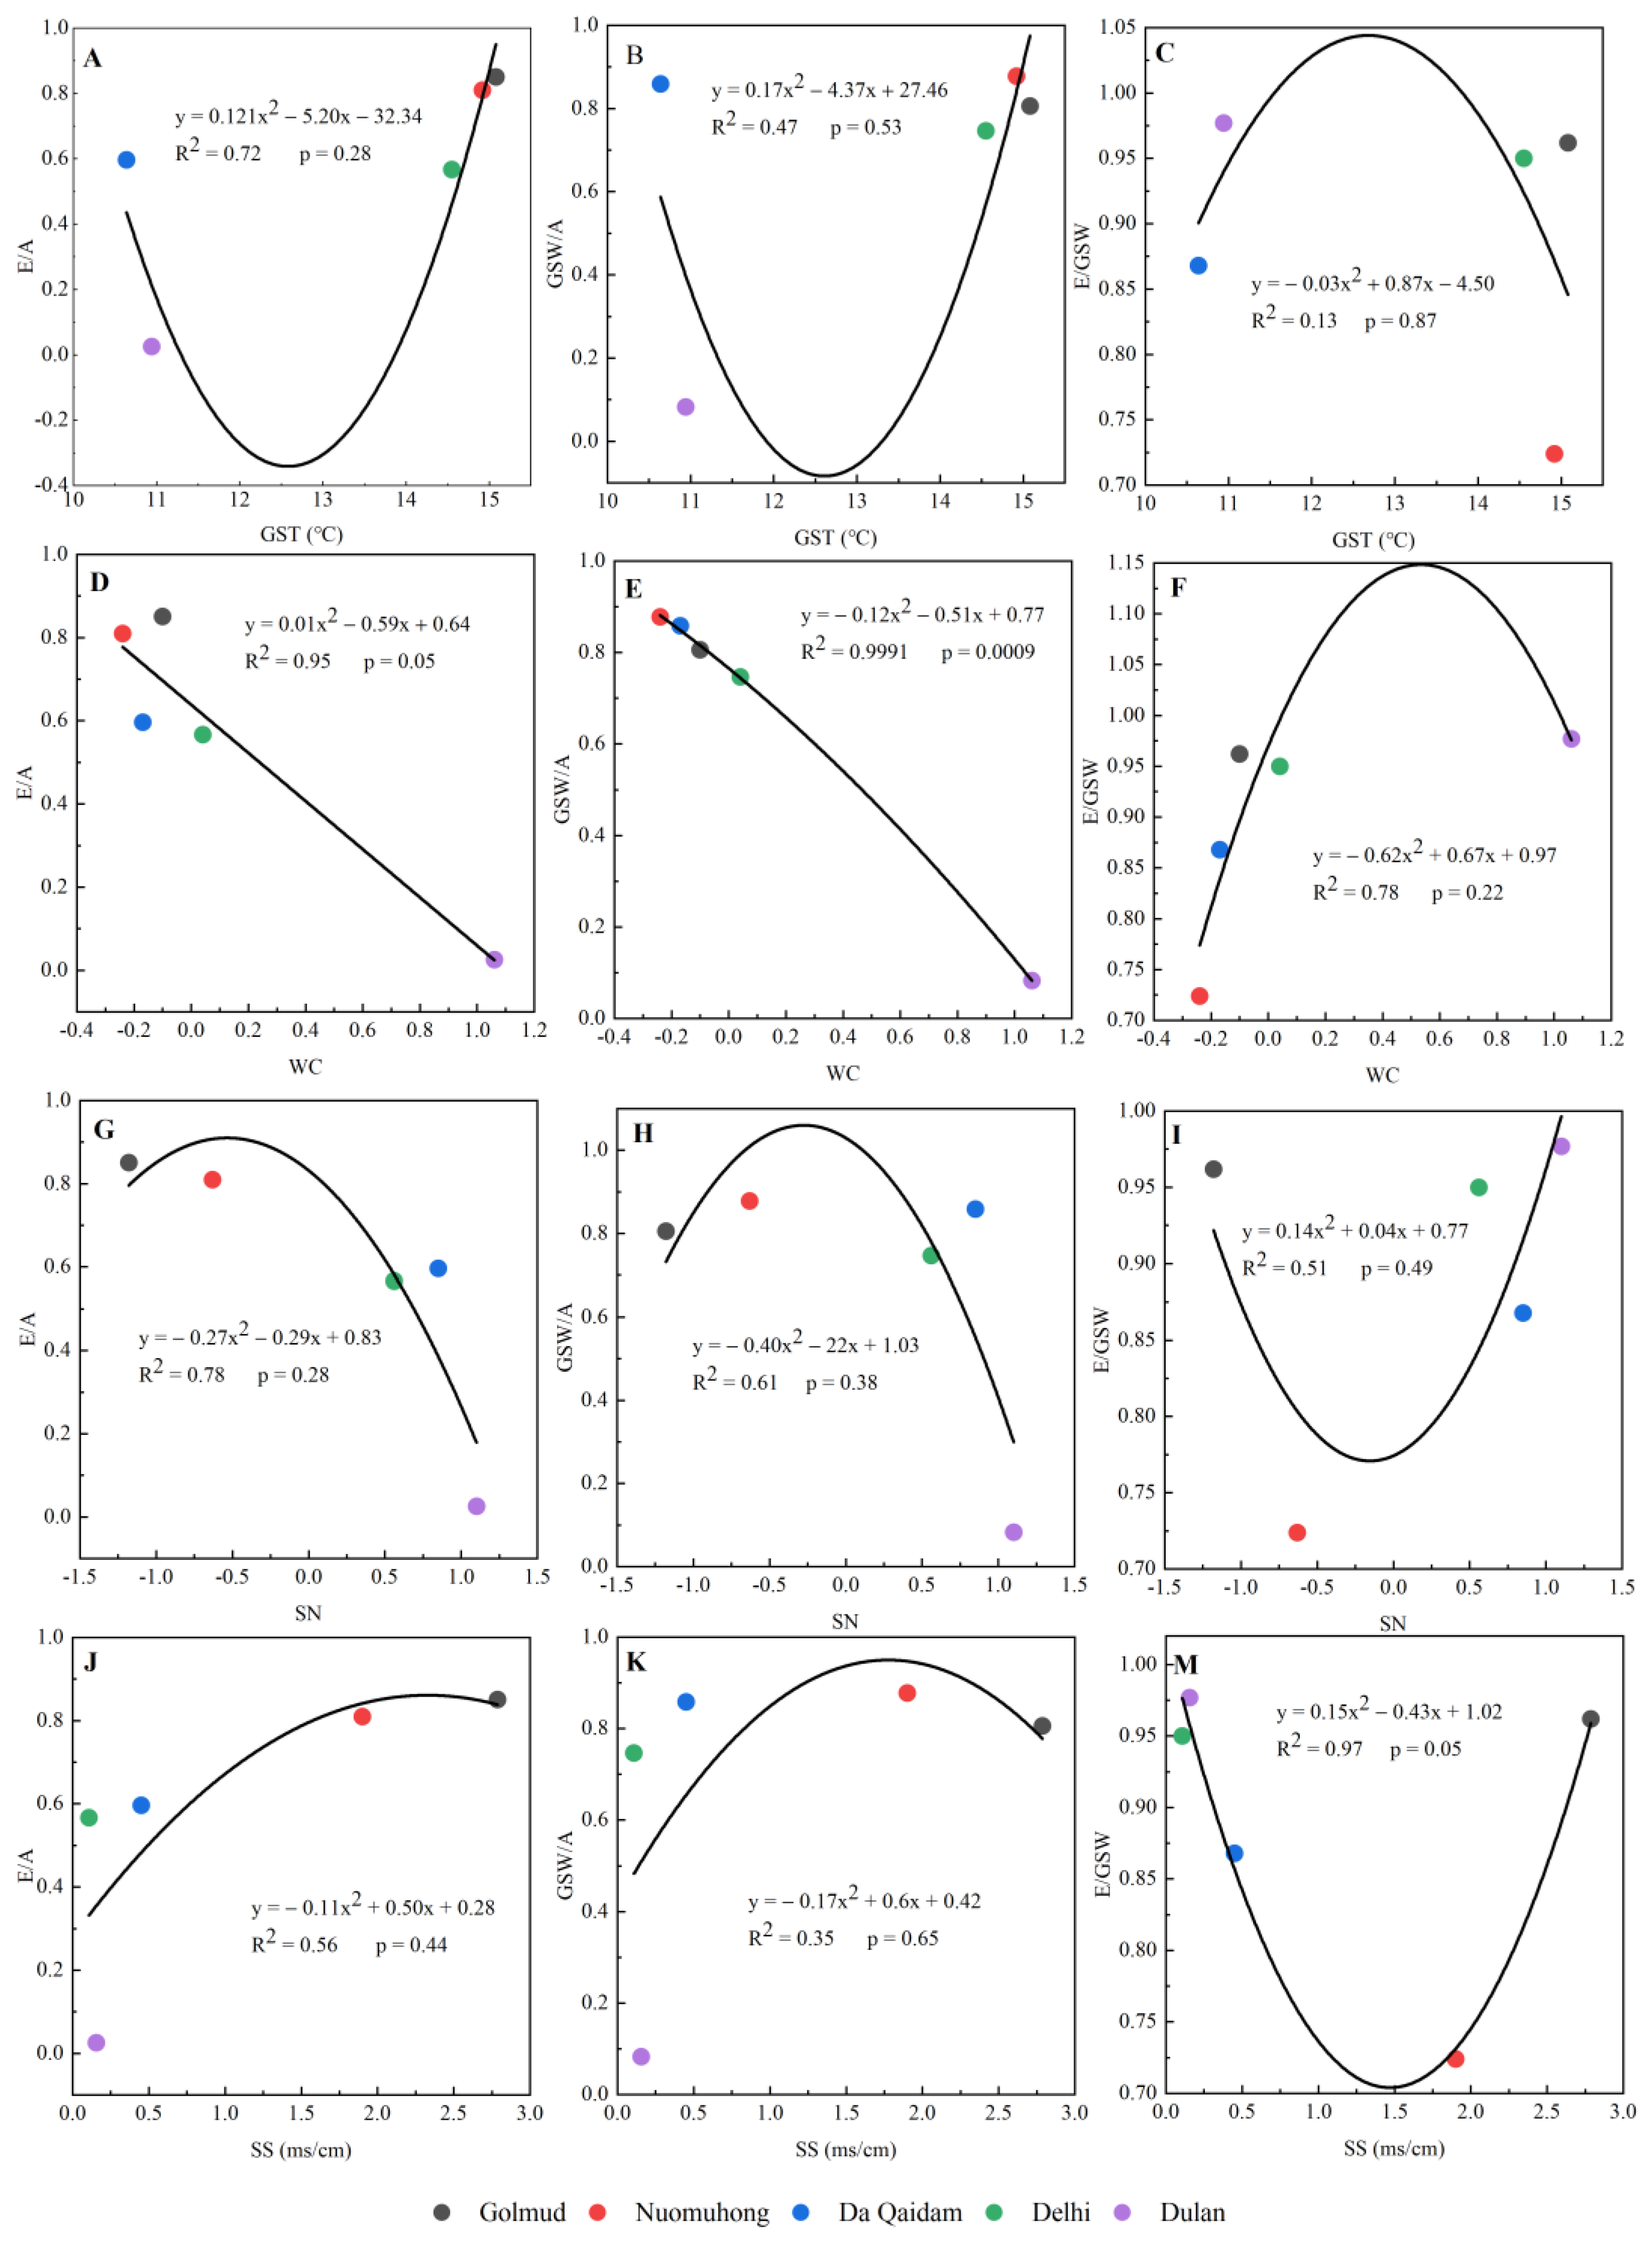
The strength of the synergy relationship between E and A was significantly correlated with water content (p < 0.05) and decreased linearly with the increase in water content (Figure 6F). The strength of the synergistic relationship between GSW and A was significantly correlated with water content (p < 0.01) and decreased with the increase in water content (Figure 6B). The synergistic strength of plant water use traits (E, GSW) was significantly correlated with SS (p < 0.05) (Figure 6M).

4. Discussion

4.1. Characteristics of Photosynthetic Production Traits and Water Use Traits of Plants and Their Influencing Factors

In this study, CWMA did not change linearly with drought index, which may have been related to the C3 and C4 species composition of communities. C4 plants have a higher photosynthetic rate under drought stress. Specifically, there are more chloroplasts in parenchma cells of vascular bundle sheath of C4 plants than C3 plants, and the CO2 saturation point is lower in C4 plants than in C3 plants [32]. In the Golmud sampling site, the relative cover of C4 plants (C.k.) in the community was 40%, which was much higher than other species, so the CWMA was much higher in the Golmud site than in the Nomuhong and Da Qaidam sites.
Through RDA and SEM, we found that hydrothermal conditions determined soil nutrient conditions and salinity, explaining a total of 53.44% of the variance in plant traits with STN, STP, STK, STOC, and SS. This finding is consistent with the work of Bell et al. [33], who found in their study of North American deserts that with the increase in drought degree, the soil organic carbon, soil microbial biomass, and soil enzyme activity all decreased significantly. This phenomenon may have resulted from microbial enzymes and plant litter quantity. The increase in water in desert ecosystems can stimulate the production of microbial enzymes; accelerate the circulation of soil carbon (C), nitrogen (N), and phosphorus (P); and increase nutrient supply, with water affecting soil nutrient content by affecting plant litter quantity. Moreover, hydrothermal conditions determine the movement of water and salt in arid areas by affecting the evaporation ratio [34]. A high-saline environment can inhibit the absorption of mineral elements such as K+, Ca2+, and Mg2+ by plants, resulting in a decrease in water potential within the plant [35]. Plants close their stomata to reduce transpiration and at the same time prevent CO2 from entering the leaves under low water potential, which affects the participation of CO2 in carboxylation and reduces the net photosynthetic rate of the plant [36]. It is worthy to note that temperature was also an important factor impacting photosynthetic production traits and water use traits directly in this study. Many previous studies have shown that temperature affects the energy balance of leaves and the metabolic rate of plants, often showing a strong correlation with plant traits [37,38].

4.2. The Influence of Environmental Factors on the Relationship between Photosynthetic Production Traits and Water Use Traits of Plants

The plants need to maximize the absorption of CO2 for photosynthesis but they must also manage water loss as little as possible. The two physiological processes share the same stomatal pathway [39], that is to say, there is a collaborative mechanism between A, and E and GSW. Therefore, there is a tradeoff mechanism between photosynthesis and water use of desert shrubs in Qaidam (Table 3). In this study, water conditions were important factors affecting the relationship between leaf water use traits (GSW, E) and photosynthetic production traits (A) (Figure 6B,F). The results of the study are consistent with previous findings in that a number of physiological processes in plants, including photosynthesis, were influenced by the plant water use system. Plants regulate photosynthesis and water use systems in response to water in the environment in order to reduce the risk of fatal plant dehydration [40].
It was also found that the synergistic relationship between photosynthetic production traits and leaf water use traits decreased with the decrease in aridity index, except the driest Golmud (C4 community). This finding is not in line with previous research. Existing research results mostly believe that GSW and A have assumed a linear relationship structure, that is, the synergistic relationship between GSW and A remains unchanged [41,42]. However, Lombardozzi et al. [43] and Lamour et al. [44] also proposed the nonlinear hypothesis of GSW and A and verified it in different regions. In addition, although the drought degree is the most serious in Golmud, the tradeoff intensity between photosynthesis and water use of the community was lower than that in Nuomuhong. This phenomenon may have been caused by differences between species: C.k. (C4) is the main species in the plant community in Golmud; C4 plants are more resilient to drought stress in terms of stomatal conductance and hydraulic performance than C3 plants, thus maintaining their photosynthetic advantage [45,46].
There was a complex interaction and feedback mechanism between stomatal conductance (GSW) and transpiration rate (E). The low water potential caused by the increase in transpiration rate brings about a further increase in the closing trend of stomata, which would lead to a decrease in transpiration rate to avoid a further decrease in plant water potential. In this study, it was found that SS could explain the change of synergistic relationship between E and GSW better than other environmental factors (Figure 6M). This result is the same as that of Ismail et al. [47] and Chen et al. [48]. They believe that salt stress caused by SS is a key factor affecting plant physiological growth in arid ecosystems. Higher SS leads to hyperosmosis, closure of plant stomata, lower transpiration rate of plants, and weakening of the water absorption capacity. In this study, the synergistic relationship between leaf E and GSW showed a “V” pattern along the soil salinity gradient, which could be attributed to the fact that the decrease in transpiration rate of plants with increasing salt stress is not only due to stomatal constriction, but also due to various physiological response mechanisms of plants. It has been shown that with salt stress increase, osmoregulatory substances such as soluble sugars, proline, and soluble proteins in plants tend to increase and then decrease [49,50]. The physiological response mechanisms, which play a key role in preventing water losses from leaves, can better control the water exchange between plants and the environment, regulate plant body temperature, and enhance water storage function. Therefore, the synergistic effect of E and GSW was stronger in the highest SS area of Golmud than the lower SS area of Dulan.

5. Conclusions

This study assessed and disentangled the influencing process of drought on photosynthetic production traits and water use traits in desert shrubs using plant physiological data, soil physical and chemical property data, and weather data. The results confirmed that both hydrothermal conditions and soil physicochemical properties affect A, E, and GSW in Qaidam Basin, the arid core of Central Asia. Water conditions affected plant A, E, and GSW by affecting soil nutrient factors and soil salinity; temperature affected A, E, and GSW directly, as well as affecting soil nutrients and salinity. Water content was the most important driving factor for the synergistic relationship between photosynthetic production traits and water content traits. SS was the main driver of the synergistic relationship between water use traits. This study emphasizes the process of arid environment in shaping photosynthetic production traits and water use traits of typical desert shrubs in eastern Qaidam and provides a new perspective to investigate the mechanisms behind desert vegetation dynamics under climate change.

Author Contributions

H.C. and L.Z. conceived ideas and designed field protocols. L.Z., H.C., Y.W. and B.C. collected data. L.Z., H.S. and B.C. performed chemical analyses. H.C. and L.Z. analyzed data, prepared figures, and wrote the first draft. L.Z., B.C., Y.W., H.S. and H.C. interpreted the results. All authors have read and agreed to the published version of the manuscript.

Funding

This research was jointly supported by the Key Project of the Hebei Normal University (L2021Z05) and the National Natural Sciences Foundation of China (41877448 and 40971118).

Institutional Review Board Statement

Not applicable.

Informed Consent Statement

Not applicable.

Data Availability Statement

The data presented in this study are available on request from the corresponding author.

Acknowledgments

We appreciated the valuable comments and suggestions given by Jianshuang Wu and Yang Fu on the first draft of this manuscript.

Conflicts of Interest

The authors declare that they have no known competing financial interests or personal relationships that could have influenced the work reported in this paper.

References

  1. Cayan, D.R.; Das, T.; Pierce, D.W.; Barnett, T.P.; Tyree, M.; Gershunov, A. Future dryness in the southwest US and the hydrology of the early 21st century drought. Proc. Natl. Acad. Sci. USA 2010, 107, 21271–21276. [Google Scholar] [CrossRef] [PubMed] [Green Version]
  2. Cook, B.I.; Ault, T.R.; Smerdon, J.E. Unprecedented 21st century drought risk in the American Southwest and Central Plains. Sci. Adv. 2015, 1, e1400082. [Google Scholar] [CrossRef] [PubMed] [Green Version]
  3. Huang, S.; Leng, G.; Huang, Q.; Xie, Y.; Liu, S.; Meng, E.; Li, P. The asymmetric impact of global warming on US drought types and distributions in a large ensemble of 97 hydro-climatic simulations. Sci. Rep. 2017, 7, 5891. [Google Scholar] [CrossRef] [Green Version]
  4. Huang, L.; He, B.; Chen, A.; Wang, H.; Liu, J.; Lű, A.; Chen, Z. Drought dominates the interannual variability in global terrestrial net primary production by controlling semi-arid ecosystems. Sci. Rep. 2016, 6, 24639. [Google Scholar] [CrossRef] [PubMed] [Green Version]
  5. Lu, X.; Fan, J.; Yan, Y.; Wang, X. Responses of Soil CO2 Fluxes to Short-Term Experimental Warming in Alpine Steppe Ecosystem, Northern Tibet. PLoS ONE 2013, 8, e59054. [Google Scholar] [CrossRef]
  6. Lin, X.; Zhang, Z.; Wang, S.; Hu, Y.; Xu, G.; Luo, C.; Chang, X.; Duan, J.; Lin, Q.; Xu, B.; et al. Response of ecosystem respiration to warming and grazing during the growing seasons in the alpine meadow on the Tibetan plateau. Agric. For. Meteorol. 2011, 151, 792–802. [Google Scholar] [CrossRef]
  7. Reich, A.; Ewel, J.J.; Nadkarni, N.M.; Dawson, T.; Evans, R.D. Nitrogen isotope ratios shift with plant size in tropical bromeliads. Oecologia 2003, 137, 587–590. [Google Scholar] [CrossRef] [PubMed]
  8. Ma, J.-Y.; Chen, F.-H.; Xia, D.-S.; Sun, H.-L.; Duan, Z.-H.; Wang, G. Correlations between leaf delta13C and physiological parameters of desert plant Reaumuria soongorica. Ying Yong Sheng Tai Xue Bao J. Appl. Ecol. 2008, 19, 1166–1171. [Google Scholar]
  9. Lü, X.; Zhou, G.; Wang, Y.; Song, X. Effects of changing precipitation and warming on functional traits of zonal Stipa plants from Inner Mongolian grassland. J. Meteorol. Res. 2016, 30, 412–425. [Google Scholar] [CrossRef]
  10. Akram, M.A.; Wang, X.; Hu, W.; Xiong, J.; Zhang, Y.; Deng, Y.; Ran, J.; Deng, J. Convergent Variations in the Leaf Traits of Desert Plants. Plants 2020, 9, 990. [Google Scholar] [CrossRef] [PubMed]
  11. Akram, M.A.; Zhang, Y.; Wang, X.; Shrestha, N.; Malik, K.; Khan, I.; Ma, W.; Sun, Y.; Li, F.; Ran, J.; et al. Phylogenetic independence in the variations in leaf functional traits among different plant life forms in an arid environment. J. Plant Physiol. 2022, 272, 153671. [Google Scholar] [CrossRef] [PubMed]
  12. Wright, I.J.; Reich, P.B.; Westoby, M.; Ackerly, D.D.; Baruch, Z.; Bongers, F.; Cavender-Bares, J.; Chapin, T.; Cornelissen, J.H.C.; Diemer, M.; et al. The worldwide leaf economics spectrum. Nature 2004, 428, 821–827. [Google Scholar] [CrossRef] [PubMed]
  13. Xu, H.; Wang, H.; Prentice, I.C.; Harrison, S.P.; Wright, I.J. Coordination of plant hydraulic and photosynthetic traits: Confronting optimality theory with field measurements. New Phytol. 2021, 232, 1286–1296. [Google Scholar] [CrossRef]
  14. Rosas, T.; Mencuccini, M.; Barba, J.; Cochard, H.; Saura-Mas, S.; Martínez-Vilalta, J. Adjustments and coordination of hydraulic, leaf and stem traits along a water availability gradient. New Phytol. 2019, 223, 632–646. [Google Scholar] [CrossRef] [PubMed]
  15. Zuo, X.; Zhao, S.; Cheng, H.; Hu, Y.; Wang, S.; Yue, P.; Liu, R.; Knapp, A.K.; Smith, M.D.; Yu, Q.; et al. Functional diversity response to geographic and experimental precipitation gradients varies with plant community type. Funct. Ecol. 2021, 35, 2119–2132. [Google Scholar] [CrossRef]
  16. Blackman, C.J.; Aspinwall, M.J.; de Dios, V.R.; Smith, R.A.; Tissue, D.T. Leaf photosynthetic, economics and hydraulic traits are decoupled among genotypes of a widespread species of eucalypt grown under ambient and elevated CO2. Funct. Ecol. 2016, 30, 1491–1500. [Google Scholar] [CrossRef]
  17. Li, L.; McCormack, M.L.; Ma, C.; Kong, D.; Zhang, Q.; Chen, X.-Y.; Zeng, H.; Niinemets, U.; Guo, D. Leaf economics and hydraulic traits are decoupled in five species-rich tropical-subtropical forests. Ecol. Lett. 2015, 18, 899–906. [Google Scholar] [CrossRef]
  18. Hedrich, R.; Neimanis, S.; Savchenko, G.; Felle, H.H.; Kaiser, W.M.; Heber, U. Changes in apoplastic pH and membrane potential in leaves in relation to stomatal responses to CO2, malate, abscisic acid or interruption of water supply. Planta 2001, 213, 594–601. [Google Scholar] [CrossRef]
  19. Schnabl, H. The effect of Cl- upon the sensitivity of starch-containing and starch-deficient stomata and guard cell protoplasts towards potassium ions, fusicoccin and abscisic acid. Planta 1978, 144, 95–100. [Google Scholar] [CrossRef]
  20. Stroock, A.D.; Pagay, V.V.; Zwieniecki, M.A.; Holbrook, N.M. The physicochemical hydrodynamics of vascular plants. In Annual Review of Fluid Mechanics; Davis, S.H., Moin, P., Eds.; 2014; Volume 46, pp. 615–642. [Google Scholar] [CrossRef] [Green Version]
  21. Lampinen, M.J.; Noponen, T. Thermodynamic analysis of the interaction of the xylem water and phloem sugar solution and its significance for the cohesion theory. J. Theor. Biol. 2003, 224, 285–298. [Google Scholar] [CrossRef]
  22. Locke, A.M.; Ort, D.R. Leaf hydraulic conductance declines in coordination with photosynthesis, transpiration and leaf water status as soybean leaves age regardless of soil moisture. J. Exp. Bot. 2014, 65, 6617–6627. [Google Scholar] [CrossRef] [PubMed] [Green Version]
  23. Locke, A.M.; Ort, D.R. Diurnal depression in leaf hydraulic conductance at ambient and elevated [CO2] reveals anisohydric water management in field-grown soybean and possible involvement of aquaporins. Environ. Exp. Bot. 2015, 116, 39–46. [Google Scholar] [CrossRef]
  24. Yin, Q.; He, J.; Tian, T.; Quan, J.; Zhao, P.; Chai, Y.; Wang, L.; Yue, M. Hydraulic and Photosynthetic Traits Vary with Successional Status of Woody Plants on the Loess Plateau. Forests 2019, 10, 327. [Google Scholar] [CrossRef] [Green Version]
  25. Niu, W.; Chen, H.; Wu, J. Soil Moisture and Soluble Salt Content Dominate Changes in Foliar δ13C and δ15N of Desert Communities in the Qaidam Basin, Qinghai-Tibetan Plateau. Front. Plant Sci. 2021, 12, 675817. [Google Scholar] [CrossRef]
  26. Yao, S.; Akram, M.; Hu, W.; Sun, Y.; Sun, Y.; Deng, Y.; Ran, J.; Deng, J. Effects of Water and Energy on Plant Diversity along the Aridity Gradient across Dryland in China. Plants 2021, 10, 636. [Google Scholar] [CrossRef] [PubMed]
  27. Jolliffe, I.T.; Cadima, J. Principal component analysis: A review and recent developments. Philos. Trans. R. Soc. A Math. Phys. Eng. Sci. 2016, 374, 20150202. [Google Scholar] [CrossRef] [Green Version]
  28. Legendre, P.; Gallagher, E.D. Ecologically meaningful transformations for ordination of species data. Oecologia 2001, 129, 271–280. [Google Scholar] [CrossRef]
  29. Rosseel, Y. Lavaan: AnRPackage for Structural Equation Modeling. J. Stat. Softw. 2012, 48, 1–36. [Google Scholar] [CrossRef] [Green Version]
  30. Watt, M.S.; Buddenbaum, H.; Leonardo, E.M.C.; Estarija, H.J.; Bown, H.E.; Gomez-Gallego, M.; Hartley, R.J.; Pearse, G.D.; Massam, P.; Wright, L.; et al. Monitoring biochemical limitations to photosynthesis in N and P-limited radiata pine using plant functional traits quantified from hyperspectral imagery. Remote Sens. Environ. 2020, 248, 112003. [Google Scholar] [CrossRef]
  31. Schreiber, J.B.; Nora, A.; Stage, F.K.; Barlow, E.A.; King, J. Reporting Structural Equation Modeling and Confirmatory Factor Analysis Results: A Review. J. Educ. Res. 2006, 99, 323–338. [Google Scholar] [CrossRef]
  32. Sage, R.F. The evolution of C4 photosynthesis. New Phytol. 2003, 161, 341–370. [Google Scholar] [CrossRef] [PubMed]
  33. Bell, C.W.; Acosta-Martinez, V.; McIntyre, N.E.; Cox, S.; Tissue, D.T.; Zak, J.C. Linking Microbial Community Structure and Function to Seasonal Differences in Soil Moisture and Temperature in a Chihuahuan Desert Grassland. Microb. Ecol. 2009, 58, 827–842. [Google Scholar] [CrossRef] [PubMed]
  34. Marion, G.; Verburg, P.; McDonald, E.; Arnone, J. Modeling salt movement through a Mojave Desert soil. J. Arid Environ. 2008, 72, 1012–1033. [Google Scholar] [CrossRef]
  35. Kopittke, P.M. Interactions between Ca, Mg, Na and K: Alleviation of toxicity in saline solutions. Plant Soil 2011, 352, 353–362. [Google Scholar] [CrossRef]
  36. Paradiso, R.; de Micco, V.; Buonomo, R.; Aronne, G.; Barbieri, G.; de Pascale, S. Soilless cultivation of soybean for Bioregenerative Life-Support Systems: A literature review and the experience of the MELiSSA Project—Food characterisation Phase I. Plant Biol. 2013, 16, 69–78. [Google Scholar] [CrossRef]
  37. Moles, A.T.; Perkins, S.E.; Laffan, S.W.; Flores-Moreno, H.; Awasthy, M.; Tindall, M.L.; Sack, L.; Pitman, A.; Kattge, J.; Aarssen, L.W.; et al. Which is a better predictor of plant traits: Temperature or precipitation? J. Veg. Sci. 2014, 25, 1167–1180. [Google Scholar] [CrossRef]
  38. Wright, I.J.; Dong, N.; Maire, V.; Prentice, I.C.; Westoby, M.; Díaz, S.; Gallagher, R.V.; Jacobs, B.F.; Kooyman, R.; Law, E.A.; et al. Global climatic drivers of leaf size. Science 2017, 357, 917–921. [Google Scholar] [CrossRef] [Green Version]
  39. Sperry, J.S.; Venturas, M.; Anderegg, W.R.L.; Mencuccini, M.; Mackay, D.; Wang, Y.; Love, D.M. Predicting stomatal responses to the environment from the optimization of photosynthetic gain and hydraulic cost. Plant Cell Environ. 2016, 40, 816–830. [Google Scholar] [CrossRef]
  40. Chaves, M.M.; Pereira, J.S.; Marôco, J.; Rodrigues, M.L.; Ricardo, C.P.P.; Osório, M.L.; Carvalho, I.; Faria, T.; Pinheiro, C. How plants cope with water stress in the field? Photosynthesis and growth. Ann. Bot. 2002, 89, 907–916. [Google Scholar] [CrossRef] [Green Version]
  41. Buckley, T.N.; Mott, K.A. Modelling stomatal conductance in response to environmental factors. Plant Cell Environ. 2013, 36, 1691–1699. [Google Scholar] [CrossRef]
  42. Damour, G.; Simonneau, T.; Cochard, H.; Urban, L. An overview of models of stomatal conductance at the leaf level. Plant Cell Environ. 2010, 33, 1419–1438. [Google Scholar] [CrossRef] [PubMed]
  43. Lombardozzi, D.L.; Zeppel, M.J.B.; Fisher, R.A.; Tawfik, A. Representing nighttime and minimum conductance in CLM4.5: Global hydrology and carbon sensitivity analysis using observational constraints. Geosci. Model Dev. 2017, 10, 321–331. [Google Scholar] [CrossRef] [Green Version]
  44. Lamour, J.; Davidson, K.J.; Ely, K.S.; Le Moguédec, G.; Leakey, A.D.B.; Li, Q.; Serbin, S.P.; Rogers, A. An improved representation of the relationship between photosynthesis and stomatal conductance leads to more stable estimation of conductance parameters and improves the goodness-of-fit across diverse data sets. Glob. Chang. Biol. 2022, 28, 3537–3556. [Google Scholar] [CrossRef] [PubMed]
  45. Taylor, S.H.; Ripley, B.S.; Martin, T.; De-Wet, L.A.; Woodward, F.I.; Osborne, C.P. Physiological advantages of C4 grasses in the field: A comparative experiment demonstrating the importance of drought. Glob. Chang. Biol. 2014, 20, 1992–2003. [Google Scholar] [CrossRef] [PubMed] [Green Version]
  46. Taylor, S.; Ripley, B.; Woodward, F.I.; Osborne, C.P. Drought limitation of photosynthesis differs between C3 and C4 grass species in a comparative experiment. Plant Cell Environ. 2010, 34, 65–75. [Google Scholar] [CrossRef] [PubMed]
  47. Ismail, A.; Takeda, S.; Nick, P. Life and death under salt stress: Same players, different timing? J. Exp. Bot. 2014, 65, 2963–2979. [Google Scholar] [CrossRef]
  48. Chen, W.; Cui, P.; Sun, H.; Guo, W.; Yang, C.; Jin, H.; Fang, B.; Shi, D. Comparative effects of salt and alkali stresses on organic acid accumulation and ionic balance of seabuckthorn (Hippophae rhamnoides L.). Ind. Crop. Prod. 2009, 30, 351–358. [Google Scholar] [CrossRef]
  49. Ben Ahmed, C.; Ben Rouina, B.; Sensoy, S.; Boukhriss, M.; Ben Abdullah, F. Exogenous Proline Effects on Photosynthetic Performance and Antioxidant Defense System of Young Olive Tree. J. Agric. Food Chem. 2010, 58, 4216–4222. [Google Scholar] [CrossRef]
  50. Subramanian, D. Role of Exogenous Proline in Ameliorating Salt Stress at Early Stage in Two Rice Cultivars. J. Stress Physiol. Biochem. 2011, 7, 157–174. [Google Scholar]
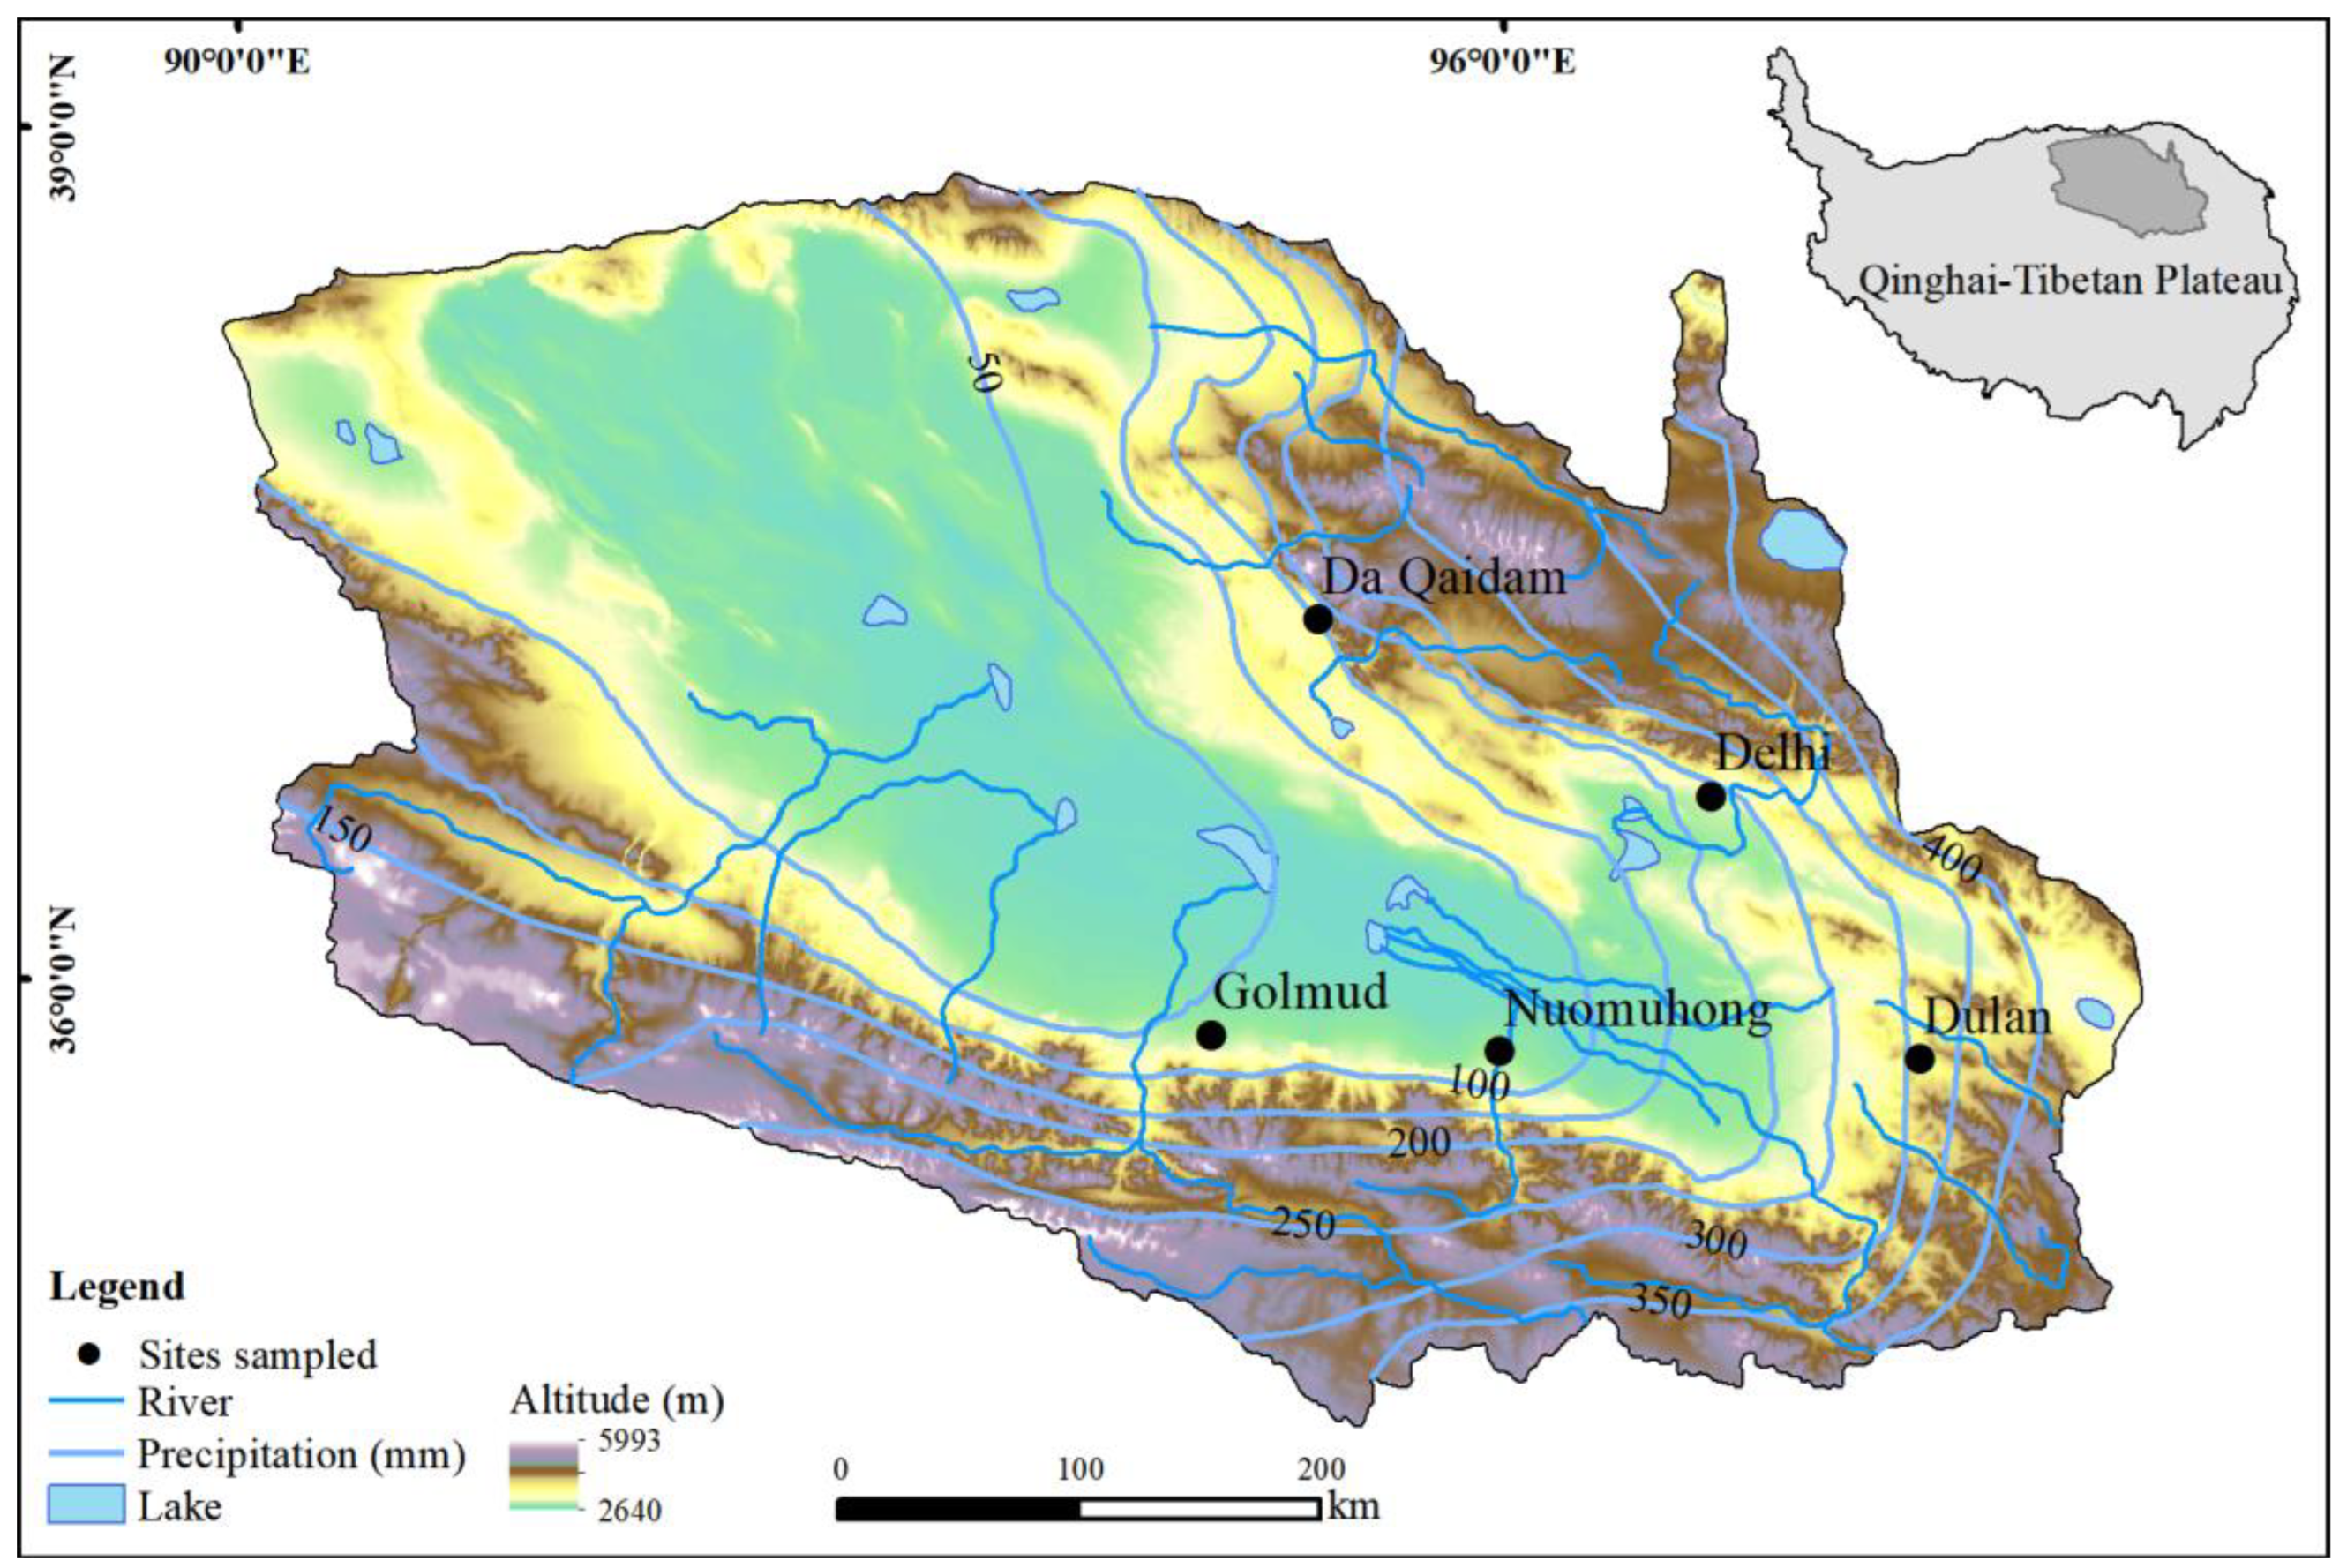
Figure 1. Field sampling sites in the eastern part of Qaidam Basin; the embedded mini-map shows the location of Qaidam Basin on the Qinghai–Tibetan Plateau.
Forests 13 01652 g001
Figure 2. Variation in the community-weighted mean of leaf functional traits (CWM) along the precipitation gradient at different sites.
Forests 13 01652 g002
Figure 3. Leaf net photosynthetic rate (A, (A)), transpiration rate (E, (B)), and stomatal conductance (GSW, (C)) among different species in the same community: the same lowercase letter indicates no significant difference among different species in the same community; different lowercase letters indicate significant differences among different species in the same community. The significance was at the p < 0.05 level. Species abbreviations were the same as Table 1.
Forests 13 01652 g003
Figure 4. RDA analysis of leaf functional traits and environmental factors.
Forests 13 01652 g004
Figure 5. Effects of environmental factors on leaf functional traits: GFI (goodness of fit index: 0.970) > 0.600: indicates that the model has a good fit. Notes are the same as in Table 1 and Table 2 and Figure 3. The green lines represent the effects among plant leaf functional traits, the red lines represent the effects among environmental factors, the blue lines represent the effects of environmental factors on plant leaf functional traits, and the dotted lines represent no significant effect. The differences significant at the 0.001, 0.01, and 0.05 levels are indicated with ***, **, and *, respectively.
Forests 13 01652 g005
Figure 6. Effect of environmental factors on the relationship among photosynthetic production traits and water use traits of plants.
Forests 13 01652 g006
Table 1. Locations, the most dominant species and their relative coverage, altitude, climate conditions, and soil properties of sampling sites.
SitesCommunity Types Dominant SpeciesLong Lat AltGSTGSP AISWCSSSTOCSTNSTPSTK
(Total Cover: %)(Relative Cover: %)(°E) (°N)(m)(°C)(mm) (%)(EC25 ms/cm)(g/kg)(g/kg)(g/kg)(g/kg)
Golmud C.k. (10%)C.k. (40%); S.r. (30%); C.l. (18%); E.s. (12%)95.0936.35288015.08 48.49 28.98 0.112.79 2.52 0.35 0.30 9.27
NuomuhongE.s. (20%)E.s. (58%); C.k. (25%); C.l. (8%); T.c. (7%); N.t. (2%) 96.4136.38285714.92 59.50 23.29 0.361.87 3.38 0.18 0.40 12.75
Da Qaidam S.r. (25%)S.r. (35%); S.a. (25%); C.l. (20%); R.s. (20%)95.4037.86331510.64 86.12 13.76 5.180.54 6.74 0.57 0.39 20.96
Delhi S.r. (30%)S.r. (50%); K.g. (40%); S.a. (5%);
R.s. (5%)
97.2837.35297214.55 163.53 8.17 4.290.11 15.25 0.56 0.36 19.19
Dulan K.g. (60%)K.g. (90%); S.a. (10%)98.3336.47332310.94 212.44 4.92 19.210.1610.25 0.18 0.41 21.30
C.k.: Calligonum korlaense Z. M. Mao (C4); S.r.: Sympegma regelii Bunge; C.l.: Ceratoides latens (J. F. Gmel.) Reveal & N. H. Holmgren; E.s.: Ephedra sinica Stapf; T.c.: Tamarix chinensis Lour.; N.t.: Nitraria tangutorum Bobrov; S.a.: Salsola abrotanoides Bunge; R.s.: Reaumuria songarica (Pall.) Maxim.; K.g.: Kalidium gracile Fenzl. Climatic factors include growing season temperature (GST), growing season precipitation (GSP), and the habitat aridity index (AI). The habitat aridity index is defined as the ratio of PET/MAP. Soil variables include soil water content (SWC), soil soluble salts (SS), soil total organic carbon (STOC), soil total nitrogen (STN), soil total phosphorus (STP), and soil total potassium (STK) at the 0–30 cm layer.
Table 2. The contribution of each indicator in principal component analysis of water content (WC) and soil nutrient (SN).
Comprehensive Index Contribution Rate (%)Cumulative Contribution Rate (%)IndexRotated Component MatrixWeight (%)
Principal Component 1Principal Component 2
Water content (WC)Principal component 156.32856.328SWC0.4400.89735.27
Principal component 241.20697.533GTP0.824−0.52634.19
Principal component 32.467100AI−0.904−0.39533.24
Soil nutrient (SN)Principal component 166.74366.743TN0.992−0.07423.90
Principal component 232.73299.475TK0.8740.48228.49
Principal component 30.50499.979TP0.1300.99020.59
Principal component 40.021100TOC0.9510.30227.02
Table 3. Variation in the relationship among plant functional traits with the drought gradient.
SitesE/AGSW/AE/GSWGSP
(mm)
SWC
(%)
AI
Golmud0.851 **0.806 **0.962 ** 48.49 0.1128.98
Nuomuhong0.606 *0.861 **0.724 ** 59.50 0.3623.29
Da Qaidam0.597 *0.859 **0.868 ** 86.12 5.1813.76
Delhi0.5670.747 **0.933 ** 163.53 4.298.17
Dulan0.0260.0830.977 ** 212.44 19.214.92
** At the 0.01 level (two-tailed), the correlation was significant; * at the 0.05 level (two-tailed), the correlation was significant. E/A: correlation coefficient between transpiration rate and net photosynthetic rate; GSW/A: correlation coefficient between stomatal conductance and net photosynthetic efficiency; E/GSW: correlation coefficient between transpiration efficiency and stomatal conductance.
Publisher’s Note: MDPI stays neutral with regard to jurisdictional claims in published maps and institutional affiliations.