Article

Predicting the Potential Distribution of Endangered Parrotia subaequalis in China

Key Laboratory of Biodiversity and Biotechnology, School of Life Sciences, Nanjing Normal University, Nanjing 210023, China
*
Author to whom correspondence should be addressed.
Forests 2022, 13(10), 1595; https://doi.org/10.3390/f13101595
Submission received: 22 July 2022 / Revised: 23 September 2022 / Accepted: 26 September 2022 / Published: 29 September 2022
(This article belongs to the Section Forest Ecology and Management)

Abstract

:
Climate change poses a serious threat to species, especially for endangered species. This is particularly true for the endangered tree Parrotia subaequalis, endemic to China. To date, little is known about its pattern of habitat distribution, and how it will respond under future climate change still remains unclear. Based on six climate variables and 115 occurrence records, we used the MaxEnt model to predict the potential distribution of P. subaequalis in China. The modeling results showed that the first three leading factors influencing its distribution were precipitation in the driest quarter (Bio17), the mean temperature of driest quarter (Bio9), and annual average temperature (Bio1). The actual distribution area of this endangered tree was smaller than the projected suitable range (2.325 × 10⁴ km2), which was mainly concentrated in west and southeast Anhui, southwest Jiangsu, and northwest Zhejiang, eastern China. Our study also indicated that P. subaequalis populations in the three regions (Central-China Mountain Area (CC), Dabie Mountain Area (DB), and Tianmu Mountain Area (TM)) responded differently to future climate change. The DB population changed insignificantly in a suitable habitat, while the TM population increased slightly in area, migrating northeast on the whole. The habitats of the DB and TM populations became more fragmented under all future climate scenarios than those under the current condition. Due to geographical isolation and limited spread, it is plausible for P. subaequalis to grow in CC under current and future conditions. Accordingly, our findings highlighted that the two local populations of P. subaequalis presented different responses to climate change under global warming. Therefore, our study can improve the conservation and management of P. subaequalis in China and be helpful for other endangered tree species with local populations that respond differently to climate change.

1. Introduction

Parrotia subaequalis (H. T. Chang) R.M. Hao and H.T. Wei, endemic to China, is a small deciduous tree in the family Hamamelidaceae. As a tertiary relict plant, P. subaequalis is a valuable material for research in familial phylogeny and floral evolution [1]. It is also a fine timber tree due to its straight trunk and hard texture. Moreover, this tree is of great value in horticulture because of a series of distinctive features, such as leaves turning red in autumn (Figure 1a,b), flowers without petals (Figure 1c), and exfoliating bark (Figure 1f) [2,3,4]. Due to overexploitation, the natural populations of P. subaequalis have been under threat in the past few decades, thus resulting in its population decreasing and range shrinking. As a result, it has been listed in the List of National Key Protected Wild Plants [5] and categorized as “Critically Endangered (CR)” in the IUCN Red List [5,6].
P. subaequalis has a relatively narrow distribution in eastern China, where it sporadically occurs in subtropical mountains of Anhui, Jiangsu, and Zhejiang provinces [4,7]. This can be ascribed to three primary reasons. First, this tree has a weak photosynthetic capacity relative to other dominant species in the forest stand, and accordingly it usually grows slowly. Regarding P. subaequalis, its saplings have a flexible light-adaptation strategy, while its mid-sized trees may be shaded by upper branches in the stand, thus retarding their growth [8]. Furthermore, this species often faces intense interspecific competition from its associated tree species since there is a short distance between them [9]. Thirdly, anthropogenic activities, such as road construction, land reclamation, and tourism development, may have an adverse effect on its distribution. For example, some advanced individuals were stolen for making bonsai on the boundary between eastern Anhui and southern Jiangsu [2,10]. Although the current distribution of P. subaequalis seems to be limited and narrow, the identification of the new localities of P. subaequalis in Shangcheng County of Henan Province, Siming Mountain of Zhejiang Province, and Liyang City of Jiangsu Province, within eastern China [5,10,11] indicates that the actual spatial distribution of the species may be wider than its known distribution. Therefore, the actual spatial distribution of the species remains unclear to date.
Climate is one of the most important factors influencing plant distribution at the regional scale [12,13]. Accordingly, climate change plays a significant role in growth performance, geographical range, and population size for a tree species [14,15]. In general, endemic tree species in a forest are more susceptible to climate shift than widespread species because the former have a narrower habitat and a smaller population than the latter. It seems likely that endemic trees have a poor adaptive capacity to deal with climate change, especially endangered and endemic trees [16,17]. For example, Zelkova schneideriana, an endangered tree in subtropical China, was decreasing in abundance and range under the threat of climate change [18]. Because the geographical distribution of P. subaequalis is still unclear at present, it is also necessary to identify the key climatic variables limiting its distribution, as well as its projected current distribution.
Species distribution models (SDMs) are applied extensively to explain the effects of climate change on species distribution. They can also predict the current distribution patterns of species and how they will respond in the face of future climate change [19,20]. Among them, the MaxEnt (maximum entropy) model is one of the most widely used SDMs due to its high prediction accuracy, technically simple operation, and good performance at low sample sizes [21,22,23]. Recently, it has been successfully applied to predict the geographical distribution of endangered plants, and to determine the dominant environmental factors affecting their distribution under changing climate scenarios [24]. Moreover, MaxEnt also has advantages in terms of predicting the suitable range in distribution and exploring the potential habitat in cultivation for rare and endangered species [25].
Here, we collected the occurrence data of P. subaequalis and environmental factors and then predicted its potential distribution in China by using the MaxEnt model. The objective of this study is to (1) forecast the suitable distribution of P. subaequalis in China under the current climate scenario; (2) identify the key bioclimatic variables affecting its spatial distribution; (3) determine the responses of P. subaequalis under three different climate scenarios (RCP2.6, RCP4.5, RCP8.5) in the future (2050s and 2070s); and (4) discuss the conservation and management strategies of P. subaequalis under climate change.

2. Methods

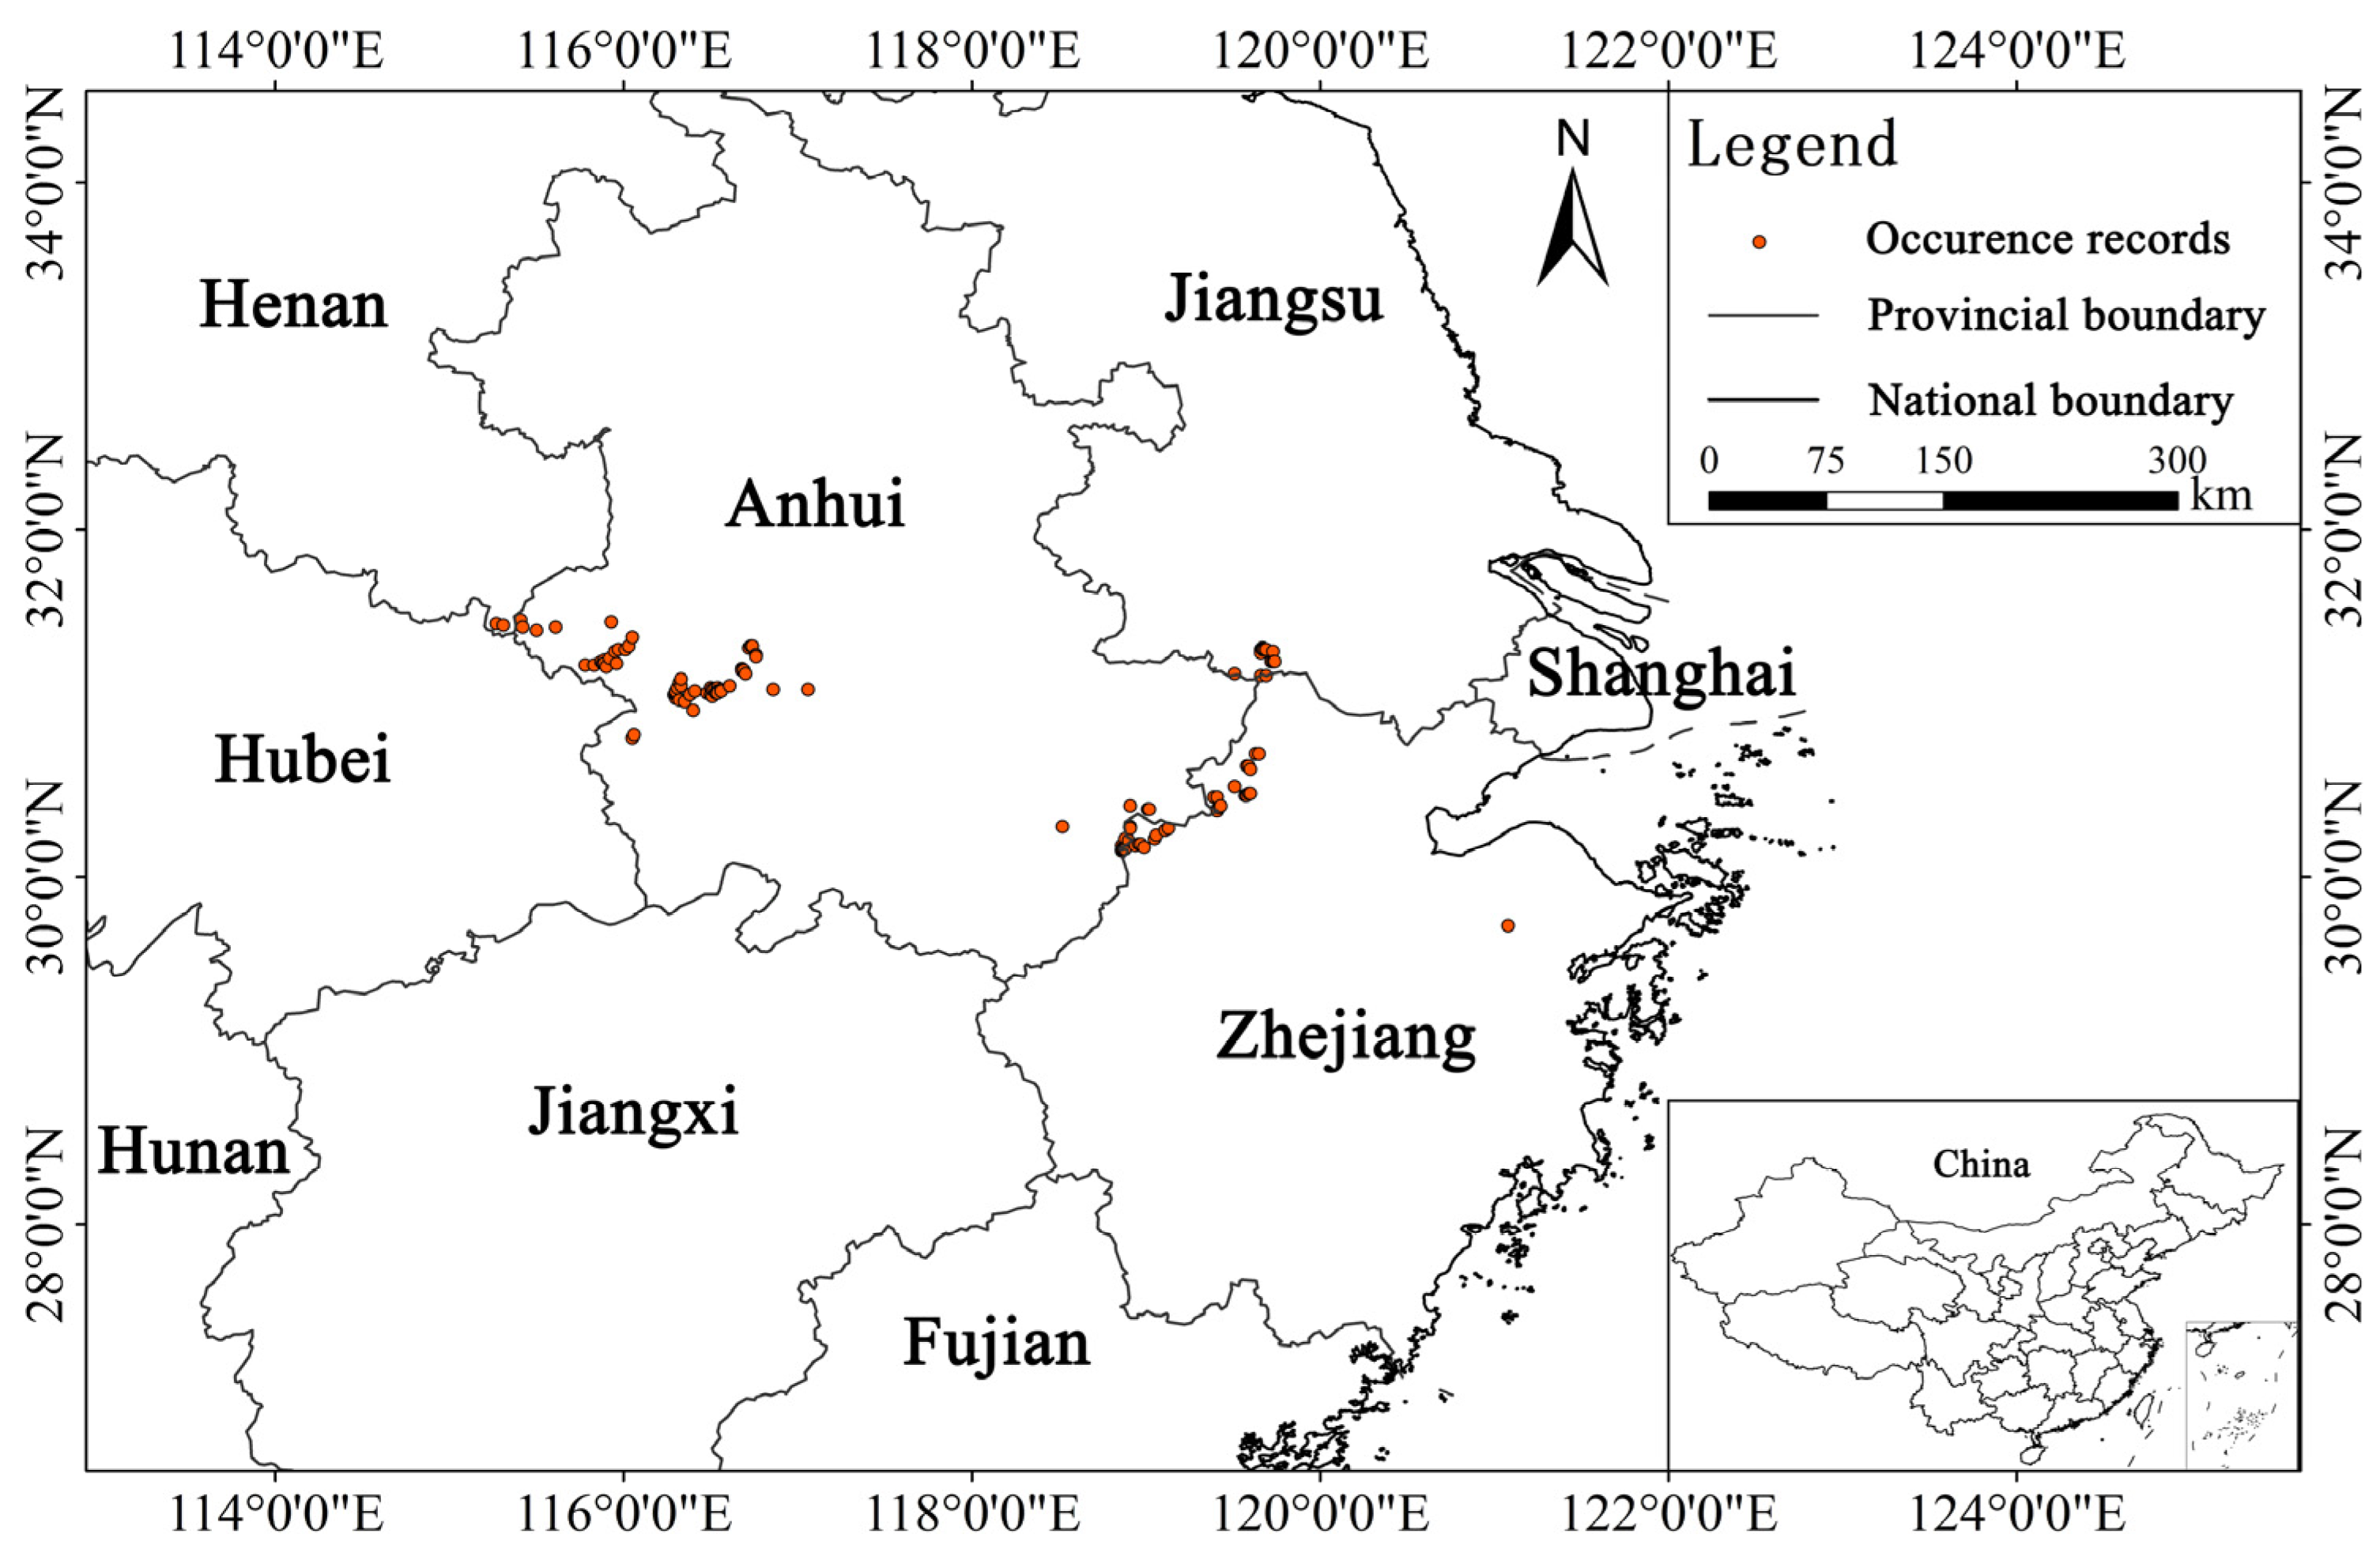
2.1. Species Occurrence Data

In the past few years, we conducted extensive field surveys for P. subaequalis wild populations in Anhui, Jiangsu, Zhejiang, and other provinces of eastern China to obtain their distributional localities [2,9,26] (Figure 1). Meanwhile, we also collected other occurrence data from the published literature and related websites. Firstly, the distribution information was searched by using the key words of specific name, the Latin name and synonym in Flora of China, provincial floras, and associated checklists [27,28]. Then, the newly discovered distribution sites were gathered from available articles, monographs, and reports [9,10,29,30]. Furthermore, original specimen records containing latitude and longitude or detailed small place names were collected by searching Chinese Virtual Herbarium (CVH, http://www.cvh.ac.cn, last accessed on 8 March 2022), National Specimen Information Infrastructure (NSII, http://www.nsii.org.cn, last accessed on 8 March 2022), and Global Biodiversity Information Facility (GBIF, https://www.gbif.org/, last accessed on 8 March 2022). Accordingly, we initially complied a total of 211 occurrence points for this species.
After deleting incorrect or duplicate record points, we used the spatially rarefy occurrence data for the SDMs tool (i.e., SDMtoolbox 2.0) to retain only one distribution point in each 1 km × 1 km grid [31]. This method of rarefying record points is based on the resolution of bioclimatic data to reduce the spatially auto-correlated occurrence points [32,33]. In total, 115 occurrence data of P. subaequalis were used for MaxEnt modeling, which were mainly distributed in Jixi, Jinzhai, Shucheng, Yuexi, and Jingde in Anhui Province; Yixing and Liyang in Jiangsu Province; Anji and Fenghua in Zhejiang Province; and Shangcheng in Henan Province (Figure 2, Supplementary Material).

2.2. Bioclimatic Variables

Bioclimatic variables can be used to model habitat suitability, which is of great help in determining suitable bioclimatic regions for species [34]. Data for the 19 bioclimatic variables used in this study were downloaded from the WorldClim environmental database (version 1.4) (http://www.worldclim.org, last accessed on 16 May 2022) with a spatial resolution of 30 s (approximately 1 km) (Table 1). The current climate data are the average of the 1960–1990 climate data. Due to the limitation of using a single climate model to predict future climate [35,36], the future climate data of the 2050s (2041–2060) and 2070s (2061–2080) are derived from the average values of the three global climate models (the Beijing Climate Center Climate System Model version 1.1, BCC-CSM1-1; the Community Climate System Model version 4, CCSM4; and an earth system model based on the Model for Interdisciplinary Research on Climate, MIROC-ESM) of WorldClim.
The representative concentration pathways (RCPs), consisting of a series of different concentrations of greenhouse gas, are widely used in studies related to climate change responses [37]. In each period, three typical CO2 representative concentration pathways (RCP) were selected, namely, RCP 2.6 (minimum CO2 emission scenario), RCP 4.5 (medium CO2 emission scenario), and RCP 8.5 (maximum CO2 emission scenario).
Problems such as multicollinearity among bioclimatic variables may lead to model overfitting, thus affecting the accuracy of the prediction results [38]. In order to avoid introducing redundant information in the process of model prediction, the preliminary simulation of bioclimatic data was performed in the MaxEnt model, and variables that contributed the most to the model gain were selected [39]. Then, the Spatial Analyst Tools in ArcGIS 10.6 were used to extract the values of 19 bioclimatic variables at 115 distribution points. The Pearson correlation coefficient (r) between bioclimatic variables was tested by R 4.1.3 to eliminate the variables with the lower percent contribution among those |r| > 0.8 [40,41]. Finally, six bioclimatic variables were selected to build the final model (Table 1).

2.3. MaxEnt Modeling

The occurrence data and selected climate variables were imported into the ENMeval package in R software (version 4.1.3) to optimize the MaxEnt model [42]. The range of the regularization multiplier (RM) values was set to 0.5–4, with each interval of 0.5, and thereby there were a total of eight RMs. Generally, MaxEnt provides five feature classes (FC): linear features (L), quadratic features (Q), product features (P), threshold features (T), and hinge features (H). In this optimization, six feature classes (L, H, LQ, LQH, LQHP, and LQHPT) were selected to optimize the MaxEnt model. The minimum information criterion AICc value (delta. AICc) was used to test the model fitting degree [43].
In total, 75% of the distribution points were randomly selected as the training set and the remaining 25% as the test set in MaxEnt software (version 3.4.4). To ensure the predictive accuracy of models, the operation was repeated 15 times using the Bootstrap method. The combination of the area under curve (AUC value) of receiver operating characteristic and the true skill statistic (TSS value) was used to assess the model performance [15,44]. The AUC value ranges from 0 to 1. A higher value of AUC indicates better model performance. AUC values can be divided into failing (0.5–0.6), poor (0.6–0.7), fair (0.7–0.8), good (0.8–0.9), and excellent (0.9–1) [45,46]. The TSS value ranges from −1 to +1. The TSS score close to 1 indicates an almost perfect model, while the score close to zero or less indicates a model no better than random [44]. The average AUC and TSS across the 15 replicates of each algorithm were used to evaluate the model performance [47].

2.4. Geospatial Analysis

ArcMap 10.6 was used to visualize the operation results of the MaxEnt model. When mapping the predicted distribution of P. subaequalis, the model’s results were classified based on “maximizing test sensitivity plus specificity threshold”, given the nature of the studied species. This threshold was considered as best practice for presence-only models [48,49]. Thus, the habitat suitability was divided into four levels: unsuitable area (0–0.1), low suitable area (0.1–0.4), moderately suitable area (0.4–0.7), and highly suitable area (0.7–1.0) [50,51]. The suitable areas of each level were calculated separately to determine the influence of climate change on the distribution of P. subaequalis.

3. Results

3.1. Model Performance

The habitat suitability of P. subaequalis under current and future climate scenarios was simulated based on 115 occurrence records and six bioclimatic variables. When FC was LQHP and RM was 0.5, delta. AICc = 0, indicating that the model was optimal under such a combination. The mean AUC values including the training and test data of the MaxEnt model for 15 repetitions were all greater than 0.9 (Table 2), which was significantly higher than the AUC value of random prediction (0.5). Therefore, the MaxEnt model was considered to work at an excellent level. The mean TSS values of 15 repetitions in each scenario were also greater than 0.9, very close to 1 (Table 2). Similarly, this also indicated that model prediction had high credibility and accuracy. Moreover, the current predicted distribution of the model is consistent with the known occurrence records of P. subaequalis. Therefore, the MaxEnt model is reliable for predicting the potential habitat suitability of P. subaequalis in China.

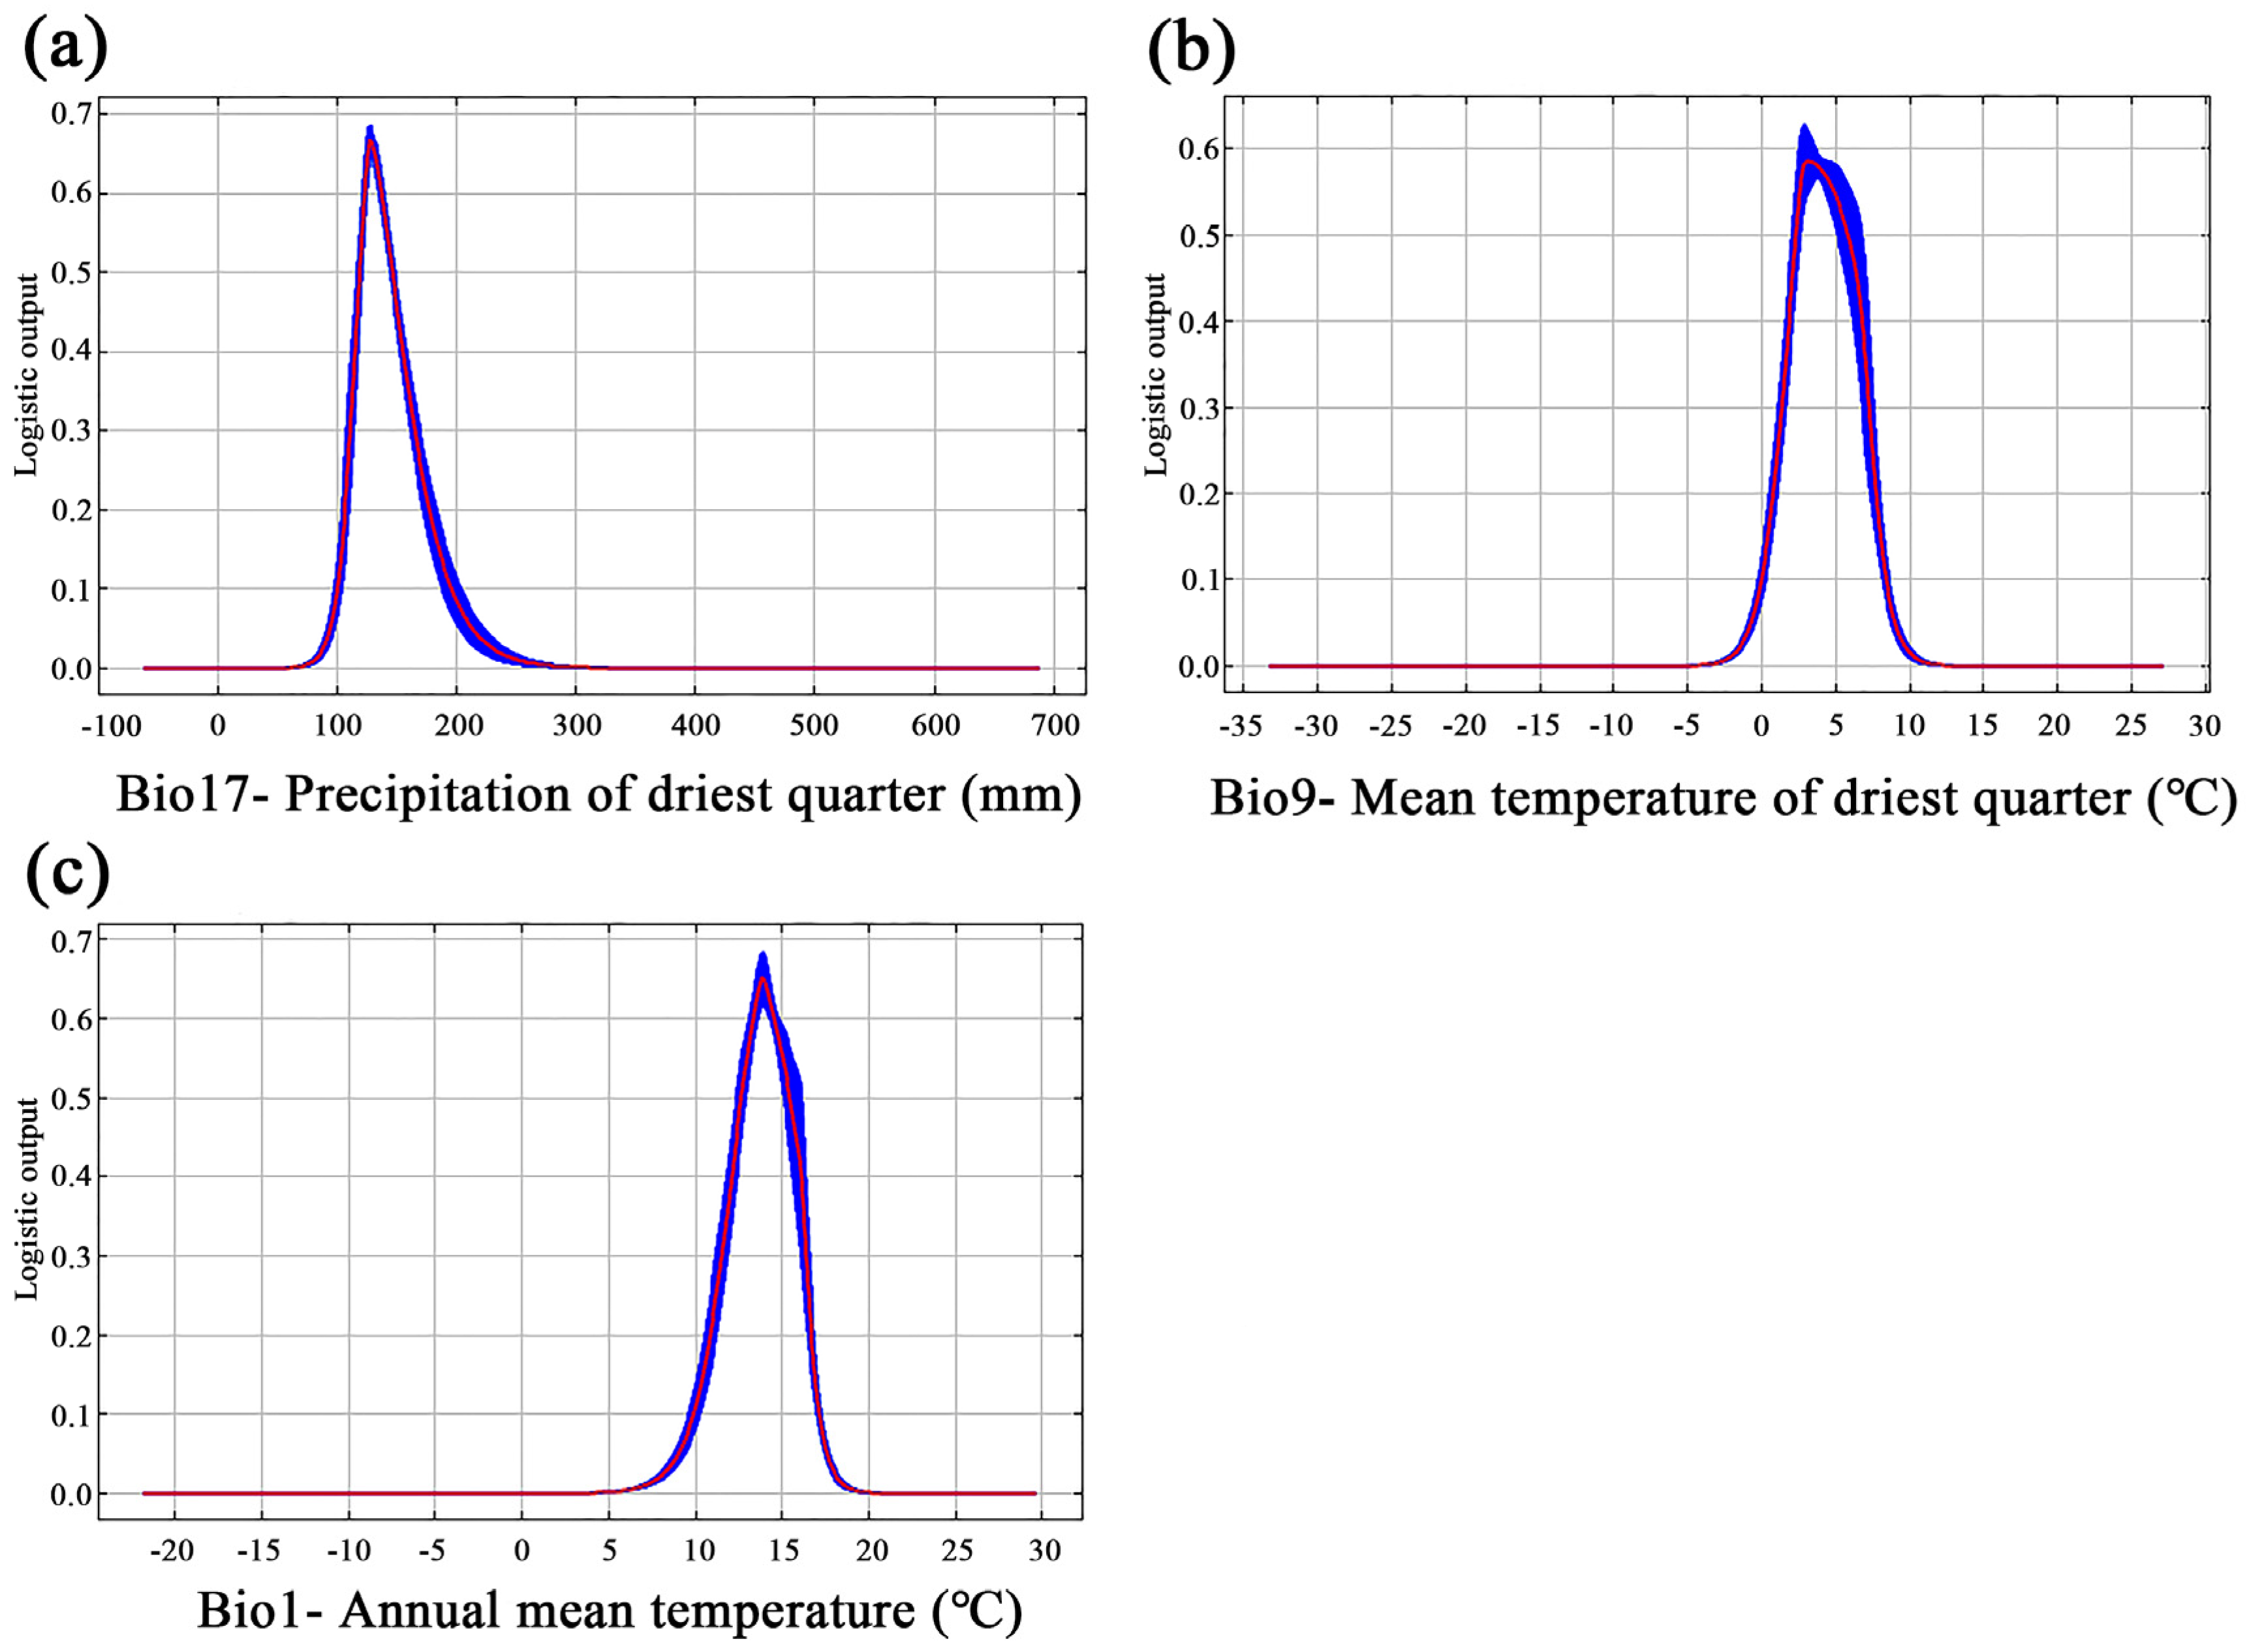
3.2. Key Bioclimatic Variables

The MaxEnt model calculated the percent contribution of each bioclimatic variable through the iterative algorithm and normalization processing (Table 1). The results showed that among the six bioclimatic variables, the first leading variable was precipitation in the driest quarter (Bio17), contributing 64.3% to the potential distribution of P. subaequalis, followed by mean temperature of driest quarter (Bio9) and annual average temperature (Bio1), with percent contributions of 19.1% and 13.1%, respectively. The sum of the percent contribution of the three variables was more than 90%, so they were identified as the key bioclimatic variables affecting the habitat suitability of P. subaequalis.
The response curve, representing the relationship between bioclimatic variables and the probability of species presence, reflects the biological tolerance and habitat preference of species [16]. When the species existence probability is greater than 0.5, corresponding to moderately and highly suitable area [15], this indicates that the range of bioclimatic variables is suitable for the growth of P. subaequalis. As shown in Figure 3a concerning the response curves of climate variables, when the precipitation of the driest quarter (Bio17) exceeded 117.6 mm, P. subaequalis was in a suitable survival condition (existence probability > 0.5). With the increase in Bio17, the existence probability gradually increased and reached a peak (0.67) at 128.9 mm (Figure 3). The probability of existence then decreased in the range of 128.9–146.4 mm. The mean temperature of the driest quarter (Bio9) ranged from 2.3 °C to 5.8 °C, which was suitable for its growth, and the survival probability first increased and then decreased in this case, reaching the maximum at 3.1 °C (0.59) (Figure 3b). Similarly, when annual mean temperature (Bio1) was above 12.6 °C, the survival probability exceeded 0.5. With the increase in Bio1, the probability of P. subaequalis’s establishment increased to a maximum as high as 0.65 at 13.8 °C (Figure 3c).
Therefore, P. subaequalis preferred habitats as follows: the precipitation of the driest quarter (Bio17) between 117.6 mm and 146.4 mm, the mean temperature of the driest quarter (Bio9) between 2.3 °C and 5.8 °C, and the annual mean temperature (Bio1) between 12.6 °C and 15.4 °C (Figure 3).

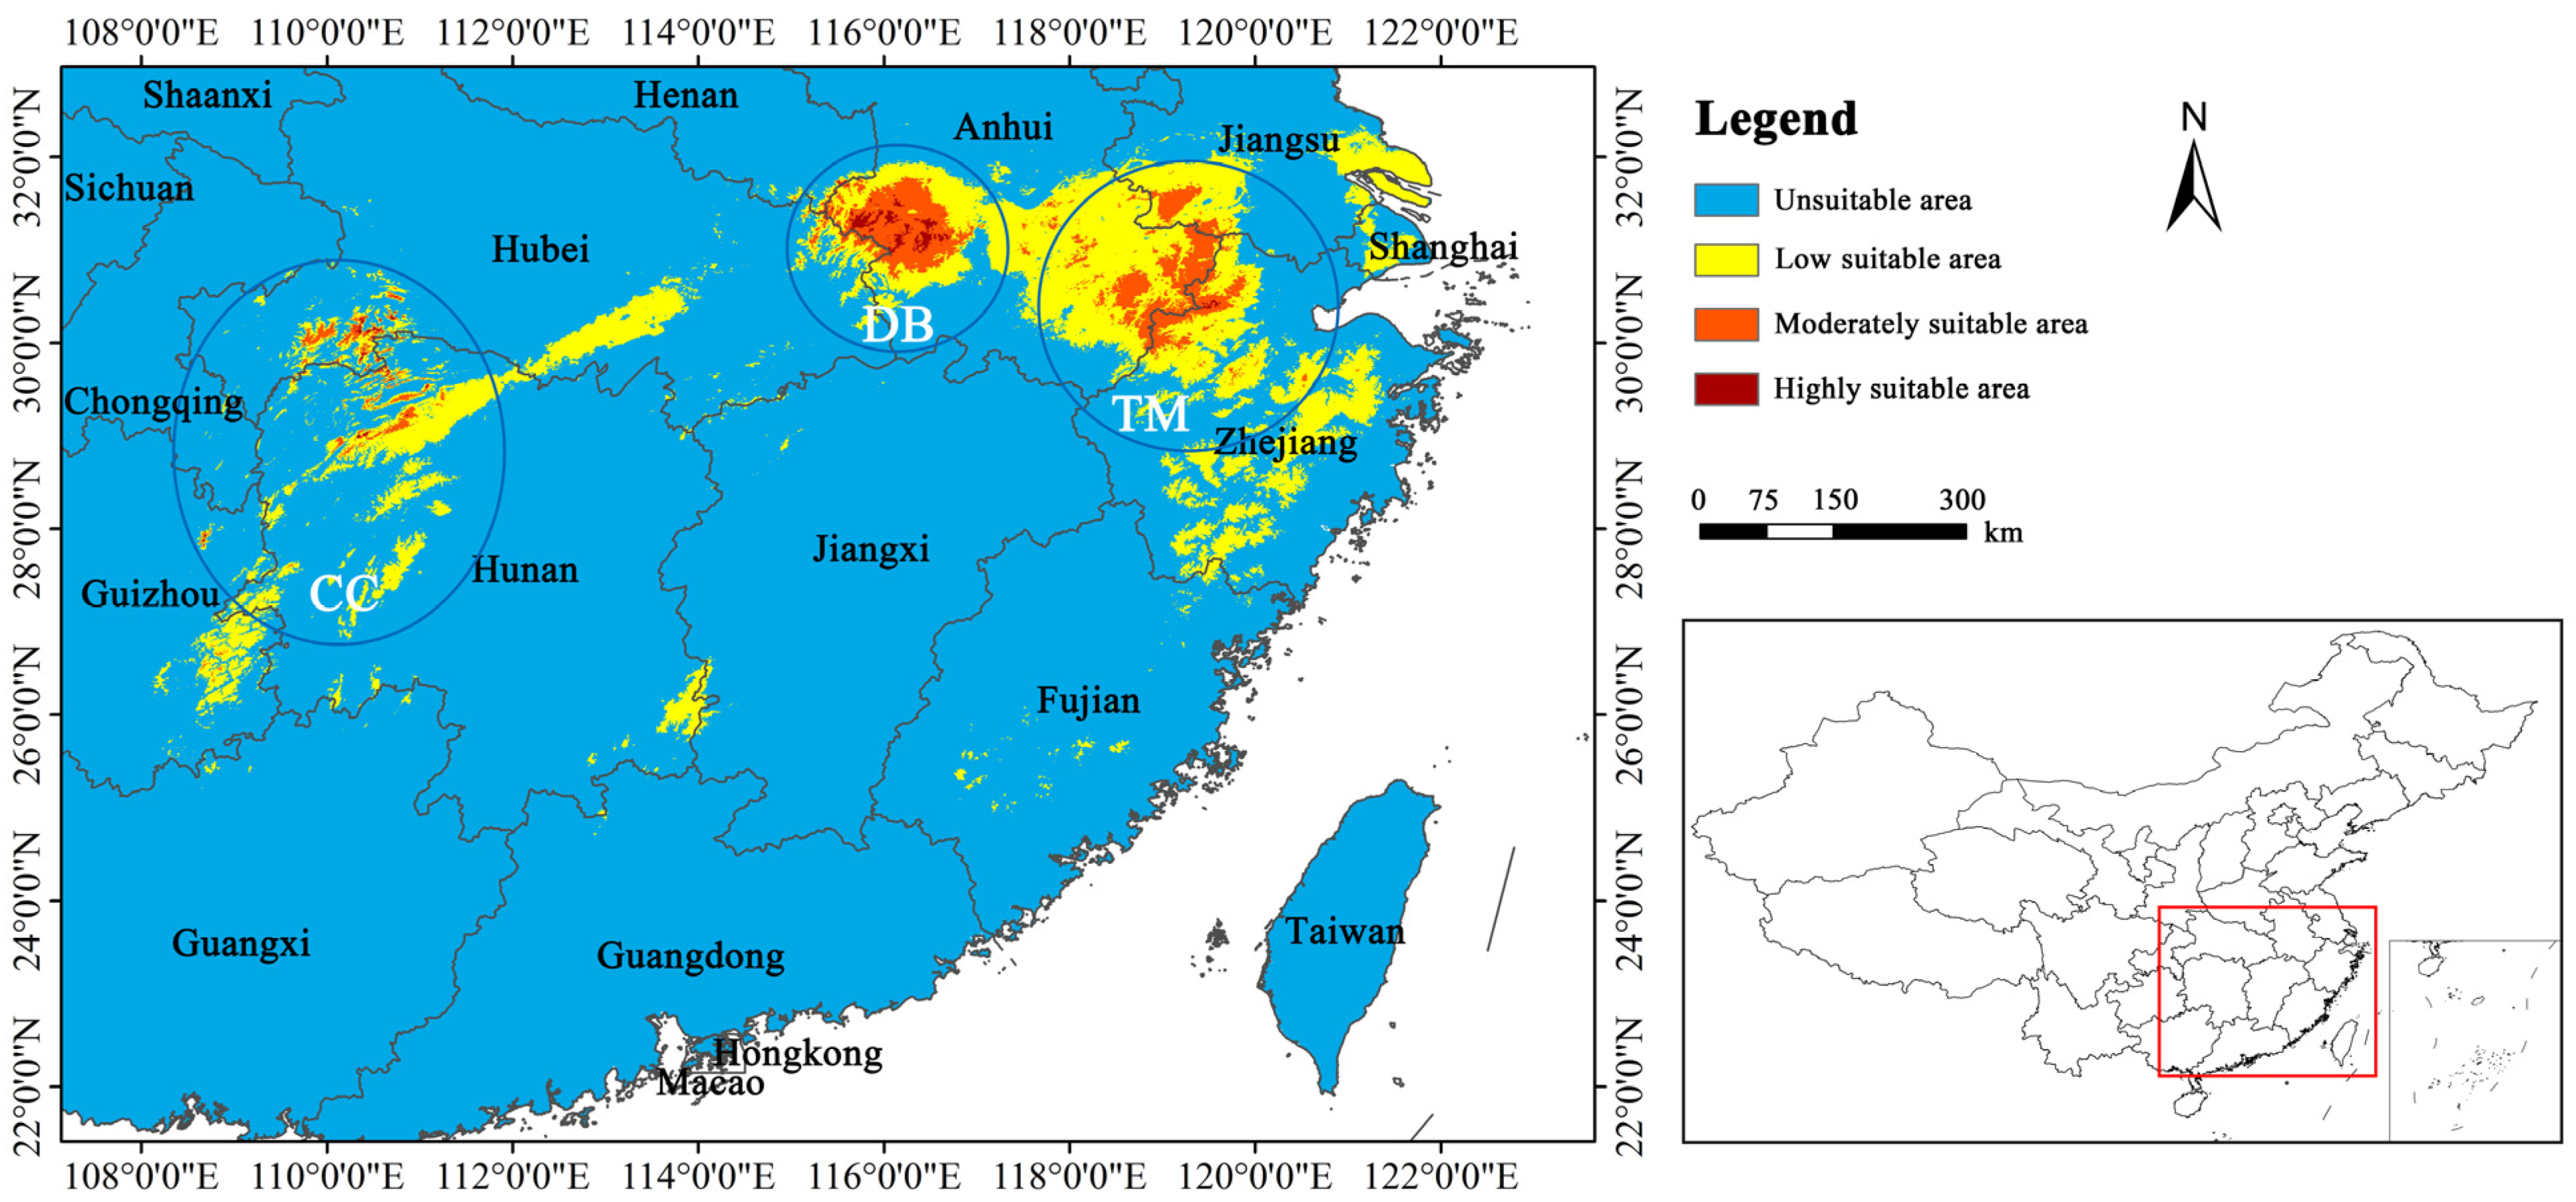
3.3. Current Distribution of Habitat Suitability

Currently, the predicted suitable habitat (i.e., the moderately and highly suitable habitat) of P. subaequalis was mostly located in eastern China, mainly concentrated in west and southeast Anhui, southwest Jiangsu, and northwest Zhejiang. In addition, fragmented distributions were also forecasted in south Henan, east Hubei, provincial boundary between southwest Hubei and northwest Hunan, northeast Guizhou, and other areas. The suitable habitat covered a total area of 2.325 × 10⁴ km2, only accounting for 2.42‰ of China’s total territory; the highly suitable habitat areas only accounted for 1.93‰, mainly concentrated in west Anhui (Table 3; Figure 4).
Additionally, under the current climate scenario the suitable habitat of P. subaequalis was roughly divided into three different regions: the Central-China Mountain Area (CC), the Dabie Mountain Area (DB), and the Tianmu Mountain Area (TM) (Figure 4).

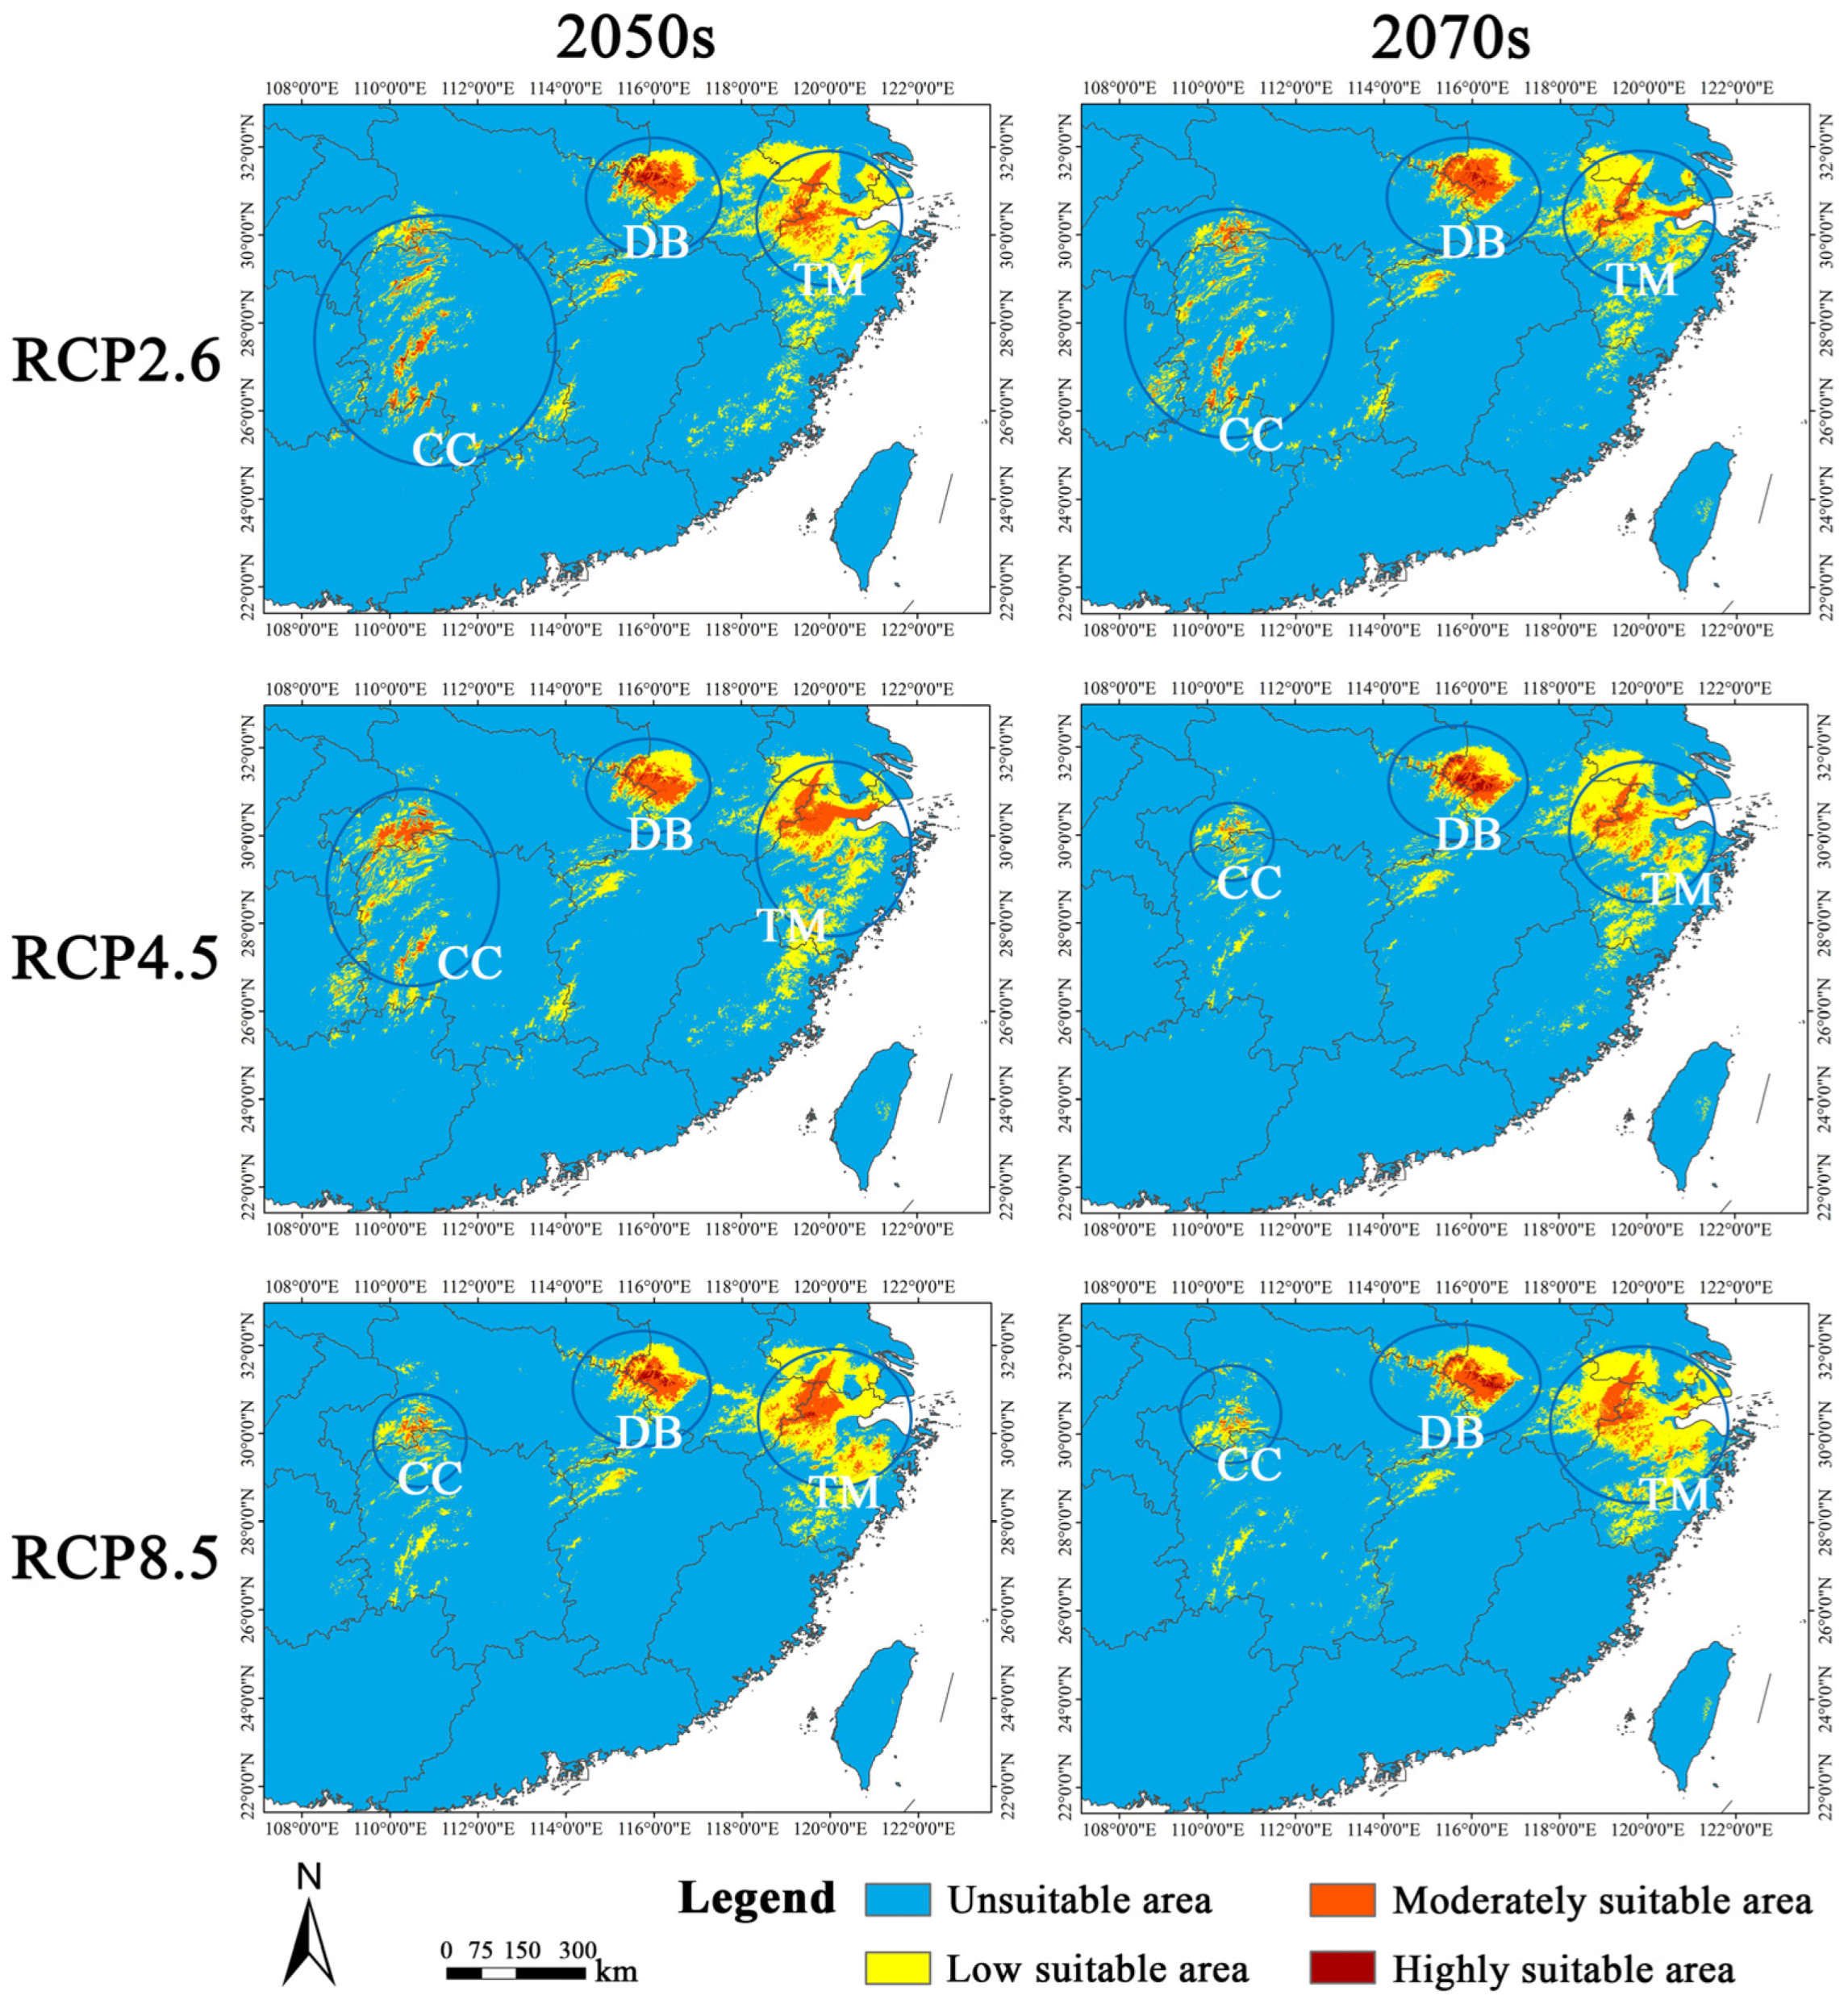
3.4. Future Changes in Habitat Suitability

Overall, the future suitable habitats of P. subaequalis also included three regions: CC, DB, and TM (Figure 5). Firstly, compared with the current scenario, the suitable habitat of P. subaequalis populations in TM would increase slightly under the six future scenarios, mainly migrating northeastward. However, the degree of its habitat fragmentation increased under future climate change relative to currently (Figure 4 and Figure 5). In contrast, although its suitable habitat in DB changed insignificantly, the habitat fragmentation also increased. In addition, its suitable habitat in CC presented a slight decrease, and mainly migrated to the north, but the degree of habitat fragmentation also increased.
The mean suitable habitat area covered 2.516 × 10⁴ km2 under six climate scenarios in the 2050s and 2070s, with an increase of 8.23% compared with the current condition, among which the proportion of highly suitable area was very small. Compared with the current scenario, the highly suitable area reduced by an average of 6.59% under the six future scenarios.
In the future, the suitable habitat of P. subaequalis in different periods (2050s and 2070s) would respond distinctively to climate change. The mean suitable habitats under three scenarios (RCP 2.6, RCP 4.5, and RCP 8.5) in the 2050s increased by 18.47% relative to the current scenario, while the mean suitable habitats in the 2070s decreased by 2.00%. This is consistent with the change trend of the suitable habitat of three Fritillaria species [52], which first rises and then declines, in suitable habitats. Our results indicated that P. subaequalis may be differently adapted to the range of concentration pathways.
Likewise, the suitable habitat of P. subaequalis would also respond differently under different emission scenarios during the same period. In the 2050s, the suitable habitat in all three scenarios increased to varying degrees compared to the current. The maximum increase occurred in RCP 4.5, accounting for 36.71%. In the 2070s, P. subaequalis showed a different trend in the habitat area under the three scenarios. Its suitable habitat increased under low concentration (RCP 2.6), while it decreased under both medium and high concentration (RCP 4.5 and RCP 8.5).

4. Discussion

4.1. Modeling Evaluation and Variable Influence

At present, there are a variety of SDMs used for predicting species potential distribution [53]. Being one of the correlative models, the MaxEnt model based on species distribution and environmental factors has been widely used in recent years and is considered as one of the most reliable bioclimatic models [21]. This model has multiple advantages, such as its ability to work with small sample sizes, its ease of use, and its claimed superior performance. Simultaneously, it also has some disadvantages. Because this model fits with limited presence-only data, these data should be random or representative in the entire landscape. Otherwise, the sampling data may be processed with bias. However, in some cases, researchers may be unclear about the degree of the sampling bias [20]. Collinearity is likely to exist among multiple environmental variables, thus leading to the uncertainty of modeling prediction. Furthermore, for a certain species, the MaxEnt model usually needs to optimize the algorithms in order to reduce the fitting bias.
In this study, P. subaequalis, endemic to China, is an ancient tree species. As a tertiary relict plant, it has a quite conservative correlation with its environment. More recently, a new study finds that the interaction between the species of Parrotia and their herbivores persisted over at least 15 million years, expanding from eastern Asia to western Europe [54]. Therefore, we screened the collected records and eliminated the collinearity among bioclimatic variables. Meanwhile, the ENMeval package was used to optimize the regularization multiplier (RM) and feature classes (FC) in MaxEnt, reducing the model overfitting and complexity while maintaining its predictive power. The AUC and TSS values of the ensemble model were both close to 1 (Table 2), indicating that the model performed well. Therefore, the model explains the potential distribution of P. subaequalis based on current occurrence records.
Our study showed that the key bioclimatic variables affecting the distribution of the P. subaequalis population were the precipitation of the driest quarter (Bio17), the mean temperature of the driest quarter (Bio9), and the annual mean temperature (Bio1), respectively. This indicated that precipitation-related variables may play a more significant role in limiting the potential distribution of P. subaequalis than temperature-related variables (Table 1). Moreover, the precipitation of the driest quarter (Bio17) made the most substantial contribution of 64.3%. According to species-response curves, this species preferred habitats with a mean precipitation of the driest quarter from 117.6 to 146.4 mm. This was confirmed by the results of the water requirement and the growth characteristics of P. subaequalis seedlings in the greenhouse experiment [55]. In their experiments, Yue et al. (2006) [55] showed that when the soil relative water content was 60.0%, P. subaequalis had the highest photosynthetic rate and the highest light saturation point. Namely, relatively moist soil is more conducive to the growth of P. subaequalis. This is in line with our field investigation that P. subaequalis usually grows well in well-drained hillsides or nearby valleys (Figure 1f). In addition, P. subaequalis is less drought-resistant than other dominant tree species in the forest stand [56], which may affect its competitiveness in harsh environments. This is also consistent with the finding that there is strong interspecific competition between P. subaequalis and its associated trees [9,26].

4.2. Predicted Habitat Suitability for P. subaequalis under Current Scenario

The MaxEnt model produces distribution predictions based on the presence-only data of species, and thereby its logistic output should not be merely illustrated as occurrence probability [20]. However, recently some studies have probably ignored the problem when predicting the potential distribution of rare and endangered plants. For example, Horsfieldia tetratepala, an evergreen tree endemic to China, is projected by MaxEnt to expand to Hainan, Taiwan, Guangdong, and other provinces in southern China under future climate conditions [57], although the endemic tree now only occurs in the southern boundary of Yunnan and Guangxi, mainland China. In fact, dispersal limitation, interspecies interaction, and anthropogenic influences may affect the potential distribution of endangered species. However, different species are affected by these factors to varying degrees. In this study, we analyzed the suitable habitats of P. subaequalis under different climate scenarios based on the prediction results and their biological characteristics.
Our MaxEnt model predicted, for the first time, 2.325 × 10⁴ km2 of suitable habitat area, which is larger than the known distribution area. This is mainly due to the short history of its discovery [58] and apetalous flowers (Figure 1c), thus making it difficult to identify in the field. Our model also shows that Dabie Mountain Area (DB), the Tianmu Mountain Area (TM), and the Central-China Mountain Area (CC) are predicted to be the suitable habitats (i.e., the moderately and highly suitable habitats) of P. subaequalis under the current climate scenario. However, the Central-China Mountain Area (CC) is unlikely to be a suitable habitat of P. subaequalis according our field survey (Figure 1) and its tree traits. Firstly, there is a long distance of more than 650 km between the Central-China Mountain Area (CC) and the Dabie Mountain Area (DB)/Tianmu Mountain Area (TM), in which occurred all known natural populations of this species at present [59]. Secondly, as a small deciduous tree, its fruits are woody capsules that have two chambers, each with two fusiform seeds (Figure 1d). Furthermore, the mean weight of each ten seeds of P. subaequalis is approximately 0.305 g [2], which makes it unsuitable for such a long distance wind dispersal. Although it is unclear concerning its seed dispersal mechanism, we think that it is impossible for this tree to spread and reach the Central-China Mountain Area (CC) by seeds based on our field observations. Thirdly, the suitable habitat in the Central-China Mountain Area (CC) is extremely fragmented, which has a negative impact on the growth and reproduction of P. subaequalis. In addition, this species has not yet been reported by the botanical surveys from Hubei, Hunan, and Guizhou in recent decades [60,61,62].
The prediction results inform us that the current suitable habitat of P. subaequalis is distributed in both the Dabie Mountain Area (DB) and the Tianmu Mountain Area (TM), which is congruent with the known distribution records [27]. Furthermore, we estimate that there may be wild populations in south Henan and east Hubei (Figure 4). P. subaequalis is mainly concentrated in the mountainous areas of east China. The Dabie Mountain Area (DB) stretches about 380 km from east to west and 175 km from north to south; accordingly, it covers a large mountainous range, including Hubei, Henan, and Anhui provinces [63]. Wanfoshan in Anhui Province has the largest natural population of P. subaequalis at present [26]. The forecasted suitable habitats in south Henan and east Hubei are close to the P. subaequalis population in Dabie Mountain Area (DB), and this enables the species to spread viable seeds there. Secondly, the two sites have highly and moderately suitable areas, which may be conducive to its survival and growth. More recently, a new locality of P. subaequalis has been recorded in Mt. Huangbo, Henan Province [64]. Hence, this supports our estimation that there may well be new populations of P. subaequalis in these two sites.

4.3. Geographical Shift in Habitat Suitability under Future Climate

Our study indicated that P. subaequalis populations in the three regions differently responded to future climate change. Firstly, under the future climate scenarios, the Tianmu Mountain Area (TM) population of P. subaequalis increased in a suitable habitat, largely migrating northeast. Meanwhile, the projected suitable habitat became more fragmented relative to that under the current condition. This may be associated with low habitat heterogeneity in this region. This area is located in the subtropical mountains of eastern China, mainly consisting of low hills and plains, with an average elevation of less than 500 m [65]. In addition, there is a long history of agriculture, with developed social economy and intense human activities over the last few decades [10,66,67]. Climate change, human activities, and habitat features may limit the future distribution of the P. subaequalis population in the Tianmu Mountain Area (TM).
In contrast, the Dabie Mountain Area (DB) population of P. subaequalis changed slightly in terms of suitable habitat but with more fragmented habitat in the future scenarios. The Dabie mountains span Hubei, Henan, and Anhui provinces, with a total area of more than 6.0 × 10⁴ km2. This region features wavy terrain, most of which is subtropical mountainous areas. There are dozens of peaks above 1000 m, among which the highest peak is the Baimajian at Anhui, with an elevation of 1777 m [68]. Compared with the Tianmu Mountain Area (TM), the Dabie Mountain Area (DB) has higher habitat heterogeneity owing to complex and diverse topography, inconvenient transportation, an under-developed economy, and little human interference. Therefore, the Dabie Mountain Area (DB) population may suffer little from global warming, and it will be able to expand suitable habitats within this region where there is great variation in altitude and microhabitat.
For the Central-China Mountain Area (CC) population, its suitable habitat decreased and migrated northward in future scenarios (Figure 5). In addition, the habitat fragmentation in the Central-China Mountain Area (CC) strikingly intensified, which is similar to that in the Tianmu Mountain Area (TM) and the Dabie Mountain Area (DB). Due to the geographical isolation and limited spread, it is plausible for P. subaequalis to grow therein in the future.
In brief, our findings indicate that the current distribution of P. subaequalis in the two regions (i.e., the Tianmu Mountain Area (TM) and the Dabie Mountain Area (DB)) exhibits different response patterns to future climate change. Specifically, for the two populations, their habitat fragmentation intensified in the future, while a significant difference was found between them in terms of suitable habitat and migration direction. This is similar to Paeonia mairei, an endemic herb in southwest China, whose two local populations respond differently to future climate change [35]. Therefore, such a practice can be adopted for other endangered tree species, whose natural populations in different regions respond distinctively to climate change.

4.4. Conservation Implications for P. subaequalis

This study delineates the projected suitable habitats of P. subaequalis and identifies the major drivers of its distribution for the first time using MaxEnt model. We set the cut-off threshold for species presence and absence through maximizing the sum of test sensitivity and specificity, and thus such an approach can ensure the reliability of suitability classification of P. subaequalis. The predicted results show that its current potential distribution is larger than the known distribution range. However, our analysis has demonstrated that the actual distribution area of P. subaequalis should be smaller than the projected suitable range, which is mainly concentrated in the regions of the Dabie Mountain Area (DB) and the Tianmu Mountain Area (TM), eastern China (Figure 5). Therefore, we should prioritize investigating its natural populations in these two areas in the future.
Secondly, the two populations presented different responses to climate change under global warming. The habitats of the P. subaequalis population in the Dabie Mountain Area (DB) and the Tianmu Mountain Area (TM) became more fragmented under all future climate scenarios than those under current conditions. However, the Dabie Mountain Area (DB) population changed slightly in a suitable habitat, while the Tianmu Mountain Area (TM) population increased slightly, migrating to the northeast as a whole. Therefore, it is proposed to enhance the in situ conservation of the Dabie Mountain Area (DB) population in the future. Indeed, P. subaequalis has been enlisted in the national checklist of Plant Species with Extremely Small Population (PSESP) of China for urgent protection since 2012 [69]. At present, the populations of P. subaequalis in the Dabie Mountain Area (DB) are mostly separated from each other and grow in the form of small populations. This tree has abundant genetic diversity but with a low inter-population gene flow according to the combined analysis of chloroplast and nuclear microsatellites [64]. Moreover, these small populations are mainly distributed in various nature reserves that are under the jurisdiction of several administrative departments in different provinces. Therefore, it is suggested to establish an integrated supervision system and strengthen the coordinating management for natural protected areas [67]. In contrast, it is suggested to enlarge the current protected area for the Tianmu Mountain Area (TM) population of P. subaequalis.
Thirdly, the suitable habitats of P. subaequalis were predicted to increase in the future climate scenario on the whole, but they became much more fragmented (Figure 5). As a result, this may have been due to an adverse effect on its growth and distribution. Our model also shows that the dominant variable affecting the distribution of P. subaequalis is the precipitation of the driest quarter (Bio17), and that the species will move to the northeast in China. So, we infer that the water demand of P. subaequalis will increase with global warming. Consequently, it is of great importance to monitor the dynamics of the P. subaequalis population over time, and its soil water content in forest communities.
In addition, the Central-China Mountain Area (CC) can also be used as an alternative site to cultivate P. subaequalis for ex situ conservation, though there is no wild population therein based on our analysis.

5. Conclusions

In this study, we applied the MaxEnt model to predict the current and future potential distribution of P. subaequalis in China. Our results indicated that the first three leading factors influencing its distribution were precipitation in the driest quarter (Bio17), the mean temperature of the driest quarter (Bio9), and the annual average temperature (Bio1), suggesting that precipitation-related variables may play a more significant role in limiting the potential distribution of P. subaequalis than temperature-related variables. Our results also indicated that its actual distribution area was smaller than the projected suitable range, which was mainly concentrated in the regions of DB and TM, eastern China. Our findings highlighted that the two populations presented different responses to climate change under global warming. Namely, the DB population changed insignificantly in a suitable habitat, while the TM population increased slightly in area, migrating to the northeast on the whole. Therefore, we propose to enhance the in situ conservation of the DB population in the future and to enlarge the current protected area of the TM population for P. subaequalis. This study contributes to the improvement of the conservation and management of P. subaequalis in China, and it is also helpful for other endangered tree species with local populations that respond differently to climate change.

Supplementary Materials

The following supporting information can be downloaded at: https://www.mdpi.com/article/10.3390/f13101595/s1, Table S1: Latitude and Longitude Coordinates of 115 Occurrence Records of the Endangered P. subaequalis in China.

Author Contributions

G.Y.: Data analysis: writing—original draft. G.Z.: Conceiving the study and leading the writing. All authors have read and agreed to the published version of the manuscript.

Funding

This work was supported by the investigation and monitoring of rare and endangered plants in Jiangsu (211100B52003).

Institutional Review Board Statement

Not applicable.

Informed Consent Statement

Not applicable.

Data Availability Statement

Not applicable.

Acknowledgments

We thank J. Liu, K.D. Li, and X. Lu for their valuable advice on an earlier draft of the manuscript. We thank the anonymous reviewers for their constructive comments on the manuscript.

Conflicts of Interest

The authors declare no conflict of interest.

References

  1. Li, J.H.; Tredici, P.D. The Chinese Parrotia: A sibling species of the Persian Parrotia. Arnoldia 2008, 66, 2–9. [Google Scholar]
  2. Li, W.; Zhang, G.F. Population structure and spatial pattern of the endemic and endangered subtropical tree Parrotia subaequalis (Hamamelidaceae). Flora 2015, 212, 10–18. [Google Scholar] [CrossRef]
  3. Wang, J.Q.; Zhang, G.F. Woody Plants in Liyang; Nanjing Normal University Press: Nanjing, China, 2019; ISBN 9787565142468. [Google Scholar]
  4. Zhang, G.F. Illustrations of the Common Plants in Tianmu Mountain; Higher Education Press: Beijing, China, 2020; ISBN 9787040543940. [Google Scholar]
  5. Zhang, G.F.; Xiong, T.S.; Sun, T.; Li, K.D.; Shao, L.Y. Diversity, distribution, and conservation of rare and endangered plant species in Jiangsu Province. Biodivers. Sci. 2022, 30, 21335. [Google Scholar] [CrossRef]
  6. Qin, H.N.; Yang, Y.; Dong, S.Y.; He, Q.; Jia, Y.; Zhao, L.N.; Yu, S.X.; Liu, H.Y.; Liu, B.; Yan, Y.H.; et al. Threatened species list of China’s higher plants. Biodivers. Sci. 2017, 25, 696–744. [Google Scholar] [CrossRef]
  7. Gong, B.; Xia, Y.J.; Zhang, G.F.; Lu, Y.; Sun, G. Population structure and spatial pattern of Parrotia subaequalis, a rare and endangered species endemic to China. J. Ecol. Rural Environ. 2012, 28, 628–646. [Google Scholar]
  8. Yan, C.; Wang, Z.S.; An, S.Q.; Chen, S.N.; Wei, N.; Lu, X.M. Differences in photosynthetic capacity among different diameter-classes of Parrotia subaequalis populations and their implications to regeneration limitation. Acta Ecol. Sin. 2008, 28, 4153–4161. [Google Scholar]
  9. Liu, J.; Zhang, G.F.; Li, X. Structural diversity and conservation implications of Parrotia subaequalis (Hamamelidaceae), a rare and endangered tree species in China. Nat. Conserv. 2021, 44, 99–115. [Google Scholar] [CrossRef]
  10. Li, L.; Zhang, G.F.; Wang, M.D.; Wang, J.Q.; Zhu, J.H. Structure, spatial pattern and regeneration of Parrotia subaequalis population in Liyang mountainous area of Jiangsu Province. J. Jiangsu For. Sci. Technol. 2018, 45, 17–28. [Google Scholar] [CrossRef]
  11. Wang, Q.R.; Fan, W. A new record genus and species of Hamamelidaceae in Henan. J. Zhejiang Agric. Sci. 2017, 58, 2205–2209. [Google Scholar] [CrossRef]
  12. Dawson, T.P.; Jackson, S.T.; House, J.I.; Prentice, I.C.; Mace, G.M. Beyond predictions: Biodiversity conservation in a changing climate. Science 2011, 332, 53–58. [Google Scholar] [CrossRef]
  13. Qin, A.; Liu, B.; Guo, Q.; Bussmann, R.W.; Ma, F.; Jian, Z.; Xu, G.; Pei, S. Maxent modeling for predicting impacts of climate change on the potential distribution of Thuja sutchuenensis Franch, an extremely endangered conifer from southwestern China. Glob. Ecol. Conserv. 2017, 10, 139–146. [Google Scholar] [CrossRef]
  14. Pounds, J.A.; Bustamante, M.R.; Coloma, L.A.; Consuegra, J.A.; Fogden, M.P.L.; Foster, P.N.; La Marca, E.; Masters, K.L.; Merino-Viteri, A.; Puschendorf, R.; et al. Widespread amphibian extinctions from epidemic disease driven by global warming. Nature 2006, 439, 161–167. [Google Scholar] [CrossRef] [PubMed]
  15. Ren, Z.C.; Zagortchev, L.; Ma, J.X.; Yan, M.; Li, J.M. Predicting the potential distribution of the parasitic Cuscuta chinensis under global warming. BMC Ecol. 2020, 20, 28. [Google Scholar] [CrossRef] [PubMed]
  16. Abolmaali, S.M.-R.; Tarkesh, M.; Bashari, H. Maxent modeling for predicting suitable habitats and identifying the effects of climate change on a threatened species, Daphne mucronata, in central Iran. Ecol. Inform. 2018, 43, 116–123. [Google Scholar] [CrossRef]
  17. Vincent, H.; Bornand, C.N.; Kempel, A.; Fischer, M. Rare species perform worse than widespread species under changed climate. Biol. Conserv. 2020, 246, 108586. [Google Scholar] [CrossRef]
  18. Sun, J.J.; Qiu, H.; Guo, J.H.; Xu, X.; Wu, D.T.; Zhong, L.; Jiang, B.; Jiao, J.J.; Yuan, W.G.; Huang, Y.J.; et al. Modeling the potential distribution of Zelkova schneideriana under different human activity intensities and climate change patterns in China. Glob. Ecol. Conserv. 2020, 21, e00840. [Google Scholar] [CrossRef]
  19. Wiens, J.A.; Stralberg, D.; Jongsomjit, D.; Howell, C.A.; Snyder, M.A. Niches, models, and climate change: Assessing the assumptions and uncertainties. Proc. Natl. Acad. Sci. USA 2009, 106, 19729–19736. [Google Scholar] [CrossRef]
  20. Yackulic, C.B.; Chandler, R.; Zipkin, E.F.; Royle, J.A.; Nichols, J.D.; Campbell Grant, E.H.; Veran, S. Presence-only modelling using MAXENT: When can we trust the inferences? Methods Ecol. Evol. 2013, 4, 236–243. [Google Scholar] [CrossRef]
  21. Merow, C.; Smith, M.J.; Silander, J.A. A practical guide to MaxEnt for modeling species’ distributions: What it does, and why inputs and settings matter. Ecography 2013, 36, 1058–1069. [Google Scholar] [CrossRef]
  22. Warren, R.; VanDerWal, J.; Price, J.; Welbergen, J.A.; Atkinson, I.; Ramirez-Villegas, J.; Osborn, T.J.; Jarvis, A.; Shoo, L.P.; Williams, S.E.; et al. Quantifying the benefit of early climate change mitigation in avoiding biodiversity loss. Nat. Clim. Change 2013, 3, 678–682. [Google Scholar] [CrossRef]
  23. Abdelaal, M.; Fois, M.; Fenu, G.; Bacchetta, G. Using MaxEnt modeling to predict the potential distribution of the endemic plant Rosa arabica Crép. in Egypt. Ecol. Inform. 2019, 50, 68–75. [Google Scholar] [CrossRef]
  24. Hills, R.; Bachman, S.; Forest, F.; Moat, J.; Wilkin, P. Incorporating evolutionary history into conservation assessments of a highly threatened group of species, South African Dioscorea (Dioscoreaceae). S. Afr. J. Bot. 2019, 123, 296–307. [Google Scholar] [CrossRef]
  25. Dhyani, A.; Kadaverugu, R.; Nautiyal, B.P.; Nautiyal, M.C. Predicting the potential distribution of a critically endangered medicinal plant Lilium polyphyllum in Indian Western Himalayan Region. Reg. Environ. Change 2021, 21, 30. [Google Scholar] [CrossRef]
  26. Zhang, G.F.; Yao, R.; Jiang, Y.Q.; Chen, F.C.; Zhang, W.Y. Intraspecific and interspecific competition intensity of Parrotia subaequalis in different habitats from Wanfoshan Nature Reserve, Anhui Province. Chin. J. Ecol. 2016, 35, 1744–1750. [Google Scholar] [CrossRef]
  27. Yin, H. Rare and Endangered Plants in China; China Forestry Publishing House: Beijing, China, 2013; p. 107. ISBN 9787503870262. [Google Scholar]
  28. Liu, Q.X. Flora of Jiangsu; Jiangsu Phoenix Science and Technology Press: Nanjing, China, 2015; Volume 2, p. 128. ISBN 9787553701073. [Google Scholar]
  29. Hu, Z.J.; Wang, W.G.; Song, N.B. Field survey on Parrotia subaequalis in Tianxia Mountain of Yuexi County and in situ conservation countermeasues. J. Jiangsu For. Sci. Technol. 2012, 39, 19–21. [Google Scholar]
  30. Zhu, B. Living conditions of and conservation strategies for Parrotia subaequalis in Huangwei Township, Yuexi County. Anhui For. Sci. Technol. 2016, 42, 51–53. [Google Scholar]
  31. Brown, J.L.; Bennett, J.R.; French, C.M. SDMtoolbox 2.0: The next generation Python-based GIS toolkit for landscape genetic, biogeographic and species distribution model analyses. PeerJ 2017, 5, e4095. [Google Scholar] [CrossRef] [PubMed]
  32. Radosavljevic, A.; Anderson, R.P. Making better MAXENT models of species distributions: Complexity, overfitting and evaluation. J. Biogeogr. 2014, 41, 629–643. [Google Scholar] [CrossRef]
  33. Narouei-Khandan, H.A.; Worner, S.P.; Viljanen, S.L.H.; van Bruggen, A.H.C.; Jones, E.E. Projecting the suitability of global and local habitats for myrtle rust (Austropuccinia psidii) using model consensus. Plant Pathol. 2020, 69, 17–27. [Google Scholar] [CrossRef]
  34. Poirazidis, K.; Bontzorlos, V.; Xofis, P.; Zakkak, S.; Xirouchakis, S.; Grigoriadou, E.; Kechagioglou, S.; Gasteratos, I.; Alivizatos, H.; Panagiotopoulou, M. Bioclimatic and environmental suitability models for capercaillie (Tetrao urogallus) conservation: Identification of optimal and marginal areas in Rodopi Mountain-Range National Park (Northern Greece). Glob. Ecol. Conserv. 2019, 17, e00526. [Google Scholar] [CrossRef]
  35. Chen, Q.; Yin, Y.; Zhao, R.; Yang, Y.; Teixeira da Silva, J.A.; Yu, X. Incorporating local adaptation into species distribution modeling of Paeonia mairei, an endemic plant to China. Front. Plant Sci. 2020, 10, 1717. [Google Scholar] [CrossRef] [PubMed]
  36. Lu, X.; Jiang, R.Y.; Zhang, G.F. Predicting the potential distribution of four endangered holoparasites and their primary hosts in China under climate change. Front. Plant Sci. 2022, 13, 942448. [Google Scholar] [CrossRef] [PubMed]
  37. Zhang, J.H.; Li, K.J.; Liu, X.F.; Yang, L.; Shen, S.K. Interspecific variance of suitable habitat changes for four alpine Rhododendron species under climate change: Implications for their reintroductions. Forests 2021, 12, 1520. [Google Scholar] [CrossRef]
  38. Sillero, N.; Barbosa, A.M. Common mistakes in ecological niche models. Int. J. Geogr. Inf. Sci. 2021, 35, 213–226. [Google Scholar] [CrossRef]
  39. Liu, L.; Guan, L.; Zhao, H.; Huang, Y.; Mou, Q.; Liu, K.; Chen, T.; Wang, X.; Zhang, Y.; Wei, B.; et al. Modeling habitat suitability of Houttuynia cordata Thunb (Ceercao) using MaxEnt under climate change in China. Ecol. Inform. 2021, 63, 101324. [Google Scholar] [CrossRef]
  40. Dormann, C.F.; Elith, J.; Bacher, S.; Buchmann, C.; Carl, G.; Carré, G.; Marquéz, J.R.G.; Gruber, B.; Lafourcade, B.; Leitão, P.J.; et al. Collinearity: A review of methods to deal with it and a simulation study evaluating their performance. Ecography 2013, 36, 27–46. [Google Scholar] [CrossRef]
  41. Kiser, A.H.; Cummings, K.S.; Tiemann, J.S.; Smith, C.H.; Johnson, N.A.; Lopez, R.R.; Randklev, C.R. Using a multi-model ensemble approach to determine biodiversity hotspots with limited occurrence data in understudied areas: An example using freshwater mussels in Mexico. Ecol. Evol. 2022, 12, e8909. [Google Scholar] [CrossRef]
  42. Muscarella, R.; Galante, P.J.; Soley-Guardia, M.; Boria, R.A.; Kass, J.M.; Uriarte, M.; Anderson, R.P.; McPherson, J. ENMeval: An R package for conducting spatially independent evaluations and estimating optimal model complexity for Maxent ecological niche models. Methods Ecol. Evol. 2014, 5, 1198–1205. [Google Scholar] [CrossRef]
  43. Phillips, S.J.; Anderson, R.P.; Dudík, M.; Schapire, R.E.; Blair, M.E. Opening the black box: An open-source release of Maxent. Ecography 2017, 40, 887–893. [Google Scholar] [CrossRef]
  44. Allouche, O.; Tsoar, A.; Kadmon, R. Assessing the accuracy of species distribution models: Prevalence, kappa and the true skill statistic (TSS). J. Appl. Ecol. 2006, 43, 1223–1232. [Google Scholar] [CrossRef]
  45. Assefa, A.; Tibebu, A.; Bihon, A.; Yimana, M. Global ecological niche modelling of current and future distribution of peste des petits ruminants virus (PPRv) with an ensemble modelling algorithm. Transbound. Emerg. Dis. 2021, 68, 3601–3610. [Google Scholar] [CrossRef] [PubMed]
  46. Singh, M.; Arunachalam, R.; Kumar, L. Modeling potential hotspots of invasive Prosopis juliflora (Swartz) DC in India. Ecol. Inform. 2021, 64, 101386. [Google Scholar] [CrossRef]
  47. Kaky, E.; Nolan, V.; Alatawi, A.; Gilbert, F. A comparison between Ensemble and MaxEnt species distribution modelling approaches for conservation: A case study with Egyptian medicinal plants. Ecol. Inform. 2020, 60, 101150. [Google Scholar] [CrossRef]
  48. Baldwin, R.A. Use of maximum entropy modeling in wildlife research. Entropy 2009, 11, 854–866. [Google Scholar] [CrossRef]
  49. Liu, C.; White, M.; Newell, G. Selecting thresholds for the prediction of species occurrence with presence-only data. J. Biogeogr. 2013, 40, 778–789. [Google Scholar] [CrossRef]
  50. Srivastava, V.; Griess, V.C.; Keena, M.A. Assessing the potential distribution of Asian gypsy moth in Canada: A comparison of two methodological approaches. Sci. Rep. 2020, 10, 22. [Google Scholar] [CrossRef]
  51. Xu, Y.; Huang, Y.; Zhao, H.; Yang, M.; Zhuang, Y.; Ye, X. Modelling the Effects of Climate Change on the Distribution of Endangered Cypripedium japonicum in China. Forests 2021, 12, 429. [Google Scholar] [CrossRef]
  52. Jiang, R.; Zou, M.; Qin, Y.; Tan, G.; Huang, S.; Quan, H.; Zhou, J.; Liao, H. Modeling of the potential geographical distribution of three Fritillaria species under climate change. Front. Plant Sci. 2022, 12, 749838. [Google Scholar] [CrossRef]
  53. Narouei-Khandan, H.A. Ensemble Models to Assess the Risk of Exotic Plant Pathogens in a Changing Climate, in Lincoln; Lincoln University: Lincoln, New Zealand, 2014. [Google Scholar]
  54. Adroit, B.; Zhuang, X.; Wappler, T.; Terral, J.-F.; Wang, B. A case of long-term herbivory: Specialized feeding trace on Parrotia (Hamamelidaceae) plant species. R. Soc. Open Sci. 2020, 7, 201449. [Google Scholar] [CrossRef]
  55. Yue, C.L.; Jin, S.H.; Chang, J.; Jiang, H. Response of photosynthesis in Shaniodendron subaequale to soil water status. Ann. Bot. Fenn. 2006, 43, 389–393. [Google Scholar]
  56. Li, H.P.; Yue, C.L.; Yu, Q.J.; Yang, Z.J.; Shao, S.L.; Yu, L.P. Advance of research on Parrotia subaequalis. J. Zhejiang For. Sci. Tech. 2012, 32, 79–84. [Google Scholar]
  57. Cai, C.; Zhang, X.; Zha, J.; Li, J.; Li, J. Predicting climate change impacts on the rare and endangered Horsfieldia tetratepala in China. Forests 2022, 13, 1051. [Google Scholar] [CrossRef]
  58. Hao, R.M.; Wei, H.T. A new combination of Hamamelidaceae. Acta Phytotaxon. Sin. 1998, 36, 80. [Google Scholar]
  59. Wu, Z.Y.; Raven, P.H.; Hong, D.Y. Flora of China; Science Press: Beijing, China, 2003; Volume 9, ISBN 1930723148. [Google Scholar]
  60. Lu, Z.J.; Bao, D.C.; Liu, H.B.; Xu, Y.Z. Hunan Badagongshan Forest Dynamics Plot: Tree Species and Their Distribution Patterns; China Forestry Publishing House: Beijing, China, 2017; ISBN 9787503887659. [Google Scholar]
  61. Deng, T.; Zhang, D.G.; Sun, H. Flora of Shennongjia; China Forestry Publishing House: Beijing, China, 2018; Volume 2, ISBN 9787503894596. [Google Scholar]
  62. Dong, H.J.; Fang, Y.P.; Xiang, J.; Zhen, A.G. Illustrated Flora of Dabie Mountain in Hubei; China Forestry Publishing House: Beijing, China, 2021; ISBN 9787521910032. [Google Scholar]
  63. Liu, J.F.; Chen, L.; Yang, Z.H.; Zhao, Y.F.; Zhang, X.W. Unraveling the spatio-temporal relationship between ecosystem services and socioeconomic development in Dabie Mountain Area over the last 10 years. Remote Sens. 2022, 14, 1059. [Google Scholar] [CrossRef]
  64. Zhang, Y.Y.; Shi, E.; Yang, Z.P.; Geng, Q.F.; Qiu, Y.X.; Wang, Z.S. Development and application of genomic resources in an endangered palaeoendemic tree, Parrotia subaequalis (Hamamelidaceae) from Eastern China. Front. Plant Sci. 2018, 9, 246. [Google Scholar] [CrossRef]
  65. Shen, X.S. Study on the pteridophytic flora of Jiangsu, Zhejiang and Anhui provinces. J. Wuhan Bot. Res. 2001, 19, 215–219. [Google Scholar]
  66. Ren, J.; Zhang, G.F.; Hu, R.K.; Sun, G.; Yu, L.P. Population structure and distribution pattern of Parrotia subaequalis from Longwangshan Nature Reserve, Zhejiang Province. Bulletin Bot. Res. 2012, 32, 554–560. [Google Scholar]
  67. Li, K.D.; Zhang, G.F. Species diversity and distribution pattern of heritage trees in the rapidly-urbanizing province of Jiangsu, China. Forests 2021, 12, 1543. [Google Scholar] [CrossRef]
  68. Cai, Q.F.; Liu, Y.; Qian, H.J.; Liu, R.S. Inverse effects of recent warming on trees growing at the low and high altitudes of the Dabie Mountains, subtropical China. Dendrochronologia 2020, 59, 125649. [Google Scholar] [CrossRef]
  69. Yang, J.; Cai, L.; Liu, D.T.; Chen, G.; Gratzfeld, J.; Sun, W.B. China’s conservation program on plant species with extremely small populations (PSESP): Progress and perspectives. Biol. Conserv. 2020, 244, 108535. [Google Scholar] [CrossRef]
Figure 1. Photos of Parrotia subaequalis in the field. (a) Green leaves in summer (red circle); (b) red leaves in autumn; (c) Blooming flowers without petals; (d) capsules, showing seeds at the bottom right; (e) seedlings in the forest floor; and (f) individuals in valley, with exfoliating bark (red arrow). The photos were taken by Guangfu Zhang.
Forests 13 01595 g001
Figure 2. Distribution of occurrence records of P. subaequalis in China.
Forests 13 01595 g002
Figure 3. Response curves of P. subaequalis to key bioclimatic variables. (a) Precipitation of driest quarter (Bio17, mm); (b) Mean temperature of driest quarter (Bio9, °C); (c) Annual mean temperature (Bio1, °C).
Forests 13 01595 g003
Figure 4. Potential suitable distribution of P. subaequalis under current climate in China. The circles in blue refer to Central-China Mountain Area (CC), Dabie Mountain Area (DB), and Tianmu Mountain Area (TM), respectively.
Forests 13 01595 g004
Figure 5. Potential suitable distribution of P. subaequalis in China under different future climatic scenarios (RCP 2.6, RCP 4.5, and RCP 8.5) in the 2050s and 2070s. The circles in blue refer to Central-China Mountain Area (CC), Dabie Mountain Area (DB), and Tianmu Mountain Area (TM), respectively.
Forests 13 01595 g005
Table 1. Description of 19 bioclimatic variables and percent contribution of six variables (in bold font) used in the final MaxEnt model.
VariableDescriptionUnitPercent Contribution (%)
Bio1Annual mean temperature°C13.1
Bio2Mean diurnal range (mean of monthly (max temp–min temp))°C0.9
Bio3Isothermality (Bio2/Bio7) (×100)%
Bio4Temperature seasonality (standard deviation × 100)-
Bio5Max temperature of warmest month°C
Bio6Min temperature of coldest month°C
Bio7Temperature annual range (Bio5–Bio6)°C
Bio8Mean temperature of wettest quarter°C
Bio9Mean temperature of driest quarter°C19.1
Bio10Mean temperature of warmest quarter°C
Bio11Mean temperature of coldest quarter°C
Bio12Annual precipitationmm
Bio13Precipitation of wettest monthmm0.5
Bio14Precipitation of driest monthmm
Bio15Precipitation seasonality (coefficient of variation)-2.1
Bio16Precipitation of wettest quartermm
Bio17Precipitation of driest quartermm64.3
Bio18Precipitation of warmest quartermm
Bio19Precipitation of coldest quartermm
Table 2. The mean value (±SD) of the area under curve (AUC) and true skill statistic (TSS) under different climate scenarios.
ScenariosAUCtrainingAUCtestTSS
Current0.994 ± 0.00020.994 ± 0.00110.971 ± 0.0115
2050sRCP 2.60.994 ± 0.00030.993 ± 0.00130.972 ± 0.0097
RCP 4.50.994 ± 0.00030.993 ± 0.00130.971 ± 0.0178
RCP 8.50.994 ± 0.00020.994 ± 0.00080.976 ± 0.0094
2070sRCP 2.60.994 ± 0.00020.994 ± 0.00080.974 ± 0.0133
RCP 4.50.995 ± 0.00010.994 ± 0.00080.976 ± 0.0114
RCP 8.50.995 ± 0.00020.994 ± 0.00120.976 ± 0.0078
Table 3. Potential suitable areas of P. subaequalis under different climate scenarios. Up arrow (↑) means increase; down arrow (↓) means decrease.
ScenariosLow
Suitable Area
Moderately
Suitable Area
Highly
Suitable Area
Suitable Area (Moderately and Highly)
Area (×104 km2)Trend (%)Area (×104 km2)Trend (%)Area (×104 km2)Trend (%)Area (×104 km2)Trend (%)
Current10.980-2.140-0.185-2.325-
2050sRCP 2.611.819↑7.642.467↑15.280.246↑32.972.713↑16.69
RCP 4.510.973↓0.073.057↑42.870.121↓34.703.178↑36.71
RCP 8.59.322↓15.102.184↑2.070.187↑1.052.371↑1.99
2070sRCP 2.69.457↓13.872.411↑12.670.116↓37.332.527↑8.70
RCP 4.58.615↓21.541.797↓16.010.218↑17.862.015↓13.32
RCP 8.59.652↓12.102.142↑0.080.149↓19.362.291↓1.46
Publisher’s Note: MDPI stays neutral with regard to jurisdictional claims in published maps and institutional affiliations.

