Abstract
To explore the difference in the response of the radial growth of Pinus tabulaeformis and Picea crassifolia on different timescales to climate factors in the eastern part of Qilian Mountains, we used dendrochronology to select four different timescales (day, pentad (5 days), dekad (10 days), and month) for exploration. The primary conclusions were as follows: (1) According to an investigation of the dynamic correlations between radial growth and climate conditions, drought during the growing season has been the dominant limiting factor for radial growth across both species in recent decades; (2) climate data at the dekad scale are best for examining the correlations between radial growth and climate variables; and (3) based on basal area increment, P. tabuliformis in the study area showed a trend of first an increase and then a decrease, while P. crassifolia showed a trend of continuous increase (BAI). As the climate continues to warm in the future, forest ecosystems in arid and semi-arid areas will be more susceptible to severe drought, which will lead to a decline in tree growth, death, and community deterioration. As a result, it is critical to implement appropriate management approaches for various species based on the peculiarities of their climate change responses.
1. Introduction
AR6 points out that based on historical observations and model simulations in the 21st century, land warming at the global scale has increased the demand for atmospheric evaporation and the intensity of drought events. The increase in land temperature was higher than that in the ocean, which affected the atmospheric circulation and reduced the relative humidity near the surface, leading to the occurrence of regional drought events [1]. Forest ecosystems have produced a strong response to global climate change, which has caused changes in the growth of large areas of trees, forest composition, and carbon assimilation [2]. Most studies on the impact of climate change on biodiversity have focused on the direct effects of temperature and precipitation. Fewer studies have looked at indirect effects, such as how climate change affects the forest structure and composition, which has an impact on species presence and abundance [3].
The impact of climate warming on the radial growth of trees varies with environmental differences. In humid areas, higher temperatures can promote tree growth by accelerating the onset of xylem cells or accelerating the rate of photosynthesis [4]. Alternatively, a warming climate may trigger drought events, and in dry regions, trees have a reduced ability to absorb water due to reduced xylem carbohydrates, leading to reduced growth [5,6]. In addition, different forest species in different regions show different ecological adaptation mechanisms to climate change [7]. Some tree species have shown divergent responses to global climate change, indicating unstable responses to limiting environmental condition factors over time, like in spruce and Abies lasiocarpa in opaque gem parkland in Canada, black pine, and P. tabuliformis and Sabina przewalskii in northwest China [8,9,10,11]. However, European larch in the European Alps, P. nigra in Mediterranean hilly areas, and P. crassifolia in northwest China’s mid-latitudes show fairly consistent responses to limiting climatic variables. Global warming is one of the major causes of reduced tree growth and death in arid and semi-arid regions [12,13,14,15]. There is a considerable number of studies that present a different perspective, and the results suggest that in semi-arid environments, elevated atmospheric CO2 concentrations positively affect the radial growth rate of naturally growing trees and that the growth of trees is affected not only by climatic factors but also by other non-climatic factors [16,17,18]. Therefore, there is great significance in fully understanding the spatial and temporal responses patterns of forest ecosystems to climate transition, which can be tailored to provide a scientific basis for forest management schemes [19,20].
The responses of trees’ radial growth to climate factors differ across timescales [21]. Traditional dendrochronology studies on growth–climate relationships usually focus on long monthly or annual timescales, excluding the short dekad (10 days), pentad (5 days), and daily timescales [10,22,23]. The trees’ continuous development process is disturbed physically, and some climatic indicators of tree chronology are often lost [24]. Alternatively, a more accurate climate signal can be obtained from tree chronology if the tree response to climate is on an appropriate timescale that is consistent with tree growth patterns. The results of this study of growth patterns on short timescales provide interpretation and validation for studies of radial tree growth on long timescales. Daily climatic variables, particularly daily temperature in the pre- and early growth seasons, play an essential influence in shaping tree ring width [25]. Dendroclimatology has also used 5-day and 10-day time frames, in addition to daily timescales. For example, using the correlation between the tree ring width index and the mean temperature on a pentad scale, the important phenological interval of the tree-growing season in Eurasia was determined [26]. Tree growth and climate factors in early summer (17 June to 11 July) in Eastern Tamil and Putoran were reconstructed on a small timescale [27]. However, all the above studies were conducted within a single timescale. In addition, the results of tree radial growth response at different timescales remain uncertain. Therefore, it is necessary to analyze the relationship between tree growth and climate factors at different timescales.
Different tree species in the same habitat will lead to different responses to climate change [28]. For example, in northern Ontario, Canada, it was found that increases in temperature during the growing season promote the radial growth of the North American Pinus banksiana but cause a decline in the growth of Picea mariana [29]. Climate change in Europe has contributed to the growth of birch and beech, as the warming climate has caused the trees to start growing earlier and end later, lengthening the entire growing season [30]. In the Tianshan Mountains of northern China, Picea schrenkiana was more susceptible to drought than Larix sibirica because of variations in resource allocation trade-offs [11]. These findings suggest that there are significant variations in the response patterns of different tree species to climate change, as they relate to distinct ecological adaptation methods. As a result, additional tree species must be studied to determine the link between tree growth and climate change.
The Qilian Mountains (36–40° N, 94–103° E) are located on the northeastern edge of the Qinghai–Tibet Plateau in northwestern China, a transition zone between the arid west and the humid east. It is an important water source and runoff area for the oasis of the Hexi Corridor and the Yellow River Basin, as well as an important ecological security barrier in the western region of China. Forests of P. crassifolia and P. tabuliformis in the Qilian Mountains play important roles in water conservation and biodiversity protection. Therefore, it is important to study the responses of forest ecosystems in this region to climate change and global warming [31,32]. In recent decades, studies in the Qilian Mountains have focused on the evaluation of tree rings and reconstruction of the relationship between climate factors [33,34,35,36]. There are many studies on the middle and western parts of Qilian Mountains [37,38], and were few have been performed in the eastern Qilian Mountains [39,40,41]. The response patterns and mechanisms of radial growth under climate change are still not clear for different timescales and species. To determine the timescale effects of patterns in radial growth responses in two dominant coniferous trees under climate change in the eastern Qilian Mountains, we (1) analyzed the relationship between the radial growth of the two tree species at the daily, climatic, annual, and monthly timescales and the response to climate factors and (2) compared the differences in the interannual changes in the radial growth of the two tree species and clarified the growth of different tree species under climate change patterns and future development trends.
2. Material and Methods
2.1. Study Area and Climate
The study area was in Tulu Trench Forest Park (36°40′–36°44′ N, 102°36′–102°45′ E) in the eastern Qilian Mountains (Figure 1). It has a typical temperate continental monsoon climate, with rainy and hot periods (Figure 2). The Wushaoling meteorological station (37.2° N, 102.87° E; 3045.1 m), which is close to the sampling point, was selected for meteorological data. The mean annual precipitation was 414.8 mm from 1960 to 2018, and more than 60% of that occurred in June–September. The mean monthly temperature ranges from −11.8 °C in January to 11.6 °C in July. The annual total solar radiation is 469 kJ/cm2, the frost-free period is only one-third of the year, and the annual evaporation is much greater than the annual precipitation. The study area is rich in vegetation resources and presents obvious vertical zoning, transitioning from low-altitude forests to high-altitude meadows; trees mainly include coniferous species, such as Qilian Qinghai spruce, P tabulaeformis, juniper, and Picea wilsorii, as well as Populus davidiana and Betula albosinensis. In addition, Betula platyphylla and other broad-leaved trees are present, and shrubs, such as Cotoneaster, Rhododendron and Potentilla, and herbaceous plants, such as Kobresia pygmaea, are also abundant [42].
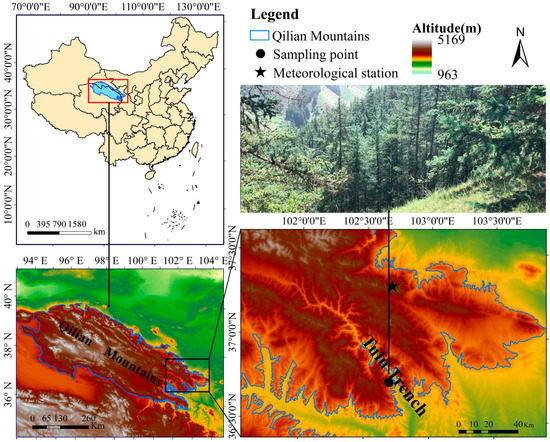
Figure 1.
Locations of sampling sites and the nearest meteorological station (Wushaoling meteorological station).
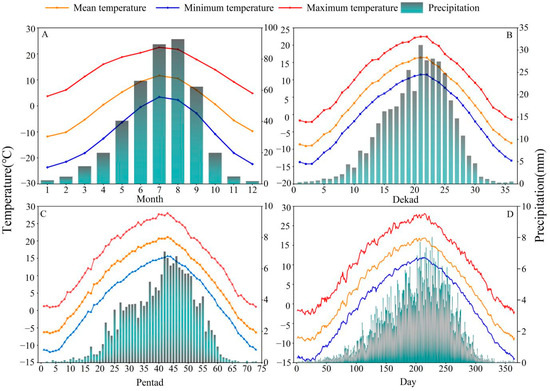
Figure 2.
Variation trends in climate factors in the study area at daily, pentad, dekad, and monthly timescales during 1960–2018. (A) Trend in climate factors at the monthly scale, (B) change trend in climate factors at the dekad scale, (C) change trend in climate factors at the pentad scale, and (D) change trend in climate factors at the daily scale.
2.2. Field Sampling and Chronology Establishment
In August 2019, the collection of tree ring samples was carried out in the eastern part of Qilian Mountains. The sampling objects were the dominant species of P. tabulaeformis and P. crassifolia in this area, and their growth environment is similar. The specific sampling location is shown in Figure 1. To avoid the interference of non-climatic factors on the radial growth of trees, a total of 50 trees with good growth conditions were selected for the 2 tree species. Among them, there were 25 P. tabulaeformis and P. crassifolia, each with 2 cores. Sampling information is shown in Table 1. The collected sample cores were packaged in paper tubes, and after the relevant information about the sampling points was indicated, they were brought back to the laboratory for further processing.

Table 1.
Information of tree ring sampling sites in this study.
The tree ring samples were taken back to the laboratory for preliminary processing. First, the sample cores were fixed in a special wooden trough with latex. After the samples were dried naturally, they were polished with sandpaper until the rings were clearly visible, and then they were placed under a binocular microscope for visual dating. The tree ring width was measured with a LINTBA tree ring width meter with 0.001 mm accuracy (TM5, Rinntech, Heidelberg, Germany), followed by dating with the COFECHA program to ensure the accuracy of all sample dating and tree ring width measurements [43]. Finally, the ARSTAN program was used to establish the chronology [44], the spline function was used to fit, and influencing factors other than climate factors were removed. Finally, the tree ring width standard chronology (STD), difference chronology (RES), and autoregressive chronology (ARS) were established. The standard chronology was selected for analysis in this study.
2.3. Meteorological Data
For the meteorological data, the Wushaoling meteorological station (37°20′ N, 102°87′ E, 1960–2018, Figure 3), with an altitude of 3045 m, was nearest to the sampling point (about 57 km). Tree growth is not only affected by the climate of the current year but also by the climate of the previous year. Therefore, this study adopted September of the previous year to October of the current year as the analysis interval of meteorological indicators. The responses of tree growth to climate factors at different timescales were analyzed based on meteorological station data.
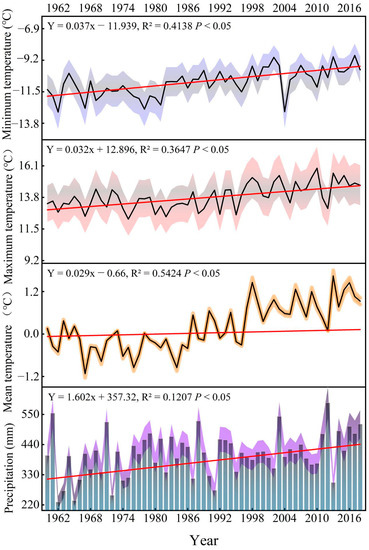
Figure 3.
Interannual variations of temperature and precipitation in the study area from 1960 to 2018 (blue, red, and orange, and purple, respectively, indicate the inter-annual variation error range of temperature and precipitation).
2.4. Methods
SThe daily data were used to calculate the pentad, dekad, and monthly climatic values. We first generated the daily average of each climatic factor from 1960 to 2018 (Figure 2D). The total precipitation and mean temperature of 28 and 29 February in the leap year were used as precipitation and temperature of 28 February. There are 73 pentads in a year. For example, the first pentad is 1–5 January, and the 73rd pentad is 27–31 December [45]. The pentad precipitation is the total precipitation over a 5-day period, and the temperature is the mean temperature of those 5 days (Figure 2C). There are three dekads in a month and 36 dekads in a year. The first dekad of a month extends from the first to the tenth day of the month; the following 10 days are the second dekad; and the 21st to the last day of the month is the third dekad. Similar to the pentad, the dekad precipitation is the sum of the daily precipitation, and the temperature is the mean temperature of the 10 days (Figure 2B).
At the daily, pentad, dekad, and monthly timescales, the Pearson correlation analysis method was used to identify the growth response of the trees to climate and mainly control of climate factors. To assess the radial growth trend, we calculated the basal area increment (BAI) based on the original tree ring width chronology. BAI is a variable with biological significance that quantifies the radial growth rate and trend of trees without the influence of detrending that is generally used to produce the chronology [46]. BAI was calculated using the following formula:
where the BA variable represents consecutive cross-sectional basal areas, R is the core length measured for dated tree rings formed in year t − 1, and TRW is the measured raw width of the tree ring in year t.
3. Results
3.1. Chronological Parameter Analyses
Table 2 shows the chronological (STD) statistical parameters of both P. crassifolia and P. tabuliformis in the study area. The high SNR (21.334 and 15.410) and EPS (0.965 and 0.939, SSS > 0.850) values of the two tree species indicate that the chronologies established had high reliability and that the samples contained more climate information, making them suitable for the study of tree ring ecology. The high values of MS, PC1, SD, and SNR indicate that the annual fluctuations in the two chronologies were consistent and were sensitive to climate change. Among them, the SNR and EPS values of the chronology of P. crassifolia were higher than those of P. tabuliformis, indicating that the chronology of P. crassifolia contains more climate information.
Table 2.
Statistical parameters of the standard chronology.
3.2. Radial Growth Response of the Climate Factors of the Two Tree Species at Four Timescales
3.2.1. Growth–Climate Relationships at the Month Scale
The radial growth of P. tabuliformis was significantly negatively correlated with precipitation in February (r = −0.289, p < 0.05) and October (r = −0.385, p < 0.01) of the current year. Additionally, the radial growth of P. tabuliformis was significantly negatively correlated with temperature in the growing season, showing correlations with the mean temperature in September (r = −0.431, p < 0.01) of the previous year and June (r = −0.357, p < 0.01) and July (r = −0.436, p < 0.01) of the current year, the mean maximum temperature in May (r = −0.341, p < 0.01) and July (r = −0.438, p < 0.01) of the current year, and the mean minimum temperature in July (r = −0.288, p < 0.05) of the current year.
Radial growth of P. crassifolia was not significantly correlated with precipitation (Figure 4). The radial growth of Qinghai spruce was significantly negatively correlated with temperature at the end of the previous year’s growing season and the current year’s growing season (mean temperature P9: r = −0.326, p < 0.01, C1: r = −0.326, p < 0.05, C2: r = −0.326, p < 0.01, C3: r = −0.326, p < 0.01; maximum temperature C2: r = −0.288, p < 0.05; C3: r = −0.379, p < 0.01; C6: r = −0.513, p < 0.01; minimum temperature C6: r = −610, p < 0.01, C8: r = −0.302, p < 0.05).
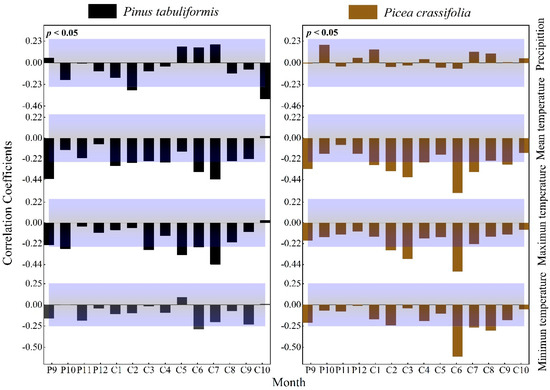
Figure 4.
Response of the radial growth of trees to monthly values of climatic factors (Beyond the top of the purple shade, p values are positively correlated (p < 0.05), lower than the part in purple shadow indicates that p values are negatively correlated (p < 0.05).
3.2.2. Effect of Dekad Time Units on the Expression of Correlations
The radial growth of P tabulaeformis was significantly positively correlated with the precipitation in June and July of the current growing season, and it had a strong negative response to temperature mainly during the growing season; the radial growth of P. crassifolia was in the early third and fourth parts of the growing season. The monthly precipitation was negatively correlated. It had a strong negative response relationship with temperature mainly in the early and middle growing season (Figure 5).
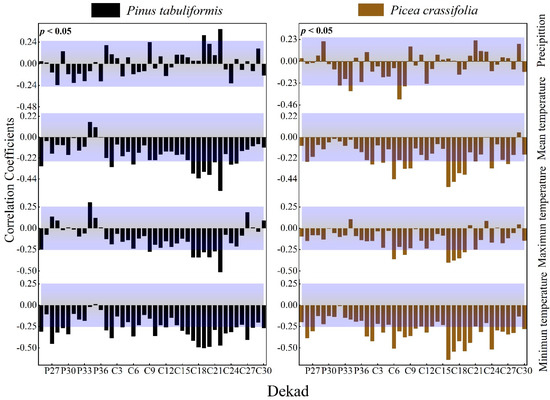
Figure 5.
Response of the radial growth of trees to dekad values of climatic factors (Beyond the top of the purple shade, p values are positively correlated (p < 0.05), lower than the part in purple shadow indicates that p values are negatively correlated (p < 0.05).
3.2.3. The Effect of Waiting Time Units on the Expression of Correlation
The radial growth of P tabulaeformis was significantly positively correlated with the precipitation in the current growing season and negatively correlated with the temperature (average temperature, maximum temperature, minimum temperature) mainly in the current growing season and at the end of the previous growing season. P. crassifolia also had a similar response pattern (Figure 6).
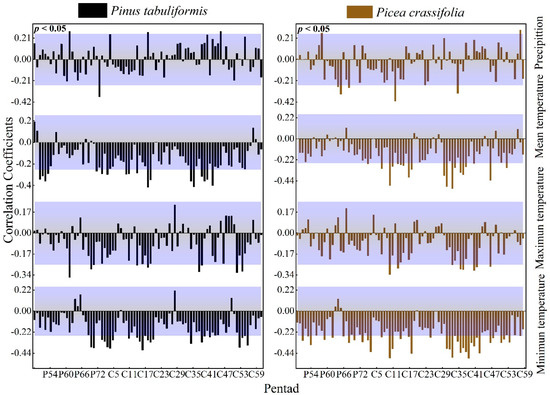
Figure 6.
Response of the radial growth of trees to pentad values of climatic factors (Beyond the top of the purple shade, p values are positively correlated (p < 0.05), lower than the part in purple shadow indicates that p values are negatively correlated (p < 0.05).
3.2.4. Effect of Daily Time Units on Correlation Expression
The radial growth of the two dominant tree species in the study area showed similar correlations in daily climatic factors, dekad and pentad scales, mainly showing a positive correlation between precipitation in the growing season and a negative correlation between temperature in the first and middle of the growing season (Figure 7).
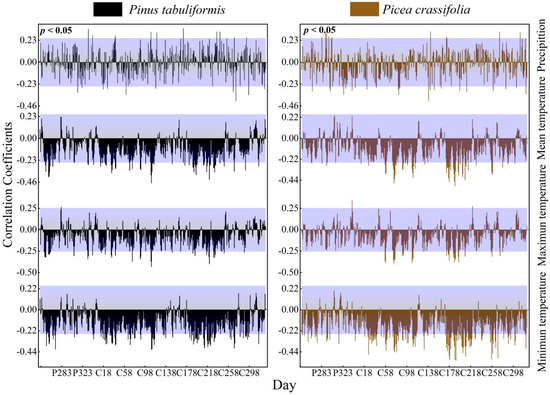
Figure 7.
Response of the radial growth of trees to daily values of climatic factors (Beyond the top of the purple shade, p values are positively correlated (p < 0.05), lower than the part in purple shadow indicates that p values are negatively correlated (p < 0.05).
We calculated the correlation coefficients between the tree ring index and climate factors at various timescales to determine the key climate intervals that affect the growth of trees (Table 3). On all timescales, the tree ring index had the strongest correlation with the temperature index. At the same time, no matter how the timescale of precipitation or temperature changed, it showed that the absolute value of the correlation coefficient between the dekad-scale climate factor and the tree ring index was the largest.
Table 3.
The maximum correlation coefficient between the tree ring index and climate factors at different timescales.
3.2.5. Correlation between the Radial Growth of Different Trees and the Drought Index (SPEI)
The relationship between tree growth and the drought index (SPEI) is shown in Table 4. The results show that the radial growth of P. tabulaeformis was significantly positively correlated with the drought index at different timescales in the growing season, but there was no significant correlation between the radial growth of P. crassifolia and the drought index. This significant correlation indicated that the radial growth of P. tabulaeformis is more limited by drought stress in the sampling area.
Table 4.
The correlation relationship between the radial growth of the two dominant coniferous species and the SPEI (1960–2018).
3.3. Radial Growth Characteristics of Trees
This study found that temperature is one in all the key factors limiting the radial growth of trees within the study area, which increased significantly at 0.428 °C/10a (Figure 3). However, different growth trends were observed in the two species (Figure 8). We saw an upward trend in the BAI of P. crassifolia from 1960 to 2018 (3.065 cm2 yr−1/10a/10a), while this factor increased first and then decreased for P. tabuliformis. Notably, the growth rate of P. tabuliformis has decreased significantly (−0.739 cm2 yr−1/10a) since the middle of the 20th century, given the significant increase in temperature.
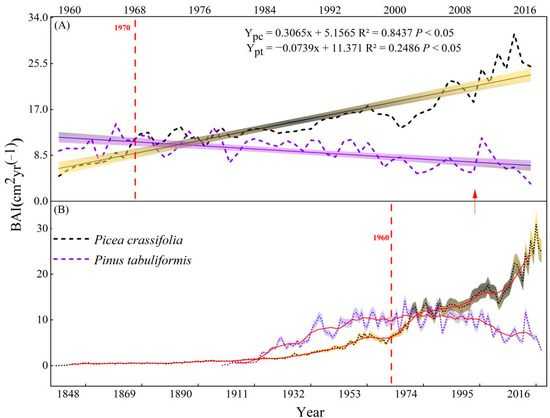
Figure 8.
Interannual variation of the basal area increment (BAI) of two tree species. (A) Trend in growth since meteorological data have been recorded and (B) the entire time series of tree growth; the red line represents the 10-year moving average.
4. Discussion
4.1. Response Comparisons of the Radial Growth of Trees to Global Climate Change on Four Timescales
We found that there is a significant correlation between the radial growth of P. tabuliformis and precipitation in the study area, and the response of P. crassifolia to precipitation only appears on a smaller timescale (Figure 4, Figure 5, Figure 6 and Figure 7). A significant negative correlation was found between precipitation and P. tabuliformis, while that with P. crassifolia was not obvious. However, different responses to climate factors may also be associated with differences between the growing environments of trees species. For example, P. tabuliformis grows mainly on sunny or semi-sunny slopes, while P. crassifolia grows mainly on shady slopes; this must be clear for the beginning. So the evaporation rates of the two species are different. Studies have shown that extremely high rainfall may affect environmental conditions, directly or indirectly limiting tree growth at specific times of the year [47]. The growth of the two dominant tree species in the study area was significantly and negatively correlated with temperature at four timescales. Although tree cambium activities stopped in the fall of the previous year, higher temperatures at this time may promote carbohydrate storage and the synthesis of organic substances in trees, which are beneficial to growth in the coming year [48,49]. In addition, the higher temperature in the early part of the growth period may cause the start date of the growing season to advance, making the trees grow wider rings [50]. Since the start and end dates of tree growth are basically determined, the correlation coefficients of trees growing on different timescales (day, pentad, dekad, month) and climate factors (temperature and precipitation) have certain similarities [39,46].
Many studies have confirmed the existence of transition zones between tree radial growth and climate on both temporal and spatial scales, and therefore, a single monthly scale climate change has not always been the best option in the past when studying the relationship between tree growth and climate change [51,52,53]. It has been reported that Quecus ilex growth in the Mediterranean is more correlated with precipitation at the small scale than on large timescales [54]. In Inner Mongolia, we also discovered more accurate results for the response connection of climate with tree growing at a time frame less than 1 month, where precipitation during 1 April–10 July was rebuilt [39]. For dendroclimatic models, the daily time frame was shown to be better. Tree growth models using daily climate data are better than monthly data in identifying special climate events that last only a few days but have a significant impact on the development of trees [55]. At the same time, the daily time unit also has some shortcomings, such as being too large a calculation. As shown in Table 3, the correlation coefficients between tree growth and climate factors at different timescales are similar. This indicates that the pentad and dekad timescales may be able to replace the daily scale. In addition, the pentad and dekad timescales have been widely used in studies of climate change and tree physiology [45,56,57,58]. However, according to our study, the response of tree growth to climate is more accurate on a dekad scale. To better comprehend the dekad scale’s superiority, we discovered that the greatest correlation coefficient between the radial growth of trees and temperature in the 17–25th dekad period was larger than the monthly value for the same time. Meanwhile, the highest correlations between tree ring data and precipitation throughout the growing season increased from 0.296 to 0.386 at the dekad and monthly scales (Table 3). According to the principles of dendrophysiology and dendrophenology [47], the temperature from the 16th to the 25th dekad (June to August) is the main determinant of the radial growth of trees in the Qilian Mountains. Starting in early April every year, the average temperature is above 5 °C, and the trees will enter a period of rapid growth, the radial growth of trees into the rapid growth period [59]. In addition, the high temperature and more precipitation caused by climate change are conducive to the formation of cambium phenology, and the increase in and enlargement of cells are also conducive to the growth of trees and the formation of wide rings [34]. In conclusion, the assessment of growth responses in trees to climate factors at a smaller timescale avoids the problem of correlation relationships being concealed by an excessively large timescale. Therefore, climate factors at the dekad scale might be more appropriate than the monthly scale when assessing the correlation of P. tabuliformis with P. crassifolia in the Qilian Mountains.
4.2. Responses of Different Tree Species Growth Patterns to Climate Change
Our results showed that the growth patterns of the two tree species in the 20th century differed with climate change. The growth trend of P. crassifolia increased significantly, while that of P. tabuliformis decreased significantly after the 1980s (Figure 8). The two coniferous species’ growth patterns and ecological adaption methods differed as a result of the sudden temperature increase. P. crassifolia responded to environmental warming by optimizing its water usage techniques and encouraged its own development by controlling CO2 and nutrient absorption [60,61]. Under the circumstance of high atmospheric CO2 concentration, the stomatal openings in the leaves of P. crassifolia reduced during photosynthesis [62], thus reducing the transpiration rate and improving the water use efficiency. Furthermore, after a sudden increase in temperature, the limiting impact of precipitation on P. crassifolia grew progressively, suggesting that increases in drought stress will similarly limit P. crassifolia development when future temperatures rise above the tree response critical value (Figure 8). Forests in arid and semi-arid regions reduce the adverse effects caused by climate change through their own re-adaptation to the environment, thereby maintaining their own growth and stability [35,63]. Drought stress, however, has become a major limiting factor in P. tabuliformis radial growth, and prolonged temperature rises will lead P. tabuliformis growth to slow in the future (Figure 8). A similar finding has been reached elsewhere, indicating that the reproduction rate of P. tabuliformis slowed with time and its range narrowed toward the end of the 20th century [64].
Different tree species in the same region respond differently to climate change, depending on their species and biological characteristics [65]. It was found that the radial growth of P. crassifolia and P. tabuliformis in the middle and east of the Qilian Mountains was significantly negatively correlated with the temperature during the growing season [41,66,67,68,69,70]. The available water could hardly meet the needs of plants due to the high temperatures and drought that occurred in the growing season in the northwest inland area of China, leading to severe drought stress on the radial growth of P. tabuliformis in the study area. This result is generally referred to as the drought-sensitive response of trees to climate warming [71,72]. Further comparison between the two species showed that the degree of correlation between the radial growth of P. tabuliformis and temperature is higher than that for P. crassifolia. P. tabuliformis is mainly distributed on sunny and semi-sunny slopes, where the environmental conditions are relatively hot and dry with strong illumination. High temperatures cause leaf stomatal closure and reduce the photosynthesis of trees. However, P. crassifolia is distributed on shady slopes and semi-shady slopes with weak illumination intensity, so it is less affected by high temperatures than P. tabuliformis. This study found that P. tabuliformis growing on the drier sunny and semi-sunny slopes of the Qilian Mountains is more prone to growth declines and deaths than P. crassifolia growing on shady slopes with increases in temperature and aridity. In the context of climate warming, the protection and management of P. tabuliformis forests should be emphasized.
In the past 50 years, the temperature in the northwest of China has continued to increase [73], and some models predict that with the increasing warming, resulting in severe and widespread drought in many land areas, drought stress caused by regional drought may be the main reason for the general increase in mortality of trees of different species, sizes, altitudes, and latitudes and longitudes, and the future increase in warming and drying may significantly affect the regional trees [74]. In addition, drought was also found to be the main factor limiting tree growth by calculating the drought index (SPEI) (Table 4). Thus, it can be seen that warming-induced drought stress has an extremely serious impact on normal tree growth and forest carbon uptake. At the same time, forests in arid and semi-arid environments will also suffer from severe drought impacts in the future, and this can lead to reduced tree growth and tree death [11]. The survival of different tree species will develop in the changing climate environment to form the best combination of tree species, which will lead to changes in forest composition, structure, and productivity.
5. Conclusions
The two dominant conifer species in the study area exhibited completely different growth patterns under the same climate background, and at the same time, they were under severe drought stress during the growing season. Meanwhile, P. tabuliformis radial growth exhibited a synchronous radial growth pattern, increasing initially and then reducing, but P. crassifolia radial development exhibited a synchronous radial growth pattern that considerably grew. Different tree species show different responses to climate change, which is conducive to providing more reasonable protection and management measures for the forest ecosystem and reducing the harm caused by environmental change. In addition, compared with the daily, pentad, and monthly timescales, the two tree species are more sensitive to climatic factors at the dekad timescale in the eastern Qilian Mountains. As a result, while researching the link between tree growth and climate, as well as historical climate reconstruction, we should pay greater attention to the effect of climatic parameters on short time periods, such as the dekad scale, over trees.
Author Contributions
Study conception and experimental design: L.J. and C.Q.; Acquisition and processing of samples: R.X., X.W., and D.D.; Analysis and interpretation of data: L.J. and C.Q.; Drafting of manuscript: L.J. and C.Q. All authors have read and agreed to the published version of the manuscript.
Funding
This research was supported by the National Natural Science Foundation of China (grant no. 41861006), the Natural Science Foundation of Gansu Province (no. 20JR10RA093), and the Research Ability Promotion Program for Young Teachers of Northwest Normal University (NWNU-LKQN2019-4).
Informed Consent Statement
Written informed consent has been obtained from the patient(s) to publish this paper.
Data Availability Statement
Not applicable.
Acknowledgments
We thank the anonymous referees for helpful comments on the manuscript.
Conflicts of Interest
The authors declare no conflict of interest.
References
- Douville, H.; Raghavan, K.; Renwick, J.; Allan, R.P.; Arias, P.A.; Barlow, M.; Cerezo-Mota, R.; Cherchi, A.; Gan, T.Y.; Gergis, J.; et al. Water Cycle Changes [M/OL]//IPCC. In Climate Change 2021: The Physical Science Basis; Cambridge University Press: Cambridge, UK, 2021. [Google Scholar]
- Engelbrecht, B.M.J. Plant ecology: Forests on the brink. Nature 2012, 491, 675–677. [Google Scholar] [CrossRef]
- De Frenne, P.; Rodríguez-Sánchez, F.; Coomes, D.A.; Baeten, L.; Verstraeten, G.; Vellend, M.; Bernhardt-Römermann, M.; Brown, C.D.; Brunet, J.; Cornelis, J.; et al. Microclimate moderates plant responses to macroclimate warming. Proc. Natl. Acad. Sci. USA 2013, 110, 18561–18565. [Google Scholar] [CrossRef]
- Sun, X.Y.; Wang, G.X.; Huang, M.; Hu, Z.Y.; Song, C.L. Effect of climate change on seasonal water use efficiency in subalpine Abies fabri. J. Mt. Sci. 2017, 14, 142–157. [Google Scholar] [CrossRef]
- DesLauriers, A.; Beaulieu, M.; Balducci, L.; Giovannelli, A.; Gagnon, M.J.; Rossi, S. Impact of warming and drought on carbon balance related to wood formation in black spruce. Ann. Bot. 2014, 114, 335–345. [Google Scholar] [CrossRef] [PubMed]
- Piao, S.L.; Zhang, X.P.; Chen, A.G.; Liu, Q.; Lian, X.; Wang, X.H.; Peng, S.S.; Wu, X.C. Effects of extreme climate events on carbon cycling in terrestrial ecosystems. Sci. China Earth Sci. 2019, 49, 1321–1334. [Google Scholar]
- Liu, H.Y.; Yin, Y. Response of forest distribution to past climate change: An insight into future predictions. Chin. Sci. Bull. 2013, 58, 4426–4436. [Google Scholar] [CrossRef]
- De Grandpre, L.; Tardif, J.C.; Hessl, A.; Pederson, N.; Conciatori, F.; Green, T.R.; Oyunsanaa, B.; Baatarbileg, N. Seasonal shift in the climate responses of Pinus sibirica, Pinus sylvestris, and Larix sibirica trees from semi-arid, north-central Mongolia. Can. J. For. Res. 2011, 41, 1242–1255. [Google Scholar] [CrossRef]
- Lebourgeois, F.; Mérian, P.; Courdier, F.; Ladier, J.; Dreyfus, P. Instability of climate signal in tree-ring width in Mediterranean mountains: A multi-species analysis. TreesC 2012, 26, 715–729. [Google Scholar] [CrossRef]
- Zhuang, L.; Axmacher, J.; Sang, W. Different radial growth responses to climate warming by two dominant tree species at their upper altitudinal limit on Changbai Mountain. J. For. Res. 2017, 28, 795–804. [Google Scholar] [CrossRef]
- Jiao, L.; Jiang, Y.; Zhang, W.; Wang, M.; Wang, S.; Liu, X. Assessing the stability of radial growth responses to climate change by two dominant conifer trees species in the Tianshan Mountains, northwest China. For. Ecol. Manag. 2018, 433, 667–677. [Google Scholar] [CrossRef]
- Büntgen, U.; Frank, D.; Wilson, R.; Carrer, M.; Urbinati, C.; Esper, J. Testing for tree-ring divergence in the European Alps. Glob. Chang. Biol. 2008, 14, 2443–2453. [Google Scholar] [CrossRef]
- Hou, Y.; Niu, Z.; Zheng, F.; Wang, N.; Wang, J.; Li, Z.; Chen, H.; Zhang, X. Drought fluctuations based on dendrochronology since 1786 for the Lenglongling Mountains at the northwestern fringe of the East Asian summer monsoon region. J. Arid. Land 2016, 8, 492–505. [Google Scholar] [CrossRef]
- Allen, C.D.; Breshears, D.D.; McDowell, N.G. On underestimation of global vulnerability to tree mortality and forest die-off from hotter drought in the Anthropocene. Ecosphere 2015, 6, art129. [Google Scholar] [CrossRef]
- Chen, H.Y.H.; Yong, L. Net aboveground biomass declines of four major forest types with forest ageing and climate change in western Canada’s boreal forests. Glob. Chang. Biol. 2015, 21, 3675–3684. [Google Scholar] [CrossRef]
- Soulé, P.T.; Knapp, P.A. Radial growth rates of two co-occurring coniferous trees in the Northern Rockies during the past century. J. Arid. Environ. 2013, 94, 87–95. [Google Scholar] [CrossRef]
- Graybill, D.A.; Idso, S.B. Detecting the aerial fertilization of atmospheric CO2 enrichment in tree-ring chronologies. Glob. Biogeochem. Cycles 1993, 7, 81–95. [Google Scholar] [CrossRef]
- Soulé, P.T.; Paul Knapp, A. Radial Growth and Increased Water-Use Efficiency for Ponderosa Pine Trees in Three Regions in the Western United States. Prof. Geogr. 2011, 63, 379–391. [Google Scholar] [CrossRef][Green Version]
- Anderegg, W.R.L.; Hicke, J.A.; Fisher, R.; Allen, C.D.; Aukema, J.; Bentz, B.; Hood, S.; Lichstein, J.W.; Macalady, A.K.; McDowell, N.; et al. Tree mortality from drought, insects, and their interactions in a changing climate. New Phytol. 2015, 208, 674–683. [Google Scholar] [CrossRef] [PubMed]
- Kannenberg, S.A.; Schwalm, C.R.; Anderegg, W.R.L. Ghosts of the past: How drought legacy effects shape forest functioning and carbon cycling. Ecol. Lett. 2020, 23, 891–901. [Google Scholar] [CrossRef]
- Turcotte, A.; Morin, H.; Krause, C.; Deslauriers, A.; Thibeault-Martel, M. The timing of spring rehydration and its relation with the onset of wood formation in black spruce. Agric. For. Meteorol. 2009, 149, 1403–1409. [Google Scholar] [CrossRef]
- Zhang, Y.; Bergeron, Y.; Gao, L.; Zhao, X.; Wang, X.; Drobyshev, I. Tree growth and regeneration dynamics at a mountain ecotone on Changbai Mountain, northeastern China: Which factors control species distributions? Écoscience 2014, 21, 387–404. [Google Scholar] [CrossRef]
- Zhang, L.; Jiang, Y.; Zhao, S.; Jiao, L.; Wen, Y. Relationships between tree age and climate sensitivity of radial growth in different drought conditions of Qilian Mountains, northwestern China. Forests 2018, 9, 135. [Google Scholar] [CrossRef]
- Dong, M.-Y.; Jiang, Y.; Yang, H.-C.; Wang, M.-C.; Zhang, W.-T.; Guo, Y.-Y. Dynamics of stem radial growth of Picea meyeri during the growing season at the treeline of Luya Mountain, China. Chin. J. Plant Ecol. 2012, 36, 956–964. [Google Scholar] [CrossRef]
- Grote, R.; Pretzsch, H.; Rötzer, T. The timing of bud burst and its effect on tree growth. Int. J. Biometeorol. 2004, 48, 109–118. [Google Scholar] [CrossRef]
- Vaganov, E.A.; Hughes, M.K.; Kirdyanov, A.V.; Schweingruber, F.H.; Silkin, P.P. Influence of snowfall and melt timing on tree growth in subarctic Eurasia. Nature 1999, 400, 149–151. [Google Scholar] [CrossRef]
- Naurzbaev, M.M.; Vaganov, E.A. Variation of early summer and annual temperature in east Taymir and Putoran (Siberia) over the last two millennia inferred from tree rings. J. Geophys. Res. Space Phys. 2000, 105, 7317–7326. [Google Scholar] [CrossRef]
- Liu, M.; Mao, Z.-J.; Li, Y.; Li, X.-H.; Liu, R.-P.; Huang, W.; Sun, T.; Zhao, J. Climatic effects on radial growth of Korean pines with different bark forms in Liangshui Natural Reserve, Northeast China. Yingyong Shengtai Xuebao 2014, 25, 2511–2520. [Google Scholar] [PubMed]
- Subedi, N.; Sharma, M. Climate-diameter growth relationships of black spruce and jack pine trees in boreal Ontario, Canada. Glob. Chang. Biol. 2012, 19, 505–516. [Google Scholar] [CrossRef]
- Chmielewski, F.-M.; Rötzer, T. Response of tree phenology to climate change across Europe. Agric. For. Meteorol. 2001, 108, 101–112. [Google Scholar] [CrossRef]
- Gao, L.; Gou, X.; Deng, Y.; Yang, M.; Zhang, F.; Li, J. Dendroclimatic reconstruction of temperature in the eastern Qilian Mountains, northwestern China. Clim. Res. 2015, 62, 241–250. [Google Scholar] [CrossRef]
- Gao, L.; Gou, X.; Deng, Y.; Wang, Z.; Gu, F.; Wang, F. Increased growth of Qinghai spruce in northwestern China during the recent warming hiatus. Agric. For. Meteorol. 2018, 260–261, 9–16. [Google Scholar] [CrossRef]
- Chen, F.; Yuan, Y.J.; Chen, F.H.; Wei, W.S.; Yu, S.L.; Chen, X.J.; Fan, Z.A.; Zhang, R.B.; Zhang, T.W.; Shang, H.M.; et al. A 426-year drought history for western Tianshan, Central Asia, inferred from tree rings and linkages to the North Atlantic and Indo-West Pacific Oceans. Holocene 2013, 23, 1095–1104. [Google Scholar] [CrossRef]
- Chen, F.; Yuan, Y.J.; Yu, S.L.; Zhang, T.W.; Shang, H.M.; Zhang, R.B.; Qin, L.; Fan, Z.A. A 225-year long drought reconstruction for east Xinjiang based on Siberia larch (Larix sibirica) tree-ring widths: Reveals the recent dry trend of the eastern end of Tien Shan. Quat. Int. 2015, 358, 42–47. [Google Scholar] [CrossRef]
- Xu, G.; Liu, X.; Trouet, V.; Treydte, K.; Wu, G.; Chen, T.; Sun, W.; An, W.; Wang, W.; Zeng, X.; et al. Regional drought shifts (1710–2010) in East Central Asia and linkages with atmospheric circulation recorded in tree-ring δ18O. Clim. Dyn. 2018, 52, 1–15. [Google Scholar] [CrossRef]
- Zhang, T.; Zhang, R.; Jiang, S.; Bagila, M.; Ainur, U.; Yu, S. On the ‘Divergence Problem’ in the Alatau Mountains, Central Asia: A Study of the Responses of Schrenk Spruce Tree-Ring Width to Climate under the Recent Warming and Wetting Trend. Atmosphere 2019, 10, 473. [Google Scholar] [CrossRef]
- Gou, X.; Chen, F.; Yang, M.; Li, J.; Peng, J.; Jin, L. Climatic response of thick leaf spruce (Picea crassifolia) tree-ring width at different elevations over Qilian Mountains, northwestern China. J. Arid. Environ. 2005, 61, 513–524. [Google Scholar] [CrossRef]
- Liu, Y.; Sun, J.; Yang, Y.; Cai, Q.; Song, H.; Shi, J.; An, Z.; Li, X. Tree-ring-derived precipitation records from inner Mongolia, China, since A.D. 1627. Tree-Ring Res. 2007, 63, 3–14. [Google Scholar] [CrossRef][Green Version]
- Liang, E.; Eckstein, D.; Shao, X. Seasonal cambial activity of relict chinese pine at the northern limit of its natural distribution in north China—Exploratory results. IAWA J. 2009, 30, 371–378. [Google Scholar] [CrossRef]
- Yang, B.; He, M.; Melvin, T.M.; Zhao, Y.; Briffa, K.R. Climate control on tree growth at the upper and lower treelines: A case study in the Qilian Mountains, Tibetan Plateau. PLoS ONE 2013, 8, e69065. [Google Scholar] [CrossRef]
- Deng, Y.; Gou, X.; Gao, L.; Zhao, Z.; Cao, Z.; Yang, M. Aridity changes in the eastern Qilian Mountains since AD 1856 reconstructed from tree-rings. Quat. Int. 2013, 283, 78–84. [Google Scholar] [CrossRef]
- Wang, Y.; Ma, Y.; Lu, R. Reconstruction of mean temperatures of January to August since AD 1895 based on tree-ring data in the eastern part of the Qilian Mountains. Quat. Sci. 2009, 29, 905–912. [Google Scholar]
- Holmes, R.L. Computer-assisted quality control in tree-ring dating and measurement. Tree-Ring Bull. 1983, 43, 69–75. [Google Scholar]
- Cook, E.R. A Time Series Approach to Tree-Ring Standardization. Ph.D. Thesis, The University of Arizona, Tucson, AZ, USA, 1985. [Google Scholar]
- Zhao, P.; Zhang, R.H.; Liu, J.P.; Zhou, X.J.; He, J.H. Onset of southwesterly wind over eastern China and associated atmos-pheric circulation and rainfall. Clim. Dyn. 2007, 28, 797–811. [Google Scholar] [CrossRef]
- Qi, Z.H.; Liu, H.Y.; Wu, X.C.; Hao, Q. Climate-driven speedup of alpine tree-line forest growth in the Tianshan Mountains, Northwestern China. Glob. Chang. Biol. 2015, 21, 816–826. [Google Scholar] [CrossRef] [PubMed]
- Fritts, H.C. Tree Rings and Climate; Academic Press: London, UK, 1976; 567p. [Google Scholar]
- Gou, X.; Chen, F.; Jacoby, G.; Cook, E.; Yang, M.; Peng, J.; Zhang, Y. Rapid tree growth with respect to the last 400 years in response to climate warming, northeastern Tibetan Plateau. Int. J. Climatol. 2007, 27, 1497–1503. [Google Scholar] [CrossRef]
- Zhu, H.F.; Zheng, Y.H.; Shao, X.M.; Liu, X.H.; Xu, Y.; Liang, E.Y. Millennial temperature reconstruction based on tree-ring widths of Qilian juniper from Wulan, Qinghai Province, China. Chin. Sci. Bull. 2008, 53, 3914–3920. [Google Scholar] [CrossRef]
- Duan, J.P.; Zhang, Q.B.; Lv, L.X.; Zhang, C. Regional-scale winter-spring temperature variability and chilling damage dynamics over the past two centuries in southeastern China. Clim. Dyn. 2012, 39, 919–928. [Google Scholar] [CrossRef]
- Bai, X.; Zhang, X.; Li, J.; Duan, X.; Jin, Y.; Chen, Z. Altitudinal disparity in growth of Dahurian larch (Larix gmelinii Rupr.) in response to recent climate change in northeast China. Sci. Total Environ. 2019, 670, 466–477. [Google Scholar] [CrossRef]
- Sun, J.; Liu, Y. Age-independent climate-growth response of Chinese pine (Pinus tabulaeformis Carrière) in North China. Trees 2014, 29, 397–406. [Google Scholar] [CrossRef]
- Sidor, C.G.; Popa, I.; Vlad, R.; Cherubini, P. Different tree-ring responses of Norway spruce to air temperature across an altitudinal gradient in the Eastern Carpathians (Romania). Trees 2015, 29, 985–997. [Google Scholar] [CrossRef]
- Gutiérrez, E.; Campelo, F.; Camarero, J.J.; Ribas, M.; Muntán, E.; Nabais, C.; Freitas, H. Climate controls act at different scales on the seasonal pattern of Quercus ilex L. stem radial increments in NE Spain. Trees-Struct. Funct. 2011, 25, 637–646. [Google Scholar] [CrossRef]
- Duchesne, L.; Houle, D. Modelling day-to-day stem diameter variation and annual growth of balsam fir (Abies balsamea (L.) Mill.) from daily climate. For. Ecol. Manag. 2011, 262, 863–872. [Google Scholar] [CrossRef]
- Chen, X.; Hu, B.; Yu, R. Spatial and temporal variation of phenological growing season and climate change impacts in temperate eastern China. Glob. Chang. Biol. 2005, 11, 1118–1130. [Google Scholar] [CrossRef]
- Baxter, S.; Weaver, S.; Gottschalck, J.; Xue, Y. Pentad Evolution of Wintertime Impacts of the Madden–Julian Oscillation over the Contiguous United States. J. Clim. 2014, 27, 7356–7367. [Google Scholar] [CrossRef]
- Tadross, M.A.; Hewitson, B.; Usman, M.T. The Interannual Variability of the Onset of the Maize Growing Season over South Africa and Zimbabwe. J. Clim. 2005, 18, 3356–3372. [Google Scholar] [CrossRef]
- Yin, X.G.; Wu, X.D. Modelling analysis of Huanshan pine growth response to climate. Q. J. Appl. Meteorol. 1995, 6, 257–264. [Google Scholar]
- Tian, Q.; He, Z.; Xiao, S.; Peng, X.; Ding, A.; Lin, P. Response of stem radial growth of Qinghai spruce (Picea crassifolia) to environmental factors in the Qilian Mountains of China. Dendrochronologia 2017, 44, 76–83. [Google Scholar] [CrossRef]
- Han, H.; He, H.; Wu, Z.; Yu, C. Non-Structural Carbohydrate Storage Strategy Explains the Spatial Distribution of Tree-line Species. Plants 2020, 9, 384. [Google Scholar] [CrossRef]
- Tognetti, R.; Cherubini, P.; Innes, J.L. Comparative stem-growth rates of Mediterranean trees under background and naturally enhanced ambient CO2 concentrations. New Phytol. 2000, 146, 59–74. [Google Scholar] [CrossRef]
- Gazol, A.; Camarero, J.J. Functional diversity enhances silver fir growth resilience to an extreme drought. J. Ecol. 2016, 104, 1063–1075. [Google Scholar] [CrossRef]
- Cai, L.; Li, J.; Bai, X.; Jin, Y.; Chen, Z. Variations in the growth response of Pinus tabulaeformis to a warming climate at the northern limits of its natural range. Trees 2020, 34, 1–13. [Google Scholar] [CrossRef]
- Wang, B.; Chen, T.; Xu, G.; Liu, X.; Wang, W.; Wu, G.; Zhang, Y. Alpine timberline population dynamics under climate change: A comparison between Qilian juniper and Qinghai spruce tree species in the middle Qilian Mountains of northeast Tibetan Plateau. Boreas 2016, 45, 411–422. [Google Scholar] [CrossRef]
- Liang, E.; Shao, X.; Eckstein, D.; Huang, L.; Liu, X. Topography-and species-dependent growth responses of Sabina przewalskii and Picea crassifolia to climate on the northeast Tibetan Plateau. For. Ecol. Manag. 2006, 236, 268–277. [Google Scholar] [CrossRef]
- Liang, E.; Shao, X.; Eckstein, D.; Liu, X. Speatial variability of tree growth along a latitudinal transect in the Qilian Mountains, northeastern Tibetan Plateau. Can. J. For. Res. 2010, 40, 200–211. [Google Scholar] [CrossRef]
- Sun, J.; Liu, Y. Tree ring based precipitation reconstruction in the south slope of the middle Qilian Mountains, northeastern Tibetan Plateau, over the last millennium. J. Geophys. Res. 2012, 117. [Google Scholar] [CrossRef]
- Gao, L.; Gou, X.; Deng, Y.; Yang, M.; Zhao, Z.; Cao, Z. Dendroclimatic response of Picea crassifolia along an altitudinal gradient in the eastern Qilian Mountains, Northwest China. Arct. Antarct. Alp. Res. 2013, 45, 491–499. [Google Scholar] [CrossRef]
- Lu, J.; Xu, J.; Wu, Y.; Li, X.; Evans, R.; Downes, G.M. Climatic signals in wood property variables of Picea crassifolia. Wood Fiber Sci. J. Soc. Wood Sci. Technol. 2015, 47, 131–140. [Google Scholar]
- Li, J.; Cook, E.; Chen, F.; Gou, X.; D’Arrigo, R.; Yuan, Y. An extreme drought event in the central Tien Shan area in the year 1945. J. Arid. Environ. 2010, 74, 1225–1231. [Google Scholar] [CrossRef]
- Zhang, R.; Yuan, Y.; Gou, X.; Zhang, T.; Zou, C.; Ji, C.; Fan, Z.; Qin, L.; Shang, H.; Li, X. Intra-annual radial growth of Schrenk spruce (Picea schrenkiana Fisch. et Mey) and its response to climate on the northern slopes of the Tianshan Mountains. Dendrochronologia 2016, 40, 36–42. [Google Scholar] [CrossRef]
- Huang, S.Y.; Zhang, M.J.; Wang, S.J.; Li, Y.J.; Pan, S.K. Spatial and temporal variability of summer 0 °C layer height and temperature in northwest China over the past 50 years. J. Geogr. 2011, 66, 1191–1199. [Google Scholar]
- Wang, M.; Tao, D.L. Study on drought tolerance of main tree species in Changbai Mountain. J. Appl. Ecol. 1998, 9, 7–10. [Google Scholar]


Publisher’s Note: MDPI stays neutral with regard to jurisdictional claims in published maps and institutional affiliations. |
© 2022 by the authors. Licensee MDPI, Basel, Switzerland. This article is an open access article distributed under the terms and conditions of the Creative Commons Attribution (CC BY) license (https://creativecommons.org/licenses/by/4.0/).