Article

Climate Change in the Provenance Regions of Romania over the Last 70 Years: Implications for Forest Management

by
Georgeta Mihai
1,
Alin-Madalin Alexandru
1,2,
Ion-Andrei Nita
3,* and
Marius-Victor Birsan
3,4
1
Department of Forest Genetics and Tree Breeding, “Marin Dracea” National Institute for Research and Development in Forestry, 077190 Bucharest, Romania
2
Faculty of Silviculture and Forest Engineering, Transilvania University of Brasov, 500036 Brasov, Romania
3
VisualFlow, 020099 Bucharest, Romania
4
Department of Research and Meteo Infrastructure Projects, Meteo Romania (National Meteorological Administration), 013686 Bucharest, Romania
*
Author to whom correspondence should be addressed.
Forests 2022, 13(8), 1203; https://doi.org/10.3390/f13081203
Submission received: 30 June 2022 / Revised: 22 July 2022 / Accepted: 28 July 2022 / Published: 31 July 2022
(This article belongs to the Special Issue Impact of Climate Warming and Disturbances on Forest Ecosystems)

Abstract

:
The recent climate change scenarios show significant increases in temperature and extreme drought events in Southern and Eastern Europe by the end of the 21st century, which will have a serious impact on forest growth and adaptation, and important consequences for forest management. The system of provenance regions, according to the OECD Scheme and EU Directive, was thought to encourage the use of the local seed sources, under the concept ‘local is the best’. However, climate is changing faster than some species or populations can adapt or migrate, which raises some uncertainties with respect to the future performance of local populations. In Romania, as in other countries, the delimitation of provenance regions is based on geographical, ecological and vegetation criteria. The aim of this study is to evaluate: (1) the climate change that has occurred at the level of the provenance regions; (2) which regions will be most vulnerable to climate change; (3) which forest types will be the most vulnerable in a certain region; and (4) changes in the climatic envelope of forest species. Several climatic parameters and an ecoclimatic indices have been calculated and analyzed at the level of provenance regions, subregions and ecological sectors (forest types) in Romania, during the period 1951–2020. The results highlight a general shift towards warmer and drier conditions in the last 30 years, the mean annual temperature increasing with 0.3–1.1 °C across the provenance subregions. The De Martonne aridity index for the vegetation season shows that 86% of the ecological sectors fell into the arid and semiarid categories, which indicates a very high degree of vulnerability for forest species. On the Lang rainfall index, forest steppe climatic conditions occurred in all pure or mixed pedunculate oak forests, thermophile oak species, meadow forests, poplar and willow, Turkey oak and Hungarian oak forests. The Ellenberg coefficient highlights that the warming process is more evident along the altitude and the degree of vulnerability increase at lower altitude or at the edge of species distribution. The climate envelopes of many forest species have already shifted to another ecosystem’s climate. This paper presents the importance of re-delineation the provenance regions for the production and deployment of forest reproductive materials according to the climate change occurred in the last decades, as a fundamental tool for an adaptive forest management.

1. Introduction

In the last few decades, the choice, use and transfer of forest reproductive material, in the context of climate change, have been hot topics discussed by several international organizations. The Ministerial Conference on the Protection of Forests in Europe (held in Strasbourg 1990, Helsinki 1993, Lisbon 1998, Vienna 2003, Warsaw 2007, etc.), in its resolutions, has called for the member states to initiate activities to monitor climate change, assess its impact on forests and establish strategies at the national and regional levels to reduce its effects and increase forest adaptation. The international regulations on forest reproductive material (EU directive 1999/105/EC and the Organization for Economic Co-operation and Development [OECD] Seed and Seedling Scheme) also require member states to develop a national certification system and transfer guidelines for forest reproductive materials.
In this context, the delimitation of provenance regions is the basic step towards the selection, usage and transfer of forest reproductive material and the conservation and improvement of forest genetic resources. According to the definition of the 2021 OECD Scheme and the 1999 EU Directive, the region of provenance for a tree species or subspecies is an area or group of areas with sufficiently uniform ecological conditions in which the stands or seed sources have similar phenotypic or genetic characteristics. The delimitation of provenance regions is mandatory for each EU member state, which must establish them for the main forest species.
The delimitation of regions of provenance is based on the existence of intraspecific genetic diversity and using local seed sources in reforestation, which are optimally adapted to those environmental conditions. Through the delimitation of provenance regions one seeks to maximize tree growth and minimize the risk of maladaptation [1,2], because within a provenance region the forest reproductive material can be moved with little risk of maladaptation due to low environmental variation. From this perspective, the delineation of provenance regions has great importance in reforestation and restoration programs. Furthermore, using forest reproductive material that performs well and is well-adapted represents a fundamental step in forest management.
Generally, the regions of provenance of forest species are delimited on the basis of environmental homogeneity and the criteria used are mainly geographical and ecological [3,4,5,6]. In recent years, new approaches regarding the delimitation of provenance regions have appeared that use climate variables instead of geographical ones [7,8,9,10,11]. This is because it is considered that climate is the main driving factor behind the adaptation of several processes in forest species [12], especially at altitudinal and latitudinal treelines [13].
In recent decades, various studies have highlighted global climate change, which is certain to affect forest ecosystems [14,15,16]. There have already been changes to local seasonal conditions experienced throughout the range of forest species, and although it is believed that not all species will be affected by climate change, rising temperatures, extended periods of drought and changes in winter precipitation patterns, together with the biotic stressors, will pose significant threats to forest species [17,18]. The effects of climate change are generally expected to reduce forest growth and survival and to change forest structure and composition at the landscape scale.
Forest species will survive under new climates through migration to suitable habitats, or persist in situ by changes in their genetic composition or adjusting to environmental changes using phenotypic plasticity [19,20]. Chen used a meta-analysis and estimated that the distributions of species have recently shifted to higher elevations at a median rate of 11.0 m per decade, and to higher latitudes at a median rate of 16.9 km per decade [21]. Genetic adaptation to climate change involves changes in allele frequencies that occur over several trees’ generations [22]. Furthermore, many forests are so fragmented that natural migration will be limited [23]. Therefore, climate is changing faster than some species or populations can adapt or migrate, which will have negative consequences for forest management and conservation [24].
This mismatch between climate change and tree adaptation raises some uncertainties with respect to the future performance of local populations, and whether the axiom ‘local population is the best’ will still be valid under new environmental conditions. Adapting to climate change involves monitoring and anticipating change, undertaking actions to avoid negative consequences, and allowing adaptation to occur [25]. Therefore, an adaptive forest management involves an understanding of the effects of climate on forests, predictions of how these effects might change over time, and the incorporation of this knowledge into management decisions [26]. In this context, a reliable procedure to the delimitation of provenance regions for selection and use of forest reproductive material are fundamental for forests to be able to adapt and achieve resilience to new climatic conditions [27,28,29].
In Romania, the delimitation of provenance regions has been approved by Minister’s order No. 1028/2010 [30] and is based on geographical, ecological and vegetation criteria. The climatic variables that characterize and underlie the current provenance regions were determined 70 years ago [31]. However, a number of studies have since highlighted that the climate has changed in Romania over the last few decades, and that Southern Europe will be considerably more vulnerable than Northern Europe, especially in terms of ecosystem services [32,33,34,35].
Recent climatic changes in Romania show increasing temperature extremes [36,37,38], declining snow pack [39,40] and wind speed [41,42] and an increase in rain shower frequency [43,44], due to changes in large-scale atmospheric circulation [45,46,47]. These changes were proven to affect drought [48,49], water resources [50], human health [51,52] and terrestrial ecosystems [53,54] in various ways.
The aim of this study was to evaluate: (1) the climate change that has occurred over the last 70 years at the level of the provenance region for the main tree species in Romania; (2) which regions will be most vulnerable to climate change; (3) which forest types will be the most vulnerable in a certain region; (4) changes in the geographic distribution of climatic optimum (climatic envelope) of forest species. The findings of this study will be of great importance to forest management, in terms of providing an evaluating of the effects of climate change on forest ecosystems and developing efficient adaptation and mitigation strategies.

2. Materials and Methods

Romania is located in the south-eastern Europe and is characterized by a diverse relief (Figure S1). Of the entire surface of the country, 31% is occupied by mountains (with altitudes between 800 and 2543 m), 36% by hills and plateaus, and 33% by plains (below 200 m altitude). The relief is focused on the arc of the Carpathian Mountains. In the center of the territory is the Transylvanian Plateau, surrounded by the mountain ranges of the Carpathians. The intermediate relief step between the mountains and the plains is the hills and plateaus, located inside and outside the Carpathian arc. Romania’s climate is continental-temperate, with oceanic influences in the west, Mediterranean influences in the south-west and continental-excessive influences in the north-east.
The system of provenance regions in Romania divides the land into 11 broad geographical regions, which are further subdivided into 26 subregions and 155 ecological sectors (Figure 1). The ecological sectors are the basic units of the provenance regions because has the most pronounced climatic homogeneity and actually represent the main forest types. The system of delimitation of the provenance regions has been applied uniformly to all species and was based on the Romanian vegetation map [55]. This approach was justified by the huge environmental variability existing in Romania, the climatic variability being reflected in the forest composition and distribution [31]. Therefore, we conducted analyses on different spatial scales—regional, subregional and local (forest types within a subregion).
For the analysis of the temporal and spatial variability of the climate in Romania over the last seven decades, we calculated four climatic parameters: (1) mean annual air temperature (MAT); (2) mean temperature during the vegetation season (April–September) (MTvs); (3) annual amount of precipitation (AAP); and (4) amount of precipitation during the vegetation season (April–September) (APVS). The climate variables were estimated using the ROCADA database [56], at a spatial resolution of 0.1 × 0.1°. ROCADA is a daily gridded observational dataset for precipitation, temperature, soil surface temperature, etc. in Romania, based on station information. The dataset used has a high spatial resolution (1 × 1 km) and was built using improved spatial interpolation techniques to better assess the spatial variability of climatic parameters. The period analyzed was 1951–2020, with the decade 1951–1960 considered as a reference because the current provenance regions are based on the climatic data from this decade. In addition, the climatological norm was calculated according to criteria recommended by the World Meteorological Organization (WMO), based on averages of the meteorological parameters, for the period 1991–2020.
In order to highlight the recent climatic changes and vulnerability of forest types, three ecoclimatic index were also calculated, including the De Martonne aridity index (DMAI), the Lang rainfall index (LRI) and the Ellenberg coefficient (EC).
The DMAI shows the degree of aridity in a certain area, and classifies the types of climates in relation to the availability of water. It is calculated based on air temperature and precipitation. Thus, the formula for the DMAI is: DMAI = P/(T + 10), where P is the AAP (mm) and T is the average annual air temperature (°C). The DMAI was calculated for the whole year and for the vegetation season (DMAIVS). The classification of the DMAI is given in Table 1 [57].
The LRI—also known as the pluviothermal index—indicates the degree of atmospheric humidity and its variation (Table 2). This was calculated for the whole year: LRI = P/T, where P is the annual amount of precipitation (mm) and T is the average annual air temperature (°C) [58].
The EC [59] indicates the degree of compatibility of a forest species with a given climate. The formula is: EC = Tmax/P × 1000, where Tmax is the temperature of the warmest month of the year and P is the annual amount of precipitation.
The ecoclimatic indices (DMAI, LRI and EC) were calculated for two periods, 2011–2020 and 1991–2020 annually, and for the vegetation season (DMAI). The monthly values of the climatic parameters from 1991 to 2020 were used as the basic data.
The variation in climatic parameters was analyzed at the level of (1) subregions, as the more homogeneous regional unit, in terms of climatic influence; and (2) ecological sectors (i.e., forest types), as the elementary units of provenance regions, which are homogeneous both ecologically and in terms of forest composition. In total, the climatic parameters were calculated for 26 subregions (Table 3) and 25 ecological sectors (forest types within subregions), as indicators of the differentiation and separation of provenance regions (Table 4). Of the total number of ecological sectors, 10 represent forest types growing in extreme vegetation conditions (located in extreme site conditions such as climate and soil), corresponding to the basic material included in the category ‘Identified source’, and 15 forest types under normal vegetation conditions, corresponding to the category ‘Selected source’ [30].
The MAT and AAP for the period 1991–2020 (climatological norm) were used to develop the climate envelope for eight species: Norway spruce, silver fir, European beech, sessile oak, pedunculate oak, Hungarian oak, pubescent oak and Quercus pedunculiflora. They are the main tree species of mountain, hilly and plain forest ecosystems in Romania. The climate envelope was generated based on the ecological requirements of each species [60], considering that the climatic factors are among the most important factors in the context of climate change. Shifts in species climate envelope were used to evaluate the impact of climate change on species distribution. Vulnerability was discussed as the degree to which an ecosystem is susceptible to, or unable to adapt to, adverse effects of climate change [61].

3. Results

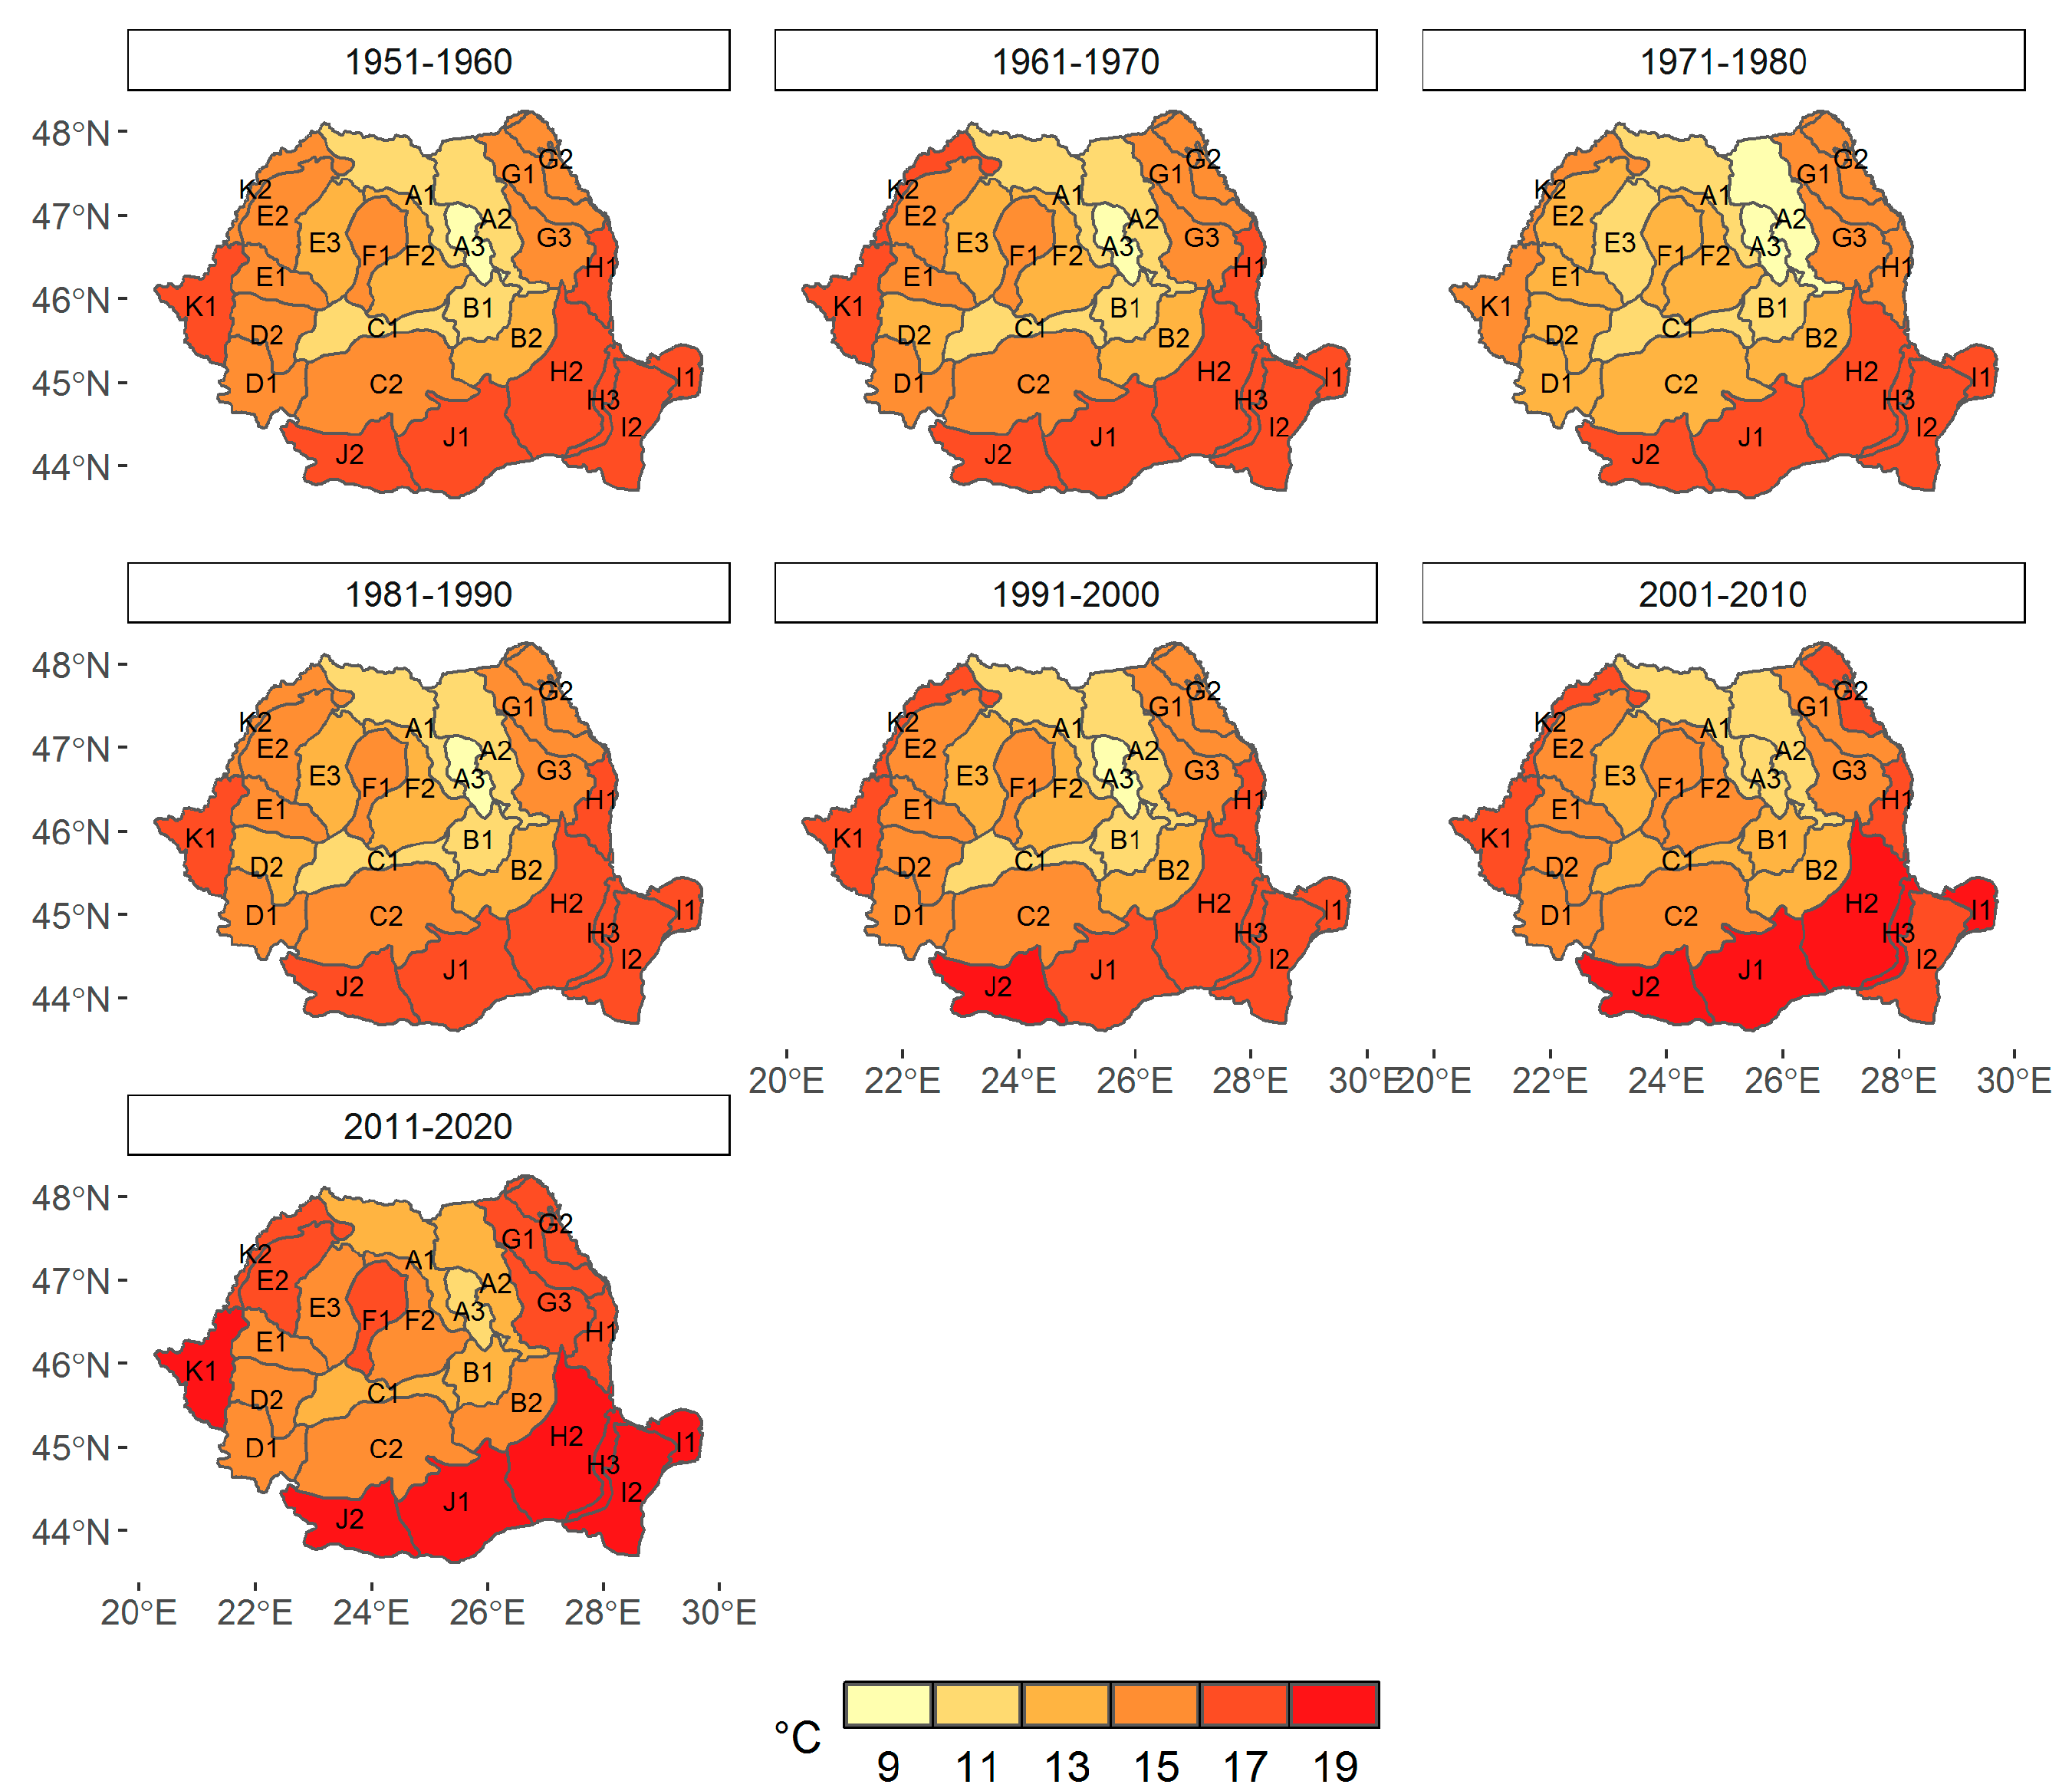
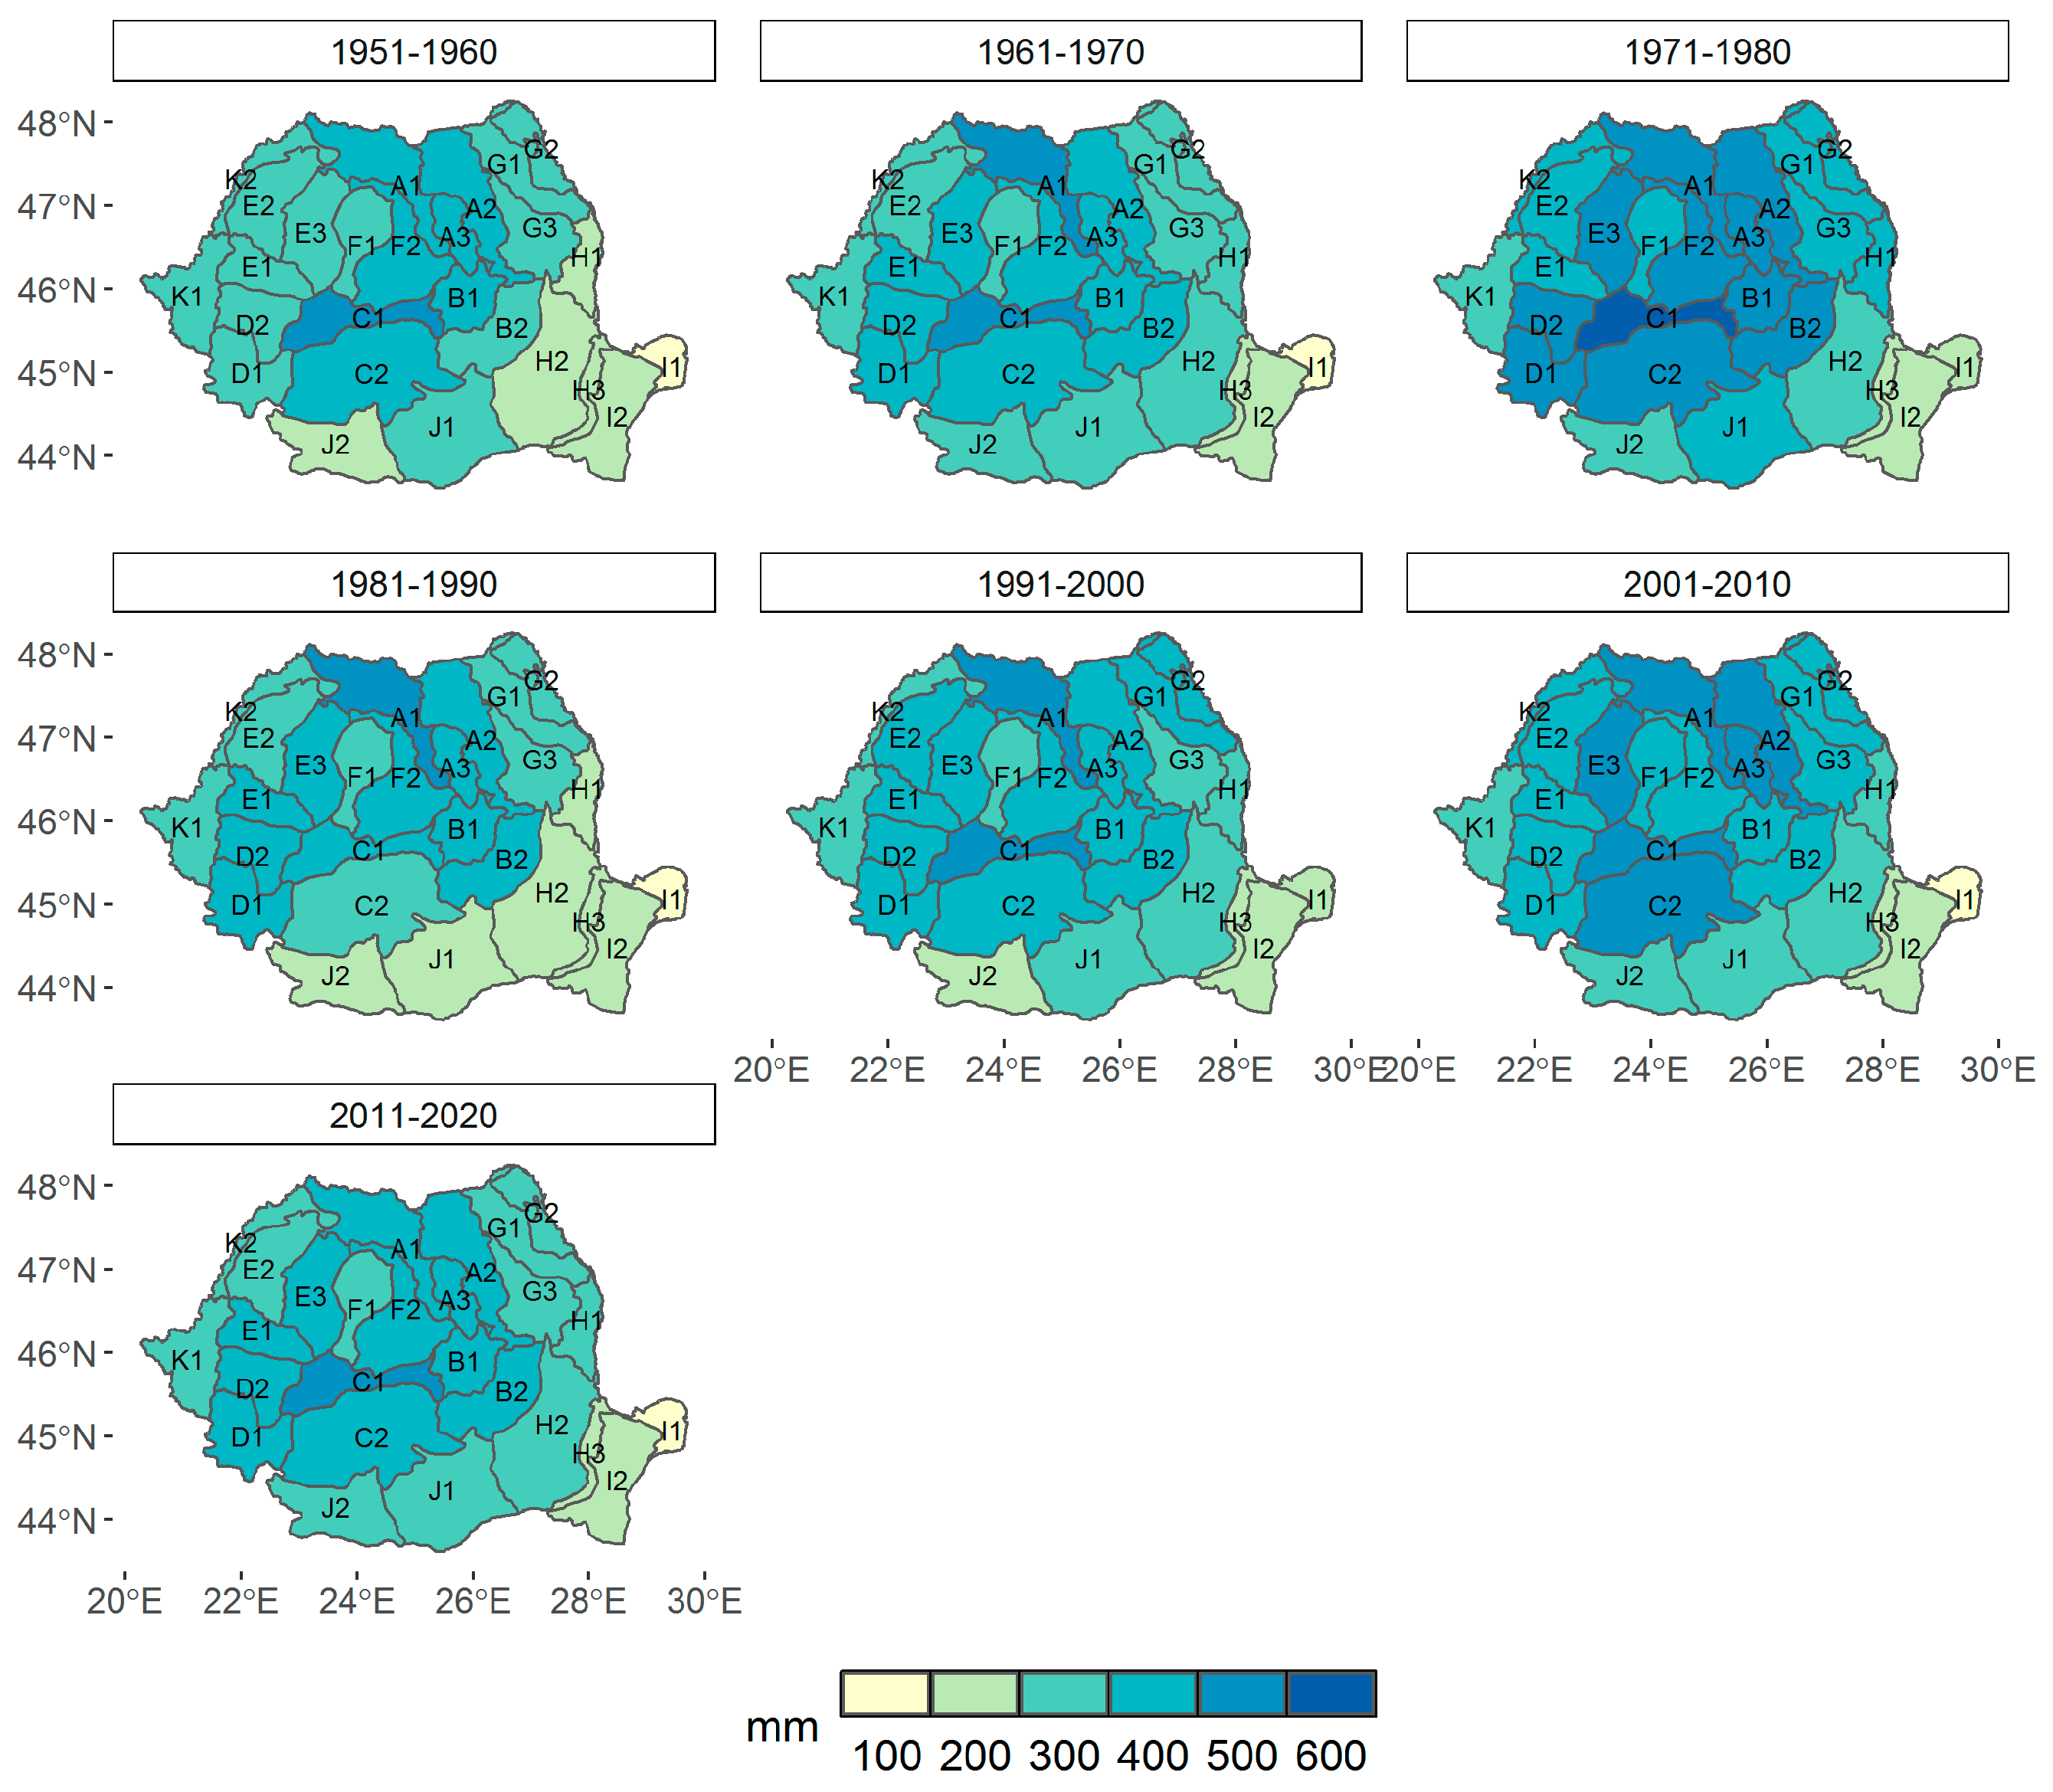
3.1. Climate Change at the Provenance Subregion Level

At the level of the provenance subregions, the MAT has increased over the last 70 years, from a multiannual average of 8.70 °C in 1951–1960 to 9.37 °C in 1991–2020. In the last decade (2011–2020), however, the temperature rise has been more pronounced, averaging 1.33 °C higher than in 1951–1960.
In addition, during the analyzed period, the increase in MAT has varied greatly at the region and subregion levels. The MATs on the decades for each provenance subregion are presented in Figure 2. In the last decade, the MAT has varied between 5.13 °C in the A3 subregion to 12.45 °C in the I1 and H3 subregions. MATs greater than 12 °C have been recorded in the last decade in the H2, H3, I2, I1, J1, J2 and K1 subregions.
A comparative analysis of the MAT for 1991–2020, as the climatological norm, with the MAT for 1951–1960, as the reference decade, shows an increase by an average of 0.67 °C over the last 30 years throughout the country. At the subregion level, the increase in MAT varied from 0.33 °C, as registered in the B2 subregion, to 1.11 °C, as recorded in the G2 subregion (Figure 3). The lowest increases in MAT over the last 30 years, compared to the reference decade, were registered in the B1, B2, D2 and A3 subregions. The highest increases in temperature were recorded in the G1, G2, G3 subregions, followed by I2, I1, E3, A1, A2, H1, H3, H2, F1 and J1. If we compare the last decade (2011–2020) with the reference decade (1951–1960), the differences in MAT were much higher, varying between 0.95 °C in B2 and 1.79 °C in G2.
In terms of AAP, there was an average increase of 47 mm in the period 1991–2020 compared to 1951–1960 at the provenance subregion level (Figure 4). The differences in the AAP between the analyzed decades varied between −44 mm and +146 mm (Figure 5). The subregions where there was a deficit of precipitation over the last 30 years were I1, C1, K1, K2, B1 and F2. An excess of AAP was registered in the rest of the subregions, with the highest values recorded in E3, A2 and D1. Comparing the last decade (2011–2020) with the reference decade (1951–1960), the differences in AAP varied between −57 mm in K2 and 118 mm in E3.
Analyzing the MTVS at the provenance subregion level, the variation was very similar to that of the MAT (Figure 6). The differences in MTVS between 1991–2020 and 1951–1960 varied between 0.27 °C (in B2) and 0.97 °C (in G2). The subregions most affected by rising MTVS over the last 30 years were G2, G1, G3, F1, F2, I2, K1, E3 and D1 (Figure 3). If we compare the last decade (2011–2020) with the reference decade (1951–1960), the differences in MTVS varied between 0.93 °C in B2 and 1.78 °C in G2. MTSV values close to 20 °C were recorded in the last decade in the H2, H3, I2, I1, J1, J2 and K1 subregions.
In terms of the APVS, in addition to the subregions presented above, a slight excess in humidity was registered in the last few decades in B1 and K1 (Figure 5 and Figure 7).

3.2. Climate Change at the Forest-Type Level under Normal Ecological Conditions

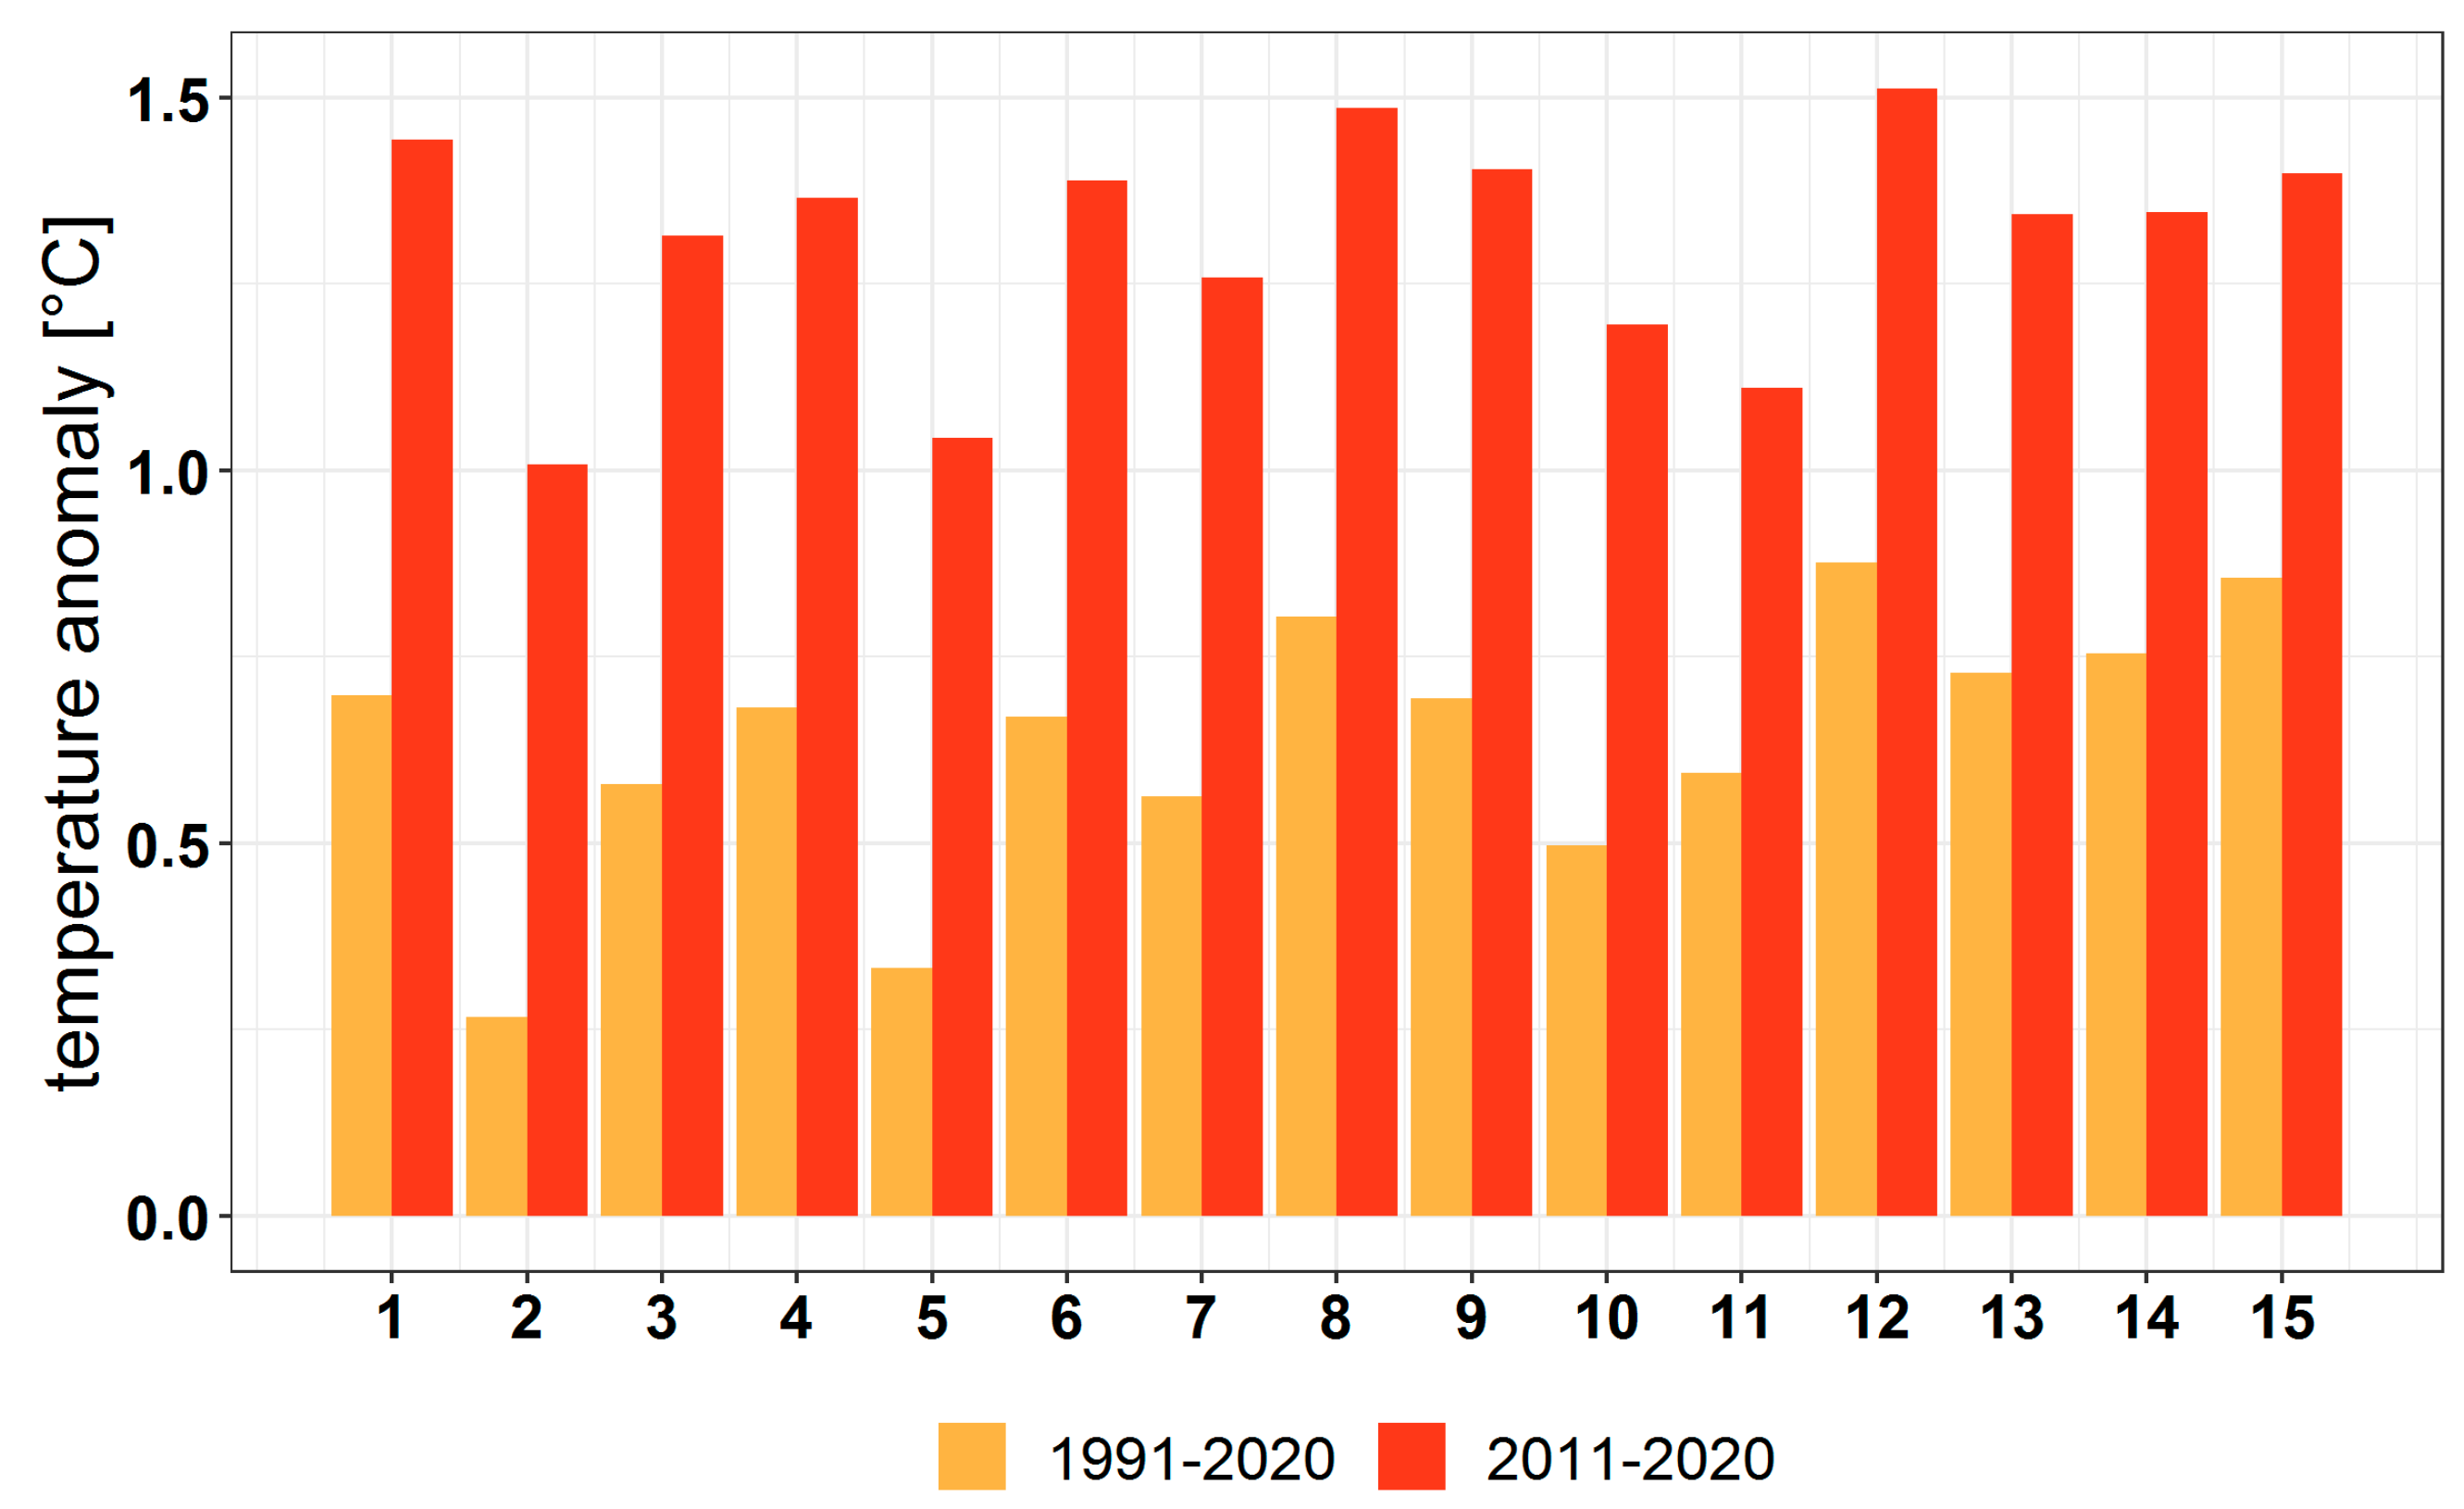
3.2.1. Variation in the Main Climatic Parameters at the Forest-Type Level for 1951–2020

At the forest-type level, as an average throughout the country, the MAT has increased over the last 70 years from a multiannual average of 7.34 °C in 1951–1960 to 8.65 °C in 2011–2020, and to 7.98 °C in 1991–2020.
The increase in MAT has varied greatly over the analyzed period at the forest-type level (Figure 8). Thus, in the last decade, the MAT has varied between 3.02 °C in the 1—Swiss pine and mixed with Norway spruce forests to 12.57 °C in 15—poplar and willow forests. MATs greater than or close to 12 °C have also been recorded in 13—Turkey oak and Hungarian oak forests and 14—meadow forests over the last decade.
Analyzing the differences in MATs between 1991–2020 as the climatological norm and 1951–1960 as the reference decade, it can be seen that there has been an increase by an average of 0.64 °C over the last 30 years across the forest ecosystems. The highest temperature increases were recorded in 12—thermophile oak forests (0.88 °C), 15—poplar and willow forests (0.86 °C) and 9—pedunculate oak forests (0.80 °C) (Figure 9). The lowest MAT increases over the last 30 years, compared to the reference decade, were registered in 5—mixed beech and coniferous species (0.33 °C) and 10—pedunculate oaks in depressions (0.50 °C). If we compare the last decade (2011–2020) with the reference decade (1951–1960), the differences in the MAT were much higher, varying between 1.51 °C in 12—thermophile oak forests and 1.49 °C in 8—pure sessile oak to 1.01 °C in 2—larch and mixed larch and Norway spruce forests.
In terms of AAP, the increase was, on average, 40 mm in 1991–2020 compared to 1951–1960 at the forest-type level (Figure 10). The differences in AAP between the analyzed periods varied between −40 mm (10—pedunculate oak forests in depressions) to 83 mm (3—Norway spruce forests) (Figure 11). The forest types in which the AAP was very low over the last 30 years were 15—poplar and willow forests, 14—meadow forests, 13—Turkey oak and Hungarian oak forests and 12—thermophile oak species. Comparing the last decade (2011–2020) with the reference decade (1951–1960), the differences in AAP varied between −64 mm in 10—pedunculate oak forests in depressions to 105 mm in 2—larch and mixed larch with Norway spruce forests. In addition to the types of forest already mentioned, affected by the reduction of rainfall in the last decade are also 10—pedunculate oak forests in depressions and 9—pure pedunculate oak and mixed with other oaks.
In analyzing the MTVS, we found an increase of 0.71 °C, on average, for the period 1991–2020, and 1.38 °C for 2011–2020, compared to the reference decade. The amplitude of variation was from 0.16 °C (in 2—larch and mixed larch and Norway spruce forests) to 0.93 °C (in 8—sessile oak forests), and from 0.90 °C (in 2—larch and mixed larch and Norway spruce forests) to 1.61 °C (in 8—sessile oak forests) (Figure 12 and Figure 13). The forest types most affected by the increase in the MTVS in the last 30 years were 8—sessile oak, 15—poplar and willow, 12—thermophile oak, 13—Turkey oak and Hungarian oak, and 14—meadow forests. In the last decade, 9—pedunculate oak, 6—mountain beech, and 1—Swiss pine and mixed Swiss pine with Norway spruce forests can be added to that list.
Regarding the APVS, there was an average increase of 33 mm in 1991–2020 compared to 1951–1960 at the forest-type level. The differences in the APVS between the analyzed periods varied between −33 mm (10—pedunculate oak forests in depressions) to +72 mm (2—larch and mixed larch with Norway spruce forests) (Figure 14 and Figure 15). The forest types in which the AAP was very low over the last 30 years were 1—Swiss pine and mixed Swiss pine with Norway spruce, 9—pedunculate oak, 11—pedunculate oak on piedmont, and 15—poplar and willow forests. In comparing the last decade (2011–2020) with the reference decade (1951–1960), the differences in APVS have varied between −48 mm in 10—pedunculate oak forests in depressions to +95 mm in 2—larch and mixed larch with Norway spruce forests.
Analyzing the forest types in each provenance subregion resulted in 117 ecological sectors. Comparing the MAT over the last three decades (1991–2020) with that of the reference decade, it can be seen that there was a temperature increase that varied between −1.22 °C (in D120) to +1.58 °C (in B110). The highest temperature increases were recorded in: 3—Norway spruce forests from B1, A1 and A2; 5—mixed forests from A1, B2 and E3; 9—pedunculate oak (pure and mixed) forests in F2, G1, G3, E1, E2, E3, B1; 13—Turkey oak and Hungarian oak forests in E3 and E2; 14—meadow forests in G2; 12—thermophile oak forests in G2; and 7—hilly beech forests in A2 and G3.
Comparing the last decade with 1951–1960, the differences in MAT varied between −0.49 °C (in D120) and 2.32 °C (in A120). The highest temperature increases were recorded in: 5—mixed forests in A1, B2 and E2; 9—pedunculate oak (pure and mixed) forests in F2, G1, G3, E1, E2, E3 and B1; 3—Norway spruce forests in B1, A1, A2 and E2; 13—Turkey oak and Hungarian oak forests in E3 and E2; 14—meadow forests in G2; 12—thermophile oak forests in G2; and 7—hilly and mountain beech forests in A1, A2, E3, E2 and G3.
Of all the forest sectors, 86% experienced a temperature increase of >1.0 °C, while in 44% there was an increase of >1.5 °C.
In terms of the AAP, the differences in precipitation between 1991–2020 and 2011–2020 compared to the reference decade varied from −73 mm (in I190) to 252 mm (in E310), and from −114 mm (in C16B) to 279 mm (in E210), respectively. The forest types in which there was a deficit of precipitation over the last three decades were the: 14—meadow forests in K1, J1 and I1; 10—pedunculate oak forests in depressions in B1 and C1; 7—hilly beech forests in F2, B1 and C1; 1—Swiss pine and Norway spruce at altitude in C2; 15—poplar and willow forests in J2 and I1; 6—mountain beech forests in C1; 13—Turkey oak and Hungarian oak forests in J2, C1 and K2; and 9—pedunculate oak forests in F2, E3 and F1.
In analyzing the MTVS, the amplitude of variation was from −1.47 °C (in B210) to +1.81 °C (in B220), when compared to the last 30 years and the reference decade, and from −0.71 °C (in B210) to +2.50 °C (in B220) when compared to the last decade and the reference decade. The forest types most affected by the increase in temperature during the growing season were similar to those identified in the case of MAT.
Regarding APVS, the amplitude of variation was from −64 mm to +144 mm when comparing the last 30 years with the reference decade, and from −94 mm to +157 mm when comparing the last decade with the reference decade. The forest types in which there has been a deficit in precipitation over the last three decades are similar to those identified in the case of AAP.

3.2.2. Ecoclimatic Index Calculated for Forest Types under Normal Ecological Conditions

The values of the ecoclimatic indices (DMAI, LRI and EC) by forest types and ecological sectors are presented in Table S1.
The DMAI shows the degree of aridity of the ecological sector, thus highlighting the degree of vulnerability of the forest types to climate change. The DMAI values calculated for 1991–2020 varied between 110 in 1—Swiss pine and mixed with Norway spruce from C21E ecological sector, with values of 14 in 14—meadow forests from I190 and 16 in 15—poplar and willow forests from I19A ecological sector. Corresponding to this aridity index, a very high vulnerability was identified for: 15—poplar and willow forests, 14—meadow forests and 12—thermophile oaks in all subregions of provenance; 9—pure or mixed oaks, other than those in E260 and F260; 8—sessile oak forests from G350, H150 and I250; and 13—Turkey oak and Hungarian oak forests from C170, E270, H180, H280, I270, I280, J170, J180, J270, J280 and K270. The hilly beech forests in the G340 and A240 subregions were also identified as vulnerable.
In analyzing the DMAI values for the last decade, it was found that the degree of vulnerability at the ecological-sector level was high and the trend is increasing. Calculating this index for the vegetation season (DMAIVS), it is found that, out of the total number of 117 ecological sectors presented in Table S1, 11 fell into the arid category, 90 fell into the semiarid category and 7 fell into the moderately arid category, which indicates a very high degree of vulnerability. Corresponding to the classification of the DMAI, values between 5 to 10 (arid) indicate desert climatic conditions, 11 to 30 (semiarid and moderate-arid) indicate the presence of steppe climatic conditions, while values between 31 to 35 (semihumid) indicate forest steppe.
The LRI also highlights significant climate changes and the tendency for some sectors to dry up. Thus, steppe climatic conditions occurred in last decade in 15—poplar and willow forests from I1 and H3, in 14—meadow forests from I1, in 13—Turkey oak and Hungarian oak forests from I2 and in 8—sessile oak forests from I2. Forest steppe climatic conditions occurred in all pure or mixed pedunculate oaks forests (9), thermophile oak species (12), meadow forests (14), poplar and willow (15), and Turkey oak and Hungarian oak forests (13) except those in C2. The degree of vulnerability increased in the case of forest types located along the low altitudinal limit of the distribution area, such as 7—hilly beech forests in G3, 8—sessile oak forests in I2, H1, E2, G1 and G3, 9—pure or mixed pedunculate oak forests in E3.
The EC indicates the level of compatibility between the distribution of forest types and the current zonal climate. The EC values for 1991–2020 clearly show the process of global warming and indicate which species are suitable for the current climate. It can be seen that this warming process is more accentuated at the altitudinal limits (both upper and lower) of the species distributions, especially in the following forest types: 1—Swiss pine and mixed with Norway spruce, 2—larch and mixed with Norway spruce, 3—Norway spruce, 4—Norway spruce in mountain depression, 5—mixed beech with coniferous species, 14—meadow forests, 15—poplar and willow. In addition, the process of aridity occurred in 7—hilly beech forests in F2 and G3 ecological sectors, 8—sessile oak forests in H1 and I2 ecological sectors and 9—pedunculate oak forests in E3 and G1 ecological sectors.

3.3. Climate Change at the Forest-Type Level under Extreme Ecological Conditions

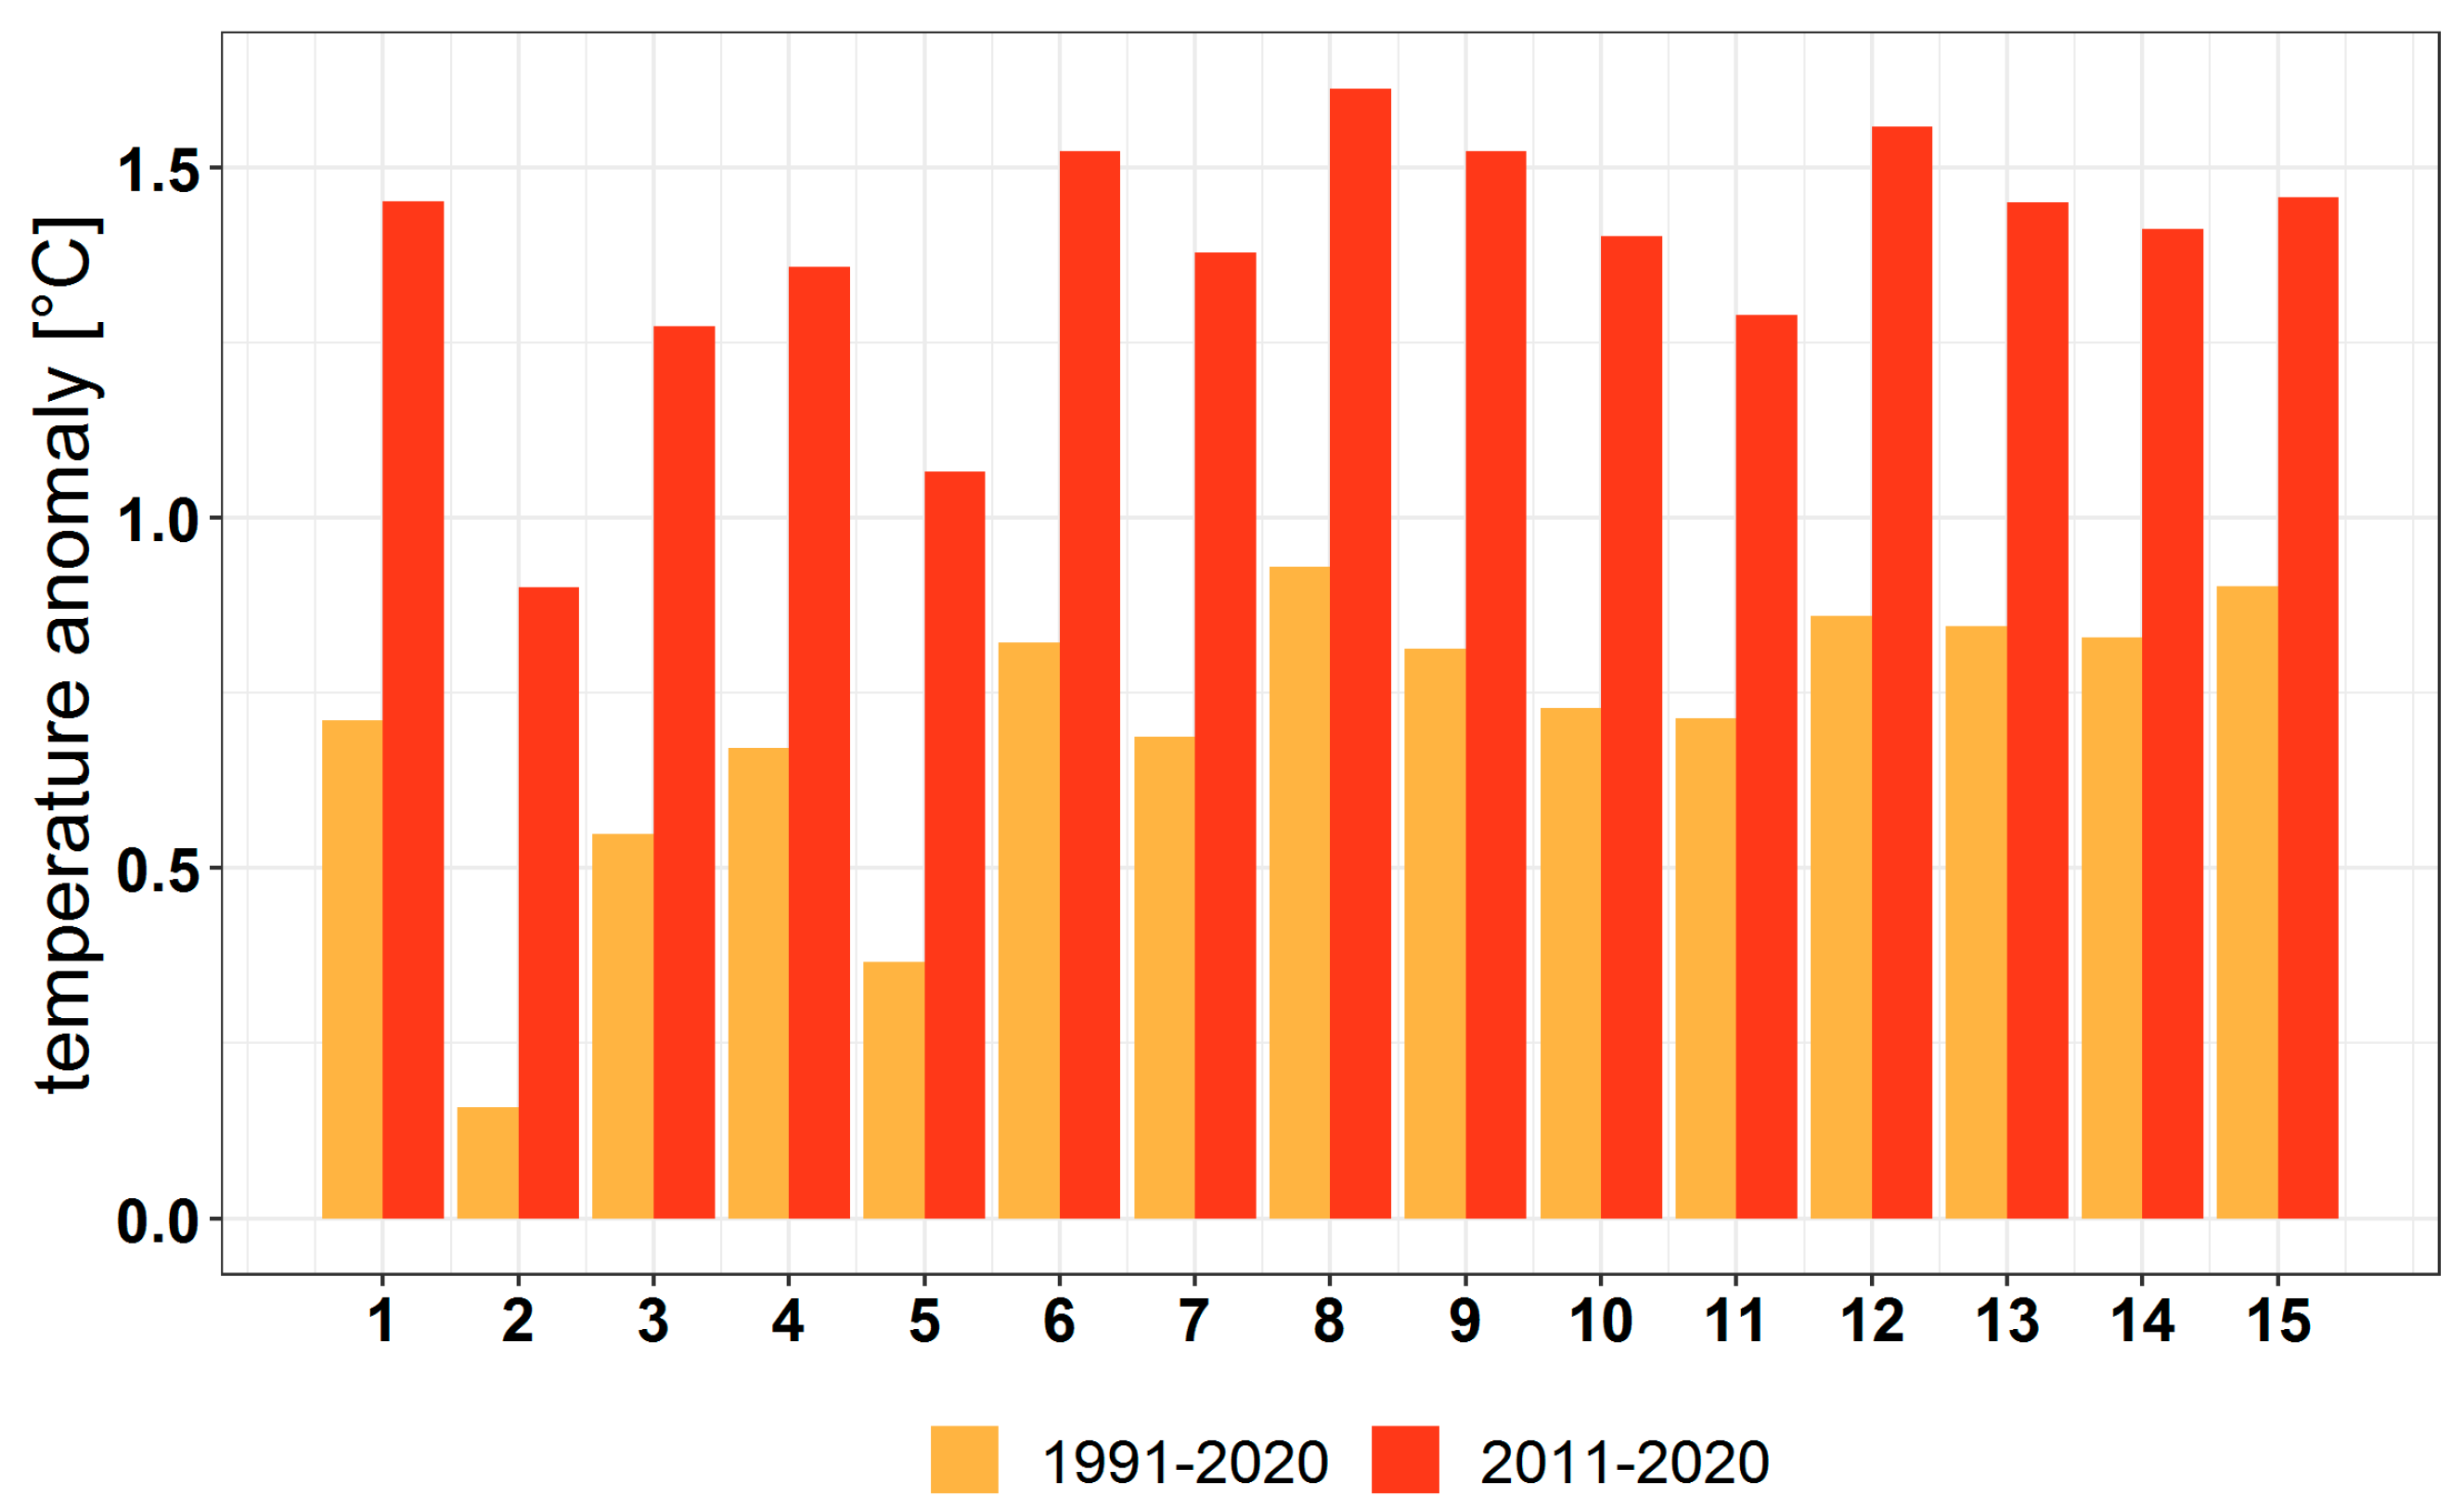
3.3.1. Variation in the Main Climatic Parameters at the Forest-Type Level for 1951–2020

At the forest-type level under extreme vegetation conditions, the MAT has increased over the last 70 years from a multiannual average of 7.98 °C in 1951–1960 to 9.40 °C in 2011–2020, and 8.73 °C in 1991–2020. In the last decade, the increase in the MAT has varied between 3.97 °C in Norway spruce forests at the upper altitudinal limit and 12.29 °C in Quercus pedunculiflora forests on sand. MAT values >12 °C have been recorded in 10E—steppe island forests, in the last decade.
In analyzing the differences in MAT between 1991–2020, as the climatological norm, and 1951–1960, as the reference decade, an average increase of 0.75 °C can be seen over the last 30 years at these forest types. The highest temperature increases were recorded in 10E—steppe island forests and 2E—Norway spruce on marshland. The lowest increases over the last 30 years, compared to the reference decade, were recorded in 9E—Turkey oak and Hungarian oak forests on pseudo-gleyic soils (0.60 °C), and in 6E—pedunculate oak on marshland (0.62 °C). If we compare the last decade (2011–2020) with the reference decade (1951–1960), the differences in MAT were much greater, ranging between 1.68 °C in 2E—Norway spruces forests on marshland and 1.18 °C in 9E—Turkey oak and Hungarian oak forests on pseudo-gleyic soils.
Regarding the AAP, the increase was, on average, 45 mm in 1991–2020 compared to 1951–1960 at the level of forest types. The differences in AAP between the analyzed periods varied between −37 mm (7E—thermophile pedunculate oak on sand) up to 104 mm (3E—beech at the upper altitudinal limit). The forest types in which the amount of precipitation has been very low over the last 30 years were: 10E—steppe island forests, 8E—Quercus pedunculiflora on sand and 5E—thermophile sessile oak and mixed with other deciduous species. Comparing the last decade (2011–2020) with the reference decade (1951–1960), the differences in AAP varied between −67 mm in 7E—thermophile pedunculate oak on sand and 118 mm in 3E—beech at the upper altitudinal limit.
In analyzing the MTVS, an increase of 0.83 °C, on average, was found for 1991–2020, and 1.50 °C for 2011–2020, compared to the reference decade. The temperature differences ranged from 1.04 °C (in 2E—Norway spruce on marshland) and 1.05 °C (in 7E-Thermophile pedunculate oak on sand) to 0.57 °C (in 3E—beech at the upper altitudinal limit), and from 1.78 °C (in 2E—Norway spruces on marshland soil) to 1.21 °C (in 9E—Turkey oak and Hungarian oak forests on pseudo-gleyic soils), respectively. The forest types most affected by the increase in MTVS over the last 30 years were 2E—Norway spruce on marshland, 7E—thermophile pedunculate oak on sand and 10E—steppe island forests.
Regarding the APVS, there was an average increase of 34 mm in 1991–2020 compared to 1951–1960. The differences in APVS between the analyzed periods varied between −19 mm (7E—thermophile pedunculate oak on sand) up to 77 mm (3E—beech at the upper altitudinal limit). The forest types in which the APVS has been very low over the last 30 years are: 10E—steppe island forests, 9E—Turkey oak and Hungarian oak forests on pseudo-gleyic soils, 8E—Quercus pedunculiflora on sand, 7E—thermophile pedunculate oak on sand and 5E—thermophile sessile oak. Comparing the last decade (2011–2020) with the reference decade (1951–1960), the differences in APVS varied between −53 mm in 7E—thermophile pedunculate oak on sand and +73 mm in 3E—beech at the upper altitudinal limit.
The EC indicates a mismatch between the distributions of forest species and current climatic conditions. The forest types which are the most affected by climate warming are the following: 1E—Norway spruce or mixed with other specie at upper altitudinal limit, 2E—Norway spruce on marshland and 8E—Quercus pedunculiflora on sand from all ecological sectors, 4E—sessile and pedunculate oaks on pseudo-gleyic soils in F25A, 5E—thermophile sessile oak and mixed with broadleaf species in H15B and I25B.

3.3.2. Ecoclimatic Index Calculated for Forest Types under Extreme Ecological Conditions

The values of the ecoclimatic indices for forest types and ecological sectors under extreme ecological conditions are presented in Table S2.
The DMAI values calculated for 1991–2020 varied between 84 in 1E—Norway spruce forests at the upper altitudinal limit from C21B to 22 in 10E—steppe island forests from I28A. Calculating this index for the vegetation season (DMAIVS) during 2011–2020, out of the total number of 38 ecological sectors presented in Table S2, 3 fell into the arid category, 19 fell into the semiarid category and 5 into the moderately arid category, which indicates that 71% of ecological sectors from extreme ecological conditions present a very high degree of vulnerability.
The LRI also highlights that steppe climatic conditions intensified in the last decade in 10E—steppe island forests. Forest steppe climatic conditions occurred in 12 ecological sectors and especially in the case of the following forest types: 5E—thermophile sessile oak, 7E—thermophile pedunculate oak on sand, 8E—Quercus pedunculiflora on sand and 9E—Turkey oak and Hungarian oak forests on pseudo-gleyic soils.

3.4. Changes in the Distribution of Climate Envelope of the Forest Species

The shifts in distribution of the climate envelope of the forest species are presented in Figure 16. For analyzed species, the climatic envelope will withdraw in some regions while expanding in others. The most obvious changes in the optimum climatic of species are along an altitudinal gradient. In addition, the shifts occur in the southern regions (J2, J1 and H2), along the latitude, and in the eastern regions (G1, G2, G3 and H1) where climate habitat for many species will withdraw toward the west.
Thus, for Norway spruce and silver fir, whose distribution areas are partially or entirely in mountainous areas, the shifts will be towards higher altitudes. The same tendency would be in the case of European beech and sessile oak, in the future. The oak species from southern plain regions will expand substantially at more northerly latitudes. Climate habitat for Hungarian oak and Turkey oak will expand substantially in many regions, replacing current climate envelopes of pedunculate oak and sessile oak ecosystems. Pedunculate oak will withdraw from southern, western and eastern regions towards the extra-Carpathian hills and the intra-Carpathian regions.
Warming climate will create suitable growth conditions for expansion of xerophilous oak species in many regions from the south, east and west of the country, replacing current climate envelopes of mesophilic oak species. Furthermore, for species such as Quercus pedunculiflora, pubescent oak and Hungarian oak it can be seen that there is almost no spatial overlap with the zone’s current climatic distribution.
The largest climate habitat changes are the expansion of the climatic envelope of xerophilous (Quercus pedunculiflora, pubescent oak) or semi-xerophilous species (Hungarian oak and Turkey oak), typical for the forest steppe region and decrease the habitat for the coniferous forests.

4. Discussion

In this study, four climatic parameters and ecoclimatic index have been calculated and analyzed at the level of provenance regions, subregions and ecological sectors (forest types) in Romania, during the period 1951–2020.
The results show a general shift towards warmer and drier conditions in the last 30 years compared to the reference decade. MAT recording increases between 0.33 °C to 1.11 °C across provenance subregions, and MTVS between 0.27 °C to 0.97 °C. The provenance subregions most affected by rising temperature are G1, G2, G3, H2, H3, I1 and I2 in the east of the country; J1 in the south; K1, K2, E3 in the west; and F1, F2 in the intra-Carpathian area. Precipitation has recorded a decline in the following subregions: I1, C1, K1, K2, B1 and F2, and a slight excess in the rest of the subregions.
Evident climate changes also occurred at the ecological-sector level (forest types) during the last three decades. Compared to the reference decade, there have been increases by an average of 0.64 °C in MAT and 0.71 °C in MTVS at the forest-type level growing under normal ecological conditions and by an average of 0.75 °C in MAT and 0.83 °C in MTVS at the forest types under extreme ecological conditions. The results show that climate change is not uniform throughout provenance regions, and each forest ecosystem might be affected slightly differently. Currently, the most affected by the climate warming are the following forest types: 12—thermophile oak, 15—poplar and willow, 8—pure sessile oak and mixed with broadleaf species, but also 14—meadow forests, 13—Turkey and Hungarian oak and 6—mountain beech forests if we consider the temperature values recorded during growing season. Considering both temperature increases and precipitation deficit recorded in the last decade, 9—pedunculate oak and 1—Swiss pine and mixed Swiss pine with Norway spruce forests should be added to this list. In case of the forests growing in extreme vegetation conditions, the most sensitive to climate change will be the following: 6E—pedunculate oak on marshland, 7E—thermophile pedunculate oak on sand, 4E—sessile and pedunculate oak forests on pseudo-gleyic soils and 10E—steppe island forests.
Another phenomenon associated with climate change is the tendency for some ecological sectors to dry up, as evidenced by the DMAI and LRI. The values of DMAI for the vegetation season show that 86% of the ecological sectors under normal ecological conditions fell into the arid and semiarid categories, which indicates a very high degree of vulnerability for forest species. On the LRI values, forest steppe climatic conditions occurred in all pure or mixed pedunculate oaks forests, thermophile oak species, meadow forests except those in I1, poplar and willow except those in I1 and H3, and Turkey oak and Hungarian oak forests. There are steppe climatic conditions in the case of sessile oak forests from I2—Dobrogea Plateau, meadow forests from I1—Danube Delta and poplar and willow forests from I1—Danube Delta and H3—Danube water holes. Regarding ecological sectors under extreme ecological conditions 71% fell into arid, semiarid and moderately arid categories.
EC values highlight that the warming process is more evident along the altitude, and that the degree of vulnerability increases at lower altitudes or at the edge of species distribution because the amount of water available is reduced. That is the case for hilly beech forests in the south of the Moldavian Plateau (G3), sessile oak forests in the eastern regions (G1, G3, H1, I2) and in the Western Apuseni Mountains (E2), and pure or mixed pedunculate oak forests in Eastern Apuseni Mountains (E3).
Our findings show that the climate in eastern Europe is changing, and according to the projections of the climate scenarios the change will continue at an even faster rate. For Romania an increase in the average annual temperature by 1.2 °C is forecast in the period 2021–2050 compared to the period 1991–2020 [49] and by over 2 °C in the next 100 years, respectively, in 2061–2090 vs. 1961–1990 [62].
Climate change in the last 30 years has produced a spatial mismatch between the current distribution of species and their optimal climate envelope. Considering that the aridity process will be emphasized in some regions from Romania, the implications for tree growth are that some species will continue to grow well and will expand, while other species would disappear from some areas currently located at the edge of the distribution range. The main feature of climate change will be expansion of the distribution area of many species towards higher altitudes and retractions at low-latitude and low-elevation limits.
The climate envelopes for the main forest species have already shifted to another ecosystem’s climate. The maps of climate envelopes reveal the following general trends: (1) some of the most important conifer species, such as Norway spruce and silver fir, will expand to higher altitudes but will significantly decrease in frequency and lose their habitat, particularly in the eastern Carpathians; (2) oak species that currently have a more southern distribution are expected to gain suitable habitat toward the north; (3) European beech and sessile oak will expand to higher altitudes but will lose substantial habitat in eastern regions; (4) pedunculate oak will withdraw from southern, western and eastern regions towards the extra-Carpathian hills and the intra-Carpathian regions; (5) xerophilous or semi-xerophilous species will expand in many regions, replacing current climate envelopes of pedunculate oak and sessile oak ecosystems.
Therefore, the impact on the forest ecosystems and reforestation practices might be drastic if climate changes as predicted. In order to improve adaptability of forest species, urgent actions are needed based on the sustainable use and deployment of forest reproductive material. In this context, regions of provenance have a crucial role ensuring a match between the ecological requirements of the species to planting conditions and increasing the capacity of forest species to cope with climate changes and extreme events. However, the system of provenance regions, according to the OECD Scheme and EU directive, was thought to be encouraging the use of the local seed sources, under the concept ’local is the best’, because it was considered that these sources are most adapted to local and regional environmental conditions [63,64]. The results of numerous provenance experiments, in Romania and abroad, revealed small local adaptation for growth traits among provenance regions. In Romania, local provenances are, generally, less performing than some provenances from other regions [65]. Furthermore, a significant site effect was detected, suggesting that phenotypic plasticity rather than local adaptation explains phenotypic differences among provenances [66,67,68]. Similar results were also observed in other geographical regions of Europe [69,70,71].
Genetic adaptation is the microevolutionary process that enhances the fitness of a population in accordance with the environmental conditions [72]. Therefore, minimizing regional maladaptation involves optimizing provenance region boundaries. Our findings do not validate current provenance region delineation in terms of ecological criteria. The re-delimitation of current provenance regions according to climatic criteria rather than the geographic or administrative ones is required in order to promote adaptation. For this reason, provenance regions must be wide enough to provide a high level of genetic diversity within species, so that the future forest stands can survive and remain productive [73,74]. The delineation of too-small provenance regions, as is currently the case of xerophilous oak species with fragmented populations in the southern, eastern and western plains of Romania, may decrease levels of genetic diversity and increase levels of inbreeding [75,76].
However, to ensure genetic adaptation, it is not enough to know where a species will be suitable in the future, but also which populations of a species will perform well in areas of potential new habitat. In the establishment of new forests through reforestation, a gradual adaptation may be achieved through moderate transfer of forest reproductive material from latitudinal–adjacent regions or from lower altitudinal distances and by selection and transfer of high-productive and resilient forest reproductive material-assisted migration [54]. Assisted migration is considered as part of a forest climate change adaptation strategy because it can prevent species extinction, minimize economic loss and sustain ecosystem services and biodiversity. The authors of [77,78,79] summarized the adaptive actions for forest management into three categories: societal adaptation, adaptation of the forest (e.g., species selection, tree breeding) and adaptation to the forest (e.g., changing rotation age, modifying wood-processing technology).
The present study argues that the delineation of the provenance regions of reproductive materials are fundamental for an adaptive forest management in Europe. New approaches regarding the delineation of provenance regions according to species climate envelope, future climate projections and intraspecific genetic variation are requested.

5. Conclusions

The results highlight significant changes in the variation of climatic variable in the last decades at both the provenance-region and forest-type levels.
Based on the results of this study, we can state that the aridity process of some regions in Romania will increase in future and will considerably alter growing conditions of the forest species, particularly the growth and survival of stand regeneration and new plantations.
Our results stress that climate changes will occur within the lifetime of a single tree generation and will be faster than species can adapt or migrate. The risks of climatic changes will be very high in forestry; consequently, major changes in forest management will become necessary. In this regard, some measures for an adaptive management would be identifying the suitable sources of forest reproductive material; replacing sensitive species with others better adapted, particularly on sites exposed to aridization; admixing better-adapted provenances with local sources; enriching the species mixtures; and using a forest reproductive material that holds a high level of genetic diversity, such as that from seed orchards.
Therefore, delineation of the provenance regions for forest species together with selection of the seed sources and transfer of forest reproductive material (assisted migration) could be fundamental tools for an adaptive forest management.

Supplementary Materials

The following supporting information can be downloaded at: https://www.mdpi.com/article/10.3390/f13081203/s1, Figure S1: The geographical position of Romania in the European continent. The country topography is represented in the lower right box; Table S1: Ecoclimatic indices (DMAI, LRI and EC) for each forest type and ecological sector under normal ecological conditions; Table S2: Ecoclimatic indices (DMAI, LRI and EC) for each forest type and ecological sector under extreme ecological conditions.

Author Contributions

Conceptualization, G.M. and M.-V.B.; methodology, G.M. and M.-V.B.; climate data analysis and processing, A.-M.A., I.-A.N. and M.-V.B.; maps, I.-A.N.; writing, all authors. All authors have read and agreed to the published version of the manuscript.

Funding

This study was carried out within the framework of the project PN 19070303 (Revision of the provenance regions for production and deployment of the forest reproductive materials in Romania in order to increase the adaptability of forest ecosystems to climate change). This work was supported by the Ministry of Research, Innovation and Digitalization in Romania, in BIOSERV Nucleu Program.

Institutional Review Board Statement

Not applicable.

Informed Consent Statement

Not applicable.

Data Availability Statement

Data can be transmitted to anyone interested via email request.

Acknowledgments

The authors would like to thank the anonymous reviewers for their comments and suggestions that contributed positively to this paper.

Conflicts of Interest

The authors declare no conflict of interest.

References

  1. O’Neill, G.A.; Aitken, S.N. Area-Based Breeding Zones to Minimize Maladaptation. Can. J. For. Res. 2004, 34, 695–704. [Google Scholar] [CrossRef]
  2. Ying, C.C.; Yanchuk, A.D. The Development of British Columbia’s Tree Seed Transfer Guidelines: Purpose, Concept, Methodology, and Implementation. For. Ecol. Manag. 2006, 227, 1–13. [Google Scholar] [CrossRef]
  3. Buiteveld, J.; de Vries, S.M.G.; Kranenborgen, K.G. Delimitations of Regions of Provenance for Forest Reproductive Material inWestern Europe; Alterra-Report; Alterra, Research Instituut voor de Groene Ruimte: Wageningen, The Netherlands, 2000; 45p. [Google Scholar]
  4. Ducci, F.; Vannuccini, M.; Carone, G.; Vedele, S.; Cili, S.; Apuzzo, S. Delimitations of Regions of Provenance for Forest Reproductive Material in Western Europe. Ann. C.R.A.-SEL 2008, 35, 133–142. [Google Scholar]
  5. Alía, R.; del Barrio, J.M.G.; Iglesias, S.; Mancha, J.A.; De Miguel, J.; Nicolás, J.; Pérez, F.; de Ron, D.S. Regiones de Procedencia de Especies Forestales En España; MARM: Madrid, Spain, 2009. [Google Scholar]
  6. Auñon, F.J.; del Barrio, J.M.G.; Mancha, J.A.; de Vries, S.M.G.; Alía, R. Regions of Provenance of European Beech (Fagus Sylvatica L.) in Europe. In Genetic Resources of European Beech (Fagus sylvatica L.) for Sustainable Forestry; Ministerio de Ciencia e Innovacion: Madrid, Spain, 2011; pp. 141–148. [Google Scholar]
  7. Matyas, C. Modeling Climate Change Effects with Provenance Test Data. Tree Physiol. 1994, 14, 797–804. [Google Scholar] [CrossRef] [Green Version]
  8. Rehfeldt, G.E.; Ying, C.C.; Spittlehouse, D.L.; Hamilton, D.A. Genetic Responses to Climate in Pinus Contorta: Niche Breadth, Climate Change, and Reforestation. Ecol. Monogr. 1999, 69, 375–407. [Google Scholar] [CrossRef]
  9. Hamann, A.; Wang, T. Potential Effects of Climate Change on Ecosystem and Tree Species Distribution in British Columbia. Ecology 2006, 87, 2773–2786. [Google Scholar] [CrossRef] [Green Version]
  10. Wang, T.; O’Neill, G.; Aitken, S.N. Integrating Environmentaland Genetic Effects to Predict Responses of Tree Populations Toclimate. Ecol. Appl. 2010, 20, 153–163. [Google Scholar] [CrossRef] [PubMed]
  11. Hamann, A.; Gylander, T.; Chen, P.Y. Developing Seed Zones and Transfer Guidelines with Multivariate Regression Trees. Tree Genet. Genomes 2011, 7, 399–408. [Google Scholar] [CrossRef] [Green Version]
  12. Davis, M.; Shaw, R. Range Shifts and Adaptive Responses to Quaternary Climate Change. Science 2001, 292, 673–679. [Google Scholar] [CrossRef] [Green Version]
  13. Jobbágy, E.G.; Jackson, R.B. Global Controls of Forest Line Elevation in the Northern and Southern Hemispheres. Glob. Ecol. Biogeogr. 2000, 9, 253–268. [Google Scholar] [CrossRef] [Green Version]
  14. Parmesan, C.; Yohe, G. A Globally Coherent Fingerprint of Climate Change Impacts across Natural Systems. Nature 2003, 421, 37–42. [Google Scholar] [CrossRef] [PubMed]
  15. Pretzsch, H. Diversity and Productivity in Forests: Evidence from Long-Term Experimental Plots. In Forest Diversity and Function. Ecological Studies; Scherer-Lorenzen, M., Körner, C., Schulze, E.D., Eds.; Springer: Berlin, Germany, 2005; Volume 176. [Google Scholar] [CrossRef]
  16. Christensen, J.H.; Hewitson, B.; Busuioc, A.; Chen, A.; Gao, X.; Held, I.; Jones, R.; Kolli, R.K.; Kwon, W.T.; Laprise, R.; et al. Regional Climate Projections. In Climate Change 2007: The Physical Science Basis. The Fourth Assessment Report of the Intergovernmental Panel on Climate Change; Solomon, S.D., Qin, M., Manning, Z., Chen, M., Marquis, K., Averyt, K., Tignor, M., Miller, H., Eds.; Cambridge University Press: New York, NY, USA, 2007. [Google Scholar]
  17. Hamrick, J.L. Response of Forest Trees to Global Environmental Changes. For. Ecol. Manag. 2004, 197, 323–335. [Google Scholar] [CrossRef]
  18. Lindner, M.; Maroschek, M.; Netherer, S.; Kremer, A.; Barbati, A.; Garcia-Gonzalo, J.; Seidl, R.; Delzon, S.; Corona, P.; Kolström, M.; et al. Climate Change Impacts, Adaptive Capacity, and Vulnerability of European Forest Ecosystems. For. Ecol. Manag. 2010, 259, 698–709. [Google Scholar] [CrossRef]
  19. Pulido, F.; Berthold, P. Microevolutionary Response to Climatic Change. Adv. Ecol. Res. 2004, 35, 151–183. [Google Scholar] [CrossRef]
  20. Kremer, A.; Ronce, O.; Robledo-Arnuncio, J.J.; Guillaume, F.; Bohrer, G.; Nathan, R.; Bridle, J.R.; Gomulkiewicz, R.; Klein, E.K.; Ritland, K.; et al. Long-Distance Gene Flow and Adaptation of Forest Trees to Rapid Climate Change. Ecol. Lett. 2012, 15, 378–392. [Google Scholar] [CrossRef] [PubMed] [Green Version]
  21. Chen, I.C.; Hill, J.K.; Ohlemüller, R.; Roy, D.B.; Thomas, C.D. Rapid Range Shifts of Species Associated with High Levels of Climate Warming. Science 2011, 333, 1024–1026. [Google Scholar] [CrossRef] [PubMed]
  22. Aitken, S.N.; Yeaman, S.; Holliday, J.A.; Wang, T.; Curtis-McLane, S. Adaptation, Migration or Extirpation: Climate Change Outcomes for Tree Populations. Evol. Appl. 2008, 1, 95–111. [Google Scholar] [CrossRef]
  23. Vranckx, G.; Jacquemyn, M.; Muys, B.; Honnay, O. Meta Analysis of Susceptibility of Woody Plants to Loss of Genetic Diversity through Habitat Fragmentation. Conservation Biology? J. Soc. Conserv. Biol. 2012, 26, 228–237. [Google Scholar] [CrossRef]
  24. Aitken, S.N.; Bemmels, J.B. Time to Get Moving: Assisted Gene Flow of Forest Trees. Evol. Appl. 2016, 9, 271–290. [Google Scholar] [CrossRef]
  25. Keenan, R.J. Climate Change Impacts and Adaptation in Forest Management: A Review. Ann. For. Sci. 2015, 72, 145–167. [Google Scholar] [CrossRef] [Green Version]
  26. Lindner, M.; Fitzgerald, J.B.; Zimmermann, N.E.; Reyer, C.; Delzon, S.; van der Maaten, E.; Schelhaas, M.J.; Lasch, P.; Eggers, J.; van der Maaten-Theunissen, M.; et al. Climate Change and European Forests: What Do We Know, What Are the Uncertainties, and What Are the Implications for Forest Management? J. Environ. Manag. 2014, 146, 69–83. [Google Scholar] [CrossRef] [Green Version]
  27. Alistair, S.J.; Josep, P. Running to Stand Still: Adaptation and the Response of Plants to Rapid Climate Change. Ecol. Lett. 2005, 8, 1010–1020. [Google Scholar]
  28. Jones, T.A. When Local Isn’t Best. Evol. Appl. 2013, 6, 1109–1118. [Google Scholar] [CrossRef] [PubMed]
  29. De Kort, H.; Mergeay, J.; Vander Mijnsbrugge, K.; Decocq, G.; Maccherini, S.; Kehlet Bruun, H.H.; Honnay, O.; Vandepitte, K. An Evaluation of Seed Zone Delineation Using Phenotypic and Population Genomic Data on Black Alder Alnus Glutinosa. J. Appl. Ecol. 2014, 51, 1218–1227. [Google Scholar] [CrossRef]
  30. Parnuta, G.; Lorent, A.; Teodoroiu, M.; Petrila, M. Regiuni de Provenienta Pentru Materialele de Baza Din Care Se Obtin Materialele Forestiere de Reproducere Din Romania (Provenance Regions for Basic Materials to Produce Forest Reproductive Material in Romania); Forest Publishing: Bucharest, Romania, 2010. [Google Scholar]
  31. Enescu, V.; Donita, N.; Bindiu, C.; Contescu, L. Zonele de Recoltare a Semintelor Forestiere in R.S. Romania (Provenance Zones for Harvesting Forest Seeds in Romania); Forest Research and Management Institute: Bucharest, Romania, 1988. [Google Scholar]
  32. Cheval, S.; Birsan, M.V.; Dumitrescu, A. Climate Variability in the Carpathian Mountains Region over 1961–2010. Glob. Planet. Change 2014, 118, 85–96. [Google Scholar] [CrossRef]
  33. Meinshausen, M.; Smith, S.J.; Calvin, K.; Thomson, A.; Daniel, J.S.; Kainuma, M.L.T.; Matsumoto, K.; Lamarque, J.; Raper, S.C.B.; Riahi, K.; et al. The RCP Greenhouse Gas Concentrations and Their Extensions from 1765 to 2300. Clim. Change 2011, 109, 213–241. [Google Scholar] [CrossRef] [Green Version]
  34. Spinoni, J.; Szalai, S.; Szentimrey, T.; Lakatos, M.; Bihari, Z.; Nagy, A.; Németh, Á.; Kovács, T.; Mihic, D.; Dacic, M.; et al. Climate of the Carpathian Region in the Period 1961–2010: Climatologies and Trends of 10 Variables. Int. J. Climatol. 2015, 35, 1322–1341. [Google Scholar] [CrossRef] [Green Version]
  35. Ionita, M.; Scholz, P.; Chelcea, S. Assessment of Droughts in Romania Using the Standardized Precipitation Index. Nat. Hazards 2016, 81, 1483–1498. [Google Scholar] [CrossRef] [Green Version]
  36. Birsan, M.V.; Dumitrescu, A.; Micu, D.M.; Cheval, S. Changes in Annual Temperature Extremes in the Carpathians since AD 1961. Nat. Hazards 2014, 74, 1899–1910. [Google Scholar] [CrossRef]
  37. Birsan, M.-V.; Micu, D.-M.; Niţă, I.-A.; Mateescu, E.; Szép, R.; Keresztesi, Á. Spatio-Temporal Changes in Annual Temperature Extremes over Romania (1961–2013). Rom. J. Phys. 2019, 64, 816. [Google Scholar]
  38. Busuioc, A.; Dobrinescu, A.; Birsan, M.V.; Dumitrescu, A.; Orzan, A. Spatial and Temporal Variability of Climate Extremes in Romania and Associated Large-Scale Mechanisms. Int. J. Climatol. 2015, 35, 1278–1300. [Google Scholar] [CrossRef]
  39. Birsan, M.V.; Dumitrescu, A. Snow Variability in Romania in Connection to Large-Scale Atmospheric Circulation. Int. J. Climatol. 2014, 34, 134–144. [Google Scholar] [CrossRef]
  40. Micu, D.M.; Dumitrescu, A.; Cheval, S.; Nita, I.A.; Birsan, M.V. Temperature Changes and Elevation-Warming Relationships in the Carpathian Mountains. Int. J. Climatol. 2021, 41, 2154–2172. [Google Scholar] [CrossRef]
  41. Birsan, M.V.; Marin, L.; Dumitrescu, A. Seasonal Changes in Wind Speed in Romania. Rom. Rep. Phys. 2013, 65, 1479–1484. [Google Scholar]
  42. Birsan, M.V.; Nita, I.-A.; Craciun, A.; Sfica, L.; Keresztesi, Á.; Szep, R.; Micheu, M. Observed Changes in Mean and Maximum Monthly Wind Speed over Romania since Ad 1961. Rom. Rep. Phys. 2020, 72, 702. [Google Scholar]
  43. Busuioc, A.; Birsan, M.V.; Carbunaru, D.; Baciu, M.; Orzan, A. Changes in the Large-Scale Thermodynamic Instability and Connection with Rain Shower Frequency over Romania: Verification of the Clausius-Clapeyron Scaling. Int. J. Climatol. 2016, 36, 2015–2034. [Google Scholar] [CrossRef]
  44. Manea, A.; Birsan, M.V.; Tudorache, G.; Cărbunaru, F. Changes in the Type of Precipitation and Associated Cloud Types in Eastern Romania (1961–2008). Atmos. Res. 2016, 169, 357–365. [Google Scholar] [CrossRef]
  45. Nita, I.A.; Sfîcă, L.; Apostol, L.; Radu, C.; Birsan, M.V.; Szep, R.; Keresztesi, Á. Changes in Cyclone Intensity over Romania According to 12 Tracking Methods. Rom. Rep. Phys. 2020, 72, 706. [Google Scholar]
  46. Nita, I.-A.; Apostol, L.; Patriche, C.; Sfica, L.; Bojariu, R.; Birsan, M.-V. Frequency of Atmospheric Circulation Types over Romania According to Jenkinson-Collison Method Based on Two Long-Term Reanalysis Datasets. Rom. J. Phys. 2022, 67, 812. [Google Scholar]
  47. Țîmpu, S.; Sfîcă, L.; Dobri, R.-V.; Cazacu, M.-M.; Nita, A.-I.; Birsan, M.-V. Tropospheric Dust and Associated Atmospheric Circulations over the Mediterranean Region with Focus on Romania’s Territory. Atmosphere 2020, 11, 349. [Google Scholar] [CrossRef] [Green Version]
  48. Cheval, S.; Busuioc, A.; Dumitrescu, A.; Birsan, M.V. Spatiotemporal Variability of Meteorological Drought in Romania Using the Standardized Precipitation Index (SPI). Clim. Res. 2014, 60, 235–248. [Google Scholar] [CrossRef]
  49. Cheval, S.; Dumitrescu, A.; Birsan, M.V. Variability of the Aridity in the South-Eastern Europe over 1961–2050. Catena 2017, 151, 74–86. [Google Scholar] [CrossRef]
  50. Birsan, M.V. Trends in Monthly Natural Streamflow in Romania and Linkages to Atmospheric Circulation in the North Atlantic. Water Resour. Manag. 2015, 29, 3305–3313. [Google Scholar] [CrossRef]
  51. Micheu, M.M.; Birsan, M.V.; Szép, R.; Keresztesi, Á.; Nita, I.A. From Air Pollution to Cardiovascular Diseases: The Emerging Role of Epigenetics. Mol. Biol. Rep. 2020, 47, 5559–5567. [Google Scholar] [CrossRef]
  52. Micheu, M.M.; Birsan, M.V.; Nita, I.A.; Andrei, M.D.; Nebunu, D.; Acatrinei, C.; Sfîcă, L.; Szép, R.; Keresztesi, Á.; Hernáez, P.F.D.A.; et al. Influence of Meteorological Variables on People with Cardiovascular Diseases in Bucharest, Romania (2011–2012). Rom. Rep. Phys. 2021, 73, 707. [Google Scholar]
  53. Mihai, G.; Birsan, M.V.; Dumitrescu, A.; Alexandru, A.; Mirancea, I.; Ivanov, P.; Stuparu, E.; Teodosiu, M.; Daia, M. Adaptive Genetic Potential of European Silver Fir in Romania in the Context of Climate Change. Ann. For. Res. 2018, 61, 95–108. [Google Scholar] [CrossRef]
  54. Mihai, G.; Alexandru, A.M.; Stoica, E.; Birsan, M.V. Intraspecific Growth Response to Drought of Abies Alba in the Southeastern Carpathians. Forests 2021, 12, 387. [Google Scholar] [CrossRef]
  55. Donita, N. Elaborarea Hartii Forestiere a Romaniei La Scara 1:500,000 (Development of the Romanian Forest Map at 1:500,000 Scale); Forest Research and Management Institute: Bucharest, Romania, 1996. [Google Scholar]
  56. Dumitrescu, A.; Birsan, M.V. ROCADA: A Gridded Daily Climatic Dataset over Romania (1961–2013) for Nine Meteorological Variables. Nat. Hazards 2015, 78, 1045–1063. [Google Scholar] [CrossRef]
  57. Vlăduţ, A.Ş.; Nikolova, N.; Licurici, M. Influence of Climatic Conditions on the Territorial Distribution of the Main Vegetation Zones within Oltenia Region, Romania. Olten. Stud. Comun. Stiintele Nat. 2017, 33, 154–164. [Google Scholar]
  58. WMO/GWP Integrated Drought Management Programme (IDMP). Handbook of Drought Indicators and Indices; WMO-No. 1173; World Meteorological Organization: Geneva, Switzerland, 2016. [Google Scholar]
  59. Ellenberg, H. Vegetation Mitteleuropas Mit Den Alpen; Eugen Ulmer: Stuttgart, Germany, 1963. [Google Scholar]
  60. Sofletea, N.; Curtu, L. Dendrologie; Editura Pentru Viata: Brasov, Romania, 2001. [Google Scholar]
  61. IPCC. Climate Change 2001: Mitigation. Contribution of Working Group III to the Third Assessment Report of the Intergovernmental Panel on Climate Change; Cambridge University Press: Cambridge, UK, 2001. [Google Scholar]
  62. Dumitrescu, A.; Bojariu, R.; Birsan, M.V.; Marin, L.; Manea, A. Recent Climatic Changes in Romania from Observational Data (1961–2013). Theor. Appl. Climatol. 2015, 122, 111–119. [Google Scholar] [CrossRef]
  63. Savolainen, O.; Pyhäjärvi, T.; Knürr, T. Gene Flow and Local Adaptation in Trees. Annu. Rev. Ecol. Evol. Syst. 2007, 38, 595–619. [Google Scholar] [CrossRef]
  64. Pluess, A.R.; Frank, A.; Heiri, C.; Lalagüe, H.; Vendramin, G.G.; Oddou-Muratorio, S. Genome-Environment Association Study Suggests Local Adaptation to Climate at the Regional Scale in Fagus Sylvatica. New Phytol. 2016, 210, 589–601. [Google Scholar] [CrossRef] [PubMed] [Green Version]
  65. Mihai, G. Surse de Seminţe Testate Pentru Principalele Specii de Arbori Forestieri Din România [Tested Seed Sources for the Main Forest Tree Species from Romania]; Editura Silvică: Bucharest, Romania, 2009. [Google Scholar]
  66. Şofletea, N.; Curtu, A.L.; Daia, M.L.; Budeanu, M. The Dynamics and Variability of Radial Growth in Provenance Trials of Norway Spruce (Picea Abies (L.) Karst.) within and beyond the Hot Margins of Its Natural Range. Not. Bot. Horti Agrobot. Cluj-Napoca 2015, 43, 265–271. [Google Scholar] [CrossRef] [Green Version]
  67. Mihai, G.; Mirancea, I.; Birsan, M.V.; Dumitrescu, A. Patterns of Genetic Variation in Bud Flushing of Abies Alba Populations. IForest 2018, 11, 284–290. [Google Scholar] [CrossRef] [Green Version]
  68. Mihai, G.; Teodosiu, M.; Birsan, M.V.; Alexandru, A.M.; Mirancea, I.; Apostol, E.N.; Garbacea, P.; Ionita, L. Impact of Climate Change and Adaptive Genetic Potential of Norway Spruce at the South–Eastern Range of Species Distribution. Agric. For. Meteorol. 2020, 291, 108040. [Google Scholar] [CrossRef]
  69. Worrell, R. A Comparison between European Continental and British Provenances of Some British Native Trees: Growth, Survival and Stem Form. Forestry 1992, 65, 253–280. [Google Scholar] [CrossRef]
  70. Pâques, L.E. Forest Tree Breeding in Europe; Springer: Dordrecht, The Netherlands, 2009. [Google Scholar]
  71. Whittet, R.; Cavers, S.; Ennos, R.; Cottrell, J. Genetic Considerations for Provenance Choice of Native Trees under Climate Change in England; Forestry Commission: Edinburgh, UK, 2019; pp. 1–56. [Google Scholar]
  72. Matyas, C. Guidelines for the Choice of Forest Reproductive Material in the Face of Climate Change; FORGER Guidelines; Bioversity International: Rome, Italy, 2016; 8p. [Google Scholar]
  73. Reed, D.H.; Frankham, R. Correlation between Fitness and Genetic Diversity. Conserv. Biol. 2003, 17, 230–237. [Google Scholar] [CrossRef]
  74. Leimu, R.; Mutikainen, P.; Koricheva, J.; Fischer, M. How General Are Positive Relationships between Plant Population Size, Fitness and Genetic Variation? J. Ecol. 2006, 94, 942–952. [Google Scholar] [CrossRef]
  75. Young, A.; Boyle, T.; Brown, T. The Population Genetic Consequences of Habitat Fragmentation for Plants. Trends Ecol. Evol. 1996, 11, 413–418. [Google Scholar] [CrossRef]
  76. O’Neill, G.A.; Hamann, A.; Wang, T. Accounting for Population Variation Improves Estimates of the Impact of Climate Change on Species’ Growth and Distribution. J. Appl. Ecol. 2008, 45, 1040–1049. [Google Scholar] [CrossRef]
  77. Pedlar, J.H.; McKenney, D.W.; Aubin, I.; Beardmore, T.; Beaulieu, J.; Iverson, L.; O’Neill, G.A.; Winder, R.S.; Ste-Marie, C. Placing Forestry in the Assisted Migration Debate. Bioscience 2012, 62, 835–842. [Google Scholar] [CrossRef]
  78. Williams, M.I.; Dumroese, R.K. Preparing for Climate Change: Forestry and Assisted Migration. J. For. 2013, 111, 287–297. [Google Scholar] [CrossRef]
  79. Spittlehouse, D.L.; Stewart, R.B. Adaptation to Climate Change in Forest Management. BC J. Ecosyst. Manag. 2003, 4, 1–7. [Google Scholar]
Figure 1. The map of provenance regions in Romania (as defined in [30]): A1: Eastern Carpathians, western cline; A2: Eastern Carpathians, eastern cline; A3: Giurgeu–Ciuc depression; B1: Brașov depression; B2: Curvature Carpathians, outer cline; C1: Southern Carpathians, northern cline; C2: Southern Carpathians, southern cline; D1: Mehedinți/Cerna/Semenic Mountains; D2: Țarcu/Poiana Ruscă Mountains; E1: Zarand/Metaliferi Mountains; E2: Western Apuseni Mountains; E3: Eastern Apuseni Mountains; F1: Transylvania Plain; F2: Transylvania Plateau; G1: Suceva/Siret/Iasi Hills; G2: Jijia Plain; G3: Bârlad Plateau; H1: Covur Plateau; H2: Siret and Bărăgan Plains; H3: Danube water holes; I1: Danube Delta; I2: Dobrogea Plateau; J1: Bucharest Plain; J2: Oltenia Plain; K1: Timiș and Arad Plain; K2: Cris/Carei/Someș Plain; 1–15: Forest types under normal ecological conditions; 1E–10E: Forest types under extreme ecological conditions.
Forests 13 01203 g001
Figure 2. The variation of mean annual temperature by decade for the provenance subregions.
Forests 13 01203 g002
Figure 3. The increases in MAT and MTVS over the last 30 years compared to 1951–1960 decade for the provenance subregions.
Forests 13 01203 g003
Figure 4. The variation of average annual precipitation on the decades for the provenance subregions.
Forests 13 01203 g004
Figure 5. The increases in AAP and APVS over the last 30 years compared to 1951–1960 decade for the provenance subregions.
Forests 13 01203 g005
Figure 6. The variation of MTVS on the decades for the provenance subregions.
Forests 13 01203 g006
Figure 7. The variation of APVS on the decades for the provenance subregions.
Forests 13 01203 g007
Figure 8. The variation of mean annual temperature over the analyzed period for the main forest types.
Forests 13 01203 g008
Figure 9. The differences in mean annual temperature over the last 30 years compared to 1951–1960 decade for the main forest types.
Forests 13 01203 g009
Figure 10. The variation of average annual precipitation over the analyzed period for the main forest types.
Forests 13 01203 g010
Figure 11. The differences in average annual precipitation over the last 30 years compared to 1951–1960 decade for the main forest types.
Forests 13 01203 g011
Figure 12. The variation of MTVS over the analyzed period for the main forest types.
Forests 13 01203 g012
Figure 13. The differences in MTVS over the last 30 years compared to 1951–1960 decade for the main forest types.
Forests 13 01203 g013
Figure 14. The variation of APVS over the analyzed period for the main forest types.
Forests 13 01203 g014
Figure 15. The differences in APVS over the last 30 years compared to 1951–1960 decade for the main forest types.
Forests 13 01203 g015
Figure 16. Climate envelope of: (a) Norway spruce; (b) silver fir; (c) European beech; (d) sessile oak; (e) pedunculate oak; (f) Quercus pedunculiflora and pubescent oak; (g) Hungarian oak and Turkey oak. The blue polygons show the current spatial distribution.
Forests 13 01203 g016aForests 13 01203 g016b
Table 1. The De Martonne aridity index classification (DMAI).
Values of DMAIType of ClimateVegetation
5–10AridDesert
11–25SemiaridSteppe
26–30Moderate aridSteppe
31–35SemihumidForest steppe
36–40Moderate humidOak forests
41–45HumidBeech forests
46–50Coniferous forests
51–55Very humidSubalpine
56–60Alpine
>60Extremely humid
Table 2. The Lang rainfall index classification.
Values of LRIType of Climate
>160Wet
160–100Temperate wet
100–60Temperate warm
60–40Semiarid
40–20Arid
20–0Desert
Table 3. Provenance subregions.
CodeSubregionCodeSubregion
A1Eastern Carpathians, western clineF2Transylvania Plateau
A2Eastern Carpathians, eastern clineG1Suceva/Siret/Iasi Hills
A3Giurgeu–Ciuc depressionG2Jijia Plain
B1Brasov depressionG3Barlad Plateau
B2Curvature Carpathians, outer clineH1Covur Plateau
C1Southern Carpathians, northern clineH2Siret and Baragan Plains
C2Southern Carpathians, southern clineH3Danube water holes
D1Mehedinti/Cerna/Semenic MountainsI1Danube Delta
D2Tarcu/Poiana Rusca MountainsI2Dobrogea Plateau
E1Zarand/Metaliferi MountainsJ1Bucharest Plain
E2Western Apuseni MountainsJ2Oltenia Plain
E3Eastern Apuseni MountainsK1Timis and Arad Plain
F1Transylvania PlainK2Cris/Carei/Somes Plain
Table 4. The main forest types.
Type CodeExtreme Ecological ConditionsType CodeNormal Ecological Conditions
1ENorway spruce or mixed with other species at upper altitudinal limit1Swiss pine and mixed with Norway spruce
2ENorway spruce on marshland2Larch and mixed larch and Norway spruce
3EBeech at upper altitudinal limit3Norway spruce
4ESessile and pedunculate oak forests on pseudo-gleyic soils4Norway spruce in mountain depression
5EThermophile sessile oak and mixed with other broadleaf species 5Mixed beech and coniferous species
6EPedunculate oak on marshland6Mountain beech
7EThermophile pedunculate oak on sand7Hilly pure beech and mixed beech with broadleaf species
8EQuercus pedunculiflora on sand8Pure sessile oak and mixed with broadleaf species
9ETurkey oak and Hungarian oak forests on pseudo-gleyic soils9Pure pedunculate oak and mixed with other oaks species
10ESteppe island forests10Pedunculate oak in depression
11Pedunculate oak on piedmont
12Thermophile oak species
13Turkey oak and Hungarian oak forests
14Meadow forests (alder, ash, oak)
15Poplar and willow forest
Publisher’s Note: MDPI stays neutral with regard to jurisdictional claims in published maps and institutional affiliations.

