Abstract
In recent years, global forests have been facing an increase in tree mortality owing to increasing droughts. However, the capacity for plants to adjust their physiology and biochemistry during extreme drought and subsequent recovery is still unclear. Here, we used 1.5-year-old Pinus massoniana Lamb. seedlings and simulated drought conditions to achieve three target stress levels (50%, 85%, and 100% loss of stem hydraulic conductivity (PLC)), followed by rehydration. Needle water status, gas exchange, and biochemical parameters were assessed during drought and recovery. The results showed that drought had significantly negative impacts on needle water status and gas exchange parameters, with gas exchange declining to 0 after PLC85 was achieved. Soluble protein concentration (SPC), soluble sugar concentration (SSC), malondialdehyde (MDA) content, superoxide dismutase (SOD) activity, and needle water-use efficiency showed fluctuations. The activity of antioxidant enzymes and the values of osmotic regulators were then gradually decreased as the physiological and biochemical functions of seedlings were disturbed. Seedlings showed a stronger ability to recover from PLC50 than PLC85 and PLC100. We conclude that the physiological and biochemical recovery of P. massoniana seedlings is more likely to be inhibited when plants experience increasing drought stress that induces 85% and greater loss of hydraulic conductance.
1. Introduction
Drought is an important abiotic stress that has negative impacts on plant growth and survival and is associated with a series of physiological and biochemical processes [1]. In recent decades, a decline in tree productivity and their increased mortality caused by drought have been observed in forests worldwide [2]. In the context of climate change, the frequency and intensity of droughts are likely to increase in the future [3,4], which could further threaten tree survival [5]. Regarding tree mortality, physiological and biochemical processes may play roles in regulating plant drought resistance. However, the dynamics of these processes during severe droughts and post-drought recovery have seldom been explored [6,7]. In particular, the question of whether physiological and biochemical processes will permit recovery from extreme drought remains unanswered. An in-depth study of plant physiological and biochemical responses to both drought and post-drought recovery is important for accurately predicting plant responses and resilience to drought under a changing climate.
Previous studies have shown that plants often reduce stomatal conductance to save water during early drought stress at the expense of photosynthesis [8]. As drought intensifies, plants can preserve some of the membrane lipids by increasing the activity of antioxidant enzymes. Peroxidation protects cell membranes from damage, but they can also accumulate soluble proteins and soluble sugars for maintaining osmotic pressure to retain cell turgor [9]. As drought continues to intensify, embolisms begin to form in the xylem, inhibiting water supply to the foliage and limiting photosynthesis [10], resulting in the failure of the synthesis of osmotic regulatory substances [11]. When the seedlings undergo rehydration after drought, they may display some ability to recover, but the degree of recovery is closely related to the intensity and duration of the drought [12]. Many studies on seedlings suggest that after short-term mild drought, rehydration is able to restore their photosynthetic capacity, but after extreme drought, seedlings lose their ability to restore photosynthetic parameters due to a greater loss of hydraulic conductance due to embolisms [13]. However, it is still unclear how plant antioxidant enzymes and osmotic regulators contribute to the plant’s response to extreme drought stress and post-drought recovery.
Pinus massoniana Lamb. is one of the most important industrial timber species in southern China, playing crucial roles in forest production and chemical industry, forest resource development, and forest ecosystem service [14]. However, seasonal droughts have been threatening the growth and development of P. massoniana forests. It is anticipated that most areas of southern China (such as Guizhou, Guangxi, and Guangdong provinces) will suffer a 20% to 40% drought risk in the next few decades [15], which may further threaten P. massoniana survival. To date, the research on P. massoniana drought responses has mainly focused on the growth, physiology, and molecular and genetic understanding of drought resistance under either mild or severe drought stress [16,17,18,19,20]. Nonetheless, the dynamics of physiological and biochemical responses to extreme drought stress and the subsequent post-drought recovery are yet to be studied in this species.
Here, we explored the needle water status, gas exchange, soluble sugar (SSC), soluble protein (SPC), malondialdehyde (MDA) content, and superoxide dismutase (SOD) activity of P. massoniana seedlings approaching extreme drought and during recovery. We opted to stress plants to percentage losses of stem hydraulic conductivity (PLC) of 50%, 85%, and 100%, since these stress levels have been reported to be related to the hydraulic thresholds of tree mortality [21]. This study investigated the dynamics of gas exchange, antioxidant enzymes, and osmotic regulation in the development of, and recovery from, drought stress in P. massoniana seedlings. We hypothesized that as the drought intensified, physiological and biochemical parameters of P. massoniana seedlings would be affected to a greater extent and be less able to recover.
2. Materials and Methods
2.1. Plant Materials and Experimental Design
One-and-a-half-year-old P. massoniana seedlings with a mean height of 25 cm and a basal diameter of 2 mm were planted in plastic pots with drainage holes. A tray was placed under each pot to minimize water and nutrient loss. Each pot was filled with 3.3 kg dry sterilized soil (60% v/v yellow soil, 20% v/v peat soil, and 20% v/v perlite) and contained one plant. Soil physical and chemical properties were as follows: total N, P, and K were 2.8, 0.73, and 5.86 g kg−1, respectively. Mass fractions of hydrolyzed N, available P, and available K were 87.5, 19.02, and 420.44 mg kg−1, respectively. The field capacity was 47.63% and the pH of the soil was 4.65.
In June 2020, after being grown for 15 months, the potted seedlings were transferred to a polytunnel. Healthy seedlings with similar heights and basal diameters (mean values were 37.7 ± 0.5 cm and 5.8 ± 0.1 mm, respectively) were chosen for the experiment. Seedlings were fully irrigated before being submitted to drought and were randomly assigned to two treatments: (1) control treatment—seedlings were fully irrigated every three or four days and soil water content (by mass) was maintained at 75–80% of the field capacity (n = 40) and (2) drought–rehydration—seedlings received no water as the drought treatment started prior to rehydration. Once the three levels of drought (i.e., PLC50, PLC85, and PLC100, characterized by a reduction in hydraulic conductivity by about 50%, 85%, and 100%, respectively) were achieved, twelve seedlings from each PLC group were randomly selected to restore soil moisture content as much as possible. Seedlings from both control and drought treatments were sampled 0, 10, 20, 30, 40, 50, 60, 70, 75, 80, and 85 days after drought initiation, while rehydrated seedlings were sampled on seven and fifteen days after rehydration. We took samples randomly from different plants at different time points.
2.2. Needle Gas Exchange Measurements
Gas exchange measurements were conducted on newly fully developed needles from three seedlings between 9:00 and 11:00 a.m. on clear days using a portable open-path gas exchange system (Licor-6400, Li-Cor, Lincoln, NE, USA) equipped with a red–blue light source (6400-2B). Needle photosynthetic rate under saturating light (Asat, μmol m−2 s−1), stomatal conductance (gs, mol m−2 s−1), and transpiration rate (E, mmol m−2 s−1) were measured under the following conditions: needle chamber temperature of 25 °C, photosynthetically active radiation of 1200 μmol m−2 s−1, [CO2] of 400 μmol mol−1, and flow rate of 500 mmol s−1. Needle water use efficiency (WUE, μmol mmol−1) was calculated as Asat/E.
2.3. Soil Water Content Measurements
Soil mass water content (SWC) was determined in three pots per treatment by a drying–weighing method. About 10 g of fresh soil was weighed and placed in a clean and dry aluminum box. After drying at 105 °C for 2 h, soil samples were oven-dried at 80 °C for 48 h to a constant weight. Soil dry matter quality (Wd) and SWC were determined using the following equation:
2.4. Needle Relative Water Content Measurements
Needle relative water content (RWC) was determined in the middle and upper functional needles from three randomly selected seedlings per treatment by the drying–weighing method. About 0.1 g of fresh needles were weighed (Wf). After immersing in pure water for 48 h, needles were wiped with absorbent paper and weighed (Wt). After drying at 105 °C for 30 min, needle samples were oven-dried at 80 °C to a constant weight (Wd). RWC was determined using the following equation:
2.5. Biochemical Assays
Malondialdehyde (MDA) was determined using the thiobarbituric acid colorimetric method and superoxide dismutase (SOD) was determined using the nitro blue tetrazolium method [22].
Soluble sugar concentration (SSC) was determined on functional needles from three randomly selected seedlings per treatment using the anthrone method. After drying at 105 °C for 30 min, needle samples were oven-dried at 80 °C to a constant weight. About 0.1 g of a dry tissue was weighed in tubes. About 1.5 mL of 80% ethanol was added and the tissue was homogenized in an ice bath using a refrigerated grinder. After sealing with parafilm, needle samples were put in an ultrasonic bath at 50 °C for 20 min (vibrating every 2 min). After centrifugation at 12,000 rpm for 10 min at room temperature, the supernatant was used to determine SSC with a microplate reader (Suzhou Grace Biotechnology Co., Ltd., Suzhou, Jiangsu province, China. G0501W, G0551W).
Soluble protein concentration (SPC) was determined on functional needles from three randomly selected seedlings per treatment by an enzymatic method. Three repetitions were prepared, each containing about 0.1 g needle tissue. Needle samples were transferred into a grinding tube with grinding beads and 1 mL of extract was added. Tissue was homogenized in an ice bath and subsequently centrifuged at 12,000 rpm at 4 °C for 10 min. Thereafter, 5 μL of supernatant and 200 μL of Coomassie brilliant blue were added. After mixing well, samples were incubated at 60 °C for 30 min and the solution was transferred to a 96-well plate. After preheating for more than 30 min, the absorbance was measured at 562 nm (Suzhou Grace Biotechnology Co., Ltd., Suzhou, Jiangsu province, China. G0418W, G0551W).
2.6. Data Analysis
Data analysis was carried out using SPSS 18.0. In this study, we took samples randomly from different plants at different time points and so samplings were independent across time. During drought and rehydration stages, two-way analysis of variance (ANOVA) was conducted with linear models, treating water treatment and time as fixed factors, to test the main and interactive effects of water treatment and time on all parameters. Duncan’s post hoc tests were then conducted when the interactive effects of water treatment and time were significant. Results were considered significant at p < 0.05. Furthermore, we conducted correlation analyses using Pearson’s correlation analysis and fitted regressions between gas exchange parameters with RWC using a sigmoidal function.
3. Results
3.1. Soil and Needle Water Status Responses
Drought significantly reduced SWC and RWC (p < 0.0001 for both cases), and the interactive effects between water treatment and time were significant (Table 1 and Figure 1). When PLC50 was achieved, SWC and RWC values were reduced by about 66% and 13%, respectively. At PLC85, the two parameters were decreased by about 74% and 35%, respectively, while under the PLC100 treatment they declined by about 75% and 49%, respectively (Figure 1A,C). After the rehydration, SWC at different target drought levels were increased significantly within seven days almost to the control level (Figure 1B). By contrast, recovery of RWC was largely dependent on the severity of drought (Figure 1D). After seven days of rehydration from PLC50, RWC was restored to the control level. Conversely, after rehydration from PLC85 and PLC100, RWC showed a downward trend over time, with the reduction of 60% and 80%, respectively.

Table 1.
Results of two-way ANOVA during the drought and rehydration stages. The degree of freedom, F-value, and p-value are presented.
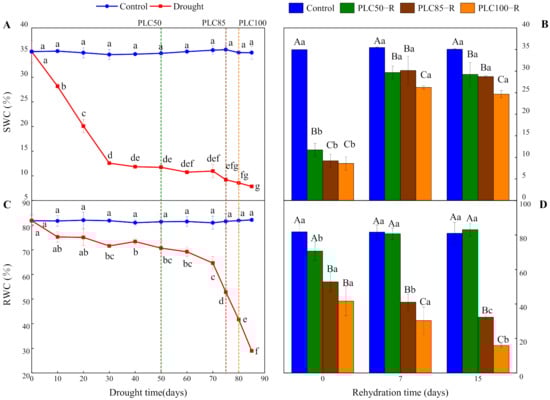
Figure 1.
Dynamics of water content in Pinus massoniana Lamb. seedlings after drought and subsequent rehydration. Panels (A,C) represent the dynamics of SWC and RWC under drought treatment, and panels (B,D) represent the dynamics of SWC and RWC after subsequent rehydration. Different lowercase letters indicate significant differences between sampling dates within the same treatment (p < 0.05), while different capital letters indicate significant differences between treatments on the same sampling date (p < 0.05). Dashed lines represent the time when PLC reached 50% (PLC50, green), 85% (PLC85, brown), or 100% (PLC100, orange), while rehydration (PLC50−R, PLC85−R, and PLC100−R, respectively) followed the achievement of these levels immediately. Values represent means ± SD (n = 3).
3.2. Gas Exchange Responses
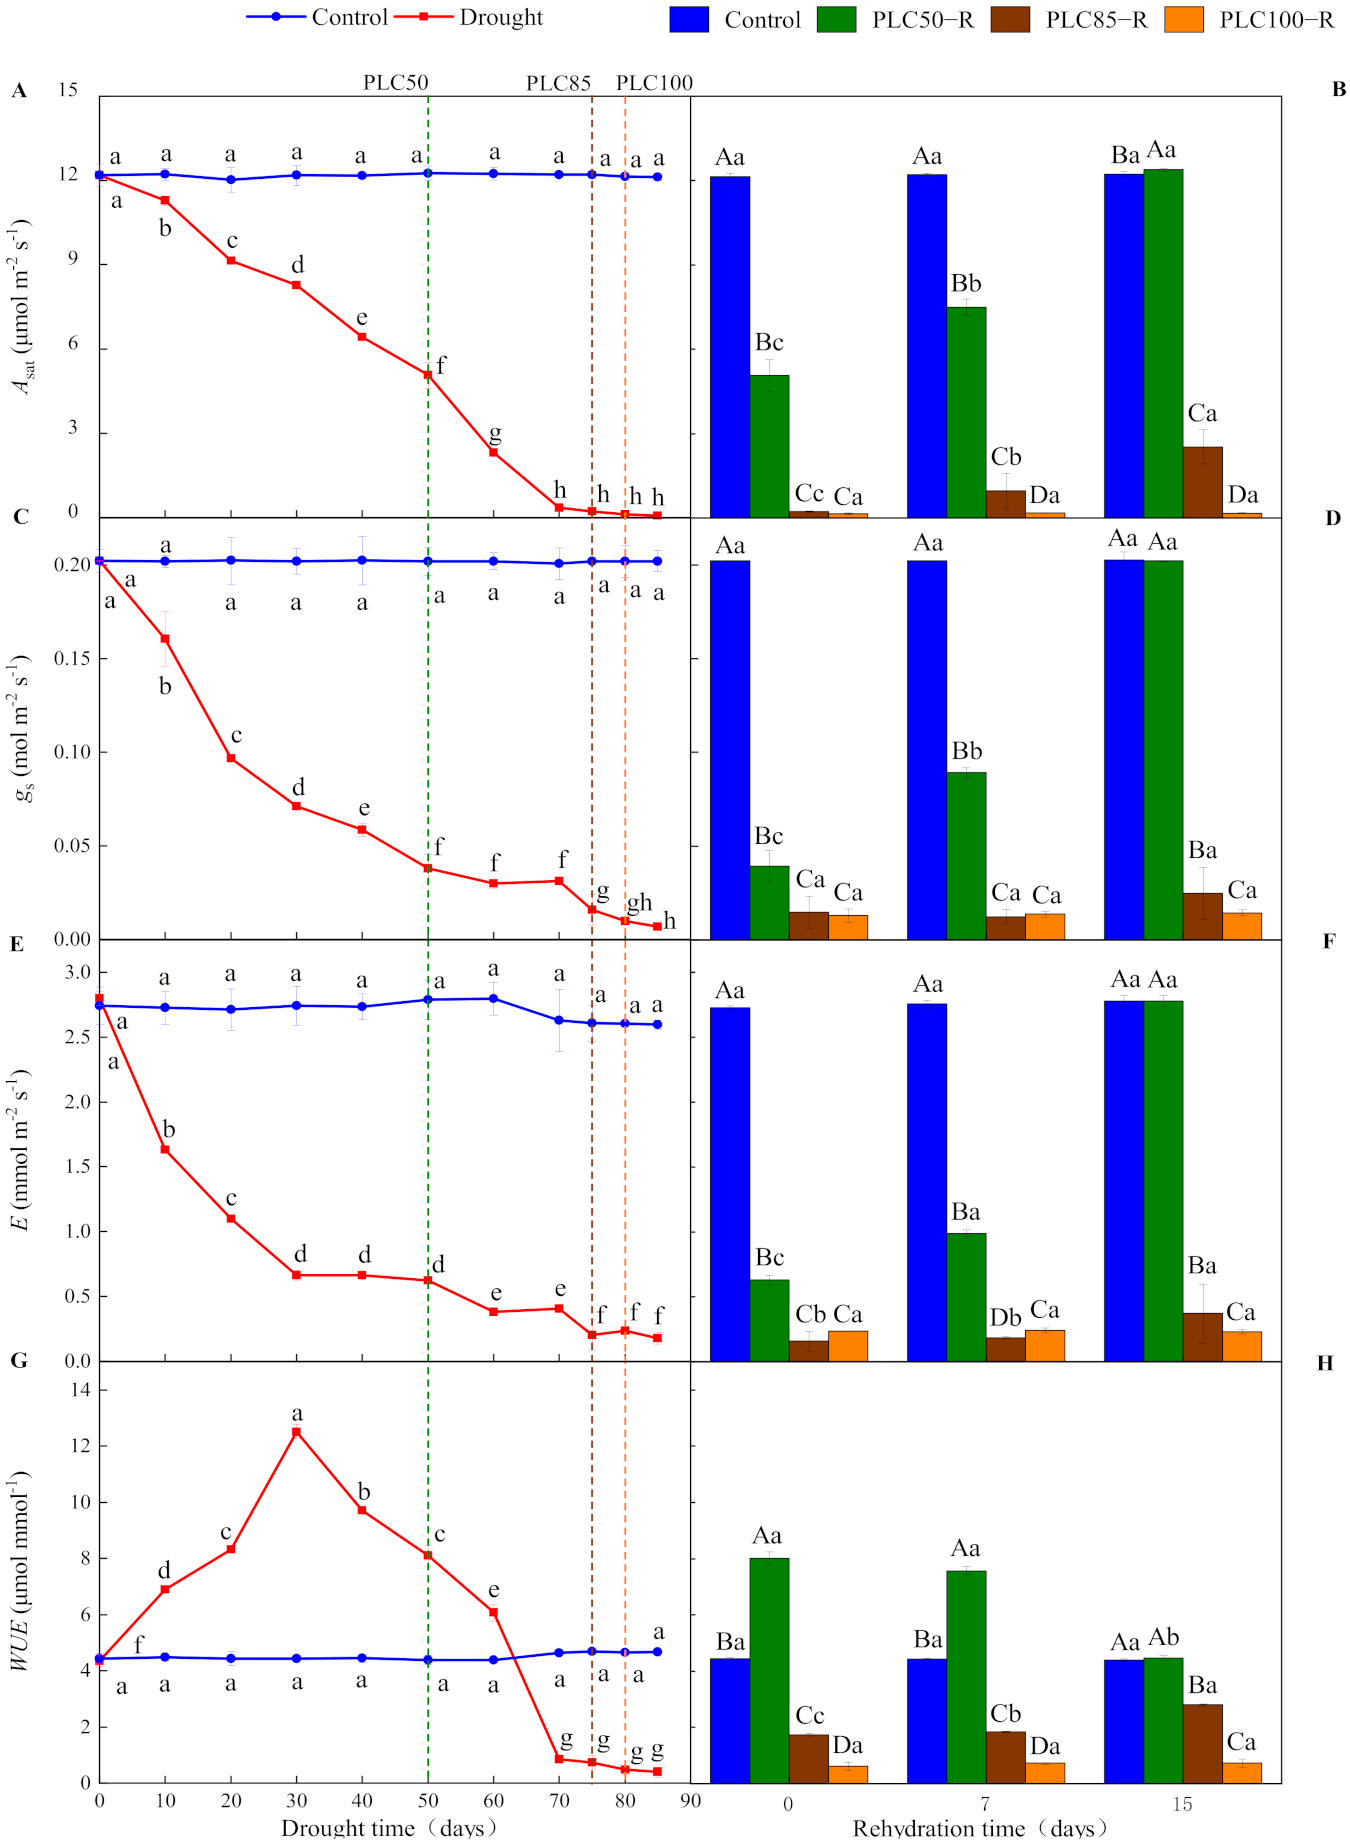
As the soil dried, drought showed significantly negative effects on gas exchange parameters (p < 0.0001 for all cases), leading to declines of Asat, gs, and E and changes in WUE values, with a significant interaction between water treatment and time (Table 1 and Figure 2). When PLC50 was achieved, Asat, gs, and E declined by about 59%, 81%, and 78%, respectively (Table 2 and Figure 2). By contrast, these parameters approached zero when PLC85 was achieved (Figure 2A,C,E). In contrast to these parameters, WUE firstly increased and reached the peak value on Day 30 after drought and then declined. The WUE value increased by about 84% when PLC50 was achieved, while it approached zero under the PLC85 stress (Figure 2G).

Figure 2.
Dynamics in the gas exchange of Pinus massoniana seedlings during drought and subsequent rehydration. Panels (A,C,E,G) represent the dynamics of Asat, gs, E and WUE under drought treatment, and panels (B,D,F,H) represent the dynamics of Asat, gs, E and WUE after subsequent rehydration. Different lowercase letters indicate significant differences between sampling dates within the same treatment (p < 0.05), while different capital letters indicate significant differences between treatments on the same sampling date (p < 0.05). Dashed lines represent the time when PLC reached 50% (PLC50, green), 85% (PLC85, brown), or 100% (PLC100, orange), while rehydration (PLC50−R, PLC85−R, and PLC100−R, respectively) followed immediately. Values represent means ± SD (n = 3).
Table 2.
The percentage differences in drought compared with control at the target drought stress (PLC50, PLC85, and PLC100) and 15 days after rehydration (PLC50−R, PLC85−R, and PLC100−R). “+” means increase, and “−” means decrease. “***” means extremely significant differences between drought and control (p < 0.001).
Seven days after rehydration from PLC50, Asat, gs, and E recovered to 61%, 36%, and 44% of the control values, respectively, but no significant change in WUE was recorded. After 15 days of rehydration, all parameters returned to control levels. By contrast, after 15 days of rehydration from PLC85, Asat was increased to 2.53 μmol m−2 s−1, still much lower than that of the control treatment, while neither gs nor E was recovered significantly (Table 2). Additionally, WUE was increased to 2.8 μmol mmol−1 after 15 days of rehydration. However, these parameters could not be recovered even after 15 days of rehydration from PLC100 (Figure 2B,D,F,H).
3.3. Soluble Sugar and Soluble Protein Responses
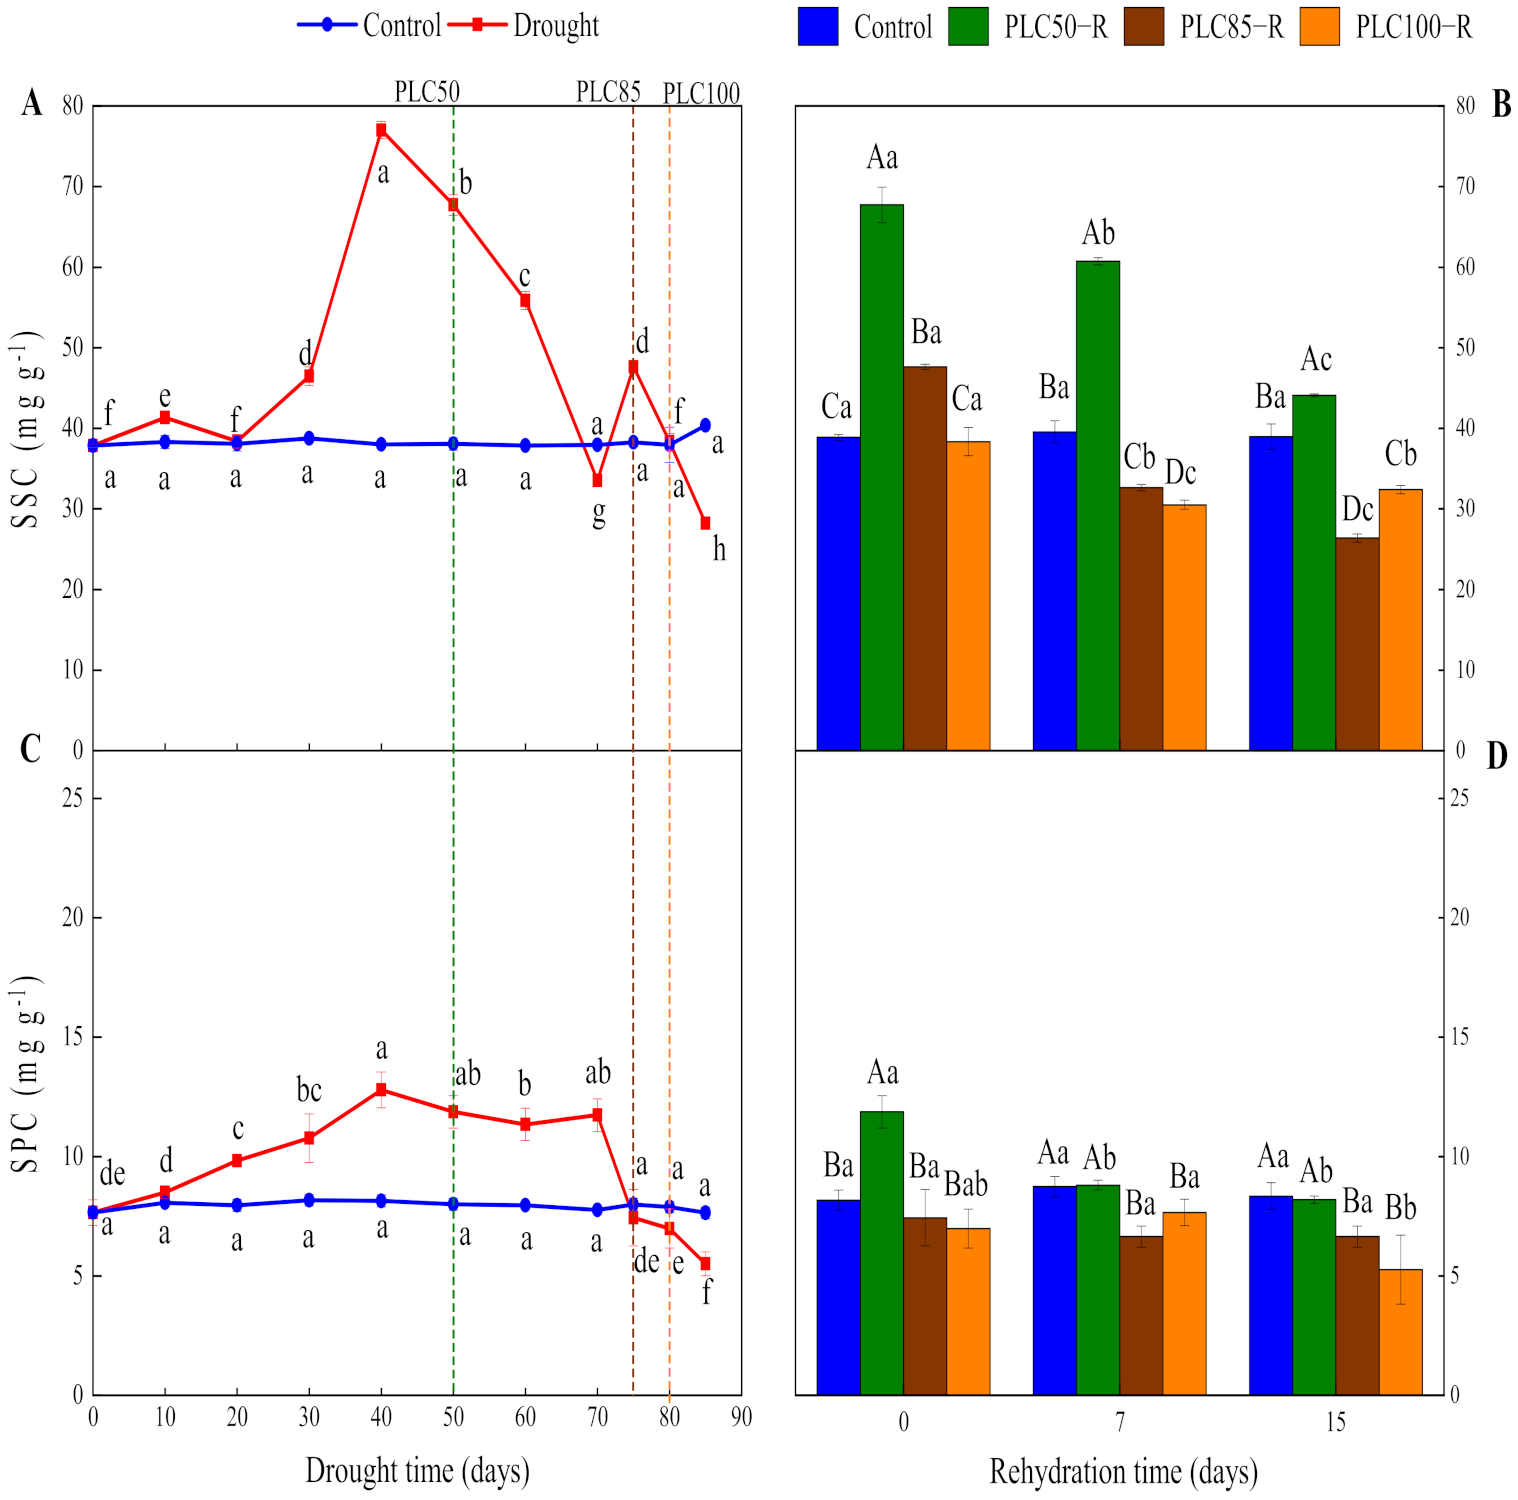
Drought had a significant impact on SSC values and their dynamics (p < 0.0001), and the interactive effects between water treatment and time were significant (Table 1 and Figure 3A). SSC was gradually increased as soil dried and reached the peak value on the Day 40, followed by a decline. When PLC50 was reached, SSC was increased by 78% as compared to control, while it was increased by 24% when reaching PLC85. Conversely, when PLC100 was achieved, no significant difference was observed between drought and control treatments (Figure 3A).
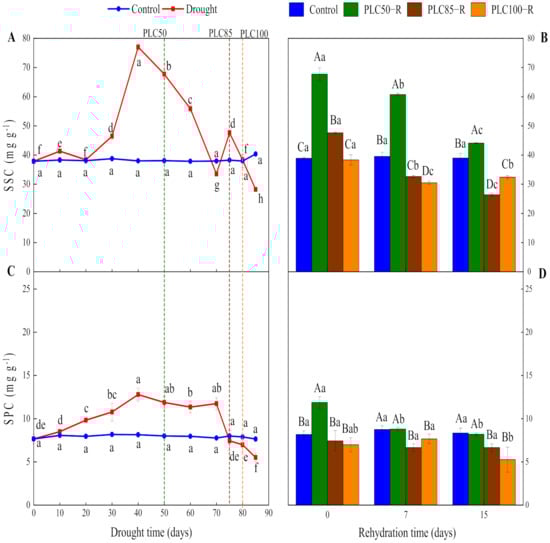
Figure 3.
Dynamics of soluble sugar and soluble protein concentration in Pinus massoniana seedlings after drought and subsequent rehydration. Panels (A,C) represent the dynamics of SSC and SPC under drought treatment, and panels (B,D) represent the dynamics of SSC and SPC after subsequent rehydration. Different lowercase letters indicate significant differences between sampling dates within the same treatment (p < 0.05), while different capital letters indicate significant differences between treatments on the same sampling date (p < 0.05). Dashed lines represent the time when PLC reached 50% (PLC50, green), 85% (PLC85, brown), or 100% (PLC100, orange), while rehydration (PLC50−R, PLC85−R, and PLC100−R) followed immediately. Values represent means ± SDs (n = 3).
The recovery of SSC was largely dependent on the severity of drought. SSC was gradually decreased after rehydration from PLC50 and reached a 13% higher value than control after 15 days, indicating that seedlings had a strong recovery ability. By contrast, after rehydration from PLC85- and PLC100, SSC values were significantly reduced (by 32% and 17%, respectively) after 15 days, as compared to control, indicating that these stressed seedlings had poor recovery ability (Figure 3B).
As the soil dried, SPC showed a fluctuating trend (Table 1 and Figure 3C). SPC showed an increasing trend and reached the peak value from Day 40 to Day 70, followed by a decline. When PLC50 was achieved, SPC was increased by 48% as compared to control (Figure 3C). However, when PLC85 and PLC100 were achieved, SPC values were decreased by only 7% and 12%, respectively. These results indicate that, within a certain degree of drought, P. massoniana seedlings were able to enhance their own osmotic adjustment ability by synthesizing SPC to prevent excessive cell dehydration.
The recovery of SPC was largely dependent on the severity of drought (Table 1 and Figure 3D). After rehydration from PLC50, SPC had strong recovery abilities, being restored to a control level after 7 days. After rehydration from PLC85 and PLC100, SPC values were significantly lower than control values, indicating that SPC could not be recovered in these seedlings.
3.4. Malondialdehyde (MDA) Responses
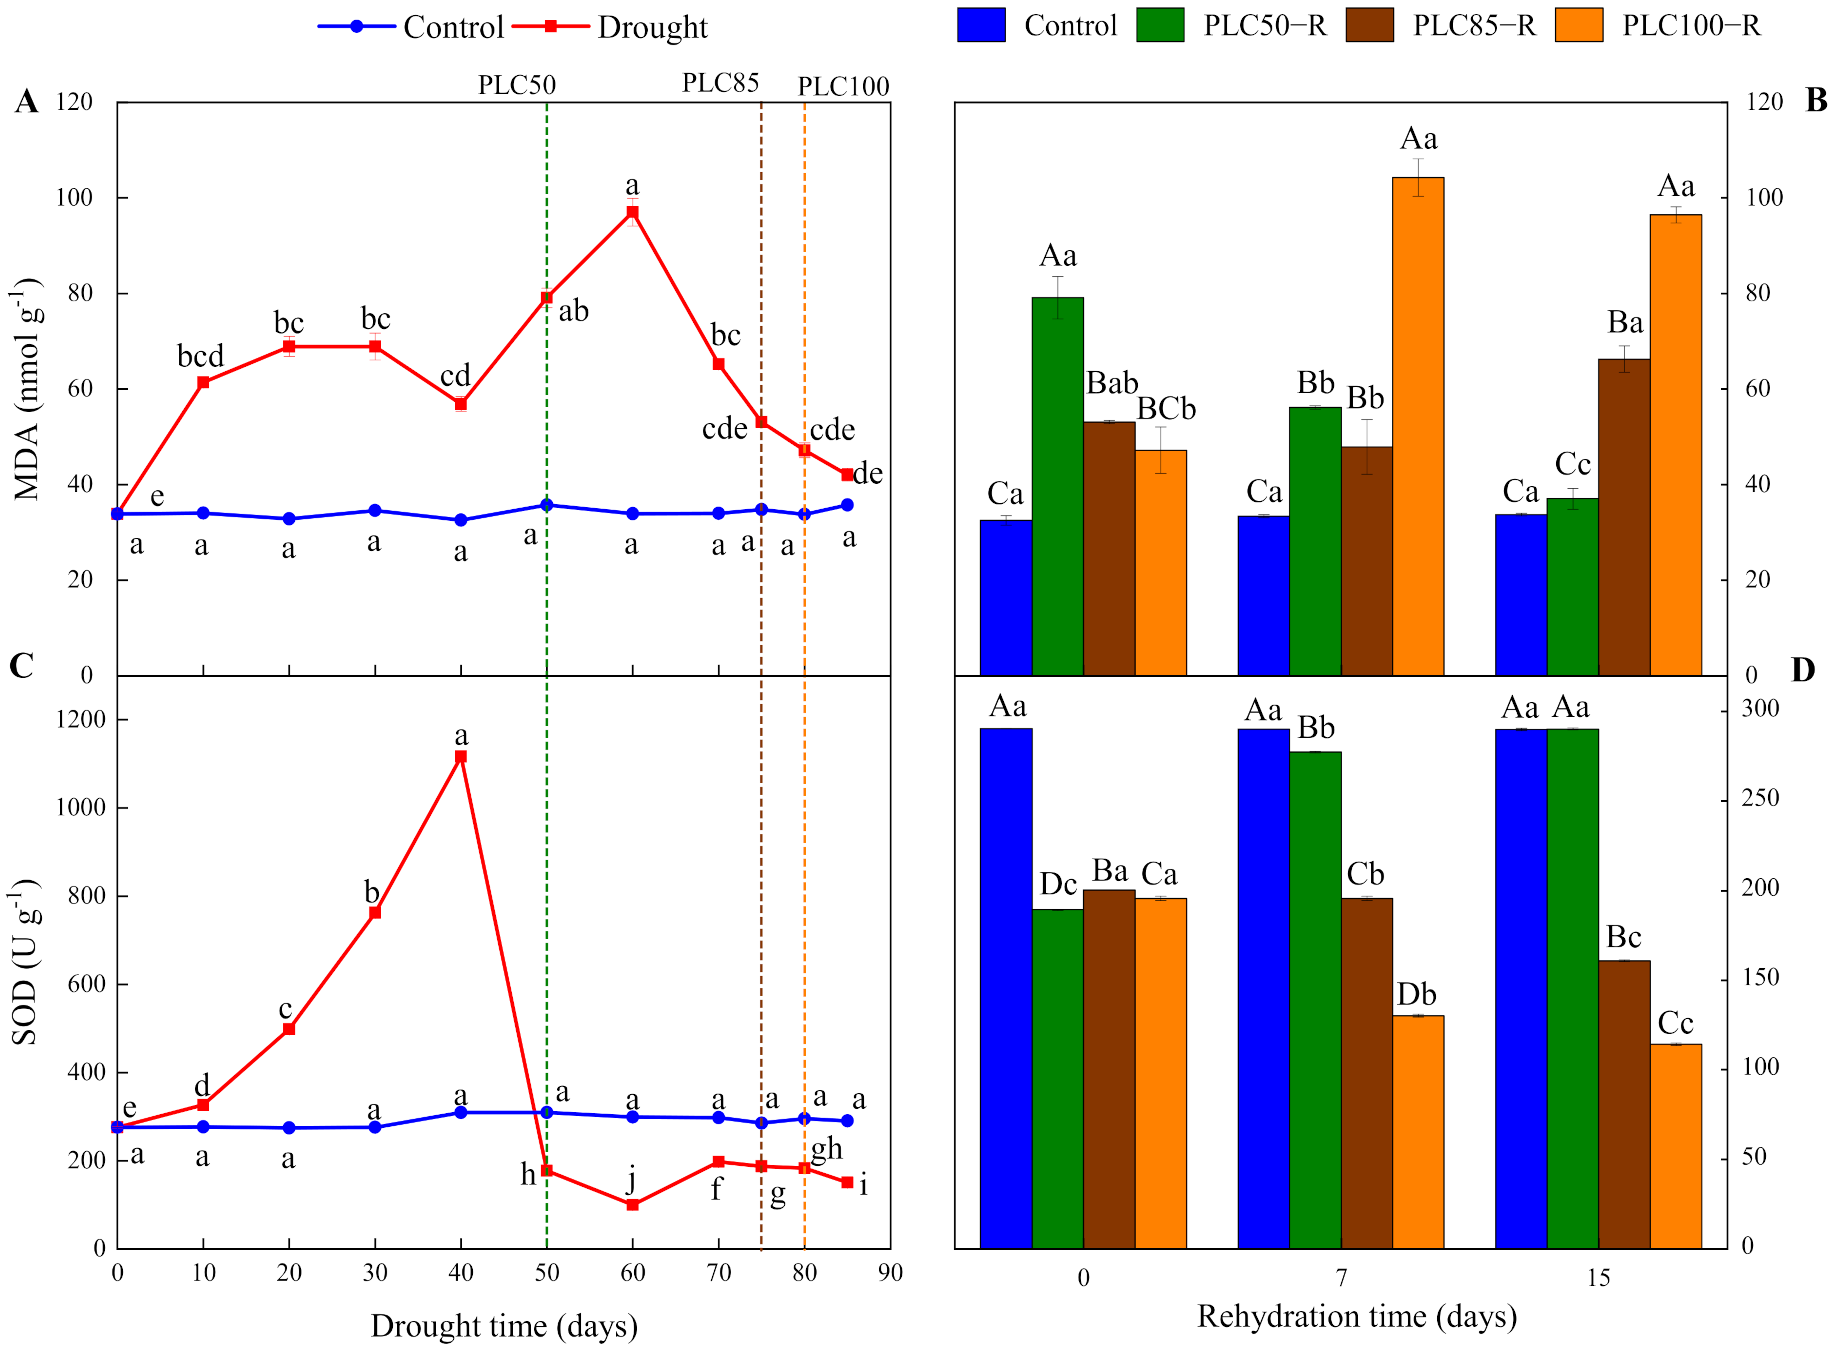
As the soil dried, the dynamic of MDA fluctuated (Table 1 and Figure 4A), reaching the lowest value of 33.82 nmol g−1. During the first 40 days, MDA showed this fluctuating trend, indicating intense metabolic processes related to this compound in P. massoniana. After reaching PLC50, PLC85, and PLC100, MDA was increased by about 55%, 35%, and 28%, respectively, as compared with control (Figure 4A), indicating that cells were severely damaged under these drought conditions.
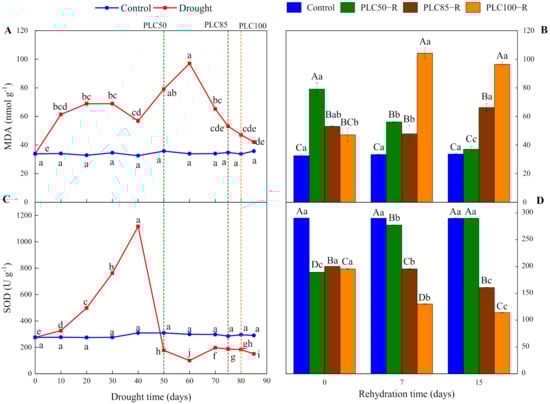
Figure 4.
Dynamics of MDA content and SOD activity in Pinus massoniana seedlings after drought and subsequent rehydration. Panels (A,C) represent the dynamics of MDA and SOD under drought treatment, and panels (B,D) represent the dynamics of MDA and SOD after subsequent rehydration. Different lowercase letters indicate significant differences between sampling dates within the same treatment (p < 0.05), while different capital letters indicate significant differences between treatments on the same sampling date (p < 0.05). Dashed lines represent the time when PLC reached 50% (PLC50, green), 85% (PLC85, brown), or 100% (PLC100, orange), while rehydration (PLC50−R, PLC85−R, and PLC100−R) followed immediately. Values represent means ± SD (n = 3).
After the rehydration, the recovery of MDA was largely dependent on the severity of drought (Table 1 and Figure 4B). After rehydration from PLC50, MDA continued to decrease to the control level after 15 days, indicating that the seedlings had strong resilience. During rehydration from PLC85 and PLC100, MDA were significantly increased, reaching about 96% and 186% of the control value after 15 days, respectively. This suggests a limited ability for recovery.
3.5. Superoxide Dismutase Activity (SOD) Responses
As the soil dried, SOD activity showed a dynamic change, starting with an increase and followed by a decline (Table 1 and Figure 4C). Within 40 days, SOD activity was increased significantly and reached the peak value on Day 40. After reaching PLC50, PLC85, and PLC100, SOD activity was decreased by 43%, 34%, and 38%, respectively, as compared to control (Figure 4C). These results indicate that SOD activity can be maintained at a high level of drought stress. As the soil continued to dry, seedlings suffered continuous damage that weakened the role of SOD.
The recovery of SOD was dependent on the severity of drought (Table 1 and Figure 4D). After rehydration from PLC50, SOD activity was significantly increased and restored to the control level after 15 days. Conversely, after rehydration from PLC85 and PLC100, SOD activity showed a decreasing trend over time, being reduced by 20% and 42%, respectively, after 15 days (Figure 4D).
3.6. Correlations among Parameters
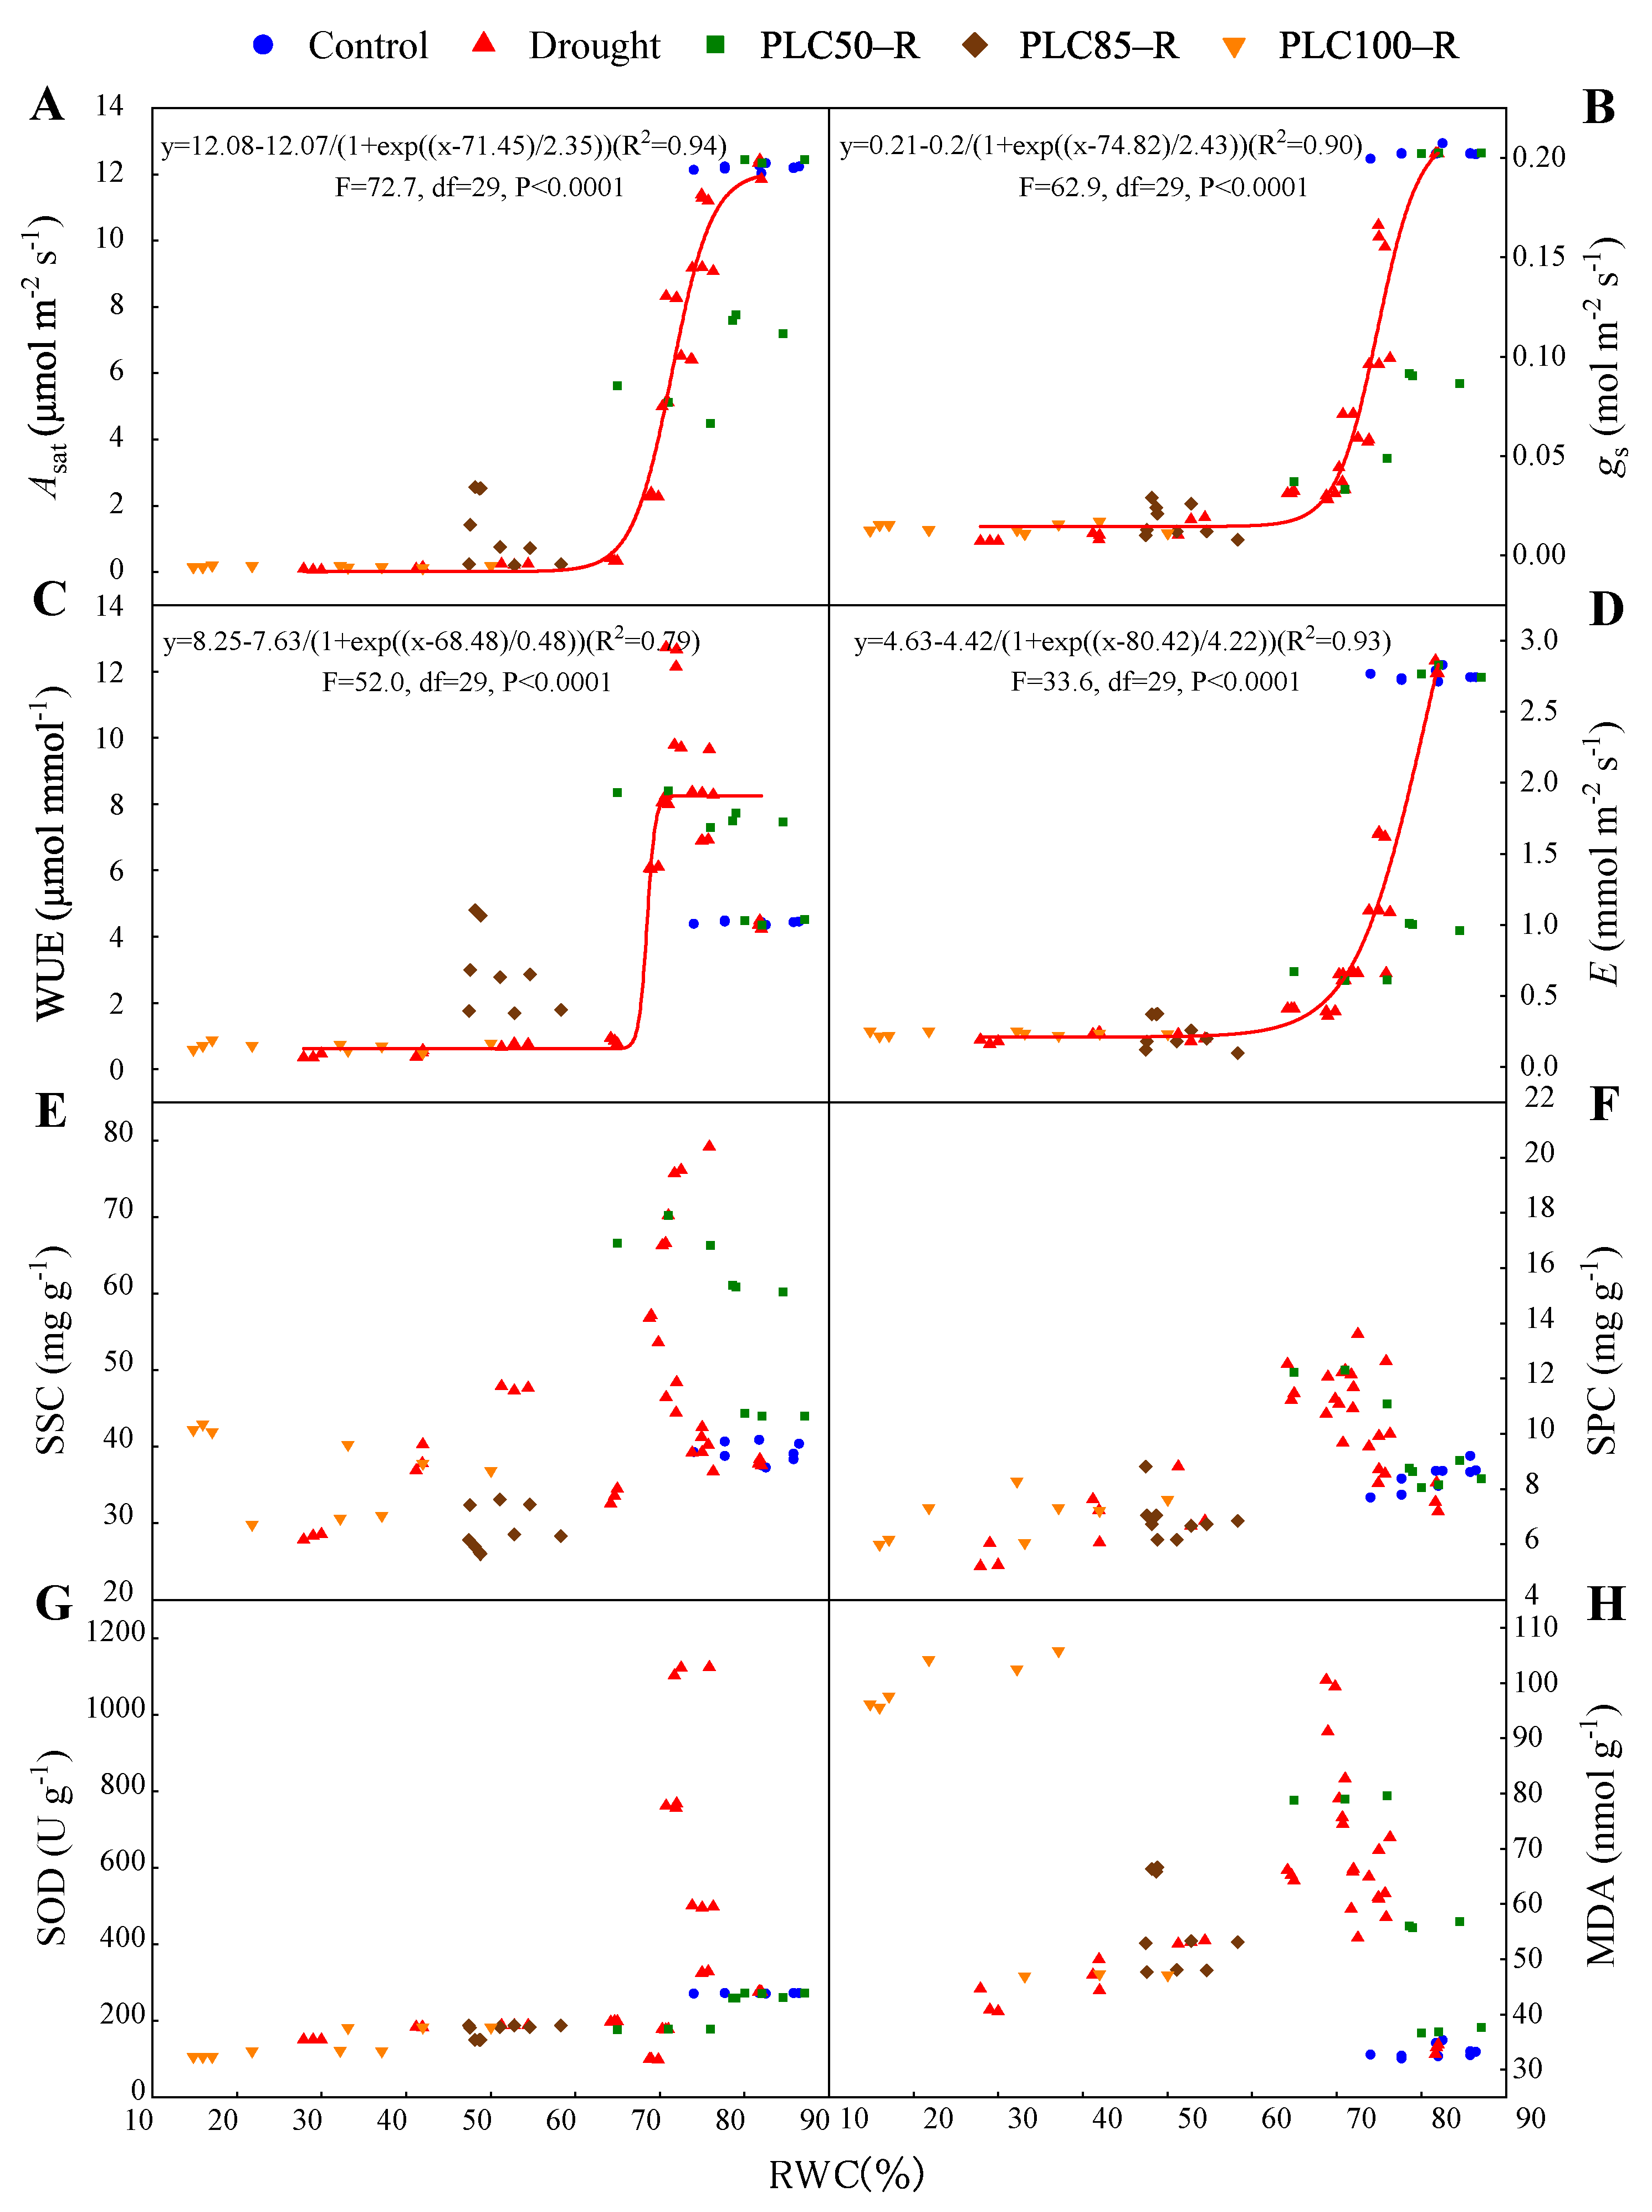
As the drought intensified, some parameters (e.g., Asat, gs, E, and WUE) declined as RWC was decreased, while others did not (Figure 5). In addition, the recovery of these parameters depended on drought severity. All physiological and biochemical parameters were able to return to control levels when drought was not severe (e.g., PLC50), but lost the ability to recover thereafter (i.e., PLC85 and PLC100).
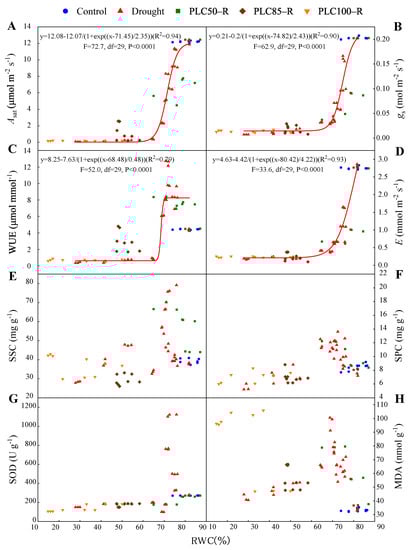
Figure 5.
During drought and rehydration, the photosynthetic rate (Asat) (A), stomatal conductance (gs) (B), water use efficiency (WUE) (C), transpiration rate (E) (D), soluble sugar content (SSC) (E), soluble protein content (SPC) (F), superoxide dismutase (SOD) activity (G), and malondialdehyde (MDA) content (H) are presented as functions of relative water content of needles. Raw data points are shown. Note: the curves were fitted with sigmoidal function only using drought data.
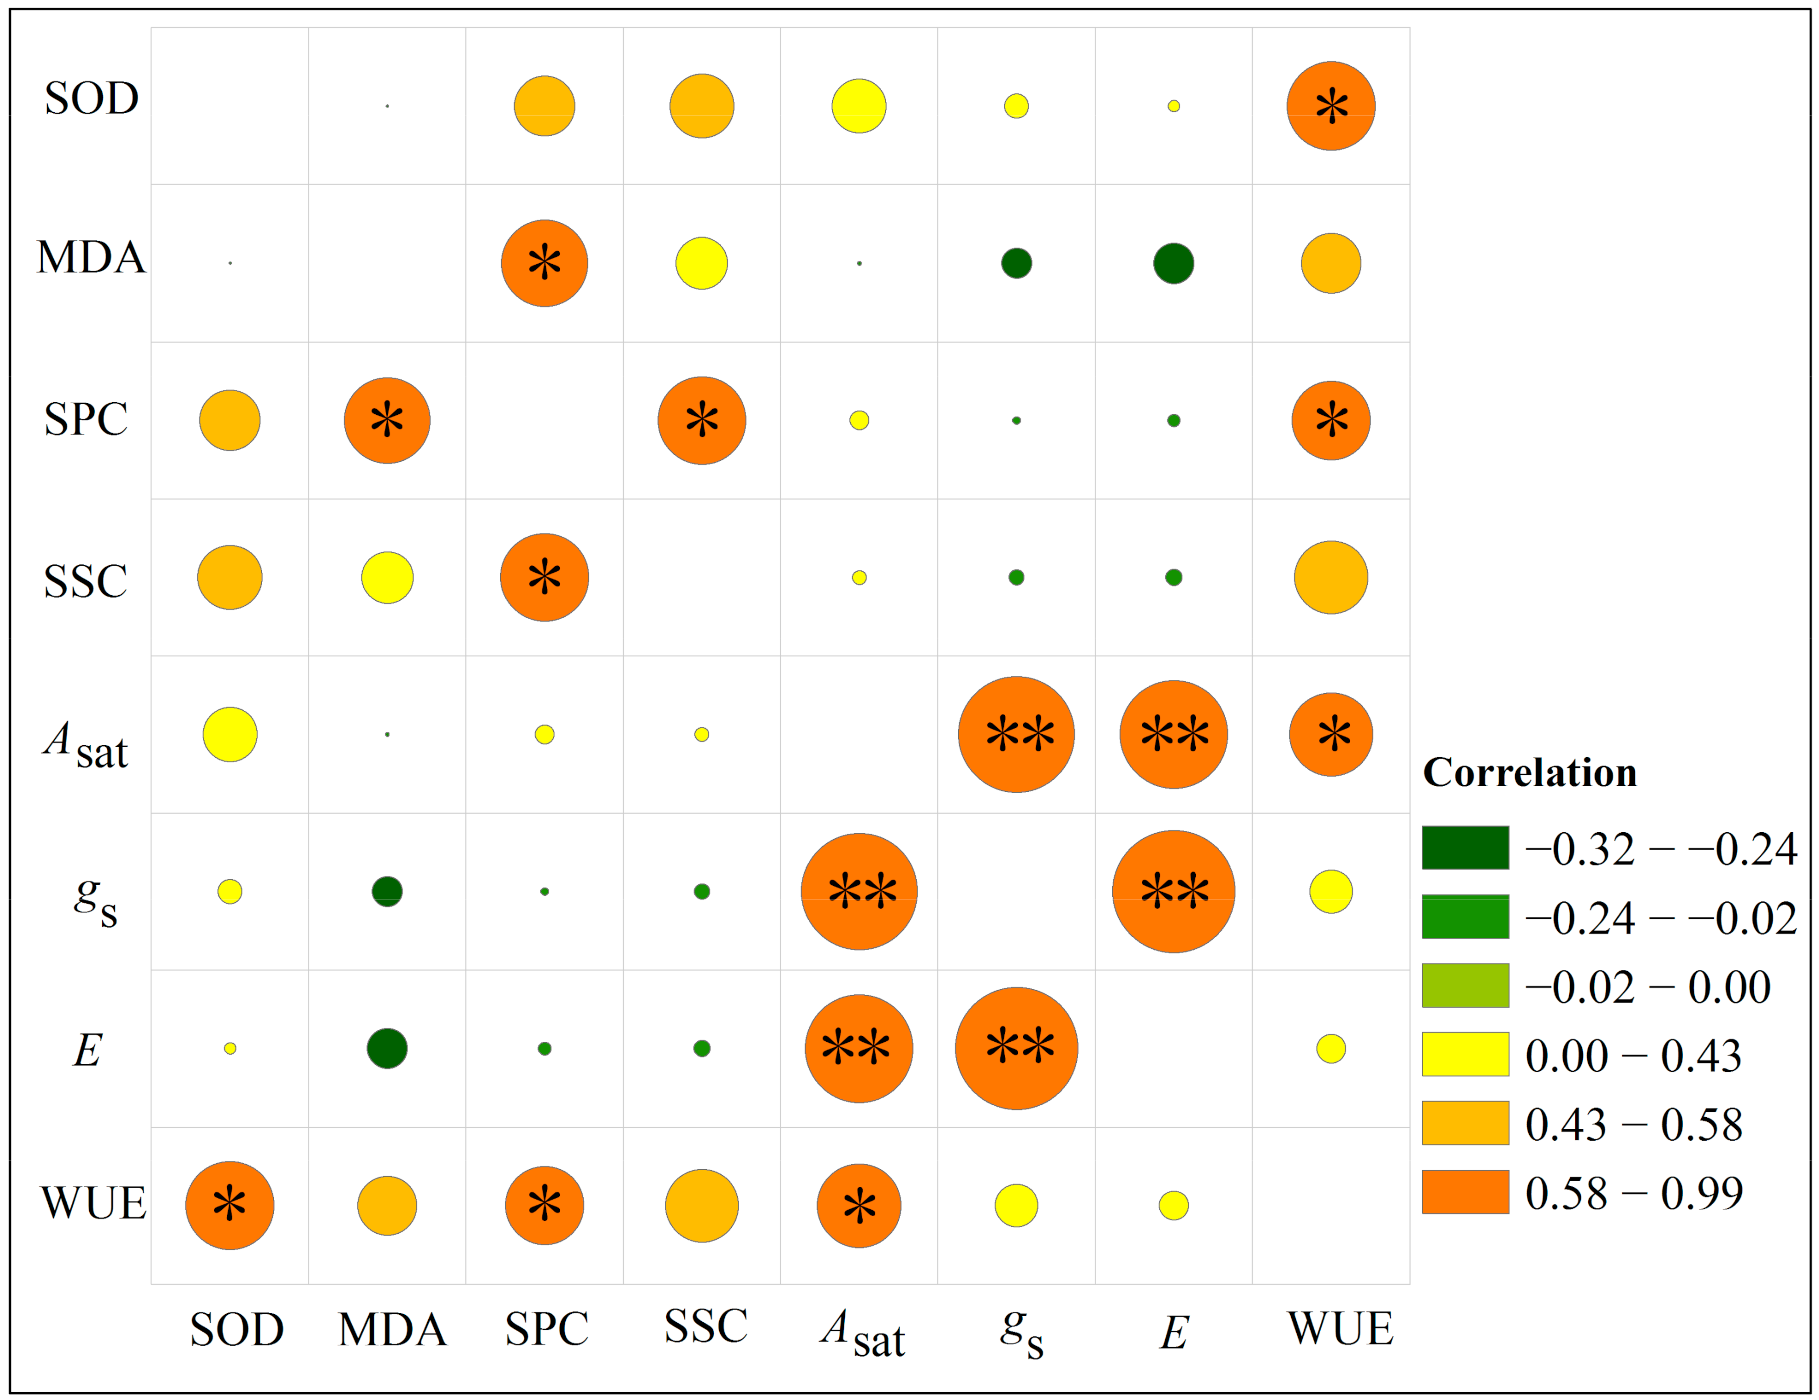
Under drought stress, WUE was significantly positively correlated with Asat, SOD activity, and SPC (p < 0.05). Furthermore, SPC was significantly positively correlated with MDA and SSC (p < 0.05), while Asat had a very significant positive correlation with gs and E (p < 0.01) (Figure 6).

Figure 6.
Correlation analysis of various physiological indicators of Pinus massoniana seedlings under drought stress. *, significantly correlated at the 0.05 level (bilateral); **, significantly correlated at the 0.01 level (bilateral). Under drought stress, WUE was significantly positively correlated with Asat, SOD activity, and SPC (p < 0.05). SPC was significantly positively correlated with MDA and SSC (p < 0.05), and Asat had a very significant positive correlation with both gs and E (p < 0.01).
4. Discussion
Under mild to moderate drought stress, seedlings usually resist drought by promoting stomatal closure [23,24] and reducing plant water transpiration, thereby improving WUE [25]. However, as drought becomes more severe, needle RWC is decreased, leading to more obstacles in physiological functions [26], such as a reduction in WUE, cessation of photosynthesis, and photosynthetic impairment [27,28]. Consistent with these studies, we observed stomata closure, decreased rates of photosynthesis, and fluctuating changes in WUE during drought stress. However, timely rehydration can alleviate the effects of drought on plants. A previous study showed that the photosynthetic rate of Pinus tabulaeformis was reduced under severe drought (SWC between 15% and 20%), but it was recovered to the control level after rehydration [13]. Furthermore, after short-term drought and following rehydration, the photosynthetic rate and stomatal conductance of maize were restored, but under long-term severe drought stress, the photosynthetic capacity was not recovered [29]. By contrast, the present study found that there were different rates of recovery from varying degrees of drought stress, which is ranked as PLC50> PLC85> PLC100. This indicates that the recovery of gas exchange parameters largely depended on the degree of antecedent drought stress. Under short-term or mild drought, seedlings can properly close the stomata and save water for a series of normal physiological activities [30,31]. However, as the degree of drought increases, decreased activities of photosynthetic enzymes and impairment of chloroplast and mesophyll structures [32,33] can lead to physiological dysfunction of seedlings, and ultimately death.
The synthesis and accumulation of osmotic adjustment substances are important for plants to adapt to drought stress [34]. Previous studies have shown that plants often accumulate SSC and SPC to improve osmotic regulation at the early stage of stress. As drought continues, the content of these organic solutes can decrease rapidly in a non-linear manner [35]. For example, leaf SSC of Robinia pseudoacacia was increased under short-term or mild drought, but decreased under severe drought [36]. The present study shows that, as the soil dried, both SSC and SPC were increased at first and subsequently decreased as compared with the control, which is consistent with earlier studies. During mild drought stress, the damage on seedlings is low and photosynthetic capacity can still be maintained, thus accumulating synthesized carbon and SSC in needles. Nonetheless, with progressive drought, seedlings may allocate more soluble sugars to roots to increase the absorption potential, thereby reducing soluble sugars in needles [37]. Furthermore, our study indicates the reduction in SSC and SPC varied with degrees of antecedent drought stress. For instance, SSC and SPC were recovered to the control level after rehydration from PLC50, but SSC continued to decrease after rehydration from PLC85. After rehydration from PLC100, these parameters lost their abilities to recover, which may be due to hydraulic failure in the xylem and damage of membrane integrity [38,39].
The production and removal of free radicals in plants are often in a dynamic balance. Under drought conditions, cells may undergo irreversible membrane lipid peroxidation, which will eventually lead to plant death [40]. Our study indicates that with a prolonged drought, MDA content and SOD activity fluctuated in different patterns. This suggests that drought caused oxidative stress in seedlings, but SOD could offset part of the damage caused by membrane lipid peroxidation in the early stage of stress (<40 d). After 40 days of stress, SOD activity was decreased rapidly. Seedlings usually increase the amounts of osmotic adjustment substances to maintain cell turgor and reduce the damage caused by stress. After PLC85 and PLC100 were reached, all indicators significantly declined and the ability of seedlings to recover was very weak or even absent. Thus, we speculate that the physiological and biochemical processes in these stressed seedlings were disordered, the synthesis of related enzymes was blocked, and the seedlings eventually reached a state of death. Similar conclusions were also reported in a study on southern poplar clones [41].
A key factor of drought-induced physiological dysfunction and plant death is the formation and spread of embolism in the xylem [42,43]. Studies have found that there were also situations where plants can repair the embolism after rehydration, thereby restoring growth [44,45,46]. Consequently, understanding the recovery of seedlings after rehydration with different degrees of embolization can help to evaluate the drought strategies and mortality risk of plants more accurately [46]. Previous studies suggest that the lethal threshold of some gymnosperms (e.g., Pinus pinaster; Pinus taeda) is around PLC50 [47] to PLC80 [48]. The present study provides an additional physiological and biochemical basis for identifying the degree of drought stress on plants and their capacity to recover. Results from the present study show that after being rehydrated from PLC50, the water status of plants was fully restored, the gas exchange parameters were restored to the control level, and the ability to recovery was strong. However, after being rehydrated from PLC85 and PLC100, the recovery of seedlings became weakened, and the recovery degree of physiological and biochemical parameters were minimal, indicating that the ability of seedlings to recover from these stresses is limited.
5. Conclusions
This study is among the first to provide knowledge of the physiological and biochemical dynamics of a gymnosperm species during extreme drought stress and post-drought recovery. Firstly, we found that drought had a significantly negative effect on the gas exchange parameters of P. massoniana seedlings, with gas exchange dropping to zero after reaching PLC85. Secondly, drought altered the SSC, SPC, and SOD activity of seedlings to enhance plant resistance to a certain extent. However, after PLC85 was reached, the biochemical homeostasis of seedlings was broken and they experienced difficulties performing corresponding functions. These observations, combined with the physiological and biochemical consequences of drought and rehydration, indicate that >85% PLC inhibits the capacity of P. massoniana seedlings to recover. Thus, it might be challenging for P. massoniana to cope with drought by adjusting physiological and biochemical responses if the duration and intensity of drought increase due to climate change.
Author Contributions
G.D. and H.D. designed the study; C.S., H.D., X.L., Y.F. and Q.L. conducted the experiment; C.S., H.D., X.L. and G.D. analyzed the results; and C.S. and H.D. wrote the manuscript with input from G.D. All authors have read and agreed to the published version of the manuscript.
Funding
This work was supported by grants from the National Key Research and Development Program of China (2017YFD0600302), the Science and Technology Planning Project of Guizhou Province, China ((2018) 5261), and the Natural Science Talent Funding of Guizhou University (202132).
Institutional Review Board Statement
Not applicable.
Informed Consent Statement
Not applicable.
Data Availability Statement
The data supporting the conclusions of this article will be made available by the authors without undue reservation.
Conflicts of Interest
The authors declare that the research was conducted in the absence of any commercial or financial relationships that could be construed as a potential conflict of interest.
References
- Lucía, D.; Maxime, D.; Frank, C.; Steven, S.; Koen, J.; Tuomas, R.E.M.; Christof, A.M.; Julio, B.; Katarina, C.J.; Gillner, J.; et al. Low growth resilience to drought is related to future mortality risk in trees. Nat. Commun. 2020, 11, 545. [Google Scholar] [CrossRef]
- Tsamir, M.; Gottlieb, S.; Preisler, Y.; Rotenberg, E.; Tatarinov, F.; Yakir, D.; Tague, C.; Klein, T. Stand density effects on carbon and water fluxes in a semi-arid forest, from leaf to stand–scale. For. Ecol. Manag. 2019, 453, 117573. [Google Scholar] [CrossRef]
- Chen, X.; Zhao, P.; Ouyang, L.; Zhu, L.; Ni, G.; Schafer, K.V.R. Whole-plant water hydraulic integrity to predict drought-induced Eucalyptus urophylla mortality under drought stress. For. Ecol. Manag. 2020, 468, 118179. [Google Scholar] [CrossRef]
- Martinez-Vilalta, J.; Anderegg, W.R.L.; Sapes, G.; Sala, A. Greater focus on water pools may improve our ability to understand and anticipate drought-induced mortality in plants. New Phytol. 2019, 223, 22–32. [Google Scholar] [CrossRef] [Green Version]
- Gaylord, M.L.; Kolb, T.E.; McDowell, N.G. Mechanisms of piñon pine mortality after severe drought: A retrospective study of mature trees. Tree Physiol. 2015, 35, 806–816. [Google Scholar] [CrossRef] [Green Version]
- Xiong, S.; Wu, L.; Chen, Y.; Gao, M.; Jiang, X.; Li, Q.; Huang, S.; Wang, Y. Response of white oak seedling leaves from different provenances to drought stress and drought resistance evaluation. Chin. J. Ecol. 2020, 39, 3924–3933. [Google Scholar]
- Duan, H.; Wang, D.; Wei, X.; Huang, G.; Fan, H.; Zhou, S.; Wu, J.; Liu, W.; Tissue, D.T.; Wan, S. The decoupling between gas exchange and water potential of Cinnamomum camphora seedlings during drought recovery and its relation to ABA accumulation in leaves. J. Plant Ecol. 2020, 6, 683–692. [Google Scholar] [CrossRef]
- Zhang, J.; Chen, P.; Sun, X.; Hu, X.; Ji, K. Effects of drought on photosynthesis and related physiology of Pinus massoniana seedlings. Chin. Agric. Sci. Bull. 2021, 37, 32–38. [Google Scholar]
- He, F.; Liu, P.; Wang, L.; Du, L.; Qing, J.; Du, Q.; Du, H. Effects of drought stress and rehydration on physiological characteristics of Eucommia ulmoides seedlings. Acta Phytophysiol. 2021, 57, 661–671. [Google Scholar]
- Wang, F.; Zhang, F.; Gou, X.; Fonti, P.; Xia, J.; Cao, Z.; Wang, Y.; Zhang, J. Seasonal variations in leaf-level photosynthesis and water use efficiency of three isohydric to anisohydric conifers on the Tibetan Plateau. Agric. For. Meteorol. 2021, 308–309, 108581. [Google Scholar] [CrossRef]
- He, W.; Liu, H.; Qi, Y.; Liu, F.; Zhu, X. Patterns in nonstructural carbohydrate contents at the tree organ level in response to drought duration. Glob. Change Biol. 2020, 26, 3627–3638. [Google Scholar] [CrossRef]
- Ouyang, S.; Gessler, A.; Saurer, M.; Hagedorn, F.; Schnbeck, L. Root carbon and nutrient homeostasis determines downy oak sapling survival and recovery from drought. Tree Physiol. 2021, 41, 1400–1412. [Google Scholar] [CrossRef]
- Guo, X.; Peng, C.; Li, T.; Huang, J.; Wang, M. The Effects of Drought and Re-Watering on Non-Structural Carbohydrates of Pinus tabulaeformis Seedlings. Biology 2021, 10, 281. [Google Scholar] [CrossRef]
- Ding, G.J.; Zhou, Z.C.; Wang, Z.R. Masson pine Pulpwood Forest Cultivation and Utilization; China Forestry Publishing House: Beijing, China, 2006. [Google Scholar]
- Yuan, X.; Wang, L.; Wu, P.; Ji, P.; Sheffield, J.; Zhang, M. Anthropogenic shift towards higher risk of flash drought over China. Nat. Commun. 2019, 10, 4661. [Google Scholar] [CrossRef] [Green Version]
- Quan, W.; Ding, G. Changes of volatile substances and endogenous hormones in the needles of Masson pine seedlings under drought stress. For. Sci. 2017, 53, 49–55. [Google Scholar]
- Mo, R.; Ding, G.; Luo, X.; Chen, L. Responses of Pinus massoniana seedlings from different families to persistent drought. J. For. Environ. 2018, 38, 473–480. [Google Scholar]
- Deng, X.; Xiao, W.; Shi, Z.; Zeng, L.; Lei, L. Combined Effects of Drought and Shading on Growth and Non-Structural Carbohydrates in Pinus massoniana Lamb. Seedlings. Forests 2019, 11, 18. [Google Scholar] [CrossRef] [Green Version]
- Deng, X.; Shi, Z.; Xiao, W.; Zeng, L.; Lei, L. Effects of drought and shading on the growth and photosynthetic characteristics of Masson pine seedlings. Acta Ecol. Sin. 2020, 40, 2735–2742. [Google Scholar]
- Zhu, P.; Ma, Y.; Zhu, L.; Chen, Y.; Li, R.; Ji, K. Selection of Suitable Reference Genes in Pinus massoniana Lamb. Under Different Abiotic Stresses for qPCR Normalization. Forests 2019, 10, 632. [Google Scholar] [CrossRef] [Green Version]
- Choat, B.; Brodribb, T.; Brodersen, C.R.; Duursma, R.A.; López, R.; Medlyn, B. Triggers of tree mortality under drought. Nature 2018, 558, 531–539. [Google Scholar] [CrossRef]
- Li, H. The Principle and Technology of Plant Physiology and Biochemistry Experiment; Higher Education Press: Beijing, China, 2000. [Google Scholar]
- Ranjbar, A.; Imani, A.; Piri, S.; Abdoosi, V. Drought effects on photosynthetic parameters, gas exchanges and water use efficiency in almond cultivars on different rootstocks. Plant Physiol. Rep. 2021, 26, 95–108. [Google Scholar] [CrossRef]
- Hasan, M.M.; Gong, L.; Nie, Z.; Li, F.; Ahammed, G.J. ABA-induced stomatal movements in vascular plants during dehydration and rehydration. Environ. Exp. Bot. 2021, 186, 104436. [Google Scholar] [CrossRef]
- Shin-Taro, S.; Yuho, A.; Kenichi, Y.; Hiroyuki, T. Drought Hardening Contributes to the Maintenance of Proportions of Non-Embolized Xylem and Cambium Status during Consecutive Dry Treatment in Container-Grown Seedling of Japanese Cedar (Cryptomeria japonica). Forests 2020, 11, 441. [Google Scholar] [CrossRef]
- Knipfer, T.; Bambach, N.; Hernandez, M.I.; Bartlett, M.K.; Sinclair, G.; Duong, F.; Kluepfel, D.K.; McElrone, A.J. Predicting stomatal closure and turgor loss in woody plants using predawn and midday water potential. Plant Physiol. 2020, 184, 881–894. [Google Scholar] [CrossRef]
- Silva, M.D.A.; Jifon, J.L.; Santos, C.M.D.; Jadoski, C.J.; Silva, J.A.G. Photosynthetic Capacity and Water Use Efficiency in Sugarcane Genotypes Subject to Water Deficit During Early Growth Phase. Braz. Arch. Biol. Technol. 2013, 56, 735–748. [Google Scholar] [CrossRef] [Green Version]
- Duan, H.; Li, Y.; Xu, Y.; Zhou, S.; Liu, J.; Tissue, D.T.; Liu, J. Contrasting drought sensitivity and post-drought resilience among three co-occurring tree species in subtropical China. Agric. For. Meteorol. 2019, 272, 55–68. [Google Scholar] [CrossRef]
- Jia, Y.; Xiao, W.; Ye, Y.; Wang, X.; Liu, X.; Wang, G.; Li, G.; Wang, Y. Response of Photosynthetic Performance to Drought Duration and Re-Watering in Maize. Agronomy 2020, 10, 533. [Google Scholar] [CrossRef] [Green Version]
- Song, X.; Zhou, G.; He, Q. Critical Leaf Water Content for Maize Photosynthesis under Drought Stress and Its Response to Rewatering. Sustainability 2021, 13, 7218. [Google Scholar] [CrossRef]
- Abdalla, M.; Carminati, A.; Cai, G.; Javaux, M.; Ali, A. Stomatal closure of tomato under drought is driven by an increase in soil-root hydraulic resistance. Plant Cell Environ. 2020, 44, 425–431. [Google Scholar] [CrossRef]
- Lawlor, D.W.; Cornic, G. Photosynthetic carbon assimilation and associated metabolism in relation to water deficits in higher plants. Plant Cell Environ. 2010, 25, 275–294. [Google Scholar] [CrossRef] [Green Version]
- Sanchez, M.A.; Gonzalez, G.S.; Aranda, S.M.N.; Rodriguez, R.M.P.; Venema, K.; Palma, J.M.; Corpas, F.J. Loss of function of the chloroplast membrane K+/H+ antiporters AtKEA1 and AtKEA2 alters the ROS and NO metabolism but promotes drought stress resilience. Plant Physiol. Biochem. 2021, 160, 106–119. [Google Scholar] [CrossRef] [PubMed]
- Chen, A.; Sui, X.; Wang, Y.; Jin, G.; Wang, K.; An, S. Effects of drought stress and rehydration on the growth and physiological characteristics of Seriphis yili seedlings. Acta Grassl. 2020, 28, 1216–1225. [Google Scholar]
- Lai, X.; Yan, Y.; Yan, L.; Jiang, L.; Xiang, G. Effects of drought stress on the growth and physiological characteristics of Dalbergia lutea seedlings. J. Northeast For. Univ. 2020, 48, 1–6. [Google Scholar]
- Yang, B.; Peng, C.H.; Zhang, X.; Liu, W.; Duan, M.; Wang, M. Effects of drought stress on leaf nitrogen Concentration, photosynthetic rate and non-structural carbohydrates of Robinia pseudoacacia seedlings. Chin. J. Appl. Environ. Biol. 2019, 25, 1261–1269. [Google Scholar]
- Silva, E.N.; Ferreira-Silva, S.L.; Viégas, R.A.; Silveira, J.A.G. The role of organic and inorganic solutes in the osmotic adjustment of drought-stressed Jatropha curcas plants. Environ. Exp. Bot. 2010, 69, 279–285. [Google Scholar] [CrossRef]
- Falchi, R.; Petrussa, E.; Braidot, E.; Sivilotti, P.; Boscutti, F.; Vuerich, M.; Calligaro, C.; Filippi, A.; Herrera, J.C.; Sabbatini, P. Analysis of Non-Structural Carbohydrates and Xylem Anatomy of Leaf Petioles Offers New Insights in the Drought Response of Two Grapevine Cultivars. Int. J. Mol. Sci. 2020, 21, 1457. [Google Scholar] [CrossRef] [Green Version]
- Mantova, M.; Herbette, S.; Cochard, H.; Torres-Ruiz, J.M. Hydraulic failure and tree mortality: From corre-lation to causation. Trends Plant Sci. 2021, 9, 1360–1385. [Google Scholar] [CrossRef]
- Morar, I.M.T.; González-Orenga, S.; Boscaiu, M.; Plazas, M.; Sestras, A.F.; Prohens, J.; Vicente, O.; Sestras, R.E. Responses to Water Deficit and Salt Stress in Silver Fir (Abies alba Mill.) Seedlings. Forests 2020, 11, 395. [Google Scholar]
- Duan, Q.; Tian, Y.; E, X.; Qin, G.; Zhang, J. Gender differences in the growth and physiological characteristics of southern black poplar in response to continuous drought and rehydration. Chin. J. Ecol. 2020, 39, 2140–2150. [Google Scholar]
- Johnson, K.M.; Brodersen, C.R.; Carins-Murphy, M.R.; Choat, B.; Brodribb, T.J.; Timothy, J. Xylem embolism spreads by single-conduit events in three dry forest angiosperm stems. Plant Physiol. 2020, 184, 212–222. [Google Scholar] [CrossRef]
- John, S.S.; David, M.L. What plant hydraulics can tell us about responses to climate-change droughts. New Phytol. 2015, 207, 14–27. [Google Scholar]
- Liu, J.; Gu, L.; Yu, Y.; Huang, P.; Wu, Z.; Zhang, Q.; Qian, Y.; Wan, X. Corticular photosynthesis drives bark water uptake to refill embolized vessels in dehydrated branches of Salix matsudana. Plant Cell Environ. 2019, 42, 2584–2596. [Google Scholar] [CrossRef]
- Holmlund, H.I.; Pratt, R.B.; Jacobsen, A.L.; Davis, S.D.; Pittermann, J. High-resolution computed tomography reveals dynamics of desiccation and rehydration in fern petioles of a desiccation-tolerant fern. New Phytol. 2019, 224, 97–105. [Google Scholar] [CrossRef]
- Klein, T.; Melanie, J.B.Z.; William, R.L.A.; Bloemen, J.; Martin, G.D.K.; Hudson, P.; Nadine, K.R.; Thomas, L.P.; Arx, G.; Nardini, A. Xylem embolism refilling and resilience against drought-induced mortality in woody plants: Processes and trade-offs. Ecol. Res. 2018, 33, 839–855. [Google Scholar] [CrossRef]
- Choat, B. Predicting thresholds of drought-induced mortality in woody plant species. Tree Physiol. 2013, 33, 669–671. [Google Scholar] [CrossRef] [Green Version]
- Hammond, W.M.; Yu, K.; Wilson, L.A.; Will, R.E.; Anderegg, W.R.L.; Adams, H.D. Dead or dying? Quantifying the point of no return from hydraulic failure in drought-induced tree mortality. New Phytol. 2019, 223, 1834–1843. [Google Scholar] [CrossRef] [Green Version]

Publisher’s Note: MDPI stays neutral with regard to jurisdictional claims in published maps and institutional affiliations. |
© 2022 by the authors. Licensee MDPI, Basel, Switzerland. This article is an open access article distributed under the terms and conditions of the Creative Commons Attribution (CC BY) license (https://creativecommons.org/licenses/by/4.0/).