Abstract
Chosenia arbutifolia (Pall.) A. Skv. is a unique and endangered species belonging to the Salicaceae family. It has great potential for ornamental and industrial use. However, human interference has led to a decrease in and fragmentation of its natural populations in the past two decades. To effectively evaluate, utilize, and conserve available resources, the genetic diversity and population structure of C. arbutifolia were analyzed in this study. A total of 142 individuals from ten provenances were sampled and sequenced. Moderate diversity was detected among these, with a mean expected heterozygosity and Shannon’s Wiener index of 0.3505 and 0.5258, respectively. The inbreeding coefficient was negative, indicating a significant excess of heterozygotes. The fixation index varied from 0.0068 to 0.3063, showing a varied genetic differentiation between populations. Analysis of molecular variance demonstrated that differentiation accounted for 82.23% of the total variation among individuals, while the remaining 17.77% variation was between populations. Furthermore, the results of population structure analysis indicated that the 142 individuals originated from three primitive groups. To provide genetic information and help design conservation and management strategies, landscape genomics analysis was performed by investigating loci associated with environmental variables. Eighteen SNP markers were associated with altitude and annual average temperature, of which five were ascribed with specific functions. In conclusion, the current study furthers the understanding of C. arbutifolia genetic architecture and provides insights for germplasm protection.
1. Introduction
The Salicaceae family comprises over 300 species of trees and shrubs found across China and it is generally classified into three genera, namely Populus, Salix, and Chosenia [1]. Interestingly, the genus Chosenia is monotypic and contains only Chosenia arbutifolia (Pall.) A. Skv., which is distributed in the Greater and Lesser Khingan Mountains, the Changbai Mountains, and the montane regions of eastern Liaoning Province [1]. As an ancient tree species, C. arbutifolia was considered a transitional form between the divergence from Populus to Salix and was segregated into a separate genus by some botanists [2,3]. In Northeast China, C. arbutifolia serves primarily as landscape planting element, owing to its unique characteristics, including fast growth, frost tolerance, majestic architecture, beautiful shape, and scarlet branches. Moreover, as an important wood source, C. arbutifolia is also utilized for construction, furniture, and paper production [4]. The nature populations of C. arbutifolia have drastically decreased due to their weak regenerative capacity, unreasonable deforestation, and over-utilization, leading to the plant’s recognition as a class II endangered species listed in the National Key Protected Wild Plants.
As the most important determinant of biodiversity, genetic diversity is driven by mutations, natural selection, and other factors that are fundamental for species evolution and adaption [5]. The level of genetic diversity indicates the adaptive ability to environmental changes and is a decisive factor for the long-term survival of species, especially for tree species with long life spans [6,7]. Therefore, the evaluation of genetic diversity and population structure is of major theoretical and practical significance for the management, development, utilization, and conservation of plant germplasms. Thus far, various efforts have been made to determine the genetic diversity and population structure of many common tree species, such as eucalypts [8], Chinese elm [9], oak [10], some fruit trees [11,12], and conifer species [13,14,15]. Furthermore, Salicaceae species, including Populus nigra L. [16], Populus tomentosa Carr. [17], Populus deltoids Bartr. [18], Populus euphratica Oliv. [19], Populus trichocarpa Torr. & Gray [20], Salix viminalis L. [21], Salix psammophila C. [22], Salix purpurea L. [23,24], and Salix alba L. [25], have been extensively characterized.
Despite its endangered status and environmental significance, genetic and genomic resources available for C. arbutifolia are scarce, with previous research having mainly focused on biological habitat, growth traits, breeding techniques, and transcriptome [26,27,28]. Furthermore, only one report exploring the phylogeography and population structure of C. arbutifolia in Japan through the analysis of chloroplast DNA markers has been published [29]. Therefore, the available genetic markers for C. arbutifolia are still insufficient compared to those for other Salicaceae species. In this study, a large number of single nucleotide polymorphism (SNP) markers were identified through specific locus amplified fragment sequencing (SLAF-seq). Moreover, the genetic diversity and population structure of ten C. arbutifolia populations were evaluated in order to determine the evolutionary history of C. arbutifolia species in Northeast China. Landscape genomics analysis was also performed to investigate the loci potentially under selection.
2. Materials and Methods
2.1. Plant Materials and DNA Extraction
A total of 142 C. arbutifolia plants from ten populations in Jilin Province and Heilongjiang Province in China were investigated (Figure 1). For each population, 10–15 individuals were collected, at least 50 m apart from each other (Table 1). The twigs of each plant were cut and brought back to the laboratory for water planting. Young leaves of all individuals were sampled and subjected to DNA isolation using a DNA extraction kit (DP305, Tiangen Biotech Co. Ltd., Beijing, China). The quality and concentration of isolated DNA were then assessed through electrophoresis in 0.8% agarose gels and Nanodrop (Thermo Fisher Scientific, Wilmington, DE, USA).
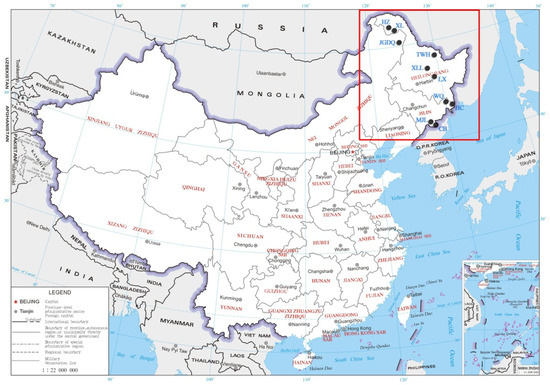
Figure 1.
Locations of ten C. arbutifolia (Pall.) A. Skv. populations in Northeast China.

Table 1.
Details of provenances.
2.2. Librarary Construction and SLAF Sequencing
Since the whole genome of C. arbutifolia has not been published, the reference genome of P. euphratica was chosen to conduct marker discovery survey in silico by various restriction enzymes. Finally, the combination of restriction enzymes Rsal and Hae III was determined, and the genome information of Oryza sativa Indica (genome size 374.30 Mb, http://rapdb.dna.affra.go.jp/, accessed on 15 November 2019) was selected as a control to evaluate the quality of enzyme digestion. After digestion, a single nucleotide (A) was added to the 3′-end using dATP and ligated with dual-index adapter. The diluted restriction-ligation DNA was used as the template for PCR amplification. Then the length of restriction fragment was defined from 264 bp to 364 bp using SLAF tags. High-throughput sequencing was performed on an Illumina HiSeq 2500 platform (Illumina, Inc.; San Diago, CA, USA) at Beijing Biomarker Technologies Corporation (Beijing, China).
2.3. SLAF Tag Development and SNP Calling
After identification, filtering, inspection, and evaluation of the raw data generated via sequencing, high-quality reads were clustered based on sequence similarity, wherein different SLAF tags with over similarity above 90% among individuals were defined as polymorphic. The sequencing reads were aligned onto the reference sequence with the greatest sequencing depth of each SLAF tag using bwa software [30]. GATK [31] and Samtools [32] were used for SNP calling. Finally, the overlapping results of the two methods were considered as reliable SNPs and filtered based on integrity >0.8 and a minor allele frequency >0.5.
2.4. Genetic Diversity and Population Structure Analyses
The diversity indexes for each population including observed allele number (No), expected allele number (Ne), expected heterozygousity (He), Nei’s diversity index (H), Shannon-Wiener index (I), and polymorphic information content (PIC) were determined using GenAlex 6.5 [33]. To evaluate the differentiation within or among populations, the index of inbreeding coefficient (FIS), pairwise genetic differentiation index (FST), and analysis of molecular variance (AMOVA) were estimated using Arlequin 3 [34]. The software MEGA X was used for phylogenetic tree construction based on the neighbor-joining algorithm under the parameter model of Kimura 2 and 1000 bootstrap replicates. The software Admixture [35] based on maximum-likelihood method was used for population structure analysis. The number of populations (K) was set from 1 to 10 for clustering, and each individual was assigned to its respective populations according to the maximum membership probability.
2.5. Analysis of Environmental Adaptive Loci
The altitude data of each provenance were monitored using a portable GPS (HOLUX GR-260). The annual average temperature was accessed through the website of the National Meteorological Science Data Center (http:data.cma.cn, accessed on 20 December 2019). The Bayevn2 [36] program was employed for screening outlier loci potentially associated with the two environmental variables. A covariance matrix of allele frequencies was calculated across populations using the full set of SNPs to avoid population-specific effects. Consequently, the Bayes Factor (BF) and nonparametric Spearman’s rank correlation coefficient (ρ) were derived via the Markov Chain Monte Carlo (MCMC) method. The top 1% rank values of log10BF and ρ were adopted as thresholds to determine potential markers of environmental adaptability in this study. Furthermore, the putative function of these candidate markers sequences were identified using the Basic Local Alignment Search Tool (BLAST) in NCBI.
3. Results
3.1. SLAF Tags and SNP Calling
A total of 424.88 Mb reads were generated via high-throughput SLAF-seq of the 142 C. arbutifolia individuals, with a mean Q30 value of 96.07% and an average GC content of 42.47% (Table 2). The most SLAF tags were obtained from the TWH provenance (mean 157,987.50 for each individual) and the least were found for the WQ provenance (mean 101,985.60 for each individual). The sequencing depth for provenances ranged from 27.91× (CB provenance) to 16.28× (TWH provenance), with an average depth of 23.11×. In total, 1,188,126 SLAF tags were obtained, of which 211,848 were polymorphic and utilized for SNP calling. After mapping to the reference genome, 1,164,285 SNPs were screened. The number of SNPs for each provenance varied from 313,515.77 (LX) to 223,295.27 (WQ), with an average of 264,633.74 (Table 2). Moreover, there were slight differences in the heter ratio (mean 8.82) and integrity (mean 22.72) of SNPs among each provenance. Finally, a total of 105,857 SNPs were selected for the evaluation of C. arbutifolia populations.
Table 2.
Statistics of SLAF tags and SNP markers for different provenances of Chosenia arbutifolia (Pall.) A. Skv.
3.2. Genetic Diversity and Genetic Differentiation
As shown in Table 3, all the No were the same (No = 2), and Ne was also quite similar (mean 1.5964) between provenances. The He varied from 0.3559 (WQ) to 0.3428 (CB), with an average value of 0.3505. The values of H and I ranged from 0.3708 (HC) to 0.3570 (CB) and 0.5324 (WQ) to 0.5158 (CB), with averages of 0.3661 and 0.5258, respectively. Slight differences between PIC values (mean 0.2810) were detected across the ten populations. However, all FIS values were negative, with the highest value determined for the MJL provenance and the lowest for the CB provenance.
Table 3.
Genetic diversity of the ten Chosenia arbutifolia populations.
As a measurement of genetic differentiation across populations, the FST presented in Table 4 indicated significant variation between different C. arbutifolia provenances. The highest FST value was detected between the XL and CB provenances (0.3063), followed by that between the JGDQ and CB provenances (0.3005). The lowest FST value was observed between XL and HZ provenances (0.0068). As described in Table 5, AMOVA revealed that the differentiation among individuals accounted for 82.23% of the total variation, while the remaining 17.77% was variation among populations.
Table 4.
Pairwise differentiation (FST) among provenances of Chosenia arbutifolia.
Table 5.
Analysis of molecular variance of the ten Chosenia arbutifolia provenances.
3.3. Popalution Structure and Phylogenetic Relationships
As demonstrated in Figure 2a, the optimum K value was 3, which indicated that all 142 C. arbutifolia individuals originated from three primitive groups. Furthermore, as shown in Figure 2b, group 1 (green pool) included 69 individuals (48.59%), which were from those in the LX (13 individuals), XLL (15 individuals), HC (15 individuals), WQ (15 individuals), TWH (10 individuals), and HZ (1 individual) provenances. Group 2 (yellow pool) consisted of 43 individuals (30.28%), which were mainly from the JGDQ (15 individuals), XL (15 individuals), HZ (13 individuals) provenances. The remaining 30 individuals (21.13%) originating from the CB (15 individuals) and MJL (15 individuals) provenances were also merged into group 3 (gray pool).
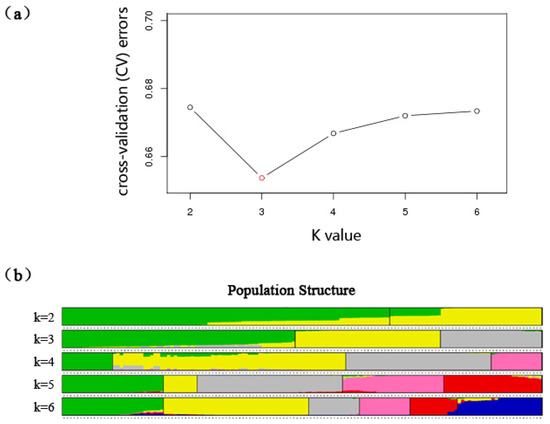
Figure 2.
Rational group number and population structure of Chosenia arbutifolia. (a) The optimal K value estimated via Admixture; (b) Population structure for the 142 Chosenia arbutifolia individuals. The green, yellow, and gray colors represent group 1, group 2, and group 3 when K = 3, respectively.
An NJ tree was constructed for the 142 C. arbutifolia individuals (Figure 3a). Interestingly, except for plants from the CB population, individuals originating from the same population could not be clustered into a single clade. A dendrogram based on the ten populations was also established (Figure 3b). Similar to Figure 3b, the CB population had a relatively distant genetic relationship with the other nine populations. In general, populations located closely based on geographical distance were also divided into the same subclade. For instance, WQ and HC were both in Jilin province, TWH and LX were both in the lesser Khingan Mountains area, and JGDQ with XL were both in the greater Khingan Mountains area (Figure 1).
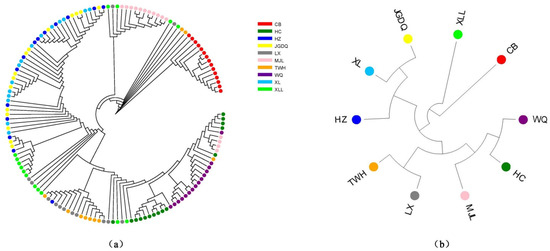
Figure 3.
Phylogenetic tree of Chosenia arbutifolia. (a) The dendrogram was constructed at the level of individuals and (b) based on populations.
3.4. Association Analysis of Environmental Variables
In total, 18 SNP markers associated with different environmental variables were identified, of which seven were closely related to altitude, while the other 11 were significantly correlated with the annual average temperature (Table 6). Of these 18 marker sequences, eight had successful hits against the NCBI database, of which three were related with altitude, including Dicer-like (DCL) protein, mitogen-activated protein kinase (MAPK), and prefoldin subunit 5 (Table 7). The other three markers were related to annual average temperature, including the uncharacterized LOC118052887, sulfite oxidase, and hippocampus abundant transcript-like protein (Table 7). The last two sequences (marker54369 and marker67792) had no function, but were quiet similar to the sequences of P. trichocarpa. All the annotated putative genes originated from Populus alba L. and P. euphratica.
Table 6.
Summary of candidate SNP markers associated with two different environmental variables.
Table 7.
Sequence alignment of the candidate SNP markers for functional identification.
4. Discussion
As the most important determinant of biodiversity, genetic diversity can be studied at different levels, including population, individual, tissue and organ, or the molecular level. Highly variable genetic markers, such as SSRs and SNPs, facilitate the evaluation of genetic diversity within and between populations. However, population size is a critical factor that can have a significant influence on the accuracy of genetic parameters [37]. Due to unreasonable deforestation, the distribution range of natural C. arbutifolia in China is being continuously reduced, thus decreasing the number of individual plants available for collection, which in turn accounts for the small sample size in the current study (Table 1). In general, the larger sample size, the more rare alleles will be detected. For some tree species, previous reports have suggested that a sample size of 25–29 [38] or less than 30 [39] per population should be sufficient. In contrast, numerous lines of evidence have demonstrated that the parameters of genetic diversity can be accurately estimated through the study of small populations with less than 10 individuals, as previously reported for Quercus susber L. [40] and Eucalyptus occidentalis Endl. [41]. Taken together, due to species-specific biological characteristics and different sampling strategies, there is no definitive conclusion regarding the optimal population size [42].
He is commonly considered an essential measure for genetic diversity, and the larger it is, the lower the population consistency, and the higher the genetic diversity. In the present study, the He value ranged from 0.3559 to 0.3428, with an average value of 0.3505, which is significantly smaller than that of Salix arbutifolia Pall. in Japan (mean He = 0.6026) [29]. Moreover, the current He value was also lower than that obtained for Salix species, such as S. viminalis (mean He = 0.616) [21], S. psammophila (mean He = 0.689) [22], S. purpurea (mean He = 0.7365) [43], Salix eriocephala Michx. (mean He = 0.6857) [43], as well as Populus species, such as P. tomentosa (mean He = 0.446) [17], P. deltoids (mean He = 0.487) [18] and Populus simonii Carr. (mean He = 0.677) [44]. However, the He values in all of these reports were calculated using SSR markers, which are extremely variable and greatly dispersed across the genome. Using the same SNP markers, the He value estimated herein was much higher than that previously reported for S. purpurea (mean He = 0.2301) [23], while comparable to those for Ulmus parvifolia Jacq. (mean He = 0.3315) [9] and Elaeis guineensis Jacq. (mean He from 0.29 to 0.33) [45]. Furthermore, the I and PIC value measured based on SNP markers in this study (mean I = 0.5258, mean PIC = 0.2810) were considerably lower than those determined for S. psammophila (mean I = 1.345, mean PIC = 0.714) [22] and P. tomentosa (mean I = 0.80, mean PIC = 0.385) [17] with SSR markers, yet consistent with values reported for U. parvifolia (mean I = 0.5041, mean PIC = 0.2686) [9] and E. guineensis (PIC from 0.23 to 0.269) [45] based on the same SNP markers. Therefore, we believe that high values of genetic parameters, such as effective alleles, heterozygosity, and Shannon-Wiener index, are accompanied by an increase in the allelic variation of molecular markers, indicating that the type and efficiency of the marker will have tremendous influence on the estimation of genetic parameters. As a result, the authentic features of population genetic diversity might be most accurately revealed through the selection of more polymorphic markers.
Changes in population structure, which are mainly affected by genetic mutation, mating system, genetic drift, and selection, could be reflected by F statistics, which are ordinarily measured via FIS, the total inbreeding coefficient of population (FIT), and FST. In this study, all the FIS values were negative, which is consistent with the report on P. tomentosa [17], indicating that a significant excess of heterozygotes exists among these populations across the entire natural distribution area in Northeast China. Similarly, negative FIS values were observed in partial populations of S. purpurea [23] and S. arbutifolia [29], which is more likely due to interspecific hybridization or hybridization of inbred cultivars. In contrast, some Japanese populations of S. arbutifolia showed positive values of FIS, suggesting a deficiency of heterozygosity which might lead to bi-parental inbreeding [29]. It is plausible that the population structure is affected by the geographical disjunction and habitat quality of these populations in Japan. However, for willows, the vegetative reproductive strategy is another critical factor contributing to an excess of homozygotes, as observed for S. purpurea and S. eriocephala [43]. Moreover, the null alleles generated using SSR markers may also be attributable to the positive value of FIS [44]. The overall FST value in our study (from 0.0068 to 0.3063) indicated significant differentiation among provenances, which is comparable with data for S. purpurea (from 0.064 to 0.420) [23] and S. arbutifolia (from 0.01 to 0.41) [29], but much higher than that reported for S. viminalis (from 0.040 to 0.119) [21], S. psammophila (from 0.008 to 0.016) [22], S. alba (FST = 0.07) [25], and several Populus species [44]. As described by Wright [46], FST > 0.25 represents an enormous genetic differentiation, 0.25 > FST > 0.15 indicates a comparatively large genetic differentiation, 0.15 > FST > 0.05 shows a moderate genetic differentiation, and FST < 0.05 is negligible. According to the criteria, large genetic differentiation was found for eight provenance combinations, among which were HZ and CB, as well as JGDQ and CB (Table 4). Of the eight combinations, all six provenances from the Heilongjiang province were related to CB, which is the farthest geographic provenance in Jilin province (Figure 1). Such high-level differentiation was also observed in the phylogenetic tree (Figure 3a). The lowest FST value was detected between XL and HZ (0.0068), which belongs to the same administrative division as Jiagedaqi. Similar results were also observed on S. purpurea [23]. This suggests that gene flow was impeded by pollen competition among the local male individuals. Therefore, all of these evidences have proven that the genetic differentiation of C. arbutifolia in China is significantly associated with geographic distribution.
Natural selection drives species adaption to the environment through genetic changes between generations [47]. The variation in gene frequency among populations facilitates phenotypic differentiation [48]. Thus, the identification of genes or genomic loci associated with natural selection is of major relevance for protecting germplasm resources. In our study, out of the 105,857 efficient SNP markers, only 18 were related to environmental variables, of which five had specific functions, and one was uncharacterized. The Dicer protein was initially described in animals. Its ortholog in plants is the DCL protein. Research involved into the function of DCL focuses on the presence and function of siRNAs, which are major regulators of growth, development, and resistance to biotic or abiotic stress [49]. Similarly, as a prominent signaling molecule, mitogen-activated protein kinase (MAPK) participates in the transduction of developmental and environmental signals into programmed and adaptive responses in plants, thereby regulating gene expression [50]. While sulfite oxidase genes were previously cloned in Arabidopsis thaliana, Solanum tuberosum, and Populus, functional research has mostly concentrated on A. thaliana, where sulfite oxidase could protect plants against sulfur dioxide [51]. There are few reports on the function of prefoldin subunit 5 and hippocampus abundant transcript-like protein in plants, which should be addressed in further studies.
5. Conclusions
To our knowledge, this is the first population genomics study of C. arbutifolia to compare individuals from natural populations in Northeast China. The greater marker density determined using SLAF-seq proved to be a reliable marker system for evaluation of genetic relatedness and population structure, which can be applied in association analysis. All the populations showed moderate diversity. However, enormous genetic differentiations were also detected between provenances, mainly caused by geographical isolation. Based on the AMOVA analysis, the genetic variation mainly came from individuals, so that representative individuals could be selected to enhance the selection efficiency of hybrid parents for breeding. Due to the continuous reduction of natural population, a core germplasm resource bank should be established for the conservation of C. arbutifolia. Given the limited sample size in this study, it would be worthwhile to make further collections and expand the geographic coverage. In addition, more environmental variables should be considered in future research, including humidity, rainfall, and soil components.
Author Contributions
X.H. and Q.Z. conceived and designed the experiments; Y.W. and Z.J. performed the experiments and wrote the paper; J.Z. (Jiwei Zheng) and J.Z. (Jie Zhou) analyzed the data; Z.J., J.Z. (Jiwei Zheng) and B.W. collected the samples. All authors have read and agreed to the published version of the manuscript.
Funding
This research was funded by the National Natural Science Foundation of China (Grant No. 31670662), and Independent Scientific Research Project of Jiangsu Academy of Forestry (Grant No. 2018022-1).
Institutional Review Board Statement
Not applicable.
Informed Consent Statement
Not applicable.
Data Availability Statement
Not applicable.
Acknowledgments
The authors are grateful to Hongxue Wang in Yichun Academy of Forestry and Jun Ren in Jilin Academy of Forestry for their assistance with sample collection.
Conflicts of Interest
The authors declare no conflict of interest.
References
- Wang, Z.; Fang, C.F. Salicaceae. In Flora Reipublicae Popularis Sinicae; Science Press: Beijing, China, 1984; pp. 79–81. [Google Scholar]
- Nakai, T. Chosenia, a new genus of Salicaceae. Bot. Mag. 1920, 34, 66–69. [Google Scholar] [CrossRef] [Green Version]
- Skvortsov, A.K. Willows of Russia and adjacent countries. Taxonomical and geographical revision (English translation with additions). Univ. Joensuu Fac. Math. Nat. Sci. Rep. Ser. 1999, 39, 1–307. [Google Scholar]
- Tu, Z.Y. Breeding and Cultivation of Salix; Jiangsu Science and Technology Press: Nanjing, China, 1982; pp. 154–196. [Google Scholar]
- Eding, H.; Crooijmans, R.P.; Groenen, M.A.; Meuwissen, T.H. Assessing the contribution of breeds to genetic diversity in conservation schemes. Genet. Sel. Evol. 2002, 34, 613. [Google Scholar] [CrossRef] [PubMed] [Green Version]
- Hughes, A.R.; Inouye, B.D.; Johnson, M.T.J.; Underwood, N.; Vellend, M. Ecological consequences of genetic diversity. Ecol. Lett. 2008, 11, 609–623. [Google Scholar] [CrossRef]
- Hamrick, J.L.; Godt, M.J.W.; Sherman-Broyles, S.L. Factors influencing levels of genetic diversity in woody plant species. New For. 1992, 6, 95–124. [Google Scholar] [CrossRef]
- Song, Z.J.; Zhang, M.M.; Li, F.G.; Weng, Q.J.; Zhou, C.P.; Li, M.; Li, J.; Huang, H.H.; Mo, X.Y.; Gan, S.M. Genome scans for divergent selection in natural populations of the widespread hardwood species Eucalyptus grandis (Myrtaceae) using microsatellites. Sci. Rep. 2016, 6, 34941. [Google Scholar] [CrossRef] [PubMed] [Green Version]
- Lyu, Y.Z.; Dong, X.Y.; Huang, L.B.; Zheng, J.W.; He, X.D.; Sun, H.N.; Jiang, Z.P. SLAF-seq Uncovers the genetic diversity and adaptation of Chinese Elm (Ulmus parvifolia) in Eastern China. J. For. 2020, 11, 80. [Google Scholar] [CrossRef] [Green Version]
- Shi, X.M.; Wen, Q.; Cao, M.; Guo, X.; Xu, L.A. Genetic diversity and structure of natural Quercus variabilis population in China as revealed by microsatellites markers. J. For. 2017, 8, 495. [Google Scholar] [CrossRef] [Green Version]
- Gao, Y.; Liu, F.Z.; Wang, K.; Wang, D.J.; Gong, X.; Liu, L.J.; Richards, C.M.; Henk, A.D.; Volk, G.M. Genetic diversity of Malus cultivars and wild relatives in the Chinese National Repository of Apple Germplasm Resources. Tree Genet. Genomes 2015, 11, 106. [Google Scholar] [CrossRef]
- Cao, K.; Wang, L.R.; Zhu, G.R.; Fang, W.C.; Chen, C.W.; Luo, J. Genetic diversity, linkage disequilibrium, and association mapping analyses of peach (Prunus persica) landraces in China. Tree Genet. Genomes 2012, 8, 975–990. [Google Scholar] [CrossRef]
- Peláez, P.; Ortiz-Martínez, A.; Figueroa-Corona, L.; Montes, J.R.; Gernandt, D.S. Population structure, diversifying selection, and local adaptation in Pinus patula. Am. J. Bot. 2020, 107, 1555–1566. [Google Scholar] [CrossRef] [PubMed]
- Zhang, D.Q.; Zhou, N. Genetic diversity and population structure of the endangered conifer Taxus wallichiana var. mairei (Taxaceae) revealed by Simple Sequence Repeat (SSR) markers. Biochem. Syst. Ecol. 2013, 49, 107–114. [Google Scholar] [CrossRef]
- Neophytou, C.; van Loo, M.; Hasenauer, H. Genetic diversity in introduced Douglas-fir and its natural regeneration in central Europe. For. Int. J. For. Res. 2020, 93, 535–544. [Google Scholar] [CrossRef]
- Smulders, M.J.M.; Cottrell, J.E.; Lefèvre, F.; van der Schoot, J.; Arens, P.; Vosman, B.; Tabbener, H.E.; Grassi, F.; Fossati, T.; Castiglione, S.; et al. Structure of the genetic diversity in black poplar (Populus nigra L.) populations across European river systems: Consequences for conservation and restoration. For. Ecol. Manag. 2008, 255, 1388–1399. [Google Scholar] [CrossRef]
- Du, Q.Z.; Wang, B.W.; Wei, Z.Z.; Zhang, D.Q.; Li, B.L. Genetic diversity and population structure of Chinese white poplar (Populus tomentosa) revealed by SSR markers. J. Hered. 2012, 103, 853–862. [Google Scholar] [CrossRef] [Green Version]
- Chen, C.; Chu, Y.G.; Ding, C.J.; Su, X.H.; Huang, Q.J. Genetic diversity and population structure of black cottonwood (Populus deltoides) revealed using simple sequence repeat markers. BMC Genet. 2020, 21, 2. [Google Scholar] [CrossRef] [Green Version]
- Wang, J.; Li, Z.J.; Guo, Q.H.; Ren, G.P.; Wu, Y.X. Genetic variation within and between populations of a desert poplar (Populus euphratica) revealed by SSR markers. Ann. For. Sci. 2011, 68, 1143–1149. [Google Scholar] [CrossRef] [Green Version]
- Blumstein, M.; Richardson, A.; Weston, D.; Zhang, J.; Muchero, W.; Hopkins, R. A new perspective on ecological prediction reveals limits to climate adaptation in a temperate tree species. Curr. Biol. 2020, 30, 1447–1453.e4. [Google Scholar] [CrossRef] [PubMed]
- Berlin, S.; Trybush, S.O.; Fogelqvist, J.; Gyllenstrand, N.; Hallingbäck, H.R.; Åhman, I.; Nordh, N.-E.; Shield, I.; Powers, S.J.; Weih, M.; et al. Genetic diversity, population structure and phenotypic variation in European Salix viminalis L. (Salicaceae). Tree Genet. Genomes 2014, 10, 1595–1610. [Google Scholar] [CrossRef] [Green Version]
- Jia, H.X.; Yang, H.F.; Sun, P.; Li, J.B.; Zhang, J.; Guo, Y.H.; Han, X.J.; Zhang, G.S.; Lu, M.Z.; Hu, J.J. De novo transcriptome assembly, development of EST-SSR markers and population genetic analyses for the desert biomass willow, Salix psammophila. Sci. Rep. 2016, 6, 39591. [Google Scholar] [CrossRef] [Green Version]
- Gouker, F.E.; DiFazio, S.P.; Bubner, B.; Zander, M.; Smart, L.B. Genetic diversity and population structure of native, naturalized, and cultivated Salix purpurea. Tree Genet. Genomes 2019, 15, 47. [Google Scholar] [CrossRef]
- Sulima, P.; Prinz, K.; Przyborowski, J. Genetic diversity and genetic relationships of purple willow (Salix purpurea L.) from natural locations. Int. J. Mol. Sci. 2017, 19, 105. [Google Scholar] [CrossRef] [PubMed] [Green Version]
- Degirmenci, F.O.; Acar, P.; Kaya, Z. Consequences of habitat fragmentation on genetic diversity and structure of Salix alba L. populations in two major river systems of Turkey. Tree Genet. Genomes 2019, 15, 59. [Google Scholar] [CrossRef]
- Moskalyuk, T.A. Chosenia Arbutifolia (Salicaceae): Life strategies and introduction perspectives. Sib. J. For. Sci. 2016, 3, 34–45. [Google Scholar] [CrossRef]
- Kadis, I. Chosenia: An amazing tree of Northeast Asia. Arnoldia 2005, 63, 8–18. [Google Scholar]
- Rao, G.D.; Zeng, Y.F.; Sui, J.K.; Zhang, J.G. De novo transcriptome analysis reveals tissue-specific differences in gene expression in Salix arbutifolia. Trees 2016, 30, 1647–1655. [Google Scholar] [CrossRef]
- Nagamitsu, T.; Hoshikawa, T.; Kawahara, T.; Barkalov, V.Y.; Sabirov, R.N. Phylogeography and genetic structure of disjunct Salix arbutifolia populations in Japan. Popul. Ecol. 2014, 56, 539–549. [Google Scholar] [CrossRef]
- Li, H.; Durbin, R. Fast and accurate short read alignment with Burrows-Wheeler transform. J. Bioinform. 2009, 25, 1754–1760. [Google Scholar] [CrossRef] [Green Version]
- McKenna, A.; Hanna, M.; Banks, E.; Sivachenko, A.; Cibulskis, K.; Kernytsky, A.; Garimella, K.; Altshuler, D.; Gabriel, S.; Daly, M.; et al. The Genome Analysis Toolkit: A MapReduce framework for analyzing next-generation DNA sequencing data. Genome Res. 2010, 20, 1297–1303. [Google Scholar] [CrossRef] [Green Version]
- Li, H.; Handsaker, B.; Wysoker, A.; Fennell, T.; Ruan, J.; Homer, N.; Marth, G.; Abecasis, G.; Durbin, R. The sequence alignment/Map format and SAMtools. J. Bioinform. 2009, 25, 2078–2079. [Google Scholar] [CrossRef] [Green Version]
- Peakall, R.; Smouse, P.E. genalex 6: Genetic analysis in Excel. Population genetic software for teaching and research. Mol. Ecol. Notes 2006, 6, 288–295. [Google Scholar] [CrossRef]
- Excoffier, L.; Laval, G.; Schneider, S. Arlequin (version 3.0): An integrated software package for population genetics data analysis. Evol. Bioinform. 2005, 1, 117693430500100. [Google Scholar] [CrossRef] [Green Version]
- Alexander, D.H.; Lange, K. Enhancements to the ADMIXTURE algorithm for individual ancestry estimation. BMC Bioinform. 2011, 12, 246. [Google Scholar] [CrossRef] [Green Version]
- Günther, T.; Coop, G. Robust identification of local adaptation from allele frequencies. Genetics 2013, 195, 205–220. [Google Scholar] [CrossRef] [Green Version]
- Zhao, R.; Cheng, Z.; Lu, W.F.; Lu, B.R. Estimating genetic diversity and sampling strategy for a wild soybean (Glycine soja) population based on different molecular markers. Chin. Sci. Bull. 2006, 51, 1219–1227. [Google Scholar] [CrossRef]
- Zhang, S.S.; Yang, W.Z.; Zhang, Y.P.; Gao, X.S.; Kang, H.M. Effects of Poncirus polyandra sample size on genetic diversity index by SSR markers. J. Northeast For. Uni. 2017, 45, 35–39, 44. [Google Scholar] [CrossRef]
- Miyamoto, N.; Fernández-Manjarrés, J.F.; Morand-prieur, M.-E.; Bertolino, P.; Frascaria-Lacoste, N. What sampling is needed for reliable estimations of genetic diversity in Fraxinus excelsior L. (Oleaceae)? Ann. For. Sci. 2008, 65, 403. [Google Scholar] [CrossRef] [Green Version]
- Laakili, A.; Belkadi, B.; Medraoui, L.; Alami, M.; Yatrib, C.; Pakhrou, O.; Makhloufi, M.; El Antry, S.; Laamarti, A.; Filali-Maltouf, A. Diversity and spatial genetic structure of natural Moroccan Quercus suber L. assessed by ISSR markers for conservation. Physiol. Mol. Biol. Plants 2018, 24, 643–654. [Google Scholar] [CrossRef]
- Elliott, C.P.; Byrne, M. Genetic diversity within and between natural populations of Eucalyptus occidentalis (Myrtaceae). Silvae Genet. 2003, 52, 169–173. [Google Scholar]
- Singh, M.; Chabane, K.; Valkoun, J.; Blake, T. Optimum sample size for estimating gene diversity in wild wheat using AFLP markers. Genet. Resour. Crop Evol. 2006, 53, 23–33. [Google Scholar] [CrossRef]
- Lin, J.; Gibbs, J.P.; Smart, L.B. Population genetic structure of native versus naturalized sympatric shrub willows (Salix; Salicaceae). Am. J. Bot. 2009, 96, 771–785. [Google Scholar] [CrossRef]
- Wei, Z.Z.; Du, Q.Z.; Zhang, J.F.; Li, B.L.; Zhang, D.Q. Genetic diversity and population structure in Chinese indigenous poplar (Populus simonii) populations using microsatellite markers. Plant Mol. Biol. Rep. 2013, 31, 620–632. [Google Scholar] [CrossRef]
- Xia, W.; Luo, T.t.; Zhang, W.; Mason, A.S.; Huang, D.Y.; Huang, X.L.; Tang, W.Q.; Dou, Y.J.; Zhang, C.Y.; Xiao, Y. Development of high-density SNP markers and their application in evaluating genetic diversity and population structure in Elaeis guineensis. Front. Plant Sci. 2019, 10, 130. [Google Scholar] [CrossRef] [PubMed]
- Wright, S. The interpretation of population structure by F-Statistics with special regard to systems of mating. Evolution 1965, 19, 395–420. [Google Scholar] [CrossRef]
- Jump, A.S.; Hunt, J.M.; Martinez-Izquierdo, J.A.; Penuelas, J. Natural selection and climate change: Temperature-linked spatial and temporal trends in gene frequency in Fagus sylvatica. Mol. Ecol. 2006, 15, 3469–3480. [Google Scholar] [CrossRef]
- Savolainen, O.; Pyhäjärvi, T.; Knürr, T. Gene flow and local adaptation in trees. Annu. Rev. Ecol. Evol. Syst. 2007, 38, 595–619. [Google Scholar] [CrossRef]
- Margis, R.; Fusaro, A.F.; Smith, N.A.; Curtin, S.J.; Watson, J.M.; Finnegan, E.J.; Waterhouse, P.M. The evolution and diversification of Dicers in plants. FEBS Lett. 2006, 580, 2442–2450. [Google Scholar] [CrossRef]
- Cristina, M.; Petersen, M.; Mundy, J. Mitogen-Activated protein kinase signaling in plants. Annu. Rev. Plant Biol. 2010, 61, 621–649. [Google Scholar] [CrossRef] [PubMed]
- Brychkova, G.; Xia, Z.; Yang, G.; Yesbergenova, Z.; Zhang, Z.; Davydov, O.; Fluhr, R.; Sagi, M. Sulfite oxidase protects plants against sulfur dioxide toxicity. Plant J. 2007, 50, 696–709. [Google Scholar] [CrossRef] [PubMed]
Publisher’s Note: MDPI stays neutral with regard to jurisdictional claims in published maps and institutional affiliations. |
© 2021 by the authors. Licensee MDPI, Basel, Switzerland. This article is an open access article distributed under the terms and conditions of the Creative Commons Attribution (CC BY) license (https://creativecommons.org/licenses/by/4.0/).