Article

Tree Species Composition in Mixed Plantations Influences Plant Growth, Intrinsic Water Use Efficiency and Soil Carbon Stock

by
Francesco Niccoli
1,
Tiziana Danise
1,
Michele Innangi
1,
Francesco Pelleri
2,
Maria Chiara Manetti
2,
Giovanni Mastrolonardo
3,
Giacomo Certini
3,
Antonietta Fioretto
1 and
Giovanna Battipaglia
1,*
1
Department of Environmental, Biological, Pharmaceutical Sciences and Technologies, University of Campania “Luigi Vanvitelli”, Via Vivaldi 43, 81100 Caserta, Italy
2
Consiglio per la Ricerca in Agricoltura e l’Analisi dell’Economia Agraria, Centro di Ricerca Foreste e Legno, Viale Santa Margherita 80, 52100 Arezzo, Italy
3
Dipartimento di Scienze e Tecnologie Agrarie, Alimentari, Ambientali e Forestali, Università degli Studi di Firenze, Piazzale delle Cascine 18, 50144 Firenze, Italy
*
Author to whom correspondence should be addressed.
Forests 2021, 12(9), 1251; https://doi.org/10.3390/f12091251
Submission received: 19 August 2021 / Revised: 10 September 2021 / Accepted: 13 September 2021 / Published: 15 September 2021
(This article belongs to the Special Issue Wood Formation and Environmental Constraints: Multiscale Approach)

Abstract

:
Species interactions in mixed plantations can influence tree growth, resources capture and soil fertility of the stands. A combined approach of tree-ring analyses and carbon stable isotope was used to check tree growth and water use efficiency of two species, Populus alba L. and Juglans regia L., intercropped with each other and with N-fixing or competitive production species. Furthermore, soil analyses were performed to understand how the different intercropping systems can influence soil characteristics, in particular soil carbon stock. Dendrochronological data showed that during the first years, the growth of principal species was favored by intercropping. This positive effect decreased in the following years in most of intercropped stands, due to light competition with the crown of companion species. Carbon isotope data showed that P. alba and J. regia had the highest intrinsic water use efficiency when growing with Elaeagnus umbellata Thunb, a shrubby species with a shallow root system that favors a non-competitive exploitation of soil water resources. Finally, the intercropping of the principal species with Corylus avellana L. promoted the highest soil C stock. Our findings confirmed the importance to consider the plantation dynamics and wood formation in the long-run and to apply appropriate thinning and pruning interventions to counteract interspecific competition.

1. Introduction

The wide spreading of secondary forests worldwide is connected to the huge depopulation of the countryside and mountain marginal lands in favor of big cities and to the abandonment of the agricultural and pastoral activities [1]. This land use change has certainly caused a series of positive effects, such as contributing to mitigate global warming through a higher absorption and storage capacity of atmospheric carbon [2]. There are, however, also some downside effects such as increase of fire frequency and the closure of open areas with the homogenization of the landscape [3]. To mitigate these negative effects and to safeguard the economic and ecological functions of forests, it is necessary to implement sustainable management of secondary forests [4].
In the last decades huge afforestation plans have been financially supported to enhance marginal agricultural areas. Compared to the past, planted forests have globally increased due to the growing demand for timber, pulp, energy and other goods [5,6]. In particular, in the European Union, under the support of European Commission Regulation 2080/92, approximately 1,000,000 ha were afforested between 1992 and 1999 [7]. Most planted forests were monocultures [8,9,10,11], the main advantages of which being the ease of implementation and management and the possibility of orienting production towards high valued woody assortments. On the other hand, the main disadvantages of monocultures are the high sensitivity to pest and disease attacks, a progressive reduction of soil fertility, the excessively simple plantation structure and the poor biodiversity which lead to low profits in the timber market [12,13,14].
Mixed plantations are increasing globally and various studies have demonstrated their superiority in providing various ecosystem services such as greater biodiversity, climate change mitigation, protection from hydrogeological instability, as well as, in some cases, an increasing in tree productivity [15,16,17]. Indeed, mixed-tree plantations in comparison to monocultures could promoted a reduction in management costs [18], an excellent adaptability of plants to extreme climatic events [19,20], a better resistance to pests and pathogens outbreaks [8,21], improved nutrients cycle and soil fertility [22,23]. Several studies have highlighted the positive effects on soil fertility of intercropping with N-fixing species [24,25,26]. This type of mixed plantation implies increase in soil organic matter (SOM) [27,28,29,30]. A meta-analysis study demonstrated statistically significant increase in the concentrations of C and N in soil of mixed plantations enriched with a N-fixing species [31]. However, the success of mixed plantations is variable [32]. As stated by the stress gradient theory [33] and confirmed by subsequent studies [34], the positive effects determined by competitive production and facilitation species cannot prevail over negative effects (e.g., competition) in stands where stressful abiotic conditions, such as drought, occur. In this context, the study of intrinsic water use efficiency (iWUE), defined as the relationship between the net assimilation of C in photosynthesis (A) and stomatal conductance (gs) [35], allows to evaluate how water competition affects tree growth [8,36] as well as the positive influence of intercropped species on the photosynthetic activity and nitrogen supply of the principal species [37,38,39,40]. Currently, information on how to match different species to increase the chances of success of mixed plantations and maximize site conditions is scarce [16,41,42,43]. Therefore, to maximize the chances of success of mixed plantations it is necessary to deepen knowledge on their dynamics and the ecophysiological processes that are established among the different tree species, as well as to understand the effects of intercropping on biomass productivity and soil fertility [25].
Our research aimed to evaluate the wood formation and tree productivity, trees intrinsic water use efficiency and impact on soil fertility of an experimental tree plantation varied in composition. We examined distinct stands in which two valuable species widely used for the production of timber, white poplar (Populus alba L., Salicaceae) and common walnut (Juglans regia L., Juglandaceae), are intercropped with each other and with a shade tolerant shrub species such as hazel (Corylus avellana L., Betulaceae) and with N-fixing species such as Italian alder (Alnus cordata (Loisel.) Duby, Betulaceae) and autumn-olive (Elaeagnus umbellate (Thunb.), Elaeagnaceae). We hypothesize that species mixtures, especially N-fixing, could positively affect wood growth and water use efficiency of the studied tree species. Further, the intercropped species could positively affect soil N fertility and increase C stock in soil.

2. Materials and Methods

2.1. Study Area

The experimental area is located nearby Brusciana, 40 km east of Florence, Central Italy (43°40′31″ N, 10°55′22″ E). The area has a Mediterranean climate, with mild and rainy winters and hot and dry summers. The average annual temperature measured in the period between 2008 and 2019 at a climatic station located 5 km from our study site was 15.4 °C, while the average annual rainfall was 878 mm (Servizio Idrologico Regione Toscana (SIR), http://www.sir.toscana.it/consistenza-rete, access on 15 March 2020). The soils developed on recent (Holocene) fluvial deposits and are Fluventic Haplustepts coarse-loamy, mixed, thermic of the USDA Soil Taxonomy, according to the 1:250,000 soil map by Regione Toscana (http://sit.lamma.rete.toscana.it/websuoli, access on 15 March 2020). The study site was a mixed tree plantation (7.44 ha) established in 1996 on formerly cultivated land. The tree plantation comprises different and neighboring stands/mixed intercropping where poplar and walnut were planted together using a triangular layout with a distance of 8 m (179 trees per ha), and intercropped with different nurse trees and shrubs, using a rectangular layout of 3.5 × 4 m (715 trees per ha) and maintaining the same layout and density of the two main tree species (Figure S1). The individuals of the same species were all the same genotypes.
In this study, the experimental design is the same used by a previous study [26]. Four types of intercropped systems were examined and compared using a randomized blocks design with three replications:
  • Poplar and walnut (plot PJ).
  • Poplar, walnut intercropped with hazel (plot PJC).
  • Poplar, walnut intercropped with autumn-olive (plot PJE).
  • Poplar, walnut intercropped with Italian alder (plot PJA).

2.2. Sampling and Dendrochronological Processing

In December 2018, 10 dominant trees of P. alba (mean diameter at breast height 43.5 ± 6.2 cm, mean height 22.4 ± 2.6 m) and 10 dominant trees of J. regia (mean diameter at breast height 17.5 ± 2.6 cm and mean heigh 12.7 ± 1.8 m) were randomly selected in each replicate of each mixture. For each tree, two wood-cores were collected by an incremental borer (Haglöfs Langsele, Sweden). The cores were taken at a height of 130 cm from the ground and in east-west direction. The collected cores were fixed on specific wooden supports and subjected to a sanding process, to facilitate tree-rings identification. Subsequently, dendrochronological measurements were made to the nearest 10 µm using a semiautomatic device (LintabTM, Rinntech, Heidelberg, Germany). Through this system, it was possible to measure the width of the tree-rings and elaborate the representative curves of the growth trend of each individual plant (tree-ring width—TRW). In a second step, the obtained TRW series were visually and statistically crossed with each other through the “Gleichaeufigkeit” (GLK), a specific parameter that assesses the correlation between the different series [44]. Synchronization was considered acceptable with a GLK > 0.70. Finally, to understand the effect of the different intercropping on the diametrical increase, the mean tree-ring width chronology of each replicate and the annual Basal Area Increment (BAI) have been calculated for each intercropping systems and species, J. regia and P. alba. BAI was calculated from raw ring width, considering concentrically distributed tree-rings [45]. The use of BAI avoids detrending procedure [46] allowing to not lose information on low frequency variability. Then average of Cumulative Basal Area (CBA) was determined by summing the average BAI and propagating uncertainties [47,48]. To distinguish the measurements of the two studied tree species in each intercropping systems, hereafter we refer to intercropping and then P (for poplar) and the J (for walnut) after an underscore, e.g., PJ_P refers to P. alba sampled in the PJ intercropping and PJ_J refers to J. regia sampled in the PJ intercropping.

2.3. Soil Sampling and Laboratory Analysis

In winter of 2018, eight soil cores (10 cm thick) were sampled by a steel cylinder of known volume (so as to determine the bulk density, BD) in each replication of the four intercropping systems, following a regular net approximately centered in the centroid of the stand, from the surface and after litter removal. Once in the laboratory, soil moisture was measured with standard gravimetric method, oven-drying the soil samples (60 °C) to constant weight, and then passing them through a 2 mm sieve to remove rock fragments and large roots. The fine earth was analyzed for particle size distribution (by the hydrometer method [49]), pH (potentiometrically, in 0.01 M CaCl2, using a liquid to soil ratio of 2.5:1), total C (TC) and N (TN) (by dry combustion at a C/N/S Carlo Erba NA1500 Analyzer). Organic C was measured by pre-treating the samples with 6 M HCl at 80 °C to eliminate carbonates [50]. Total inorganic carbon (TIC) was the difference between total carbon (TC) and total organic carbon (TOC).
For estimating the recalcitrant organic carbon—which is the fraction of TOC assumed to be more stable in soil—the soil was submitted to a chemical oxidation aimed at removing the more labile soil organic matter and isolate an older, chemically resistant fraction of it [51]. Briefly, 10 g of soil were mixed with 20 mL of 1 M HCl for removing the inorganic carbon. The residue was then washed with 40 mL of distilled water and then added with 100 mL of 1 M NaOCl adjusted to pH 8 and put on a mechanical shaker for six hours at 25 °C. Finally, it was centrifuged at 2000× g for 15 min and the solution discarded. This treatment was repeated four times. Thereafter the sample was washed four times with 50 mL distilled water and oven-dried at 60 °C to constant weight. The C content of the residue was measured by dry combustion and accounted for the mass balance, i.e., subtracting the mass of C in the residue from the mass of TOC in the untreated sample.

2.4. Intrinsic Water Use Efficiency Determination

From each of the four-intercropping systems, five tree cores that presented the best cross-dating (GLK > 0.80) were selected for carbon isotopic analyses. Tree rings were very narrow, preventing annual resolution, thus groups of three-years rings were separated using a blade cutter. Then the three-year samples were ground into a powder using a centrifugal mill (ZM 1000, Retsch, Germany), using a mesh size of 0.5 mm to ensure homogeneity.
The C isotope composition was measured at the Icona Laboratory (DISTABIF, Caserta, Italy) by continuous-flow isotope ratio mass spectrometry (Delta V Advantage, Thermo electron corporation, Bremen Germany), using 0.06 mg of dry matter for δ13C measurements. The standard deviation for the repeated analysis of an internal standard was less than 0.1% for δ13C measurements, whereas the standard deviation for Sigma-Aldrich α-cellulose (item C8002) were less than 0.2‰ for δ13C.
The results from the isotope ratio deviations are presented using the common δ notation:
δ = ( R s R r 1 ) × 1000
where R refers to the ratio of the 13C to 12C isotopes in the sample (‘s’) and the reference (‘r’), compared to the PDB (Pee Dee Belemnite) standard.
Therefore, tree Δ13C was calculated as follows:
Δ 13 C = δ 13 c a δ 13 c p 1 + δ 13 c p
where δ13ca and δ13cp are the ratios in atmospheric CO2 and tree-ring, respectively.
The relative rates of carbon fixation and stomatal conductance are the primary factors that determine Δ [52]:
Δ 13 C = a + ( b a )   c i c a
where a is the discrimination against 13CO2 during CO2 diffusion through the stomata (a = 4.4‰), b is the discrimination associated with carboxylation (b = 27‰), and ci and ca are the intercellular and ambient CO2 concentrations, respectively.
The intrinsic water-use efficiency (iWUE) can be defined as the ratio of the fluxes of net photosynthesis and conductance for water vapor, which indicates the cost of assimilation per unit of water. Using the simplified, linear relationship [35], the intrinsic water use efficiency is calculated as:
i WUE = A g s = c a c i 1.6 = c a 1 c i c a 1.6
where A is the rate of CO2 assimilation, gs is the rate of leaf stomatal conductance, and 1.6 is the ratio of diffusivities of water and CO2 in the atmosphere. Equation (4) is the “basic” form of isotopic discrimination that does not include effects due to mesophyll conductance and photorespiration (i.e., assuming an infinite internal conductance), which were not available for the species here.
δ13ca can be estimated for the period 1995–2004 according to a reference study [53] and the measured values for the period 2005–2018 available online (http://www.esrl.noaa.gov/gmd/, access on 15 July 2020), while ca is the concentration of CO2 in the atmosphere, estimated for each year and obtained by NOAA (http://www.esrl.noaa.gov/, Mauna Loa station, access date 15 July 2020).

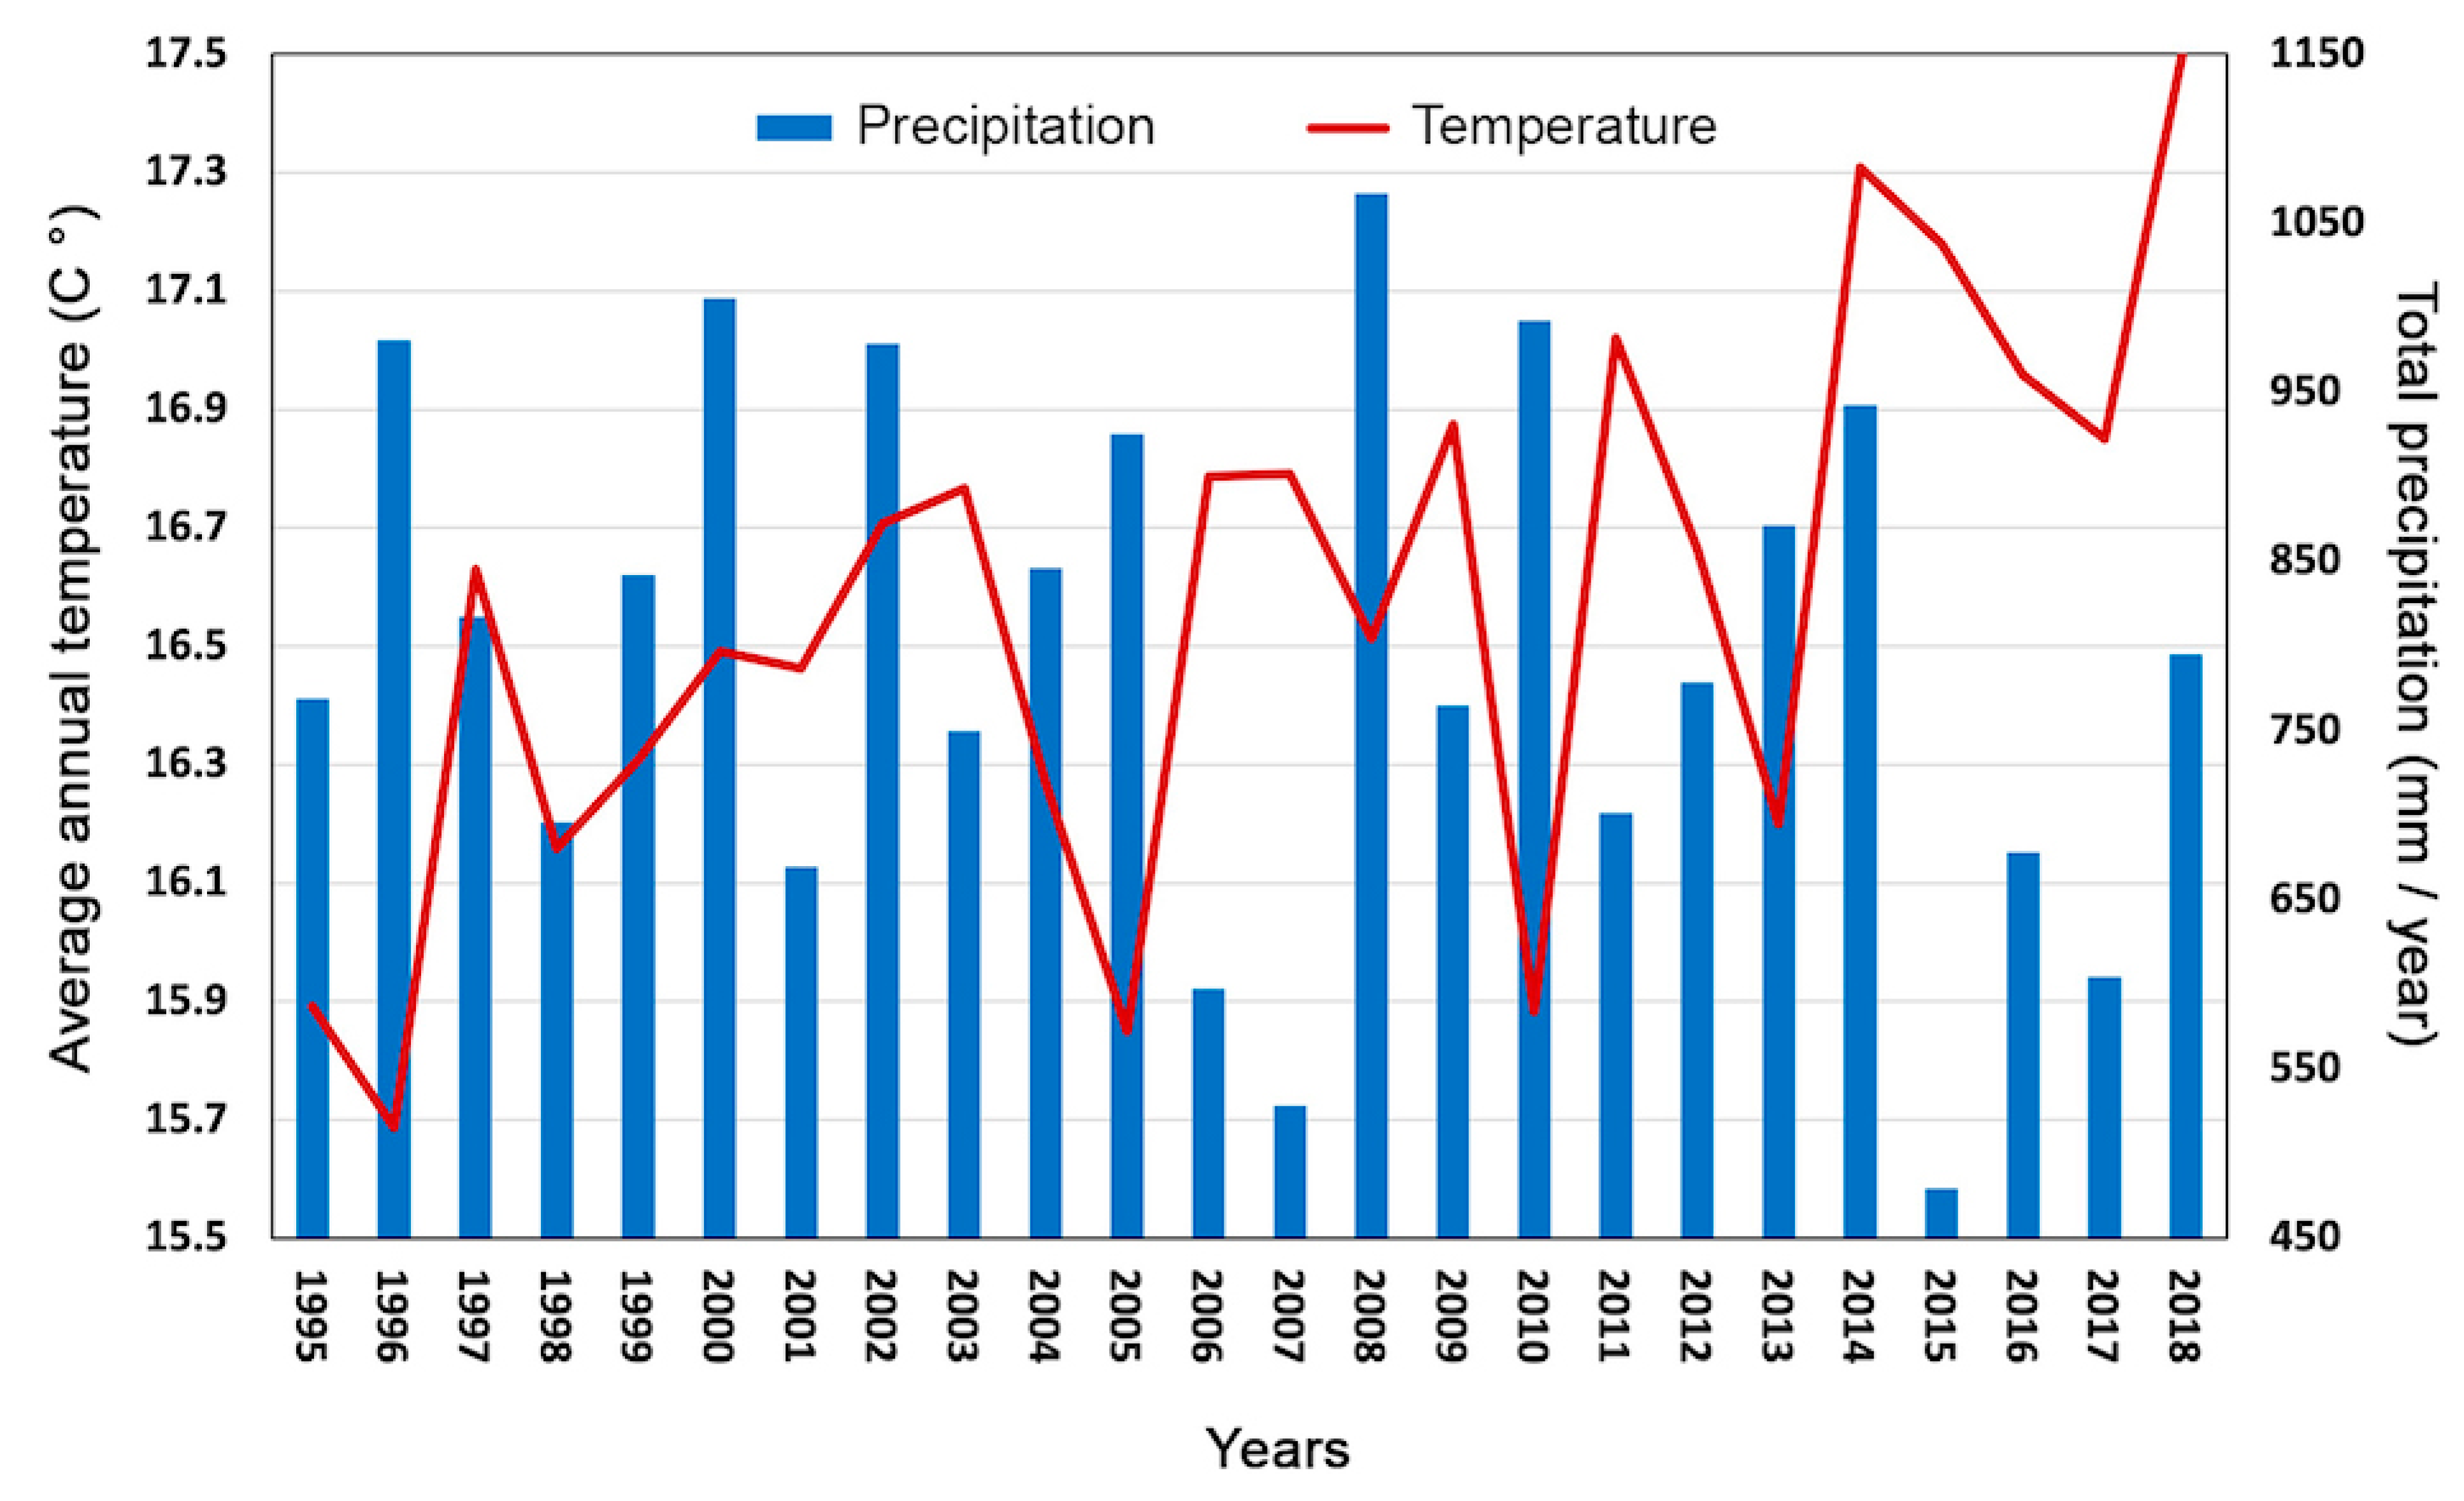
2.5. Climate Analysis

To evaluate how climatic factors affected the productivity of the studied tree species, the climatic information recorded in the study area in the period between 1995 and 2018, available from the CRU TS3.23 gridded dataset at 0.5° resolution data [54], were examined (Figure 1). In particular, we correlated minimum, maximum, and average monthly temperatures and monthly and total rainfall with CBA data and water use efficiency of the two species, J. regia and P. alba. Climate data, after being grouped by months, were correlated using the software Microsoft XLSTAT, with Spearman correlation function (p < 0.05).

2.6. Data Analyses

All data were checked for normality (using the Shapiro–Wilk test) and homogeneous variance (by means of Levene’s test) before applying inferential statistics. Differences between intercropping systems in terms of soil parameters, tree growth and iWUE, were evaluated according to one-way ANOVA, using Student–Newman–Keuls coefficient for comparison tests (p < 0.05). Cumulative basal area data were compared with one way ANOVA, during the whole period and comparing the juvenile phase (8 years) and the adult one. To explore multivariate patterns between the intercropping systems, a principal component analysis (PCA) [55] was applied using the package XLSTAT. Data matrices considering the study period and eight variables (iWUE, CBA, TN, TOC, TIC, C/N, recalcitrant C and standing tree density) of each intercropping system were processed as ordination method for indirect gradient analysis [56]. This analysis allows to reduce the number of independent variables by eliminating those accounting for only a few percent of the total variance [57].

3. Results

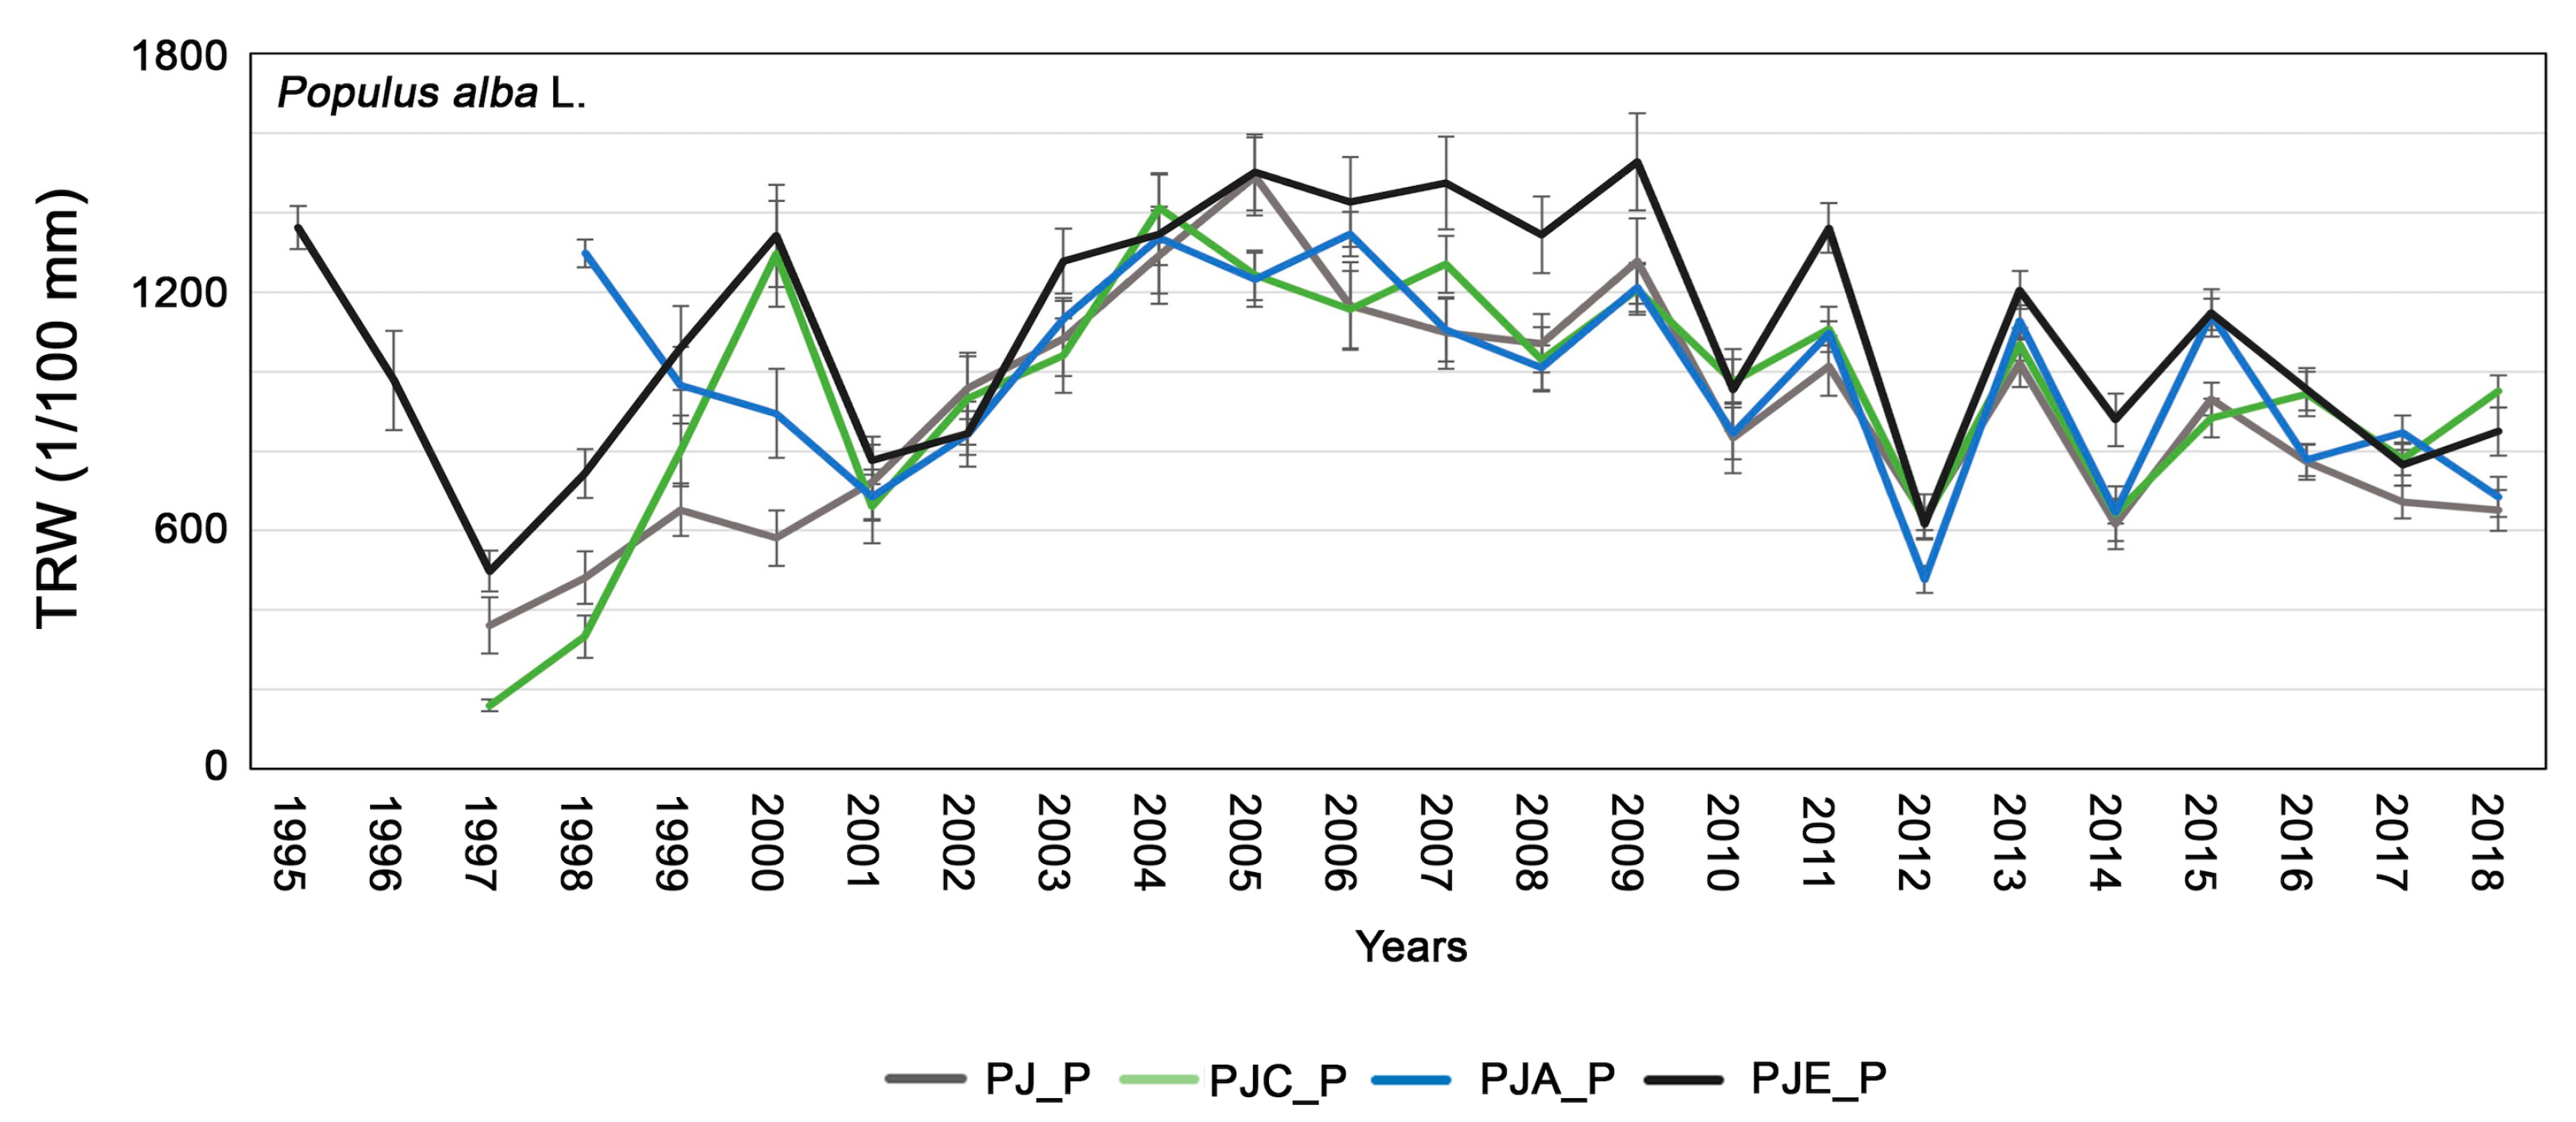
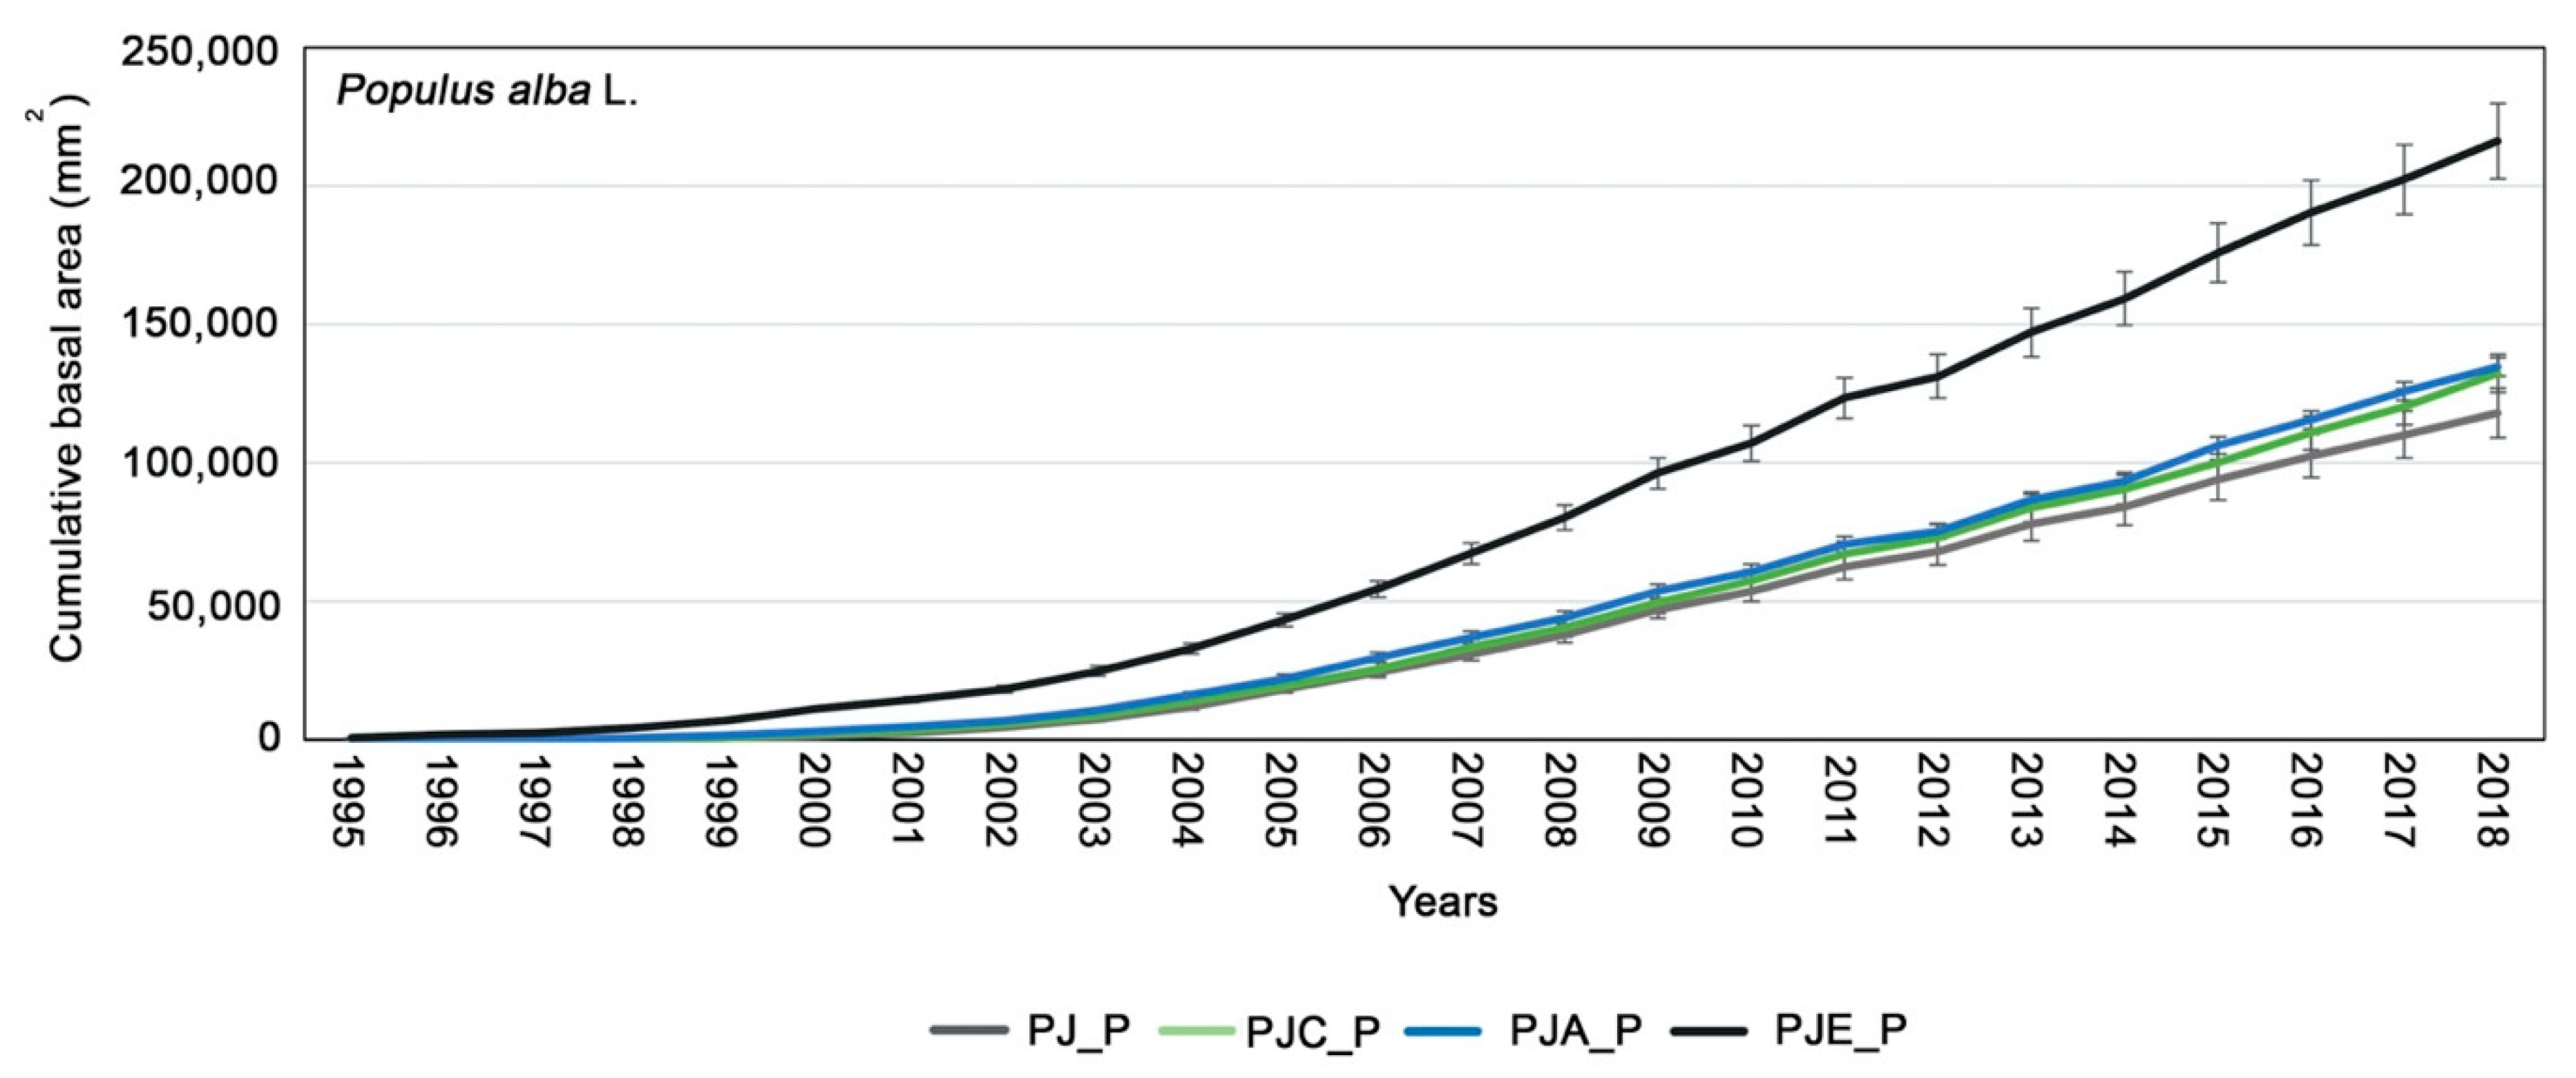
3.1. Dendrochronological Analysis of Populus Alba

The dendrochronological analyses carried out on P. alba showed that the growth curves in all intercropping systems had a similar trend: in 2008, 2010, 2012 and 2014 there was a simultaneous decrease in growth, while in 2009, 2011, 2013 and 2015 an increase in growth was observed in all the mixtures (Figure 2). The GLK was very high in all intercropping systems: 75, 78, 82, and 75 in PJ_P, PJC_P, PJA_P, and PJE_P, respectively. In some cases, the wood-cores did not have the first rings because it was not possible to sample the pith, which explains why the curves had different starting points. Anyhow, all P. alba trees showed a sustained and regular growth trend in the first years. Subsequently, from 2010 onwards, a substantial reduction in growth occurred. In addition, the collected data showed different growth rates of P. alba according to the type of intercropping: intercropping with a third species, such as hazel (PJC_P), Italian alder (PJA_P), or autumn-olive (PJE_P), resulted in higher productivity compared to the simple association with J. regia (PJ_P).
Looking at the mean cumulative basal area (CBA, Figure 3, referring to the whole ANOVA model testing the overall effect), the greatest mean growth of P. alba was found in the PJE_P system, i.e., when it was intercropped with the N-fixing E. umbellata (p = 0.03). On the contrary, there were no statistical differences (p > 0.05) in the growth trends in the case of the intercropping with A. cordata (PJA_P) and C. avellana (PJC_P). Finally, P. alba showed the lowest growth when intercropped with J. regia alone (PJ_P, p = 0.02).

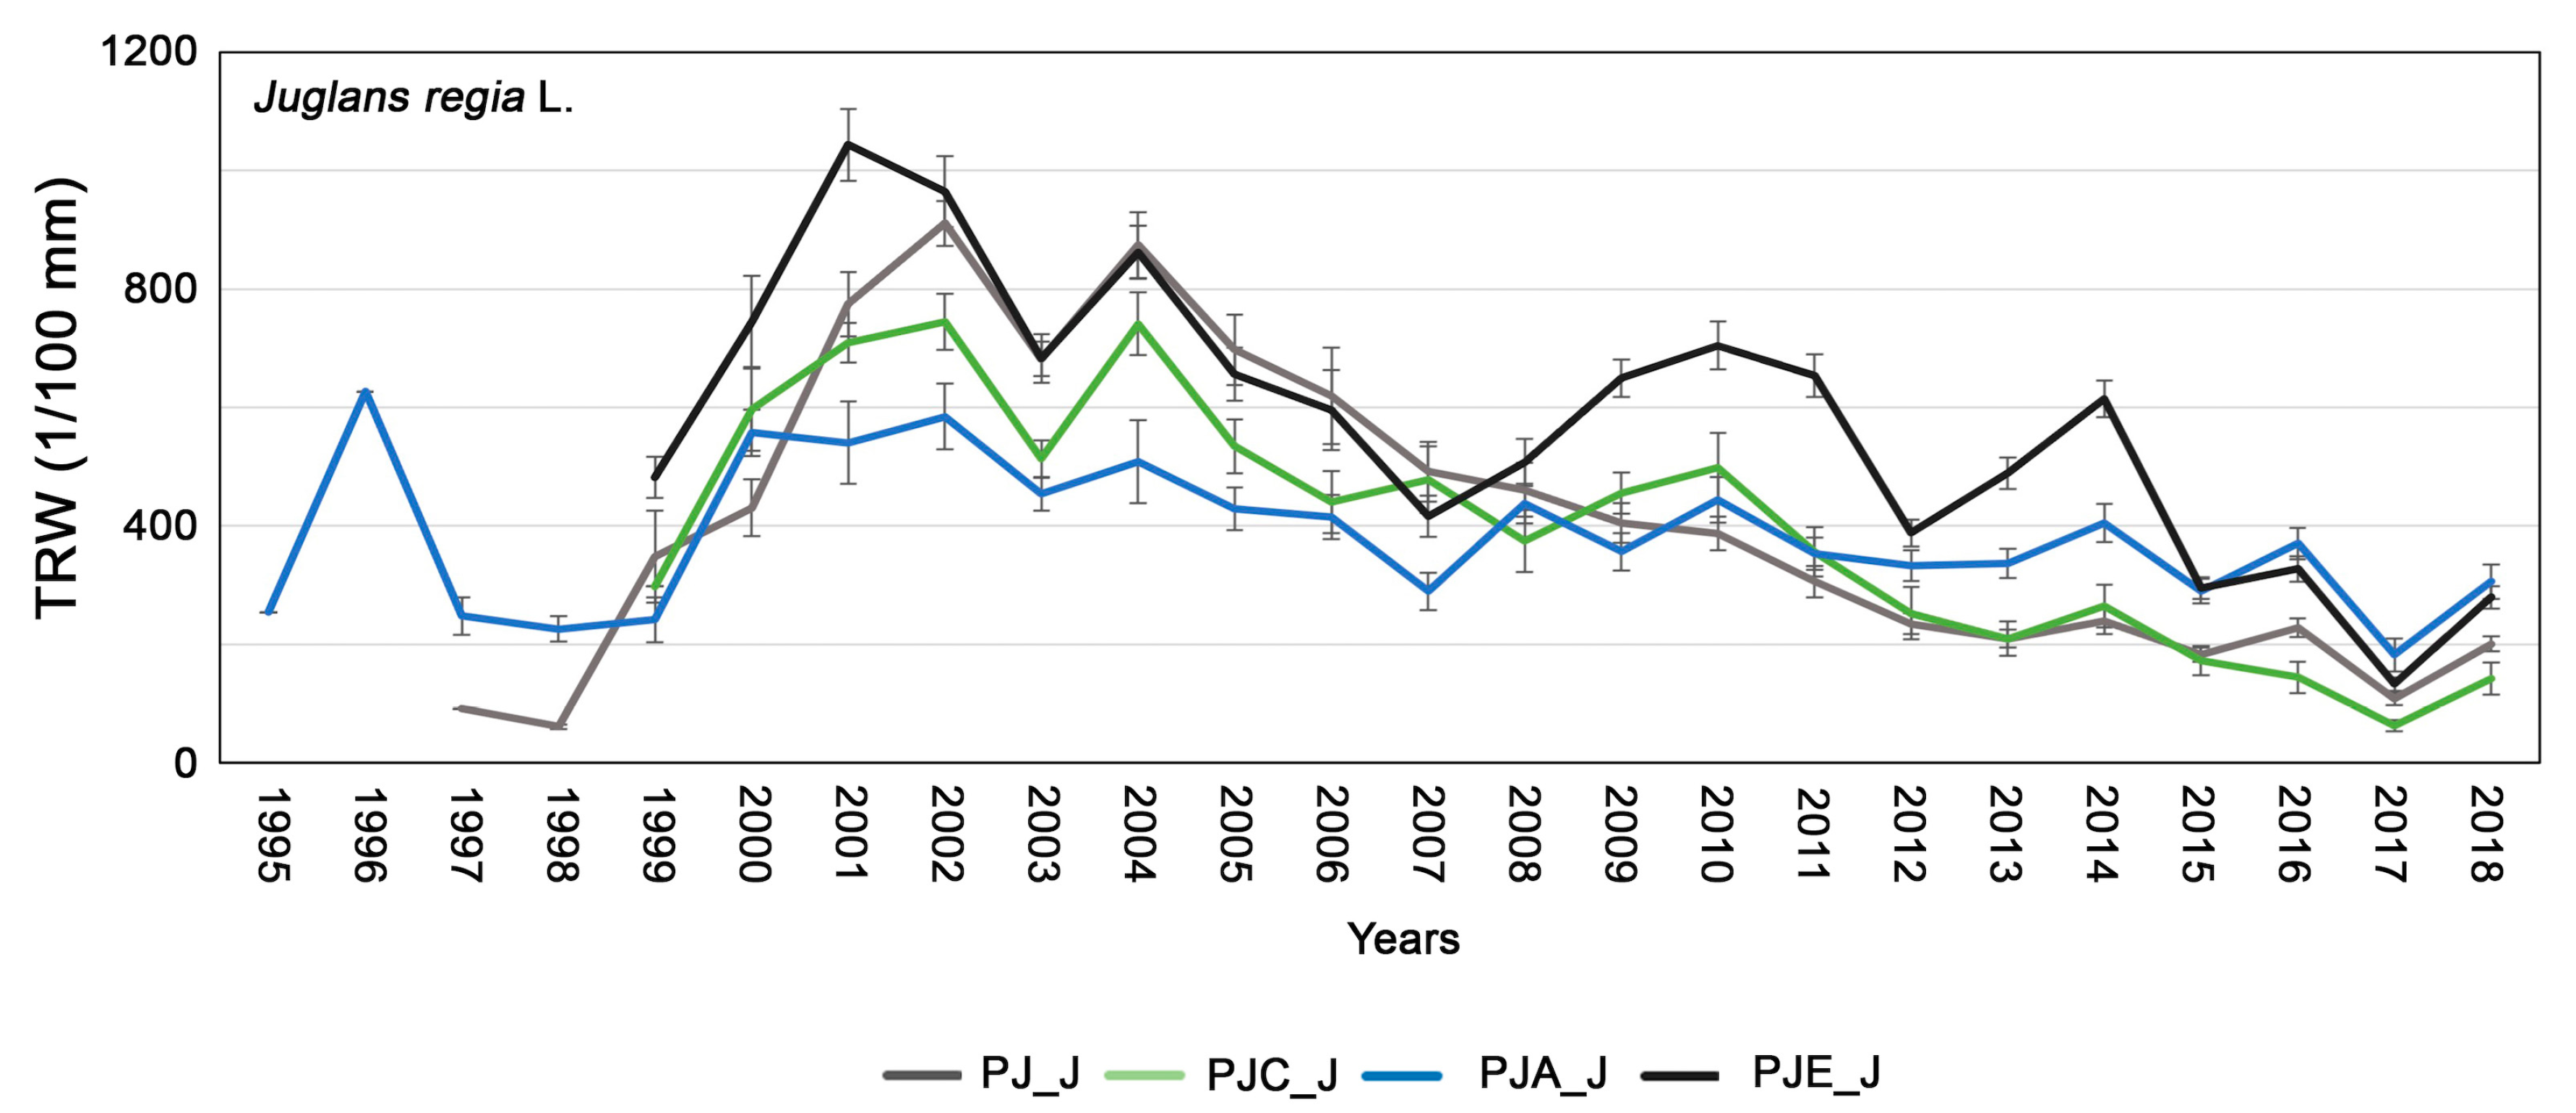
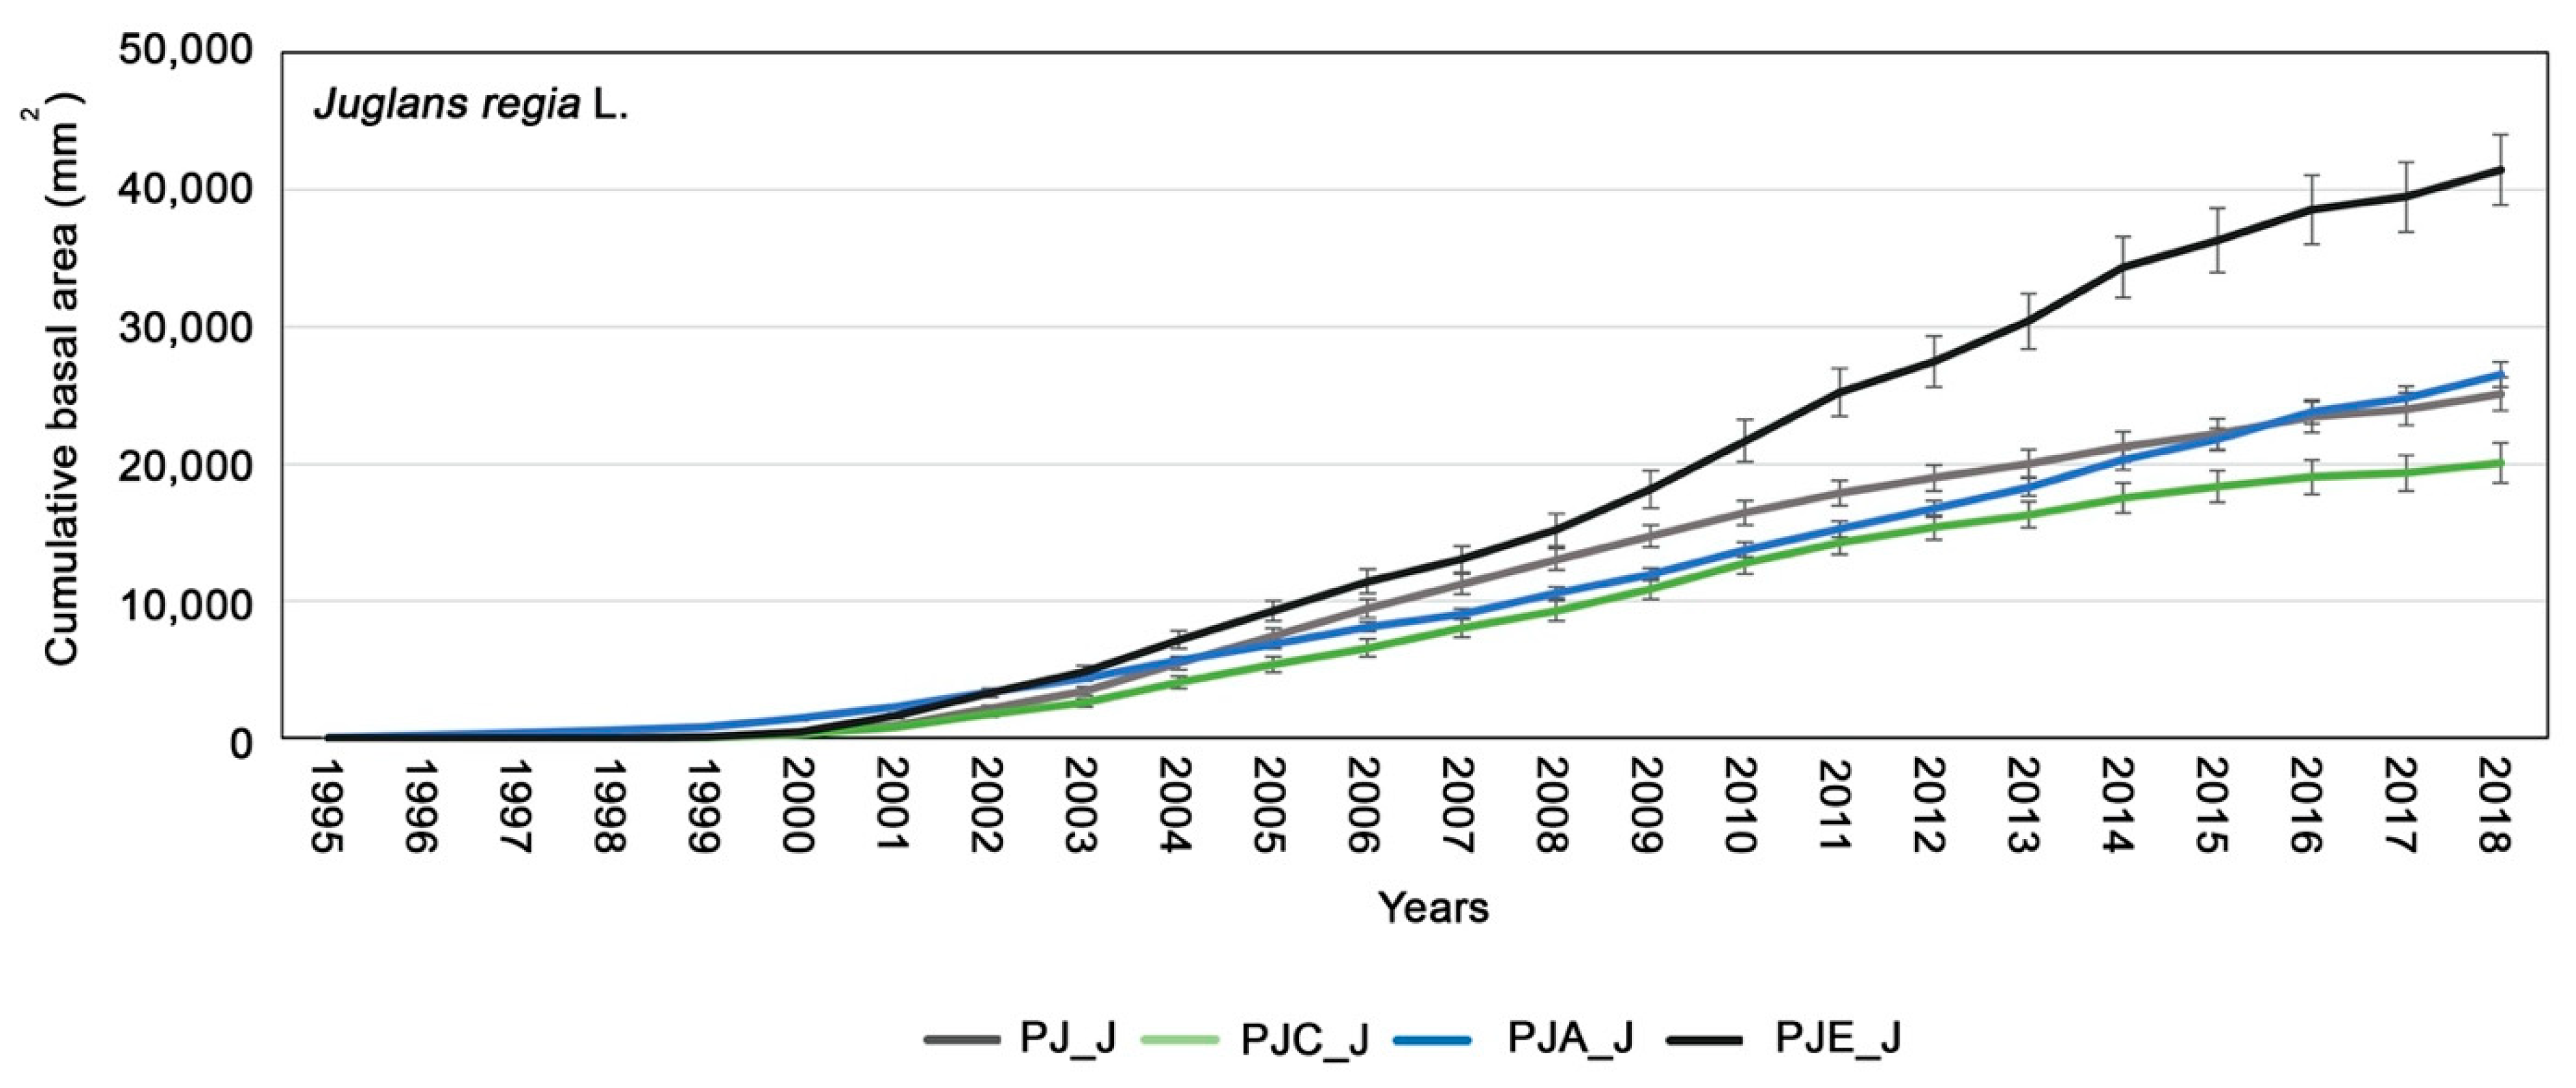
3.2. Dendrochronological Analysis of Juglans Regia

The study of the tree rings carried out suggested an absolute growth lower for J. regia than for P. alba (Figure 4, p < 0.05). The average GLK measured in the different intercropping systems was high: 76, 77, 77, and 82 in PJ_J, PJC_J, PJA_J, PJE_J, respectively. The mean chronologies of J. regia presented in all intercropping systems a reduction in tree growth in 2003, 2005, 2011, 2012, 2015, and 2017 and a homogeneous increase in tree growth in 2000, 2004, 2014 and 2018.
The mean cumulative basal area showed a similar mean growth trend for walnut in the juvenile phase and then a substantial increase in tree growth in the PJE_J (Figure 5, p = 0.02). Furthermore, the cumulative curves showed that the plants from PJA_J and PJ_J had low and similar productivity, while that of PJC_J showed the lowest growth (Figure 5).

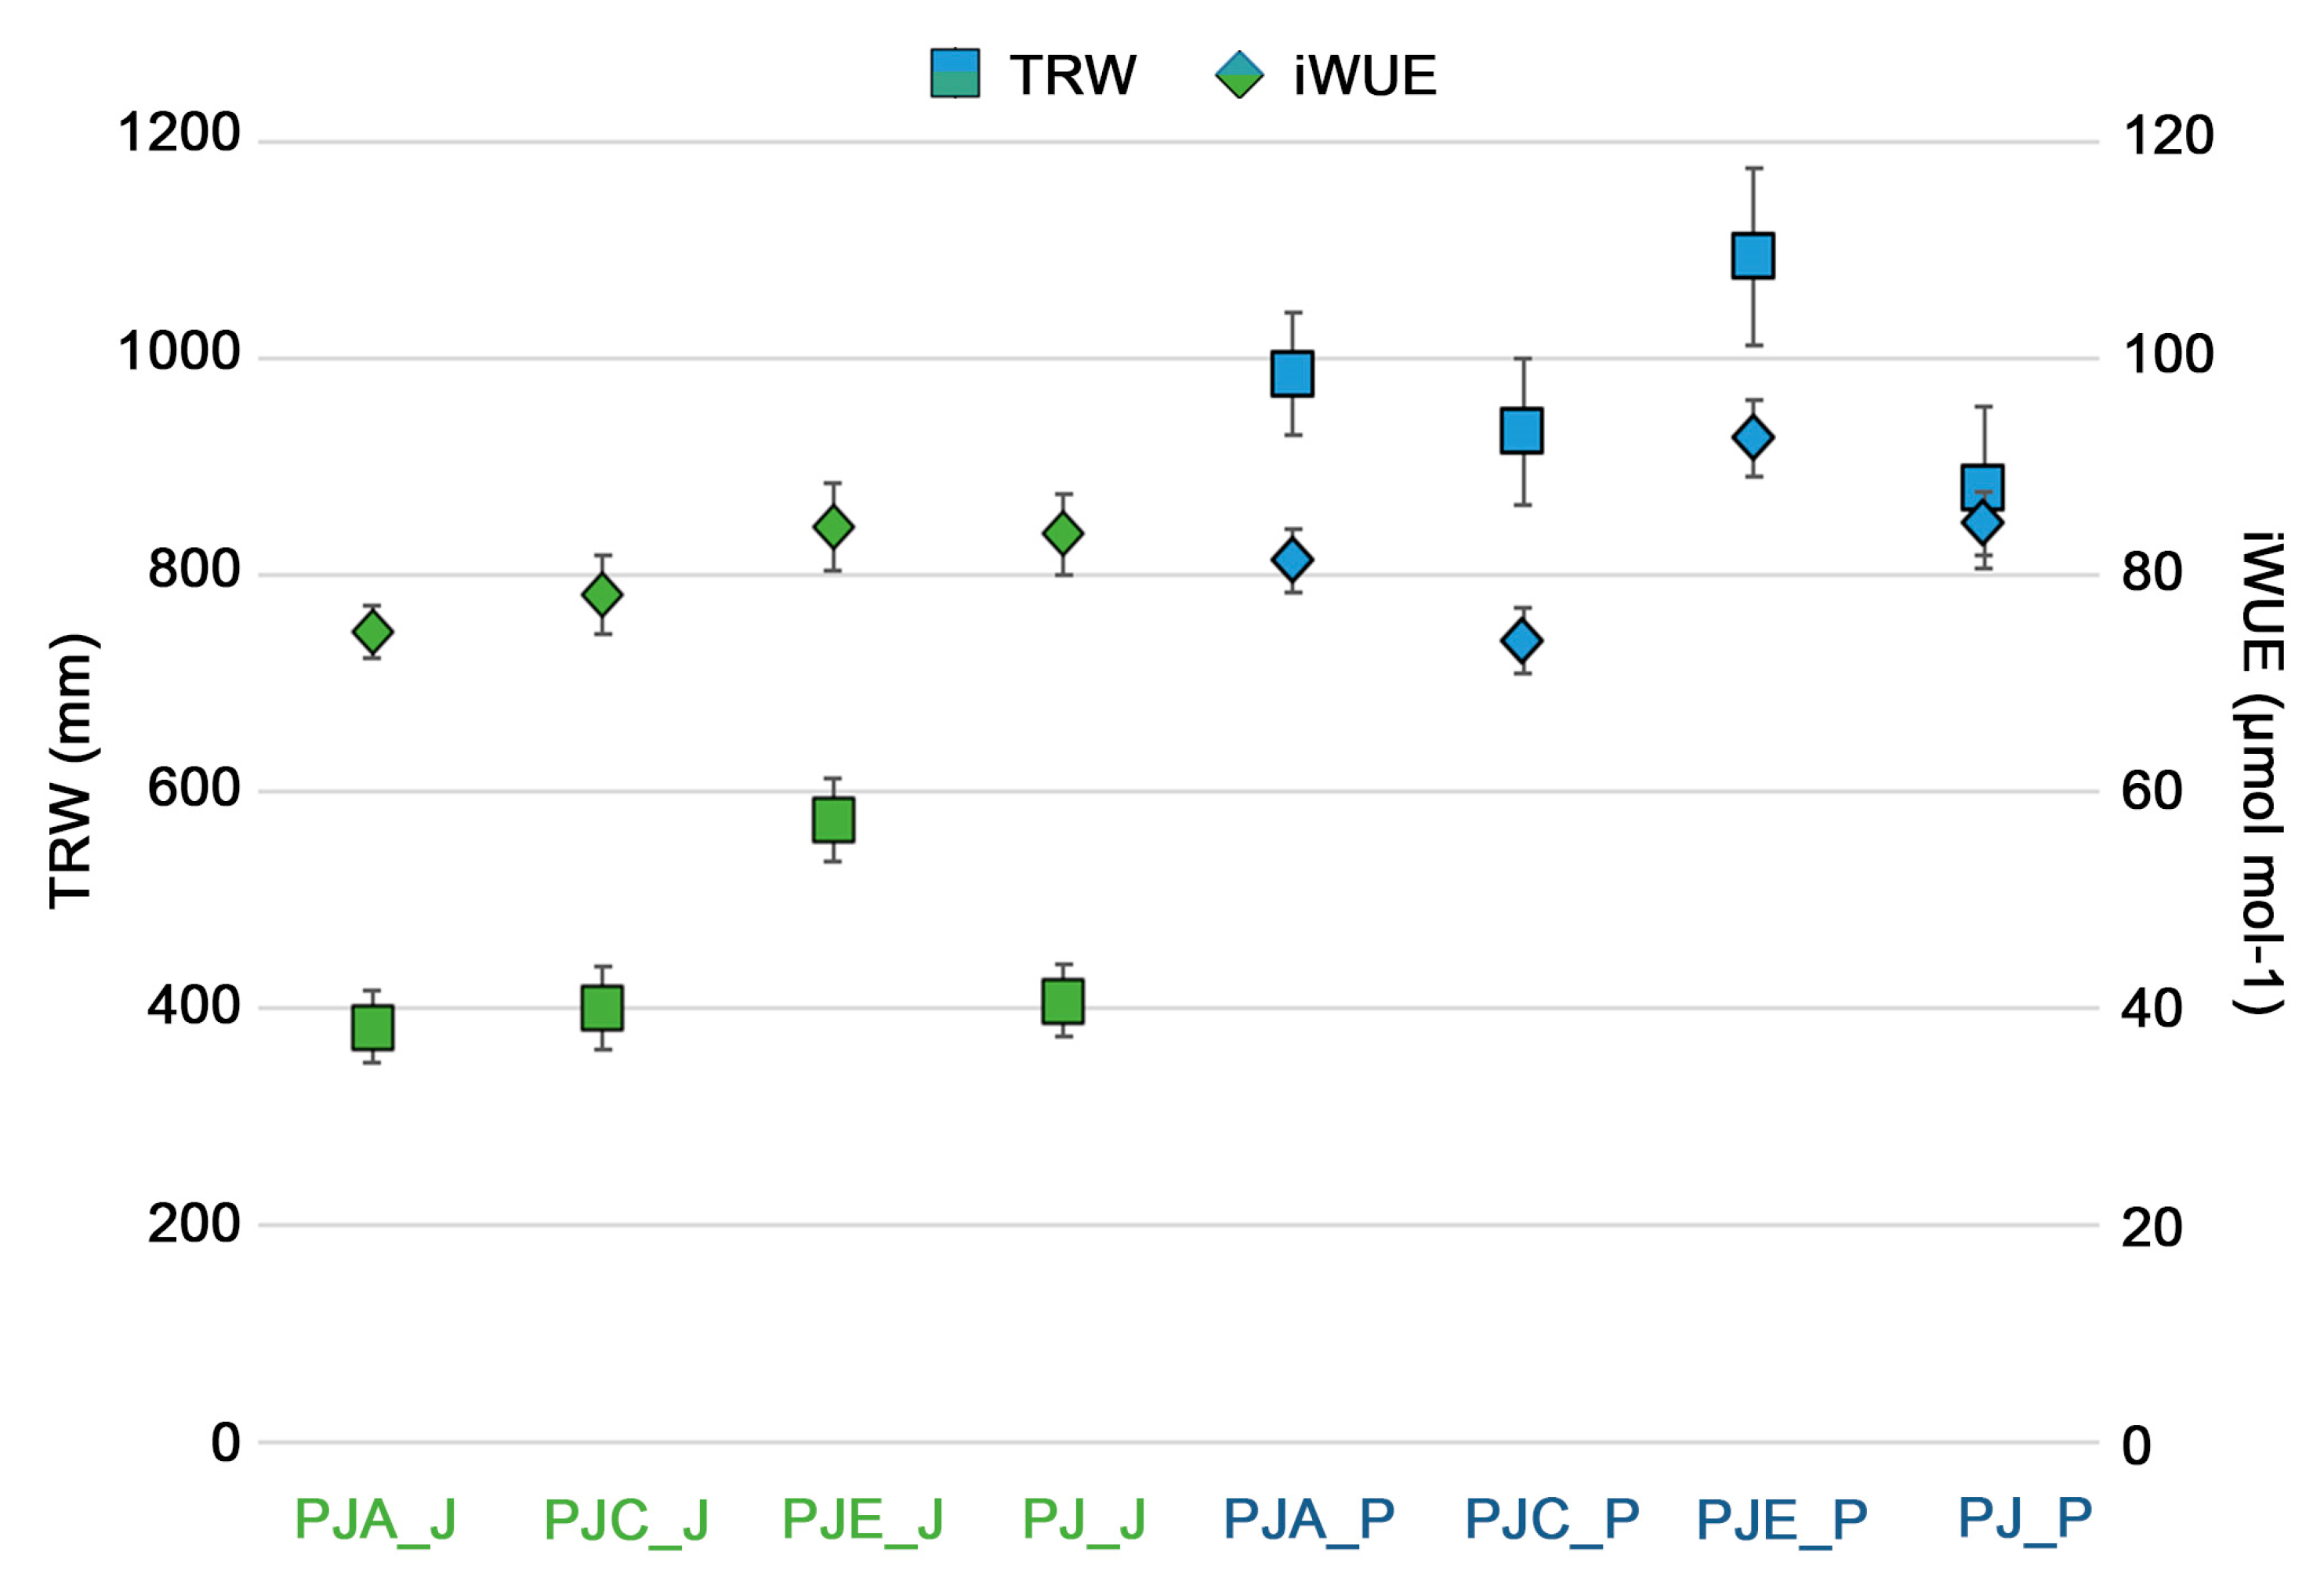
3.3. Relationship between Growth, iWUE and Climate

The comparison between the average values of iWUE and mean TRW (Figure 6), calculated for each intercropping systems, showed that both parameters had the highest value when the studied species were intercropped with E. umbellata (PJE_J, PJE_P, p = 0.008 and p = 0.006 respectively).
Climate analysis, on the other hand, suggested a positive influence of temperature on the growth of P. alba (Table 1). In all intercropping systems the CBA values correlated positively (p = 0.043) with the maximum and medium temperatures of autumn (SON = September October and November), as well as with the maximum, minimum and medium temperature of the summer period (JJA = June, July, August). On the contrary, no significant correlations (p > 0.05) were observed between growth and precipitation. However, positive correlation (r = 0.95 *) between iWUE and the precipitation in the June-July-August trimester was observed in the PJE_p plot. Finally, negative correlations with the minimum (r = −0.80 *) and medium temperatures (r = −0.82 *) of autumn were highlighted with iWUE in PJ_P (Table 2).
For J. regia we observed for all intercropping systems a positive correlation (p = 0.033) between CBA values and summer and autumn temperatures (Table 1). There were no significant correlations (p > 0.05) between precipitation and CBA. Finally, the correlations between the values of the intrinsic water use efficiency and the climatic data showed positive correlations just in PJE_J with the maximum (r = 0.86 *) and medium temperatures (r = 0.89 *) of the spring period and whit summer rainfall (r = 0.84 *) (Table 2).

3.4. Soil Properties

The soil analyses showed significant differences between intercropping systems (Table 3). As regards to soil texture (a variable that is actually independent from the tree cover, but with major repercussions on it), PJA showed the lowest sand and the highest silt contents, contrary to what happened in PJC. These differences were most likely antecedent to the establishment of trees and the used randomized blocks design approach did not completely solve the problem. On the other hand, all the tree systems had a rather homogeneous contribution from the clay fraction, which is the pedological driving factor of SOC accumulation [58,59] and water holding capacity of soil. Actually, no major differences in soil moisture (28% ± 7) were found between intercropping systems. Soil bulk density and pH were similar, no significant differences being found between plots. The C concentration in soil showed the most remarkable differences. PJC had the highest soil C content (18.19 g C kg−1), followed by far by PJA, PJ, and PJE (15.2, 13.4, and 13.2 g C kg−1, respectively). No significant difference in soil N was observed between the intercropping systems, despite the presence of N-fixer trees in two of them, i.e., PJA and PJE. The resulting C/N ratio was significantly higher in PJC (15.7), while in all the other plots it ranged between 11.5 and 13. The recalcitrant soil C fraction did not vary much between intercropping systems, ranging from 2.5% and 2.9% of TOC, with the only exception of PJ, where its contribution to TOC was even 8.4%.

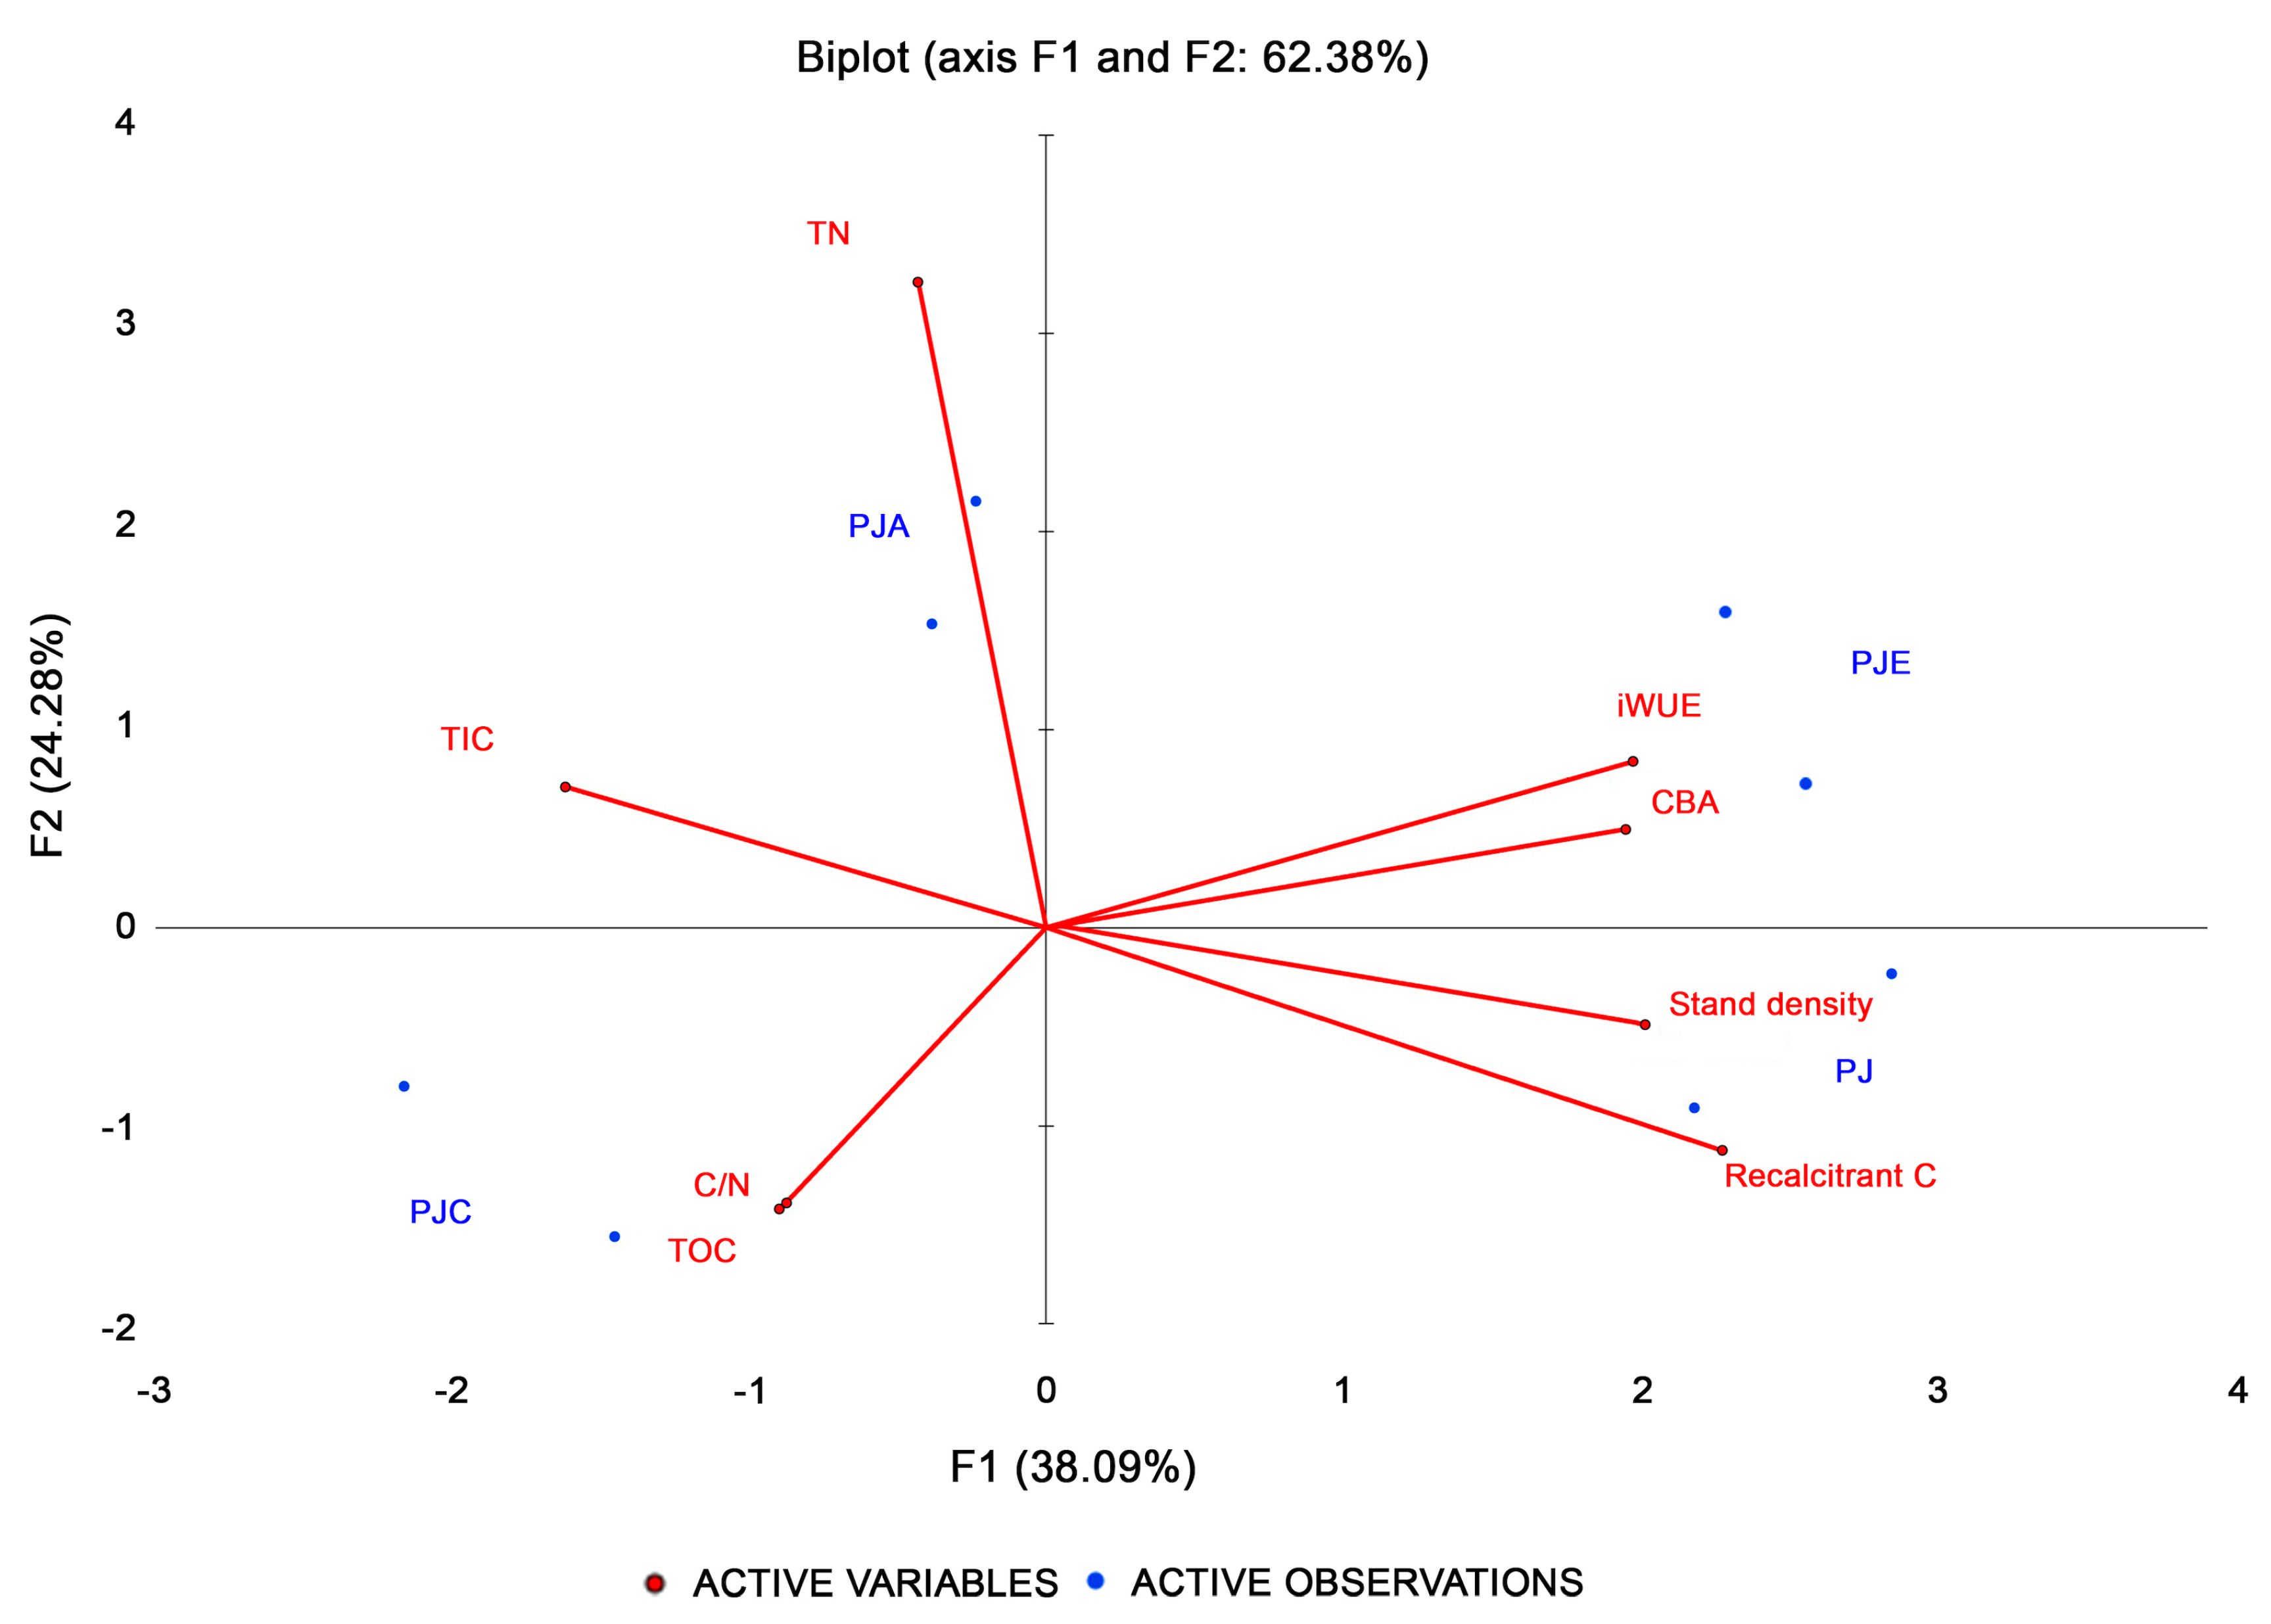
3.5. Multivariate Analysis

The PCA identified the weight of the different variables calculated for the different systems (Figure 7). The first and second components were used for the biplot, so both objects (years) and variables were represented in the same best plane explaining the maximum of variance present in the data. The first two components together explained 60.4% of the variance, with the first component (F1) explaining the higher variance (38.1%). The multivariate analysis showed a clear separation between the different mixtures, with PJ showing a strong positive correlation with recalcitrant C and stand density, and a negative correlation with TIC. Studied tree species in PJC showed a good relationship with TOC and the C/N ratio, while the PJA intercropping was positively related to TN. Finally, the distribution of PJE seemed to be positively influenced by iWUE and CBA.

4. Discussion

4.1. Influence of the Intercropping on Productivity

Climate–growth correlations proved that temperature was an important factor for the growth of the studied tree species, showing a positive influence in summer and, especially, autumn, when Mediterranean species can reactivate the cambium because the temperature and water are not limiting factors [60,61].
The mean annual and cumulative basal area of the studied tree species in all intercropping systems seemed to be linked to the ecological relationships between those species and the ancillary ones. Multi-species forest crops determine favorable interactions among species through a mechanism known as “principle of competitive production”, triggering highest productivity [22,62,63]. This effect is based on niche separation among species, thus interspecific competition can be lower than intraspecific competition for a given environmental factor (such as light, water, nutrient), determining a more efficient use of resources with consequent greater production of biomass of studied tree species [22,64]. Further positive effects can arise from the “facilitative production principle” [22,62,63], which works when the studied tree species are intercropped with facilitation plants; these are plants capable of positively influencing tree growth in terms of height and diameter of the principal species, despite the increase of stand density, through an advantageous alteration of the environmental conditions, such an increase of light availability for the crown [65].
In the PJ system the two pivotal tree species, in particular P. alba, showed low productivity despite the low stand density. Here, soil organic matter was relatively richer in the recalcitrant fraction, i.e., the one that best resists decomposition because of its intrinsic chemical composition [66,67], and this may indicate slow recycling of nutrients and their inadequate availability in the vegetative period. However, we cannot speculate further, as we explored neither the litter decay rate nor the association between SOM and the mineral fraction, which are controlling factors of nutrient availability to plants. Also, the moderate differences in soil texture we found between the various intercropping systems may have somehow affected the different growth rate.
In the PJC stands, the intercropping with C. avellana led to a positive effect on the growth of the studied tree species, at least in the first years; indeed, hazel has an excellent ability to rapidly colonize the soil with roots and reduce its competition with weed species [68], exploiting different resources. Furthermore, this ancillary species can influence the structure and the height of the canopy of the principal species, in particular of walnut [69]. However, the positive effect on growth decreased after few years. When the ancillary species become competitive, equaling or exceeding the principal species in height, thinning is necessary in order to favor the canopy development of the valuable species [69]. The intercropping with hazel promoted soil C sequestration. Indeed, it has been demonstrated that hazel positively affects forest floor mass (as is evident in our case), soil nutrients and microbial properties in mixed forests when N is not a limiting factor [70].
The introduction of N-fixing species is generally considered a good forest practice to increase soil fertility and foster the growth of principal species [15,71]. In fact, some studies found higher productivity in principal species when they were intercropped with Alnus glutinosa L., Robinia pseudoacacia L., or E. umbellata [72,73,74]. In our case, the mixed plantations with a N-fixing species, A. cordata and E. umbellata, determined a high productivity of the studied tree species with some noticeable differences. In fact, especially P. alba seemed to be better influenced by A. cordata during the juvenile phase (8 years), while in the longer-term the average tree growth was higher in the PJE stands. Italian alder, thanks to its ability to supply nitrogen, guarantees benefits to the growth and development of the canopy [75] and determines greater availability of light and space for the principal plants with its pyramidal conformation [73]. However, the absence of thinning interventions, before the onset of negative competition phenomena, in the long-term triggered a reduction in tree growth of the studied tree species in PJA compared to PJE. As demonstrated by a previous study [76] on the management of walnut-Italian alder plantations, after a certain period of time thinning of both species have positive effects on the growth of walnuts, stimulating their radial development. The PJE stands presented the highest productivity of the studied tree species, confirming results from several previous studies [73,77,78,79]. In fact, in addition to being a N-fixing plant, E. umbellata has a dense canopy able to reduce competition with weeds [80,81], forcing the valuable plants to take on a more slender shape thus positively influencing their height and diameter [72,78]. In the absence of any management intervention, the PJE intercropping offered greater benefits than PJA, most probably because Italian alder is more competitive than E. umbellata for light, water, and nutrients, especially towards the J. regia [69].

4.2. Influence on the iWUE

As P. alba and J. regia are very susceptible to water stress [82,83], the analysis of intrinsic water use efficiency may be the key to explore their different growth responses and productivity in the four systems [84]. Populus alba showed almost everywhere higher iWUE than J. regia. Poplar resorts to various drought resistance strategies that may impact productivity differently: decreased leaf area, leaf abscission, enhanced root growth, increased iWUE, stomatal closure, and osmotic adjustment, among others [83,85,86]. It has been observed that poplar genotypes with high water use efficiency were less susceptible to water stress than genotypes with low iWUE. Thus, poplars with high iWUE could be identified and selected for the purpose of ensuring high biomass productivity [87]. As for walnut, its growth is strongly affected by water deficit, which results in decreased yield [88,89] and in a strong competition for soil water when the rooting zones of neighboring plants overlap [90]. This could account for the lower tree growth and iWUE compared to P. alba.
There were no significant differences of iWUE of the studied tree species in the PJ, PJA and PJC stands, while there was in the iWUE of both studied species growing with E. umbellata. The PCA analysis showed that the higher productivity of the studied trees in the PJE stand was linked to an increase in their iWUE. Such an increase can be attributed to inherent differential physiological responses of different species [explained following [35] by either an increase assimilation (A) at constant stomatal conductance (gs) or by a reduction in gs at constant A] or by interaction effects of other environmental or climatic factors [91,92]. As the environmental variables were the same in all intercropping systems, we suggest that the increase in iWUE and productivity found in PJE could be connected to a major resource availability compared to the other stands. A previous research [40] highlighted an improvement in iWUE in the principal species Quercus robur growing together with A. cordata to be essentially due to the increase in N availability (inferred by the increase in N% in tree-rings) that induces an increase in the photosynthetic activity. Indeed, N fertilization has been frequently reported to increase tree iWUE [37,38,39].
Alnus cordata and E. umbellata are both N fixing species, but the latter appears to have favored more the studied tree species in terms of iWUE and productivity. This could be due to the different strategies for water supply implemented by growing in the mixed stands. To minimize water competition, J. regia is able to opportunistically exploit the different available water sources [93], thanks to a very deep and plastic root system [94]. In fact, in the first years of growth, the roots reach a depth of about 3–5 m [95,96], while later they can even deepen up to 10 m [97]. However, intercropping with A. cordata can limit roots development in J. regia [98]. Therefore, one can hypothesize that in the PJA, a lower root development of the walnut intercropped with an extensive and shallow root system of P. alba and A. cordata [93], forced the three species to compete for water supply. Such a competition may have resulted in an increase in iWUE and lower productivity of the studied tree species in comparison to the PJE system. On the other hand, intercropping with E. umbellata (PJE), an ancillary tree with a superficial root system, could have favored a non-competitive exploitation of the soil water resources with the principal plants. The positive correlations found between the summer precipitations and the iWUE values of the studied tree species (Table 2) confirmed greater availability of water in those systems. Indeed, studied species improved their water use efficiency during the June–July–August period. This likely resulted in an increase in photosynthetic activity (A) in the studied tree species, then translated into higher productivity [99]. Furthermore, the shrubby conformation of E. umbellata, unlike Italian alder, implies lower evaporation of water thanks to a greater soil cover [78] ensuring large water availability and providing shelter and protection to the main species, particularly in the juvenile stages [100].

5. Conclusions

We found that Populus alba and Juglans regia increased their tree growth when growing with ancillary species, especially with N-fixing species, such as A. cordata and E. umbellata. Further, in all the intercropping systems, the mixture with hazel enhanced soil C stock.
Populus alba productivity increased especially in the juvenile phase (first 8 years), while in the adult phase we could speculate that resources competition among species became limiting (both aboveground and belowground), in particular with C. avellana.
Management practices, such as thinning and pruning, as well as scheduling a gradual removal of fast-growing species are thus crucial to favor the development of the principal species in these mixed plantations. Of the two intercropping systems with N-fixing species, the one with E. umbellata promoted water use efficiency better in both studied tree species, in particular in poplar.
Our study confirms our research hypothesis that companion species, especially with N-fixing species, can influence substantially wood formation and growth as well as soil C stock and highlights the importance of carefully considering the species dynamics in planning forest management.

Supplementary Materials

The following are available online at https://www.mdpi.com/article/10.3390/f12091251/s1, Figure S1: (A) Study area in which four intercropping systems were compared using a randomized blocks design with three replications. Photo modified by Google Earth, (B) Planting layout of the different intercropping. On the left poplar and walnut intercropping, on the right poplar and walnut intercropped respectively with hazel, italian alder and autumn-olive.

Author Contributions

G.B., F.P., G.C. and A.F. conceived and designed the study; F.N., T.D., M.I., G.M., G.B., M.C.M., F.P. and G.C. performed sampling; F.N. and G.B. performed dendrochronological and isotope analyses and data interpretation; T.D., M.I. and G.M. performed soil measurements; all authors contributed to interpretation of the overall data; F.N. and G.B. wrote the main part of the manuscript. All authors have read and agreed to the published version of the manuscript.

Funding

This research received no external funding.

Institutional Review Board Statement

Not applicable.

Informed Consent Statement

Not applicable.

Data Availability Statement

The data presented in this study are available on request from the corresponding author.

Acknowledgments

The author wishes to thank Vita Criscuolo for support in field activity and data curation. G. Battipaglia and F. Niccoli wish to thanks the VALERE PROJECT of University of Campania “Luigi Vanvitelli” and the MIUR-PRIN 2017 project “The Italian TREETALKER NETWORK: continuous large scale monitoring of tree functional traits and vulnerabilities to climate change”.

Conflicts of Interest

The authors declare no conflict of interest.

References

  1. Food and Agriculture Organsiation of the United Nations. Global Forest Resources Assessment 2020; FAO: Rome, Italy, 2020. [Google Scholar]
  2. Zhao, M.; Yang, J.; Zhao, N.; Liu, Y.; Wang, Y.; Wilson, J.P.; Yue, T. Estimation of China’s forest stand biomass carbon sequestration based on the continuous biomass expansion factor model and seven forest inventories from 1977 to 2013. For. Ecol. Manag. 2019, 448, 528–534. [Google Scholar] [CrossRef]
  3. Agnoletti, M. The degradation of traditional landscape in a mountain area of Tuscany during the 19th and 20th centuries: Implications for biodiversity and sustainable management. For. Ecol. Manag. 2007, 249, 5–17. [Google Scholar] [CrossRef]
  4. Ferretti, M.; Bacaro, G.; Brunialti, G.; Confalonieri, M.; Cristofolini, F.; Cristofori, A.; Frati, L.; Finco, A.; Gerosa, G.; Maccherini, S.; et al. Scarce evidence of ozone effect on recent health and productivity of alpine forests—A case study in Trentino, N. Italy. Environ. Sci. Pollut. Res. 2018, 25, 8217–8232. [Google Scholar] [CrossRef]
  5. Evans, J. Planted Forests: Uses, Impacts and Sustainability; FAO: Rome, Italy, 2009; ISBN 9781845935641. [Google Scholar]
  6. Food and Agriculture Organsiation of the United Nations. Global Forest Resources Assessment 2015; FAO: Rome, Italy, 2015; ISBN 9789251088210. [Google Scholar]
  7. IFD. Evaluation of the Community Aid Scheme for Forestry Measures in Agriculture of Regulation No 2080/92; Institute for Forestry Development: Joensuu, Finland, 2001. [Google Scholar]
  8. Kelty, M.J. The role of species mixtures in plantation forestry. For. Ecol. Manag. 2006, 233, 195–204. [Google Scholar] [CrossRef]
  9. Piotto, D. A meta-analysis comparing tree growth in monocultures and mixed plantations. For. Ecol. Manag. 2008, 255, 781–786. [Google Scholar] [CrossRef]
  10. Richards, A.E.; Forrester, D.I.; Bauhus, J.; Scherer-Lorenzen, M. The influence of mixed tree plantations on the nutrition of individual species: A review. Tree Physiol. 2010, 30, 1192–1208. [Google Scholar] [CrossRef] [Green Version]
  11. Alem, S.; Pavlis, J.; Urban, J.; Kucera, J. Pure and Mixed Plantations of Eucalyptus camaldulensis and Cupressus lusitanica: Their Growth Interactions and Effect on Diversity and Density of Undergrowth Woody Plants in Relation to Light. Open J. For. 2015, 5, 375–386. [Google Scholar] [CrossRef] [Green Version]
  12. Khanna, P.K. Comparison of growth and nutrition of young monocultures and mixed stands of Eucalyptus globulus and Acacia mearnsii. For. Ecol. Manag. 1997, 94, 105–113. [Google Scholar] [CrossRef]
  13. Liu, D.; Wang, Z.; Zhang, B.; Song, K.; Li, X.; Li, J.; Li, F.; Duan, H. Spatial distribution of soil organic carbon and analysis of related factors in croplands of the black soil region, Northeast China. Agric. Ecosyst. Environ. 2006, 113, 73–81. [Google Scholar] [CrossRef]
  14. Altieri, M.A. The Ecological Impacts of Large-Scale Agrofuel Monoculture Production Systems in the Americas. Bull. Sci. Technol. Soc. 2009, 29, 236–244. [Google Scholar] [CrossRef]
  15. Forrester, D.I.; Bauhus, J.; Cowie, A.L.; Vanclay, J.K. Mixed-species plantations of Eucalyptus with nitrogen-fixing trees: A review. For. Ecol. Manag. 2006, 233, 211–230. [Google Scholar] [CrossRef] [Green Version]
  16. Liu, C.L.C.; Kuchma, O.; Krutovsky, K.V. Mixed-species versus monocultures in plantation forestry: Development, benefits, ecosystem services and perspectives for the future. Glob. Ecol. Conserv. 2018, 15, e00419. [Google Scholar] [CrossRef]
  17. Pelleri, F.; Pelleri, F.; Castro, G.; Marchi, M.; Fernandez-Moya, J.; Chiararbaglio, P.M.; Giorcelli, A.; Bergante, S.; Gennaro, M.; Manetti, M.C.; et al. The walnut plantations (Juglans spp.) in Italy and Spain: Main factors affecting growth. Ann. Silvic. Res. 2020, 44, 14–23. [Google Scholar] [CrossRef]
  18. Pelleri, F.; Ravagni, S.; Bianchetto, E.; Bidini, C. Comparing growth rate in a mixed plantation (walnut, poplar and nurse trees) with different planting designs: Results from an experimental plantation in Northern Italy. Ann. Silvic. Res. 2013, 37, 13–21. [Google Scholar] [CrossRef]
  19. Booth, T.H.; Williams, K.J. Developing biodiverse plantings suitable for changing climatic conditions 1: Underpinning scientific methods. Ecol. Manag. Restor. 2012, 13, 267–273. [Google Scholar] [CrossRef]
  20. Hulvey, K.B.; Hobbs, R.J.; Standish, R.J.; Lindenmayer, D.B.; Lach, L.; Perring, M.P. Benefits of tree mixes in carbon plantings. Nat. Clim. Chang. 2013, 3, 869–874. [Google Scholar] [CrossRef]
  21. Bauhus, J.; Forrester, D.I.; Pretzsch, H. From Observations to Evidence About Effects of Mixed-Species Stands BT—Mixed-Species Forests: Ecology and Management; Pretzsch, H., Forrester, D.I., Bauhus, J., Eds.; Springer: Berlin/Heidelberg, Germany, 2017; pp. 27–71. ISBN 978-3-662-54553-9. [Google Scholar]
  22. Vandermeer, J. The Ecology of Intercropping; Cambridge University Press: Cambridge, UK, 1992; ISBN 0521346894. [Google Scholar]
  23. Butterfield, R.P. Tropical Timber Species in the Atlantic Low-Lands of Costa Rica and Wood Variation of Two Native Species; North Carolina State University: Raleigh, NC, USA, 1993. [Google Scholar]
  24. Crews, T.E.; Peoples, M.B. Legume versus fertilizer sources of nitrogen: Ecological tradeoffs and human needs. Agric. Ecosyst. Environ. 2004, 102, 279–297. [Google Scholar] [CrossRef]
  25. Vidal, D.F.; Trichet, P.; Puzos, L.; Bakker, M.R.; Delerue, F.; Augusto, L. Intercropping N-fixing shrubs in pine plantation forestry as an ecologically sustainable management option. For. Ecol. Manag. 2019, 437, 175–187. [Google Scholar] [CrossRef]
  26. Danise, T.; Andriuzzi, W.S.; Battipaglia, G.; Certini, G.; Guggenberger, G.; Innangi, M.; Mastrolonardo, G.; Niccoli, F.; Pelleri, F.; Fioretto, A. Mixed-species plantation effects on soil biological and chemical quality and tree growth of a former agricultural land. Forests 2021, 12, 842. [Google Scholar] [CrossRef]
  27. Torbert, J.L.; Burger, J.A. Forest land reclamation. In Reclamation of Drastically Disturbed Lands; Barnhisel, R.I., Darmody, R.G., Daniels, W.L., Eds.; Agronomy 41 American Society of Agronomy: Madison, WI, USA, 2000; pp. 371–398. [Google Scholar]
  28. Chiti, T.; Certini, G.; Puglisi, A.; Sanesi, G.; Capperucci, A.; Forte, C. Effects of associating a N-fixer species to monotypic oak plantations on the quantity and quality of organic matter in minesoils. Geoderma 2007, 138, 162–169. [Google Scholar] [CrossRef]
  29. Voigtlaender, M.; Laclau, J.P.; de Gonçalves, J.L.M.; de Piccolo, M.C.; Moreira, M.Z.; Nouvellon, Y.; Ranger, J.; Bouillet, J.P. Introducing Acacia mangium trees in Eucalyptus grandis plantations: Consequences for soil organic matter stocks and nitrogen mineralization. Plant Soil 2012, 352, 99–111. [Google Scholar] [CrossRef]
  30. Hoogmoed, M.; Cunningham, S.C.; Baker, P.J.; Beringer, J.; Cavagnaro, T.R. Is there more soil carbon under nitrogen-fixing trees than under non-nitrogen-fixing trees in mixed-species restoration plantings? Agric. Ecosyst. Environ. 2014, 188, 80–84. [Google Scholar] [CrossRef]
  31. Johnson, D.W.; Curtis, P.S. Effects of forest management on soil C and N storage: Meta analysis. For. Ecol. Manag. 2001, 140, 227–238. [Google Scholar] [CrossRef]
  32. Marron, N.; Epron, D. Are mixed-tree plantations including a nitrogen-fixing species more productive than monocultures? For. Ecol. Manag. 2019, 441, 242–252. [Google Scholar] [CrossRef]
  33. Bertness, M.D.; Callaway, R. Positive interactions in communities. Trends Ecol. Evol. 1994, 9, 191–193. [Google Scholar] [CrossRef]
  34. Forrester, D.I. The spatial and temporal dynamics of species interactions in mixed-species forests: From pattern to process. For. Ecol. Manag. 2014, 312, 282–292. [Google Scholar] [CrossRef]
  35. Farquhar, G.D.; O’Leary, M.H.; Berry, J.A. On the relationship between carbon isotope discrimination and the intercellular carbon dioxide concentration in leaves. Aust. J. Plant. Physiol. 1982, 9, 121. [Google Scholar] [CrossRef]
  36. Vanclay, J.K. Managing water use from forest plantations. For. Ecol. Manag. 2009, 257, 385–389. [Google Scholar] [CrossRef] [Green Version]
  37. Siegwolf, R.T.W.; Matyssek, R.; Saurer, M.; Maurer, S.; Günthardt-Goerg, M.S.; Schmutz, P.; Bucher, J.B. Stable isotope analysis reveals differential effects of soil nitrogen and nitrogen dioxide on the water use efficiency in hybrid poplar leaves. New Phytol. 2001, 149, 233–246. [Google Scholar] [CrossRef]
  38. Ripullone, F.; Lauteri, M.; Grassi, G.; Amato, M.; Borghetti, M. Variation in nitrogen supply changes water-use efficiency of Pseudotsuga menziesii and Populus x euroamericana; a comparison of three approaches to determine water-use efficiency. Tree Physiol. 2004, 24, 671–679. [Google Scholar] [CrossRef]
  39. Guerrieri, R.; Siegwolf, R.; Saurer, M.; Ripullone, F.; Mencuccini, M.; Borghetti, M. Anthropogenic NOx emissions alter the intrinsic water-use efficiency (WUEi) for Quercus cerris stands under Mediterranean climate conditions. Environ. Pollut. 2010, 158, 2841–2847. [Google Scholar] [CrossRef]
  40. Battipaglia, G.; Pelleri, F.; Lombardi, F.; Altieri, S.; Vitone, A.; Conte, E.; Tognetti, R. Effects of associating Quercus robur L. and Alnus cordata Loisel. on plantation productivity and water use efficiency. For. Ecol. Manag. 2017, 391, 106–114. [Google Scholar] [CrossRef]
  41. Nichols, E.; Larsen, T.; Spector, S.; Davis, A.L.; Escobar, F.; Favila, M.; Vulinec, K. Global dung beetle response to tropical forest modification and fragmentation: A quantitative literature review and meta-analysis. Biol. Conserv. 2007, 137, 1–19. [Google Scholar] [CrossRef] [Green Version]
  42. Manson, D.G.; Schmidt, S.; Bristow, M.; Erskine, P.D.; Vanclay, J.K. Species-site matching in mixed species plantations of native trees in tropical Australia. Agrofor. Syst. 2013, 87, 233–250. [Google Scholar] [CrossRef]
  43. Nguyen, H.; Firn, J.; Lamb, D.; Herbohn, J. Wood density: A tool to find complementary species for the design of mixed species plantations. For. Ecol. Manag. 2014, 334, 106–113. [Google Scholar] [CrossRef]
  44. Eckstein, D.; Bauch, J. Beitrag zur Rationalisierung eines dendrochronologischen Verfahrens und zur Analyse seiner Aussagesicherheit. Forstwiss. Cent. 1969, 88, 230–250. [Google Scholar] [CrossRef]
  45. Martín-Benito, D.; Del Río, M.; Heinrich, I.; Helle, G.; Cañellas, I. Response of climate-growth relationships and water use efficiency to thinning in a Pinus nigra afforestation. For. Ecol. Manag. 2010, 259, 967–975. [Google Scholar] [CrossRef]
  46. Biondi, F. Comparing tree-ring chronologies and repeated timber inventories as forest monitoring tools. Ecol. Appl. 1999, 9, 216. [Google Scholar] [CrossRef]
  47. Battipaglia, G.; Zalloni, E.; Castaldi, S.; Marzaioli, F.; Cazzolla-Gatti, R.; Lasserre, B.; Tognetti, R.; Marchetti, M.; Valentini, R. Long tree-ring chronologies provide evidence of recent tree growth decrease in a central african tropical forest. PLoS ONE 2015, 10, e0120962. [Google Scholar] [CrossRef] [PubMed]
  48. Niccoli, F.; Pelleri, F.; Manetti, M.C.; Sansone, D.; Battipaglia, G. Effects of thinning intensity on productivity and water use efficiency of Quercus robur L. For. Ecol. Manag. 2020, 473, 118282. [Google Scholar] [CrossRef]
  49. Gee, G.W.; Bauder, J.W. Particle-size analysis. In Methods of Soil Analysis; Klute, A., Ed.; Soil Science Society of America: Madison, WI, USA, 1986; pp. 383–411. [Google Scholar]
  50. Santi, C.; Certini, G.; D’Acqui, L.P. Direct determination of organic carbon by dry combustion in soils with carbonates. Commun. Soil Sci. Plant Anal. 2006, 37, 155–162. [Google Scholar] [CrossRef]
  51. Zimmermann, M.; Leifeld, J.; Abiven, S.; Schmidt, M.W.I.; Fuhrer, J. Sodium hypochlorite separates an older soil organic matter fraction than acid hydrolysis. Geoderma 2007, 139, 171–179. [Google Scholar] [CrossRef]
  52. Farquhar, G.D.; Ehleringer, J.R.; Hubick, K.T. Carbon Isotope Discrimination and Photosynthesis. Annu. Rev. Plant. Physiol. Plant Mol. Biol. 1989, 40, 503–537. [Google Scholar] [CrossRef]
  53. McCarroll, D.; Loader, N.J. Stable isotopes in tree rings. Quat. Sci. Rev. 2004, 23, 771–801. [Google Scholar] [CrossRef]
  54. Harris, I.; Jones, P.D.; Osborn, T.J.; Lister, D.H. Updated high-resolution grids of monthly climatic observations—The CRU TS3.10 Dataset. Int. J. Climatol. 2014, 34, 623–642. [Google Scholar] [CrossRef] [Green Version]
  55. Cook, E.R.; Kairiukstis, L.A. Methods of Dendrochronology: Applications in the Environmental Sciences; Springer: Dordrecht, The Netherlands, 1990; ISBN 0-7923-0586-8. [Google Scholar]
  56. Podani, J. Introduction to the Exploration of Multivariate Biological Data; Backhuys Publishers: Leiden, The Netherlands, 2000; ISBN 90-5782-067-6. [Google Scholar]
  57. Podani, J. Multivariate Data Analysis in Ecology and Systematics: A Methodological Guide to the SYN-TAX 5.0 Package; SPB Academic Publishing: Amsterdam, The Netherlands, 1994; ISBN 9051030940. [Google Scholar]
  58. McLauchlan, K. The Nature and Longevity of Agricultural Impacts on Soil Carbon and Nutrients: A Review. Ecosystems 2006, 9, 1364–1382. [Google Scholar] [CrossRef]
  59. Matus, F.J. Fine silt and clay content is the main factor defining maximal C and N accumulations in soils: A meta-analysis. Sci. Rep. 2021, 11, 6438. [Google Scholar] [CrossRef]
  60. Balzano, A.; Čufar, K.; Battipaglia, G.; Merela, M.; Prislan, P.; Aronne, G.; De Micco, V. Xylogenesis reveals the genesis and ecological signal of IADFs in Pinus pinea L. and Arbutus unedo L. Ann. Bot. 2018, 121, 1231–1242. [Google Scholar] [CrossRef]
  61. Balzano, A.; Battipaglia, G.; Cherubini, P.; De Micco, V. Xylem plasticity in pinus pinaster and quercus ilex growing at sites with different water availability in the mediterranean region: Relations between intra-annual density fluctuations and environmental conditions. Forests 2020, 11, 379. [Google Scholar] [CrossRef] [Green Version]
  62. Loreau, M.; Hector, A. Partitioning selection and complementarity in biodiversity experiments. Nature 2001, 412, 72–76. [Google Scholar] [CrossRef]
  63. Tobner, C.M.; Paquette, A.; Reich, P.B.; Gravel, D.; Messier, C. Advancing biodiversity-ecosystem functioning science using high-density tree-based experiments over functional diversity gradients. Oecologia 2014, 174, 609–621. [Google Scholar] [CrossRef]
  64. Kelty, M.J.; Cameron, I. Plot designs for the analysis of species interactions in mixed stands. Commonw. For. Rev. 1995, 74, 322–332. [Google Scholar]
  65. Pretzsch, H. Canopy space filling and tree crown morphology in mixed-species stands compared with monocultures. For. Ecol. Manag. 2014, 327, 251–264. [Google Scholar] [CrossRef] [Green Version]
  66. Fang, C.; Smith, P.; Moncrieff, J.B.; Smith, J.U. Similar response of labile and resistant soil organic matter pools to changes in temperature. Nature 2005, 433, 57–59. [Google Scholar] [CrossRef]
  67. von Lützow, M.; Kögel-Knabner, I.; Ekschmitt, K.; Flessa, H.; Guggenberger, G.; Matzner, E.; Marschner, B. SOM fractionation methods: Relevance to functional pools and to stabilization mechanisms. Soil Biol. Biochem. 2007, 39, 2183–2207. [Google Scholar] [CrossRef]
  68. Becquey, J.; Vidal, C. Quels accompagnements ligneux choisir pour les plantations de noyer? Forêt Entrep. 1997, 170, 35–38. [Google Scholar]
  69. Bianchetto, E.; Vitone, A.; Bidini, C.; Pelleri, F. Effetto di differenti tipologie di consociazione sull’accrescimento e sulla qualità del noce comune (Juglans regia L.) in un impianto di arboricoltura da legno nell’Italia centrale. Ann. Silvic. Res. 2013, 37, 38. [Google Scholar] [CrossRef]
  70. Mohr, D.; Topp, W. Hazel improves soil quality of sloping oak stands in a German low mountain range. Ann. For. Sci. 2005, 62, 23–29. [Google Scholar] [CrossRef] [Green Version]
  71. Frouz, J.; Keplin, B.; Pižl, V.; Tajovský, K.; Starý, J.; Lukešová, A.; Nováková, A.; Balík, V.; Háněl, L.; Materna, J.; et al. Soil biota and upper soil layer development in two contrasting post-mining chronosequences. Ecol. Eng. 2001, 17, 275–284. [Google Scholar] [CrossRef]
  72. Becciolini, R.; Pelleri, F. Consociazione tra farnia e ontano napoletano: Valutazione degli effetti in un impianto prima e dopo il diradamento. Sherwood For. Alberi Oggi 2006, 119, 11–16. [Google Scholar]
  73. Tani, A.; Maltoni, A.; Mariotti, B.; Buresti Lattes, E. Juglans regia L. tree plantations for wood production in mining area of S. Barbara (AR). Evaluation of N-fixing accessory trees effect. For. Riv. Selvic. Ecol. For. 2006, 3, 588–597. [Google Scholar] [CrossRef] [Green Version]
  74. Corazzesi, A.; Tani, A.; Pelleri, F. Effetto della consociazione e del diradamento in un impianto di arboricoltura da legno con latifoglie di pregio dopo oltre. Ann. Silvic. Res. 2010, 36, 37–48. [Google Scholar] [CrossRef]
  75. Buresti, E.; Domenach, A.M.; Bosco, M.; Moiroud, A. Comparison Between Quercus Robur/Alnus Cordata Mixed Plantation and Quercus Robur in Monoculture BT—Nitrogen Fixation. In Proceedings of the Fifth International Symposium on Nitrogen Fixation with Non-Legumes, Florence, Italy, 10–14 September 1990; Polsinelli, M., Materassi, R., Vincenzini, M., Polsinelli, M., Materassi, R., Vincenzini, M., Eds.; Springer Netherlands: Dordrecht, The Netherlands, 1991; pp. 651–652, ISBN 978-94-011-3486-6. [Google Scholar]
  76. Cutini, A.; Giannini, T. Effetti della consociazione con Alnus cordata sulla funzionalità di impianti di noce comune (Juglans regia L.) sottoposti a diradamento. J. Silvic. For. Ecol. 2009, 6, 29–38. [Google Scholar] [CrossRef] [Green Version]
  77. Schlesinger, R.C.; Williams, R.D. Growth response of black walnut to interplanted trees. For. Ecol. Manag. 1984, 9, 235–243. [Google Scholar] [CrossRef] [Green Version]
  78. Clark, J.R.; Hemery, G.E.; Savill, P.S. Early growth and form of common walnut (Juglans regia L.) in mixture with tree and shrub nurse species in southern England. Forestry 2008, 81, 631–644. [Google Scholar] [CrossRef]
  79. Mohni, C.; Pelleri, F.; Hemery, G.E. The modern silviculture of Juglans regia L.: A literature review. Bodenkultur 2009, 60, 21–34. [Google Scholar]
  80. Ponder, F. Weed control and autumn-olive affect early growth and survival of black walnut in a hardwood clearcut. New For. 1988, 2, 195–201. [Google Scholar] [CrossRef]
  81. Hemery, G.E. Growing walnut in mixed stands. Q. J. For. 2001, 95, 31–36. [Google Scholar]
  82. Loewenstein, N.J.; Pallardy, S.G. Drought tolerance, xylem sap abscisic acid and stomatal conductance during soil drying: A comparison of canopy trees of three temperate deciduous angiosperms. Tree Physiol. 1998, 18, 431–439. [Google Scholar] [CrossRef] [Green Version]
  83. Monclus, R.; Dreyer, E.; Villar, M.; Delmotte, F.M.; Delay, D.; Petit, J.-M.; Barbaroux, C.; Le Thiec, D.; Brechet, C.; Brignolas, F. Impact of drought on productivity and water use efficiency in 29 genotypes of Populus deltoides x Populus nigra. New Phytol. 2006, 169, 765–777. [Google Scholar] [CrossRef]
  84. Palandrani, C.; Battipaglia, G.; Alberti, G. Influence of tree species richness on tree growth and intrinsic water-use efficiency after drought in tree plantations in north-eastern Italy. Eur. J. For. Res. 2020, 139, 869–877. [Google Scholar] [CrossRef]
  85. Roden, J.; Van Volkenburgh, E.; Hinckley, T.M. Cellular basis for limitation of poplar leaf growth by water deficit. Tree Physiol. 1990, 6, 211–219. [Google Scholar] [CrossRef]
  86. DesRochers, A.; Van Den Driessche, R.; Thomas, B.R. The interaction between nitrogen source, soil pH, and drought in the growth and physiology of three poplar clones. Can. J. Bot. 2007, 85, 1046–1057. [Google Scholar] [CrossRef]
  87. Edwards, C.E.; Ewers, B.E.; McClung, C.R.; Lou, P.; Weinig, C. Quantitative variation in water-use efficiency across water regimes and its relationship with circadian, vegetative, reproductive, and leaf gas-exchange traits. Mol. Plant. 2012, 5, 653–668. [Google Scholar] [CrossRef] [Green Version]
  88. Lampinen, B.; Buchner, R.P.; Fulton, A.; Grant, J.; Mills, N.; Prichard, T.; Schwankl, L.; Shackel, K.; Gilles, C.; Little, C.; et al. Irrigation Management in Walnut Using Evapotranspiration, Soil and Plant. Based Data; California Walnut Board and Commission: Folsom, CA, USA, 2003. [Google Scholar]
  89. Buchner, R.P.; Lindow, S.E.; Adaskaveg, J.E.; Pickel, C.; Gilles, C.K.; Koutsoukis, R.; Smith, S.G. Walnut Blight Control. Investigations Tehama 2008; California Walnut Board and Commission: Folsom, CA, USA, 2008. [Google Scholar]
  90. Caldwell, M.M.; Richards, J.H. Hydraulic lift: Water efflux from upper roots improves effectiveness of water uptake by deep roots. Oecologia 1989, 79, 1–5. [Google Scholar] [CrossRef]
  91. Battipaglia, G.; Saurer, M.; Cherubini, P.; Calfapietra, C.; Mccarthy, H.R.; Norby, R.J.; Francesca Cotrufo, M. Elevated CO2 increases tree-level intrinsic water use efficiency: Insights from carbon and oxygen isotope analyses in tree rings across three forest FACE sites. New Phytol. 2013, 197, 544–554. [Google Scholar] [CrossRef] [PubMed] [Green Version]
  92. Walker, A.P.; De Kauwe, M.G.; Bastos, A.; Belmecheri, S.; Georgiou, K.; Keeling, R.F.; McMahon, S.M.; Medlyn, B.E.; Moore, D.J.P.; Norby, R.J.; et al. Integrating the evidence for a terrestrial carbon sink caused by increasing atmospheric CO2. New Phytol. 2021, 229, 2413–2445. [Google Scholar] [CrossRef]
  93. Lauteri, M.; Alessio, G.A.; Paris, P. Using oxygen stable isotopes to investigate the soil-plant-atmosphere hydraulic continuum in complex stands of walnut. Acta Hortic. 2006, 705, 223–230. [Google Scholar] [CrossRef]
  94. Boudru, M. Forêt et Sylviculture: Sylviculture Appliquée; Presses Agronomiques De Gembloux: Gembloux, Belgium, 1986; ISBN 9782870160305. [Google Scholar]
  95. Becquey, J. Les Noyers à Bois; Forestier, Institut Pour Le Developpement: Paris, France, 1997; ISBN 9782904740558. [Google Scholar]
  96. Bernetti, G. Selvicoltura Speciale; UTET: Torino, Italy, 1995.
  97. Stanescu, V.; Sofletea, N.; Popescu, O. Flora Forestiera Lemnoasa a României; Ceres: Bucuresti, Romania, 1997; ISBN 9789734003839. [Google Scholar]
  98. Salbitano, F.; Buresti Lattes, E.; Tani, A. Analisi Comparata Dell’architettura di Apparati Ipogei ed Epigei di Piante di Juglans spp.; Prefettura di Firenze: Firenze, Italy, 2001.
  99. Ehleringer, J.R.; Hall, A.E.; Farquhar, G.D. Stable Isotopes and Plant. Carbon-Water Relations; Academic Press: San Diego, CA, USA, 1993. [Google Scholar]
  100. Aussenac, G. Interactions between forest stands and microclimate: Ecophysiological aspects and consequences for silviculture. Ann. For. Sci. 2000, 57, 287–301. [Google Scholar] [CrossRef]
Figure 1. Trend of total annual precipitation in blue (expressed in millimeters/year) and average temperatures in red (expressed in °C) recorded from 1995 to 2018 and coming from the KNMI Climate Explorer database.
Forests 12 01251 g001
Figure 2. Average tree-ring chronologies of Populus alba in the different systems: PJ_P in gray; PJC_P in green; PJA_P in blue; PJE_P in black. The bars indicate the standard error.
Forests 12 01251 g002
Figure 3. Cumulative basal area (CBA) calculated for Populus alba in the different systems: PJ_P in gray; PJC_P in green; PJA_P in blue; PJE_P in black. The bars indicate the standard error. Differences between intercropping systems were evaluated according to one-way ANOVA, using Student–Newman–Keuls coefficient for comparison tests (p < 0.05).
Forests 12 01251 g003
Figure 4. Average tree-ring chronologies of Juglans regia in the different systems: PJ_J in gray, PJC_J in green, PJA_J in blue, and PJE_J in black. The bars indicate the standard error.
Forests 12 01251 g004
Figure 5. Cumulative basal area (CBA) calculated for Juglans regia in the different systems: PJ_J in gray, PJC_J in green, PJA_J in blue, and PJE_J in black. The bars indicate the standard error. Differences between intercropping systems were evaluated according to one-way ANOVA, using Student–Newman–Keuls coefficient for comparison tests (p < 0.05).
Forests 12 01251 g005
Figure 6. Comparison between the average values of TRW (square indicator) and the average values of iWUE (rhombus indicator) calculated for Juglans regia (in green) and Populus alba (in blue) in the different plots. The bars indicate the standard error. Differences between intercropping systems were evaluated according to one-way ANOVA, using Student–Newman–Keuls coefficient for comparison tests (p < 0.05).
Forests 12 01251 g006
Figure 7. Biplot of the first two principal components, which accounted for the total variance of 38.1% and 22.3%, respectively. The length of the vectors (in red) indicates the strength of the correlations with respect to the active observations (intercropping systems, in blue). A strong positive correlation is indicated by vectors pointing in approximately the same direction as the active observations. Conversely, vectors pointing in opposite directions suggest a strong negative correlation.
Forests 12 01251 g007
Table 1. Correlations between cumulative basal area (CBA) of each intercropping systems with average temperature (Tmean), minimum temperature (Tmin), maximum temperature (Tmax), and total precipitation (Ptot) grouped seasonally (MAM = March, April and May; JJA = June, July and August; SON = September, October and November). Spearman correlation coefficients are reported (r), with the corresponding statistical significance (* 0.05, ** 0.01) n = 25.
CBA PJ_JCBA PJC_JCBA PJA_JCBA PJE_JCBA PJ_PCBA PJC_PCBA PJA_PCBA PJE_P
Tmin MAMnsnsnsnsnsnsnsns
Tmin JJA0.46 *0.42 *0.44 *0.40 *0.51 *0.43 *0.44 *0.45 *
Tmin SONnsnsnsnsnsnsnsns
Tmax MAMnsnsnsnsnsnsnsns
Tmax JJA0.45 *0.50 *0.57 **0.46 *0.48 *0.51 *0.55 *0.48 *
Tmax SON0.44 *0.55 *0.45 *0.50 *0.43 *0.45 *0.48 *0.50 *
Tmedium MAMnsnsnsnsnsnsnsns
Tmedium JJA0.43 *0.45 *0.51 *0.47 *0.46 *0.43 *0.52 *0.52 *
Tmedium SON0.50 *0.43 *0.42 *0.45 *0.42 *0.40 *0.43 *0.44 *
P MAMnsnsnsnsnsnsnsns
P JJAnsnsnsnsnsnsnsns
P SONnsnsnsnsnsnsnsns
P TOTnsnsnsnsnsnsnsns
Table 2. Correlations between water use efficiency (iWUE) of each intercropping systems with average temperature (Tmean), minimum temperature (Tmin), maximum temperature (Tmax), and total precipitation (Ptot) grouped seasonally (MAM = March, April and May; JJA = June, July and August; SON = September, October and November). Spearman correlation coefficients are reported (r), with the corresponding statistical significance (* 0.05), n = 8.
iWUE PJ_JiWUE PJC_JiWUE PJA_JiWUE PJE_JiWUE PJ_PiWUE PJC_PiWUE PJA_PiWUE PJE_P
Tmin MAMnsnsnsnsnsnsnsns
Tmin JJAnsnsnsnsnsnsnsns
Tmin SONnsnsnsns−0.80 *nsnsns
Tmax MAMnsnsns0.86 *nsnsnsns
Tmax JJAnsnsnsnsnsnsnsns
Tmax SONnsnsnsnsnsnsnsns
Tmedium MAMnsnsns0.89 *nsnsnsns
Tmedium JJAnsnsnsnsnsnsnsns
Tmedium SONnsnsnsns−0.82 *nsnsns
P MAMnsnsnsnsnsnsnsns
P JJAnsnsns0.84 *nsnsns0.95 *
P SONnsnsnsnsnsnsnsns
P TOTnsnsnsnsnsnsnsns
Table 3. Soil data of the different intercropping systems. Values are mean and standard deviation of 24 replicates, with the exception of sand, silt, clay and recalcitrant C that are mean and standard deviation of three samples. BD = bulk density; TOC = total organic carbon, TIC = Total inorganic Carbon; TN = total nitrogen. The superscript letters (a,b,c) indicate significant differences between means in the different column and for each system, according to One-way ANOVA, followed by Student–Newman–Keuls coefficient for comparison tests (p < 0.05). Systems that do not share at least one letter are significantly different.
SandSiltClayBDpHCaCl2TOCTICTNC/NStable C
g cm3 g kg−1g kg−1g kg−1 % of TOC
PJC59,555 a256 ± 79 a149 ± 26 a1.4 ± 0.1 a7.0 ± 0.2 a18.19 ± 0.68 a18.3 ± 0.5 a1.18 ± 0.43 a15.7 ± 2.6 a2.5 ± 0.7 a
PJE537 ± 38 abc294 ± 14 ab169 ± 32 a1.5 ± 0.2 a7.1 ± 0.2 a13.16 ± 2.90 b15.9 ± 0.4 a1.12 ± 0.34 a12.2 ± 2.2 b2.9 ± 1.8 a
PJA375 ± 82 b424 ± 67 b200 ± 20 a1.4 ± 0.2 a7.0 ± 0.2 a15.19 ± 4.65 ab19.1 ± 0.7 a1.33 ± 0.39 a11.5 ± 1.8 b2.5 ± 1.1 a
PJ437 ± 53 c380 ± 43 b183 ± 32 a1.4 ± 0.1 a7.0 ± 0.1 a13.41 ± 4.00 b21.8 ± 0.6 a1.15 ± 0.45 a13.0 ± 4.9 b8.4 ± 2.4 b
Publisher’s Note: MDPI stays neutral with regard to jurisdictional claims in published maps and institutional affiliations.

