
Estimating Global Forest-Based Employment


Abstract
:1. Introduction
2. Definitions
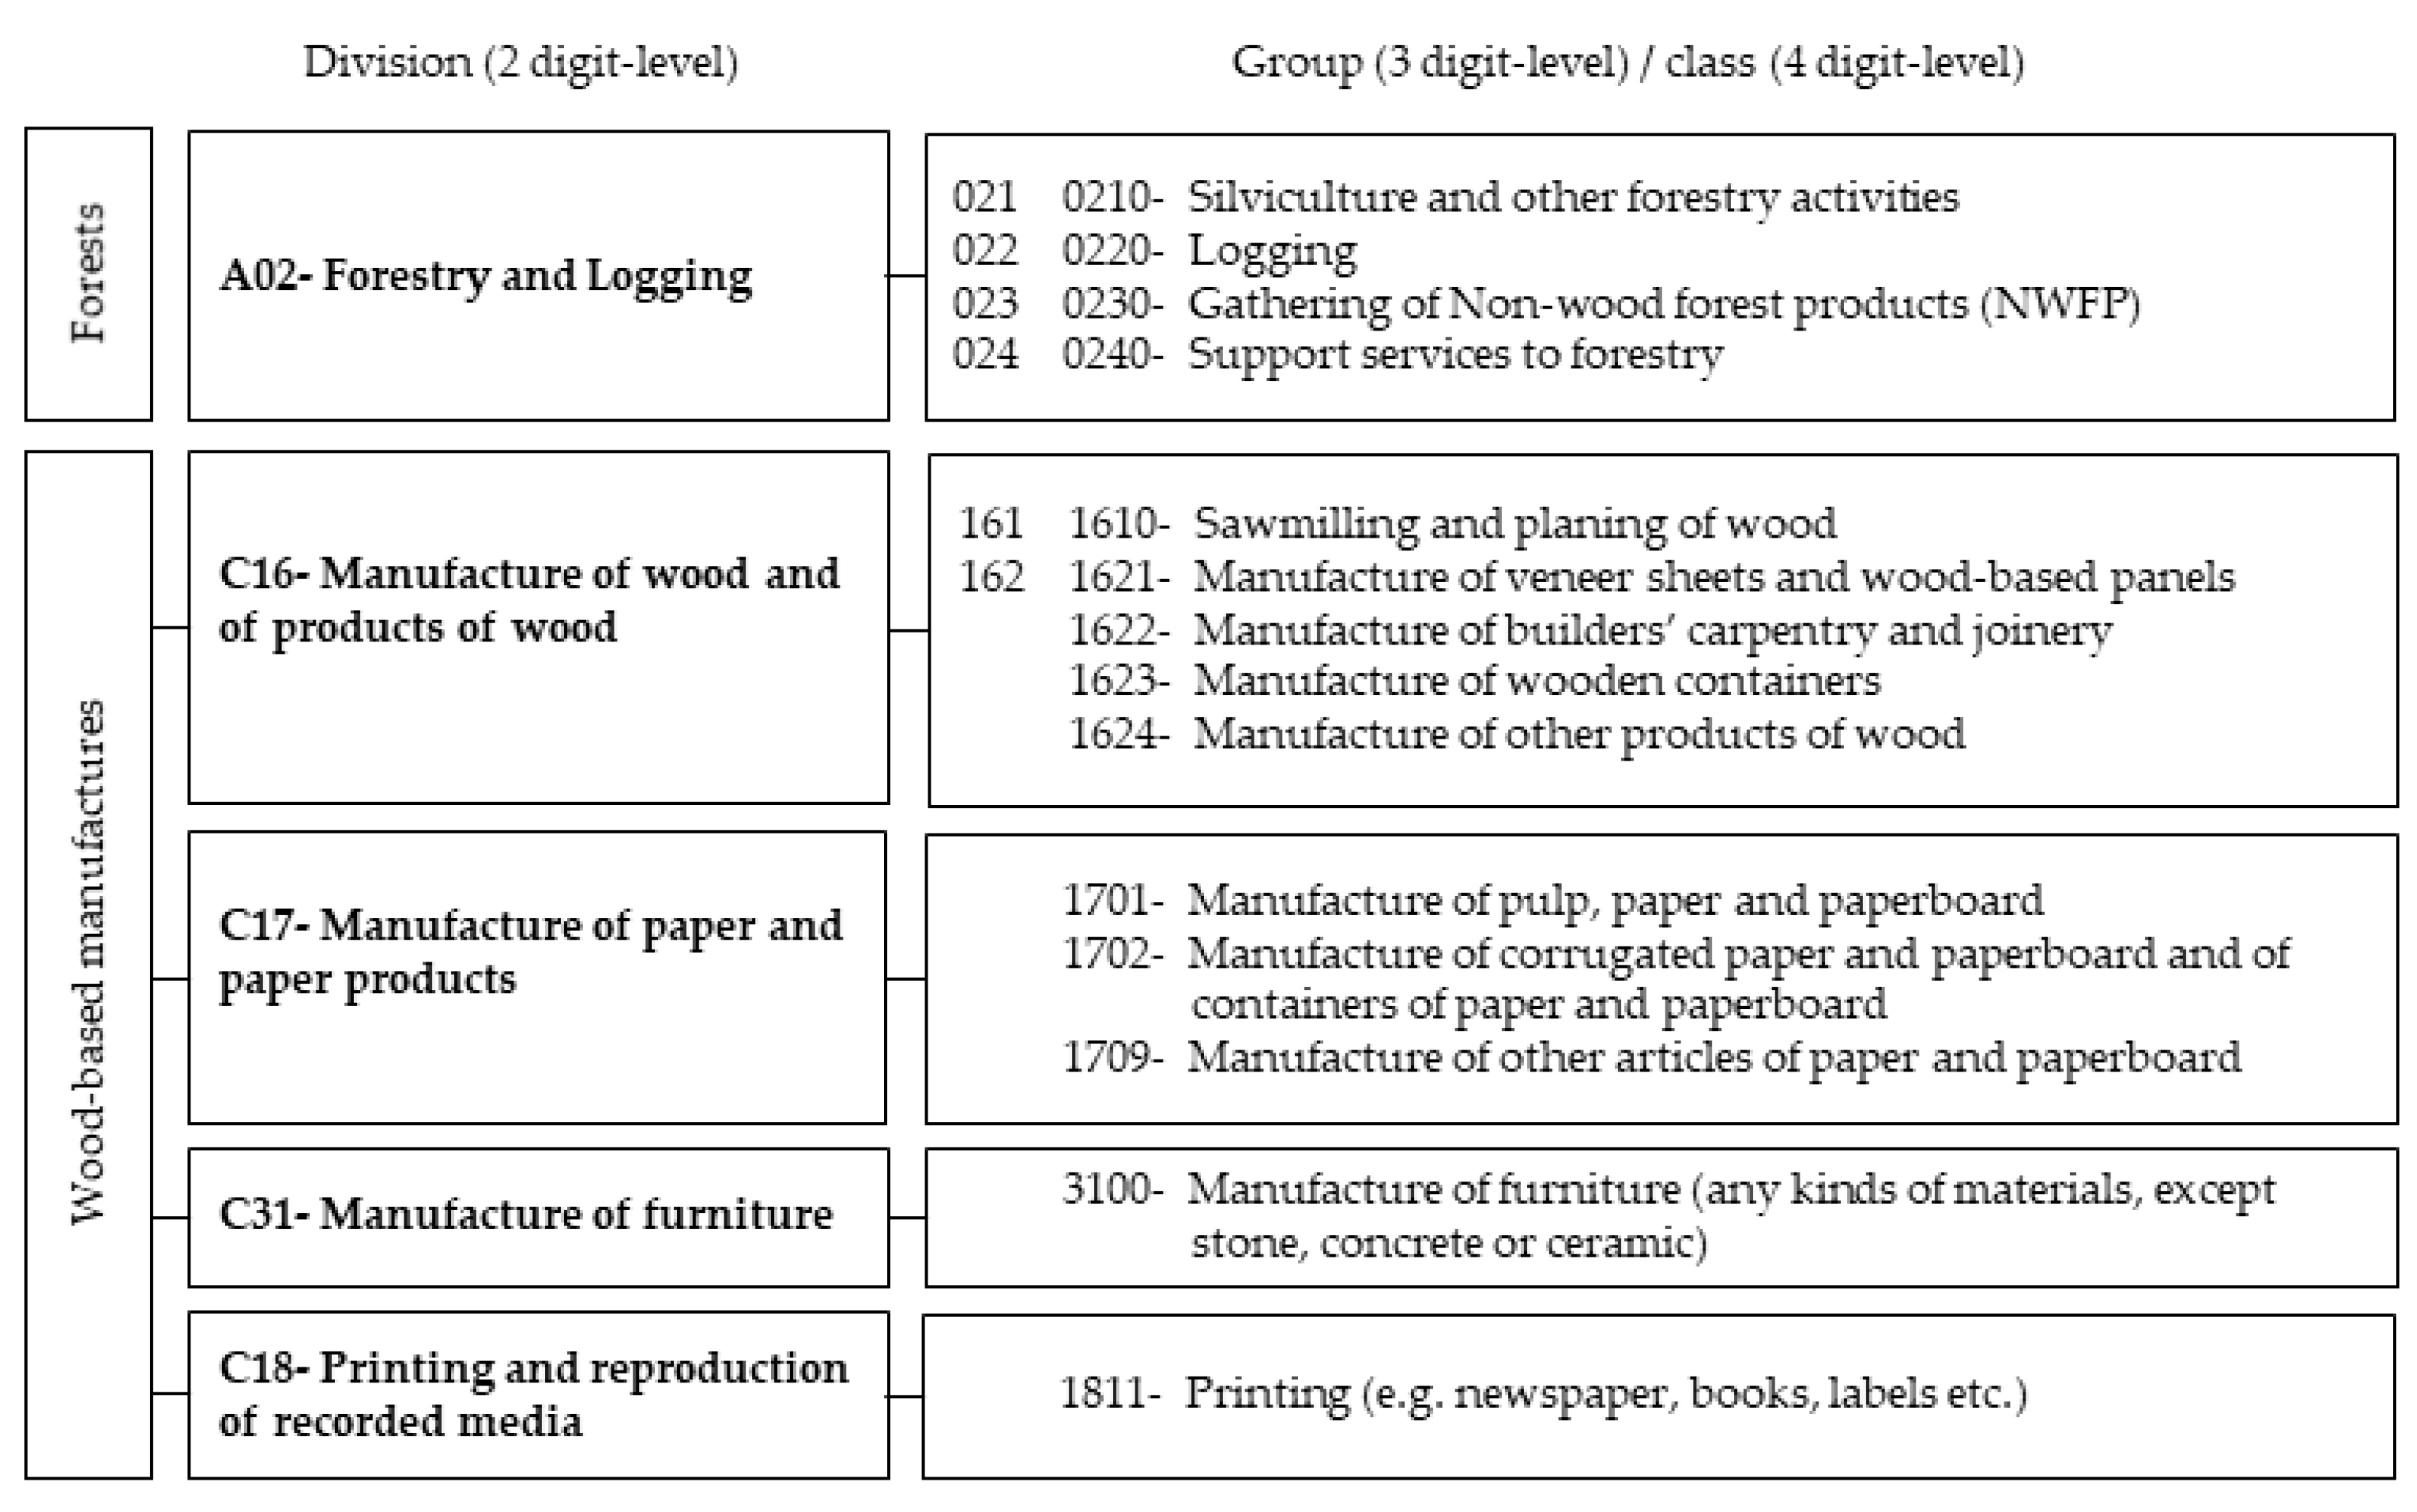
2.1. Forest Sector
2.2. Formal vs. Informal Employment
2.3. Visible vs. Invisible Employment
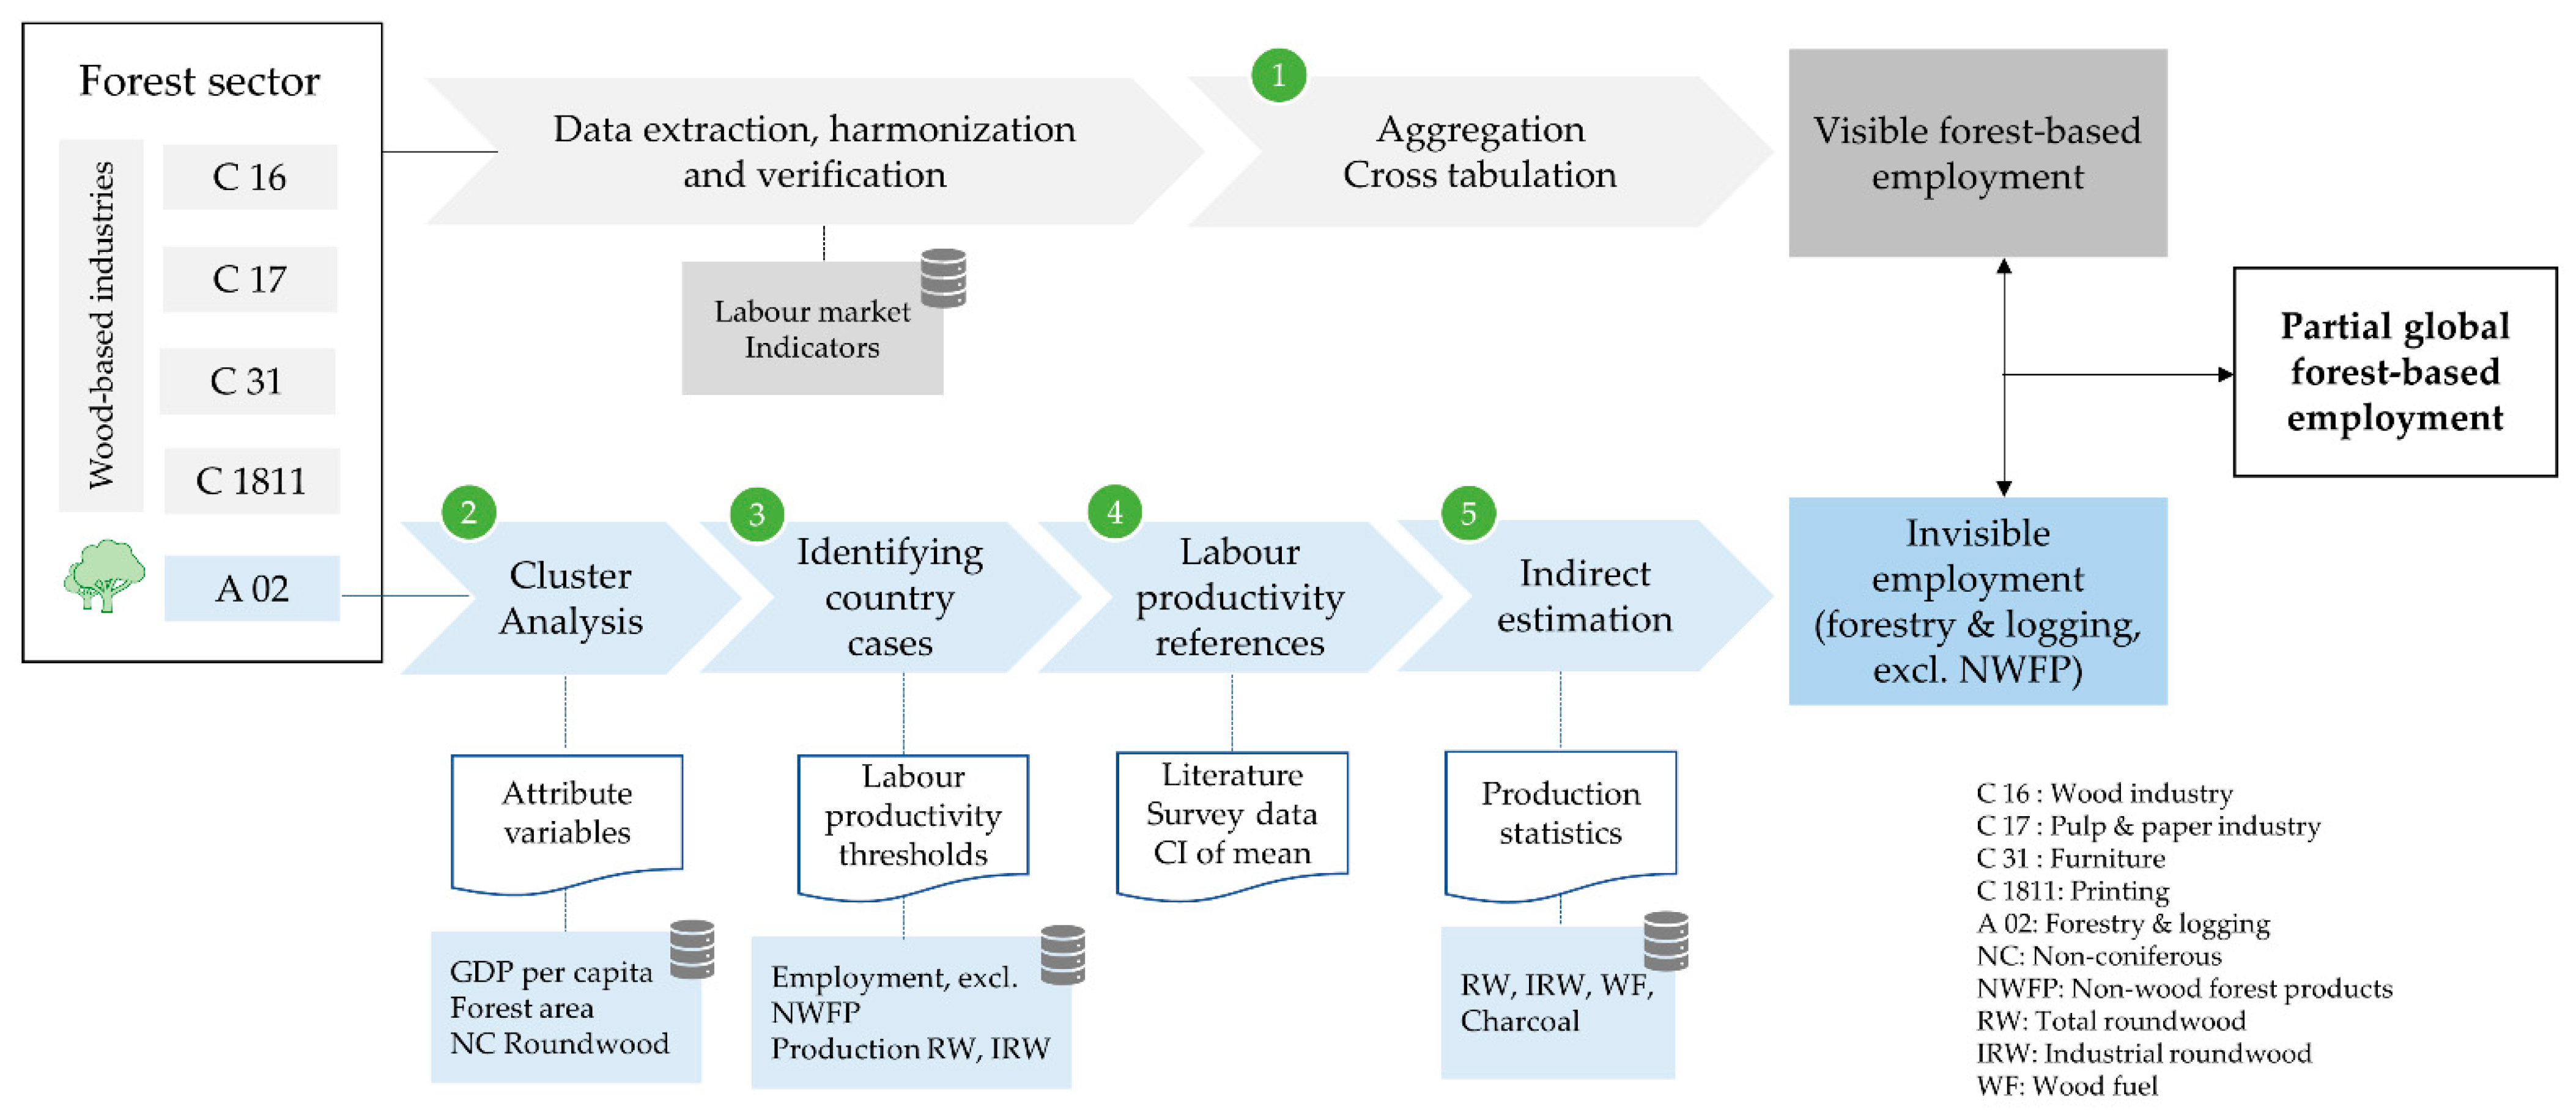
3. Methodological Approach
3.1. Visible Employment (Step 1)
3.2. Invisible Employment Estimation
3.2.1. Cluster Analysis (Step 2)
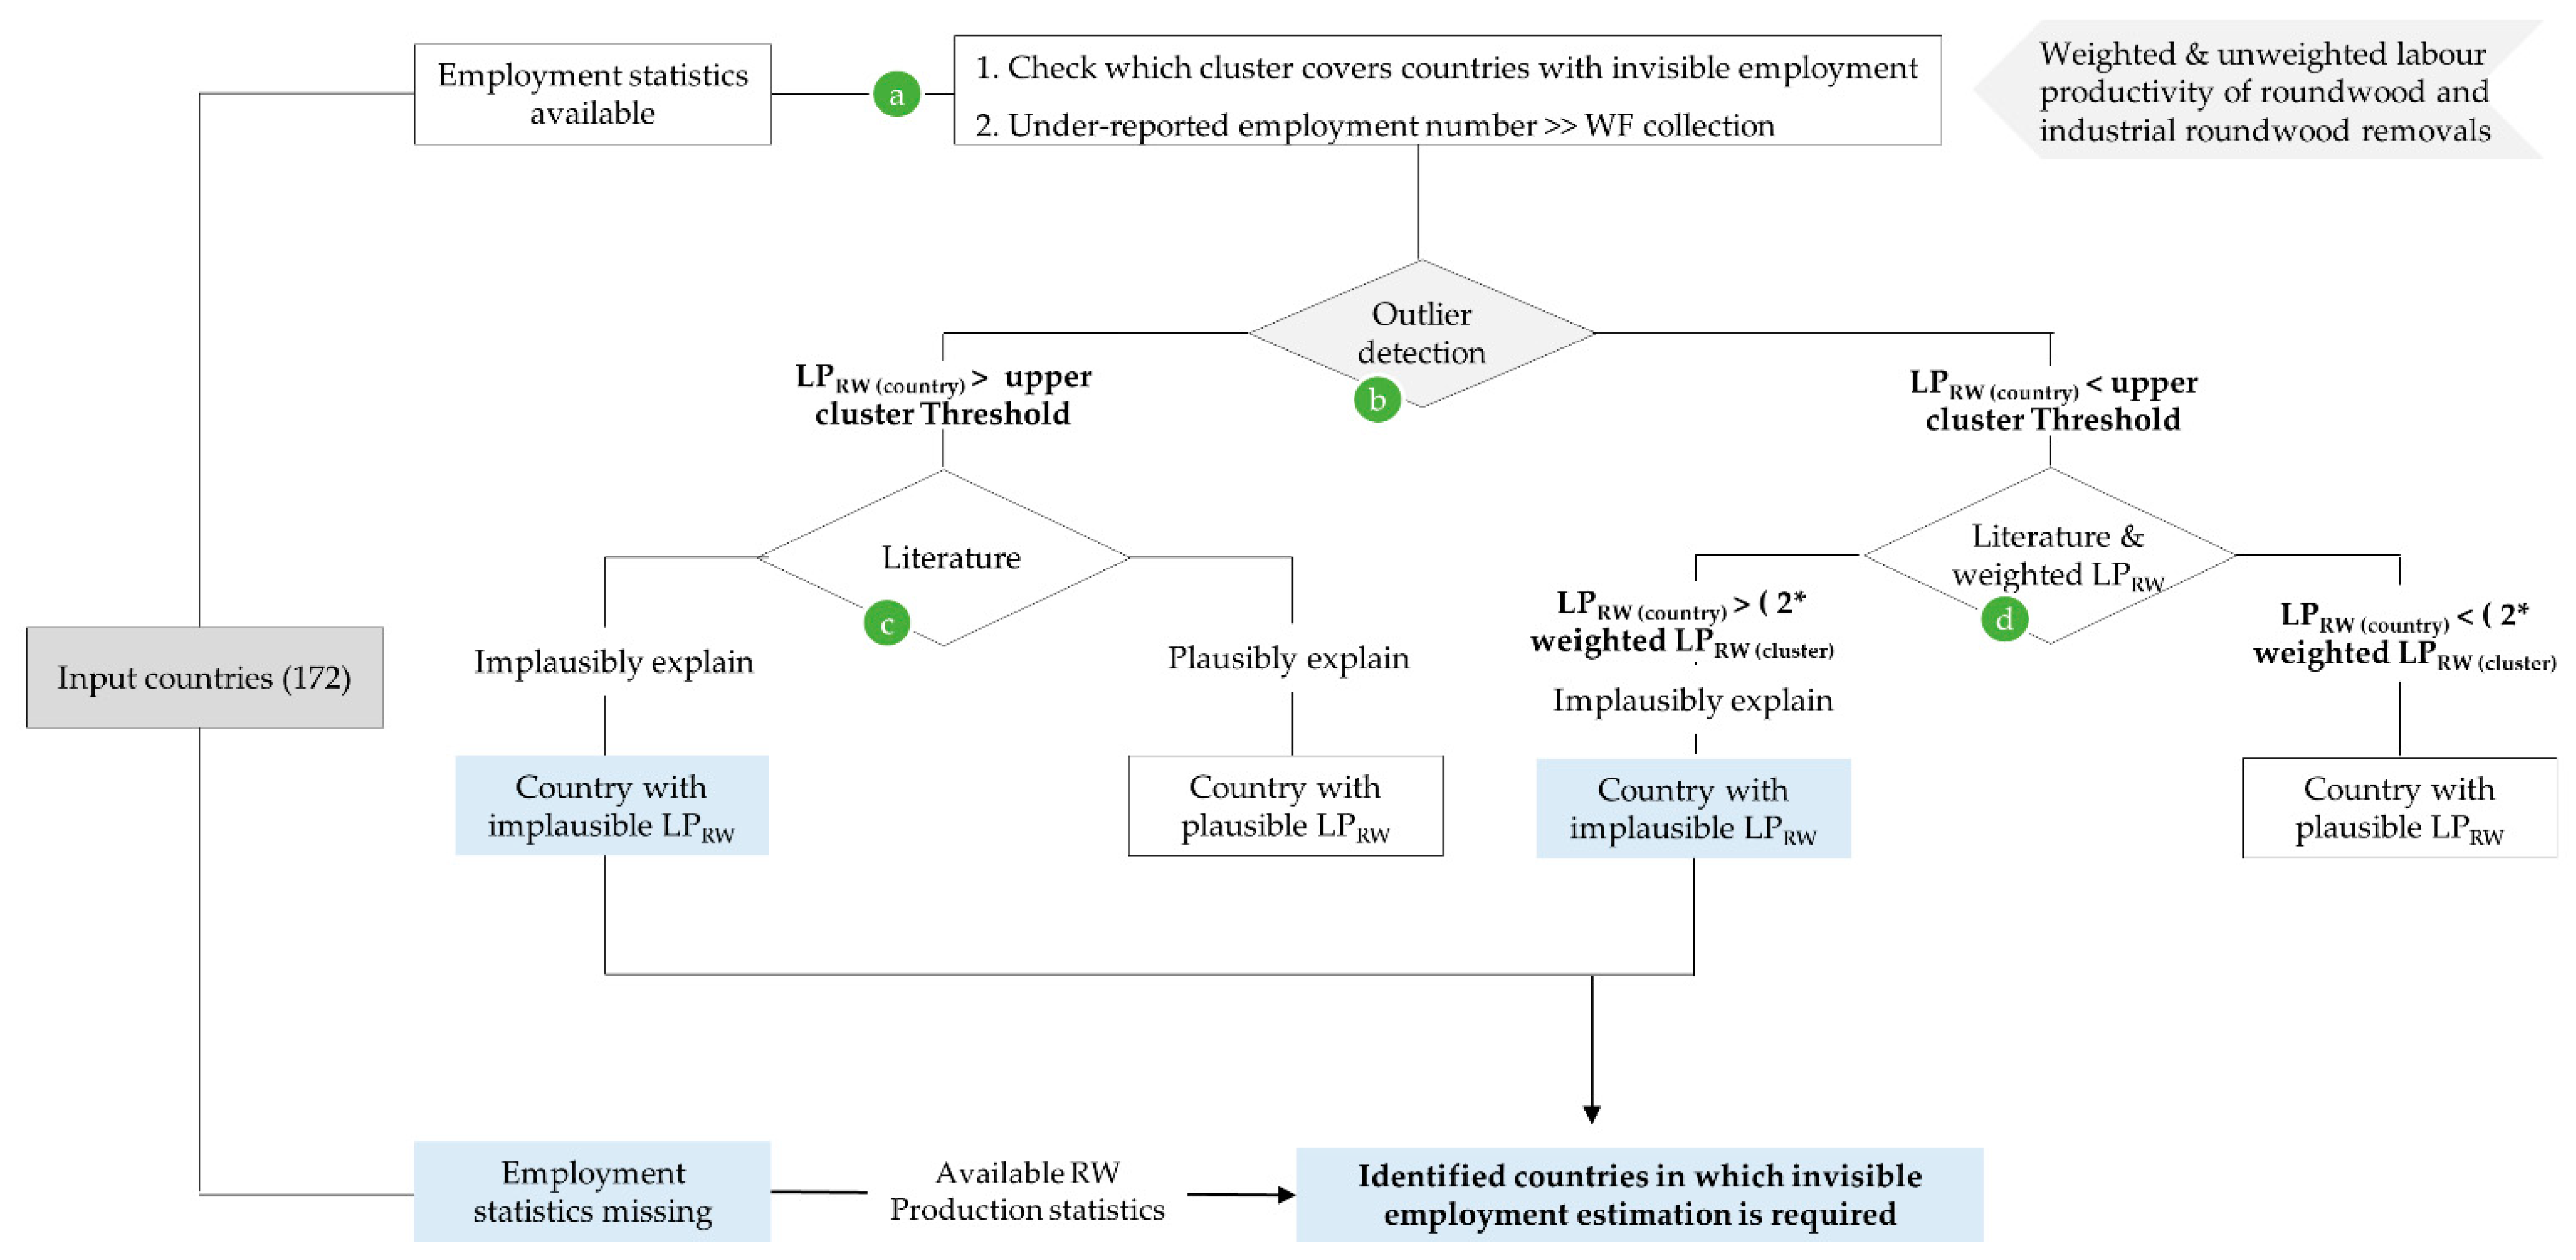
3.2.2. Identifying Countries with Invisible Employment (Step 3)
3.2.3. Labour Productivity References (Step 4)
3.2.4. Indirect Estimation (Step 5)
4. Results
4.1. Visible Forest-Based Employment
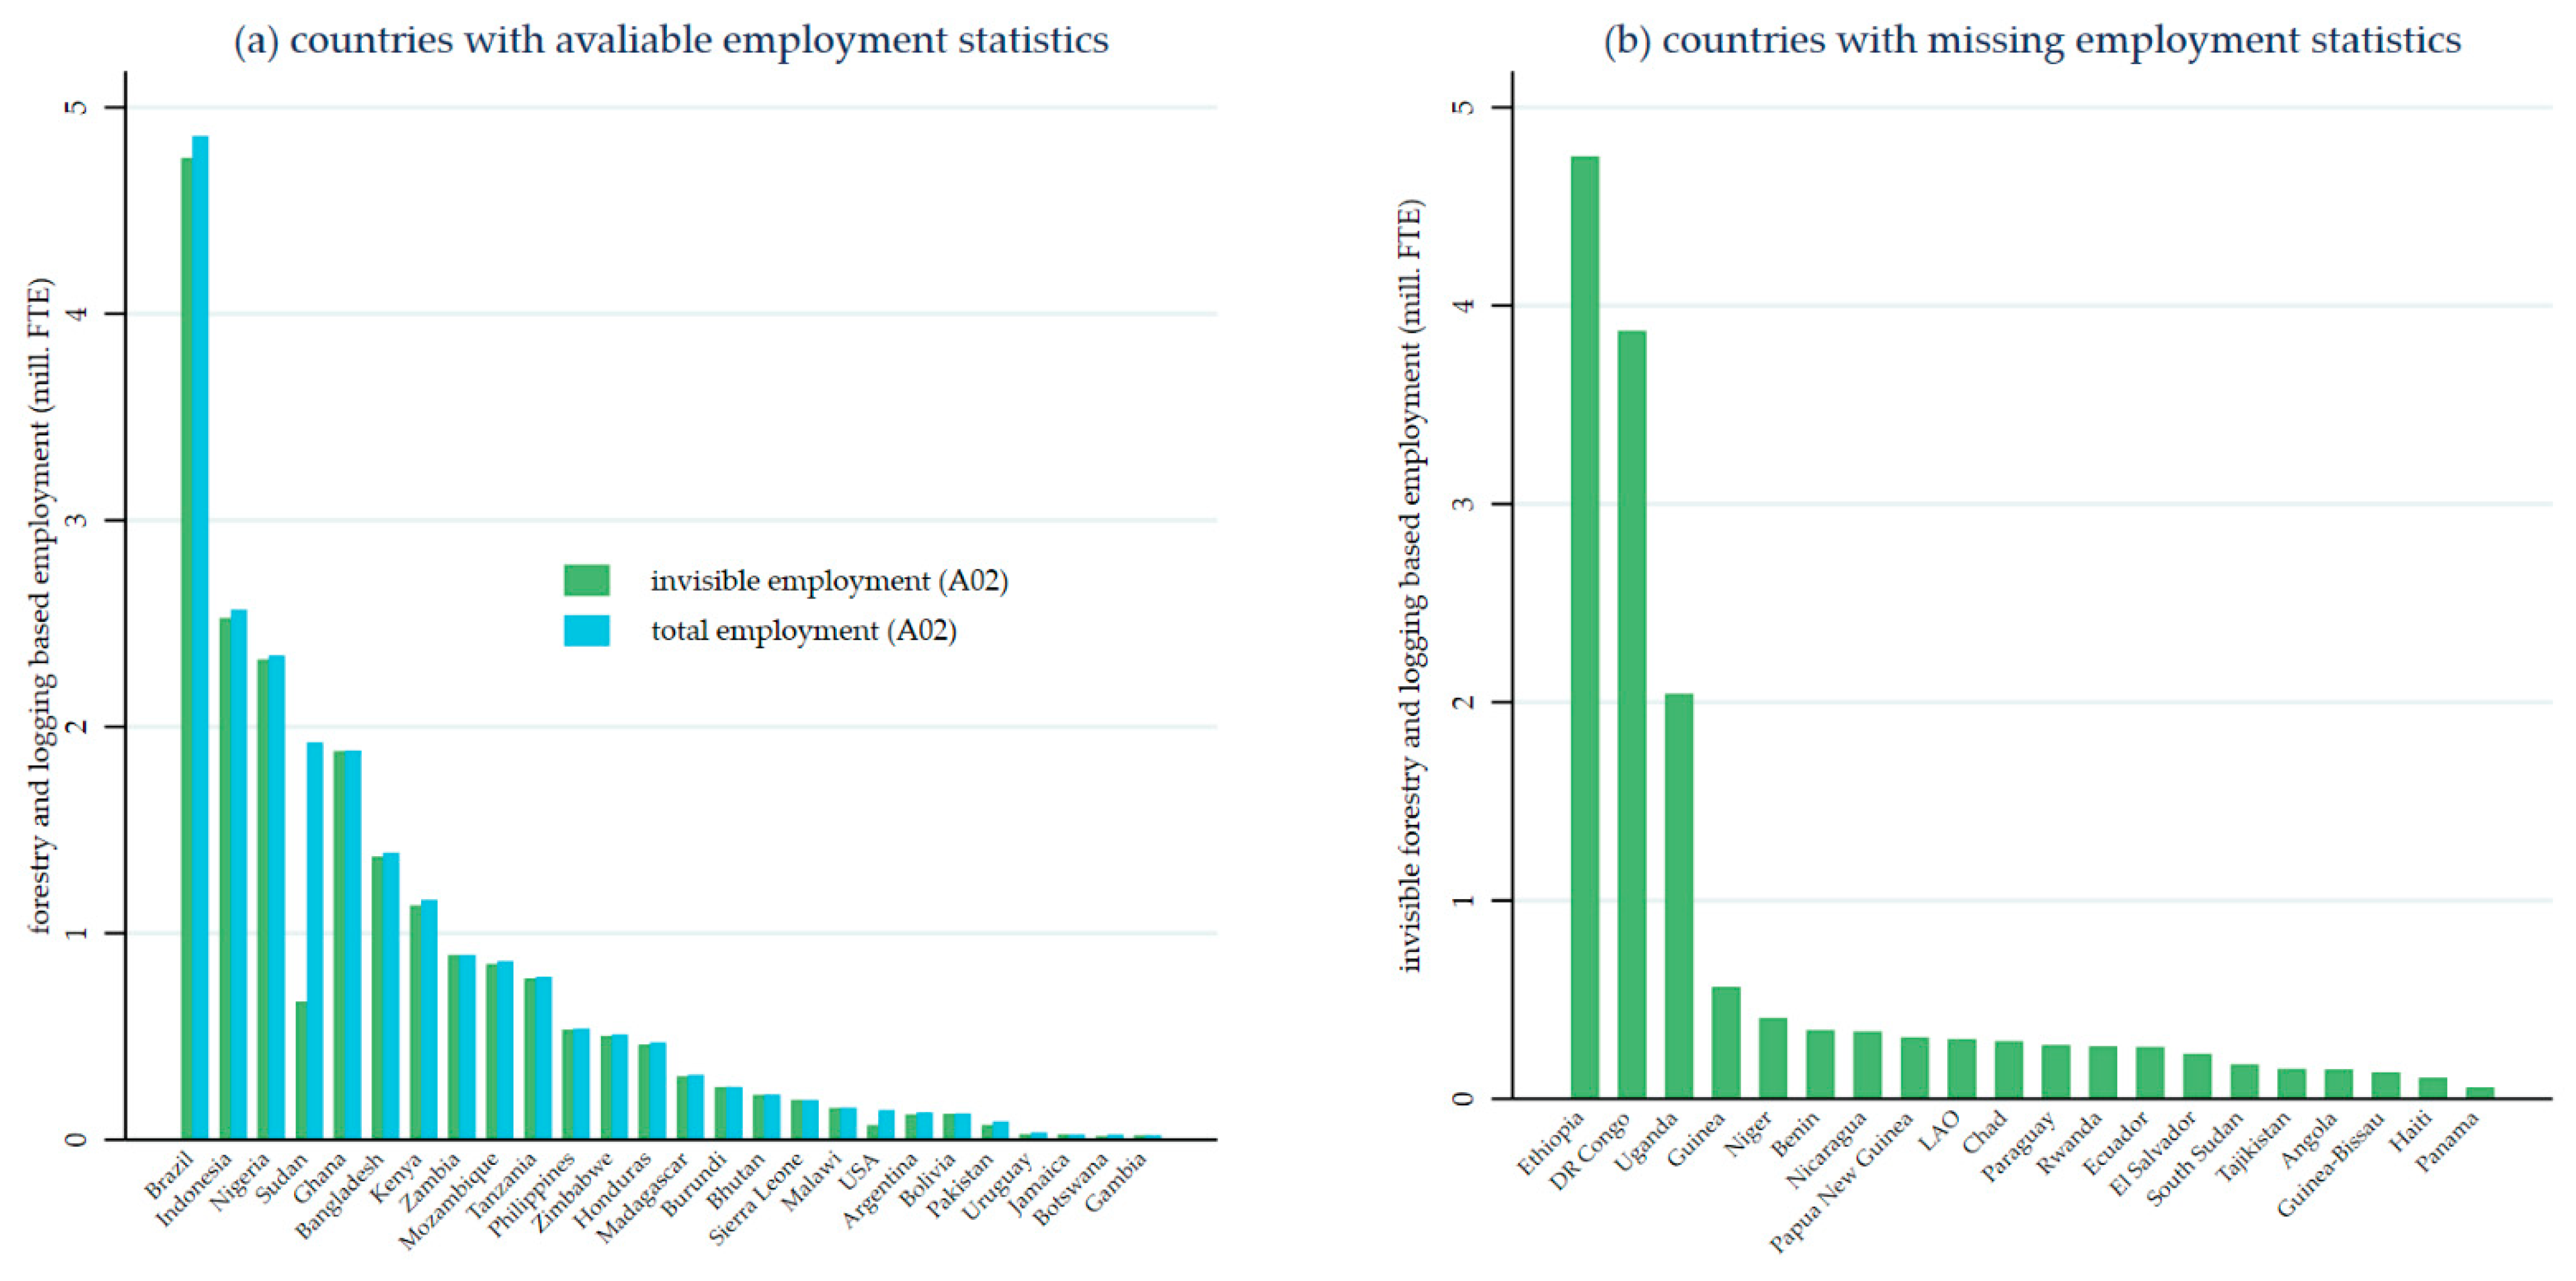
4.2. Size of Invisible Employment in Forestry and Logging Sub-Sector
4.3. Global Forest-Based Employment
5. Discussion
6. Conclusions
Supplementary Materials
Author Contributions
Funding
Data Availability Statement
Acknowledgments
Conflicts of Interest
Appendix A

| Forest Area by Climatic Domain | ||||||
|---|---|---|---|---|---|---|
| GDP per Capita | Boreal | Tropical | Sub-Tropical | Temperate | Non-Coniferous Roundwood | |
| GDP per capita | 1 | |||||
| Boreal forest area | 0.3853 * | 1 | ||||
| Tropical forest area | −0.4627 * | −0.2585 * | 1 | |||
| Sub-tropical forest area | 0.0131 | −0.0947 | −0.5179 * | 1 | ||
| Temperate forest area | 0.3993 * | −0.0271 | −0.7056 * | −0.1377 * | 1 | |
| Non-coniferous roundwood | −0.6114 * | −0.4445 * | 0.6338 * | −0.0721 | −0.5380 * | 1 |
Appendix B. Silhouette Statistics
- If within dissimilarity in Cluster A is smaller than the between dissimilarity to the neighbour cluster (B), the silhouette number is equal to .
- Reversely, the silhouette width is equal to , when a(c) is greater than b(c).
- The silhouette width is at zero when the dissimilarity of country c being in cluster A is equal to being in cluster B. Hence, it is unclear to which cluster the country c shall be assigned to.
References
- FAO. The State of the World’s Forests 2018—Forests Pathways to Sustainable Development; Licence: CC BY-NC-SA 3.0 IGO; FAO: Rome, Italy, 2018. [Google Scholar]
- Whiteman, A.; Wickramasinghe, A.; Piña, L. Global trends in forest ownership, public income and expenditure on forestry and forestry employment. For. Ecol. Manag. 2015, 352, 99–108. [Google Scholar] [CrossRef]
- FAO. State of the World’s Forests: Enhancing the Socioeconomic Benefits from Forests; FAO: Rome, Italy, 2014; ISBN 978-92-5-108270-6. [Google Scholar]
- Li, Y.; Mei, B.; Linhares-Juvenal, T. The economic contribution of the world’s forest sector. For. Policy Econ. 2019, 100, 236–253. [Google Scholar] [CrossRef]
- Poschen, P. Forest and Employment—Much more than meet the eye, in the economic contribution of forestry to sustainable development. In Proceedings of the XI World Forestry Congress, Antalya, Turkey, 13–22 October 1997. [Google Scholar]
- ILO. Globalization and Sustainability: The Forestry and Wood Industries on the Move; Report for Discussion at the Tripartite Meeting on the Social and Labour Dimensions of the Forestry and Wood Industries on the Move TMFWI/2001; ILO: Geneva, Switzerland, 2001; Available online: https://www.ilo.org/public/libdoc/ilo/2001/101B09_179_engl.pdf (accessed on 7 September 2020).
- Arce, J.J.C. Forest, inclusive and sustainable economic growth and employment. In Background Study Prepared for the Fourteenth Session of the United Nations Forum on Forests; United Nations: New York, NY, USA, 2019. [Google Scholar]
- Yeshanew, S. Regulating Labour and Safety Standards in the Agriculture Forestry and Fisheries Sectors; Legislative study No. 112; Food and Agriculture Organization of the United Nations: Rome, Italy, 2018; Available online: http://www.fao.org/3/CA0018EN/ca0018en.pdf (accessed on 26 March 2021).
- ILO. Decent Work in Forestry: Decent Work in the Rural Economy: Policy Guidance Notes; ILO: Geneva, Switzerland, 2019. [Google Scholar]
- Kies, U.; Mrosek, T.; Schulte, A. A statistics-based method for cluster analysis of the forest sector at the national and subnational level in Germany. Scand. J. For. Res. 2008, 23, 445–457. [Google Scholar] [CrossRef]
- United Nations. International Standard Industrial Classification of All Economic Activities (ISIC), 4th ed.; United Nations: New York, NY, USA, 2008; ISBN 9211615186. [Google Scholar]
- ILO. Measuring Informality: A statistical Manual on the Informal Sector and Informal Employment; ILO: Geneva, Switzerland, 2013. [Google Scholar]
- ILO. Key Indicators of the Labour Market, 9th ed.; International Labour Offic: Geneva, Switzerland, 2016. [Google Scholar]
- Hussmanns, R. Defining and Measuring Informal Employment. 2004. Available online: https://www.ilo.org/public/english/bureau/stat/download/papers/meas.pdf (accessed on 26 March 2021).
- ILO. Revision of the 15th ICLS resolution concerning statistics of employment in the informal sector and the 17th ICLS guidelines regarding the statistical definition of informal employment. In Proceedings of the 20th International Conference of Labour Statisticians, Geneva, Switzerland, 1–19 October 2018; ILO: Geneva, Switzerland, 2018. [Google Scholar]
- ILO. Woman and Men in the Informal Economyy: A Statistical Picture, 3rd ed.; ILO: Geneva, Switzerland, 2018. [Google Scholar]
- FAO. Global Forest Resources Assessment: FRA Database. Available online: https://fra-data.fao.org (accessed on 21 July 2020).
- UNIDO. INDSTAT 4 Industrial Statistics Database at 3- and 4-Digit Level of ISIC Revision 3 and 4. 2020. Available online: http://stat.unido.org (accessed on 9 June 2020).
- FAO. Global Forest Resources Assessment 2020—Guidelines and Specifications FRA 2020; Version 1.0; FAO: Rome, Italy, 2018. [Google Scholar]
- Hair, J.F.; Black, W.C.; Babin, B.J.; Anderson, R.E. Multivariate Data Analysis, 7th ed.; Prentice Hall: Upper Saddle River, NJ, USA, 2010; ISBN 0138132313. [Google Scholar]
- Rousseeuw, P.J. Silhouettes: A graphical aid to the interpretation and validation of cluster analysis. J. Comput. Appl. Math. 1987, 20, 53–65. [Google Scholar] [CrossRef]
- Michinaka, T.; Tachibana, S.; Turner, J.A. Estimating price and income elasticities of demand for forest products: Cluster analysis used as a tool in grouping. For. Policy Econ. 2011, 13, 435–445. [Google Scholar] [CrossRef]
- Silayo, D.S.; Migunga, G. Productivity and costs modeling for tree harvesting operations using chainsaws in plantation forests, Tanzania. Int. J. Eng. Technol. 2014, 3, 464. [Google Scholar] [CrossRef]
- UNECE; FAO. Forest Sector Workforce in the UNECE Region: Overview of the Soical and Economic Trends with Impact on the Forest Sector; Geneva Timber and Forest Discussion Paper 76 ECE/TIM/DP/76, Forestry and Timber Section; United Nation: Geneva, Switzerland, 2020. [Google Scholar]
- Mooi, E.; Sarstedt, M.; Mooi-Reci, I. Market Research: The Process, Data, and Methods Using Stata/Erik Mooi, Marko Sarstedt, Irma Mooi-Reci; Springer: Singapore, 2018; ISBN 9789811052170. [Google Scholar]
- Vázquez, S.T.; Sumner, A. Beyond Low and Middle Income Countries: What if There Were Five Clusters of Developing Countries? IDS Work. Pap. 2012, 2012, 1–40. [Google Scholar] [CrossRef]
- Everitt, B.S.; Landau, S.; Leese, M.; Stahl, D. Cluster Analysis; John Wiley & Sons, Ltd.: Chichester, UK, 2011. [Google Scholar]
- Leys, C.; Ley, C.; Klein, O.; Bernard, P.; Licata, L. Detecting outliers: Do not use standard deviation around the mean, use absolute deviation around the median. J. Exp. Soc. Psychol. 2013, 49, 764–766. [Google Scholar] [CrossRef]
- Owuor, J.A.; Giessen, L.; Prior, L.; Cilio, D.; Bal, T.; Bernasconi, A.; Burns, J.; Chen, X.; Goldsmith, A.A.; Jiacheng, Z.; et al. Trends in Forest-Related Employment and Tertiary Education: Exploratory Insights from Key Forestry Countries around the Globe. In Knowledge to Action (K2A); European Forest Institute (EFI): Joensu, Finland, 2020. [Google Scholar]
- World Bank. The World Bank Atlas Method—Detailed Methodology—World Bank Data Help Desk. Available online: https://datahelpdesk.worldbank.org/knowledgebase/articles/378832-what-is-the-world-bank-atlas-method (accessed on 12 March 2021).
- Ackerknecht, C. Work in the forestry sector: Some issues for a changing workforce. Unasylva 2010, 61, 7. [Google Scholar]
- Asian Development Bank. Solomon Islands: Country Gender Assessment; Asian Development Bank: Mandaluyong, Philippines, 2015. [Google Scholar]
- Alnazeer, A.M.A.; Elamin, Y.A.R.; Hasabelrasoul, F.M.; Abdelhamed, M.M. Contribution of Non-Wood Forest Products in Income and Livelihood of Rural Community in Dry Lands of Central Darfur State, Sudan. 2020. Available online: https://www.semanticscholar.org/paper/Contribution-of-Non-wood-Forest-Products-in-Income-Ahmed-Raddad/de0913201ceeb31a79804e3482e924d6758e2064 (accessed on 26 March 2021).
- Souza Ferreira Filho, J.B.; Poschen, P. About Trees and People. What Works About Trees and People. What Works for Development, Employment and the Environment in the Brazilian Amazon? Rev. Estud. Bras. 2019, 6, 109. [Google Scholar] [CrossRef]
- Gioda, A. Residential fuelwood consumption in Brazil: Environmental and social implications. Biomass-Bioenergy 2019, 120, 367–375. [Google Scholar] [CrossRef]
- Sola, P.; Schure, J.; Eba’a Atyi, R.; Gumbo, D.; Okeyo, I. Woodfuel policies and practices in selected countries in Sub-Saharan Africa-a critical review. Bois For. Trop. 2019, 340. [Google Scholar] [CrossRef]
- FAO. African Forests: A View to 2020; FAO: Rome, Italy, 2003. [Google Scholar]
- Dhyani, S.K.; Ajit, J.S.; Handa, A.K. Forestry to Support Increased Agricultural Production: Focus on Employment Generation and Rural Development. Agric. Econ. Res. Rev. 2007, 20, 179–202. [Google Scholar]
- FAO. Forestry Contribution to National Economy and Trade in Ethiopia; Kilawe, E., Habimana, D., Eds.; Kenya and Uganda: Addis Ababa, Ethiopia, 2016. [Google Scholar]
- Megevand, C. Deforestation Trends in the Congo Basin: Reconciling Economic Growth and Forest Protection; World Bank: Washington, DC, USA, 2013. [Google Scholar] [CrossRef]
- ILO. Labour Conditions in Forestry in Indonesia, International Labour Organization; Jakarta Office: Geneva, Switzerland, 2010. [Google Scholar]
- ILO. World Employment and Social Outlook—Trends 2018; International Labour Office: Geneva, Switzerland, 2018; Available online: https://www.ilo.org/wcmsp5/groups/public/---dgreports/---dcomm/---publ/documents/publication/wcms_615594.pdf (accessed on 26 March 2021).
- Nansikombi, H.; Fischer, R.; Ferrer Velasco, R.; Lippe, M.; Kalaba, F.K.; Kabwe, G.; Günter, S. Can de facto governance influence deforestation drivers in the Zambian Miombo? For. Policy Econ. 2020, 120, 102309. [Google Scholar] [CrossRef]
- Kazungu, M.; Ferrer Velasco, R.; Zhunusova, E.; Lippe, M.; Kabwe, G.; Gumbo, D.J.; Günter, S. Effects of household-level attributes and agricultural land-use on deforestation patterns along a forest transition gradient in the Miombo landscapes, Zambia. Ecol. Econ. 2021, 186, 107070. [Google Scholar] [CrossRef]
- FAO. Making Forestry Work for the Poor: Assessment of the Contribution of Forestry to Poverty Alleviation in Asia and the Pacific; RAP Publication, FAO Regional Office for Asia and the Pacific: Bangkok, Thailand, 2012. [Google Scholar]
- May, P.H.; Gonçalves da Vinha, V.; Macqueen, D.J. Small and Medium Forest Enterprise in Brazil: Discussion paper; Grupo Economia do Meio Ambiente e Desenvolvimento Sustentável GEMA/IE/UFRJ: Rio de Janeiro, Brazil, 2003; ISBN 1843695545. [Google Scholar]
- Hoare, A. Tackling Illegal Logging and the Related Trade: What Progress and Where Next? Chatham House: London, UK, 2015. [Google Scholar]
- Kleinschmit, D.; Mansourian, S.; Wildburger, C.; Purret, A. Illegal Logging and Related Timber Trade—Dimensions, Drivers, Impacts and Responses: A Global Scientific Rapid Response Assessment Report 48 Pages; International Union of Forest Research Organizations (IUFRO): Vienna, Austria, 2016. [Google Scholar]
- International Labour Organization. Informal Employment by Sex and Economic Activity (Thousands): ILOSTAT Database. Available online: https://ilostat.ilo.org/data/ (accessed on 28 January 2021).
- Dubey, P. Investment in Small-Scale Forestry Enterprises: A Strategic Perspective for India. Small-Scale For. 2008, 7, 117–138. [Google Scholar] [CrossRef]
- Agrawal, A.; Cashore, B.; Hardin, R.; Shepherd, G.; Benson, C.; Miller, D. Economic Contributions of Forests; Backgr. Pap. 1. 2013. Available online: https://www.un.org/esa/forests/wp-content/uploads/2015/12/EcoContrForests.pdf (accessed on 26 March 2021).
- Liu, Y.; Yang, F.; Li, X. Employment and Decent Work in China’s Forestry Industry; ILO Sectoral Activities Department: Hong Kong, China, 2013. [Google Scholar]
- Buongiorno, J. On the accuracy of international forest product statistics. Forestry 2018, 91, 541–551. [Google Scholar] [CrossRef]

| Production Units | Employment Status | ||||||||
|---|---|---|---|---|---|---|---|---|---|
| Own-Account Workers | Employers | Family Workers | Employees | Member of Producers’ Cooperatives | |||||
| Informal | Formal | Informal | Formal | Informal | Informal | Formal | Informal | Formal | |
| Formal Sector enterprises | F 1 | F 2 | I 1 | I 2 | F 3 | F 4 | |||
| Informal sector enterprises | I 3 | I 4 | I 5 | I 6 | I 7 | I 8 | |||
| Household | I 9 | I 10 | F 5 | ||||||
| Attribute | Proxy Variable | Unit | Year 1 | Data Source |
|---|---|---|---|---|
| Country economic performance | Per capita GDP | constant 2010 US$ | 2014–2016 | World Bank |
| Climatic conditions | Share of boreal forest area | 0 to 1 | 2015 | FRA2020 |
| Share of temperate forest area | 0 to 1 | 2015 | FRA2020 | |
| Share of sub-tropical forest area | 0 to 1 | 2015 | FRA2020 | |
| Share of tropical forest area | 0 to 1 | 2015 | FRA2020 | |
| Type of wood | Share of non-coniferous roundwood production | 0 to 1 | 2014–2016 | FAOSTAT |
| Income Classification/Sub-Sector | N | Low Income | Lower Middle Income | Upper Middle Income | High Income | Global | |||||
|---|---|---|---|---|---|---|---|---|---|---|---|
| 2010 | 2015 | 2010 | 2015 | 2010 | 2015 | 2010 | 2015 | 2010 | 2015 | ||
| Forestry (A02) | 99 | 1.5 | 1.6 | 7.0 | 7.1 | 2.8 | 2.5 | 1.0 | 1.1 | 12.4 | 12.2 |
| Wood (C16) | 97 | 0.01 | 0.02 | 0.3 | 0.4 | 2.7 | 2.7 | 1.6 | 1.6 | 4.6 | 4.7 |
| Paper (C17) | 93 | 0.004 | 0.01 | 0.5 | 0.5 | 2.4 | 2.2 | 1.4 | 1.3 | 4.2 | 4.1 |
| Furniture (C31) | 69 | 0.4 | 0.5 | 0.8 | 0.9 | 1.6 | 1.5 | 2.8 | 2.9 | ||
| Printing (C1811) | 51 | 0.3 | 0.3 | 0.2 | 0.2 | 1.1 | 1.0 | 1.6 | 1.5 | ||
| Forest Cluster | 128 | 1.5 | 1.6 | 8.5 | 8.8 | 8.9 | 10.8 | 6.9 | 6.4 | 25.9 | 27.7 |
| Sub-Sector by Employment Status | Number of Employment (Million Persons FTE) | |||||
|---|---|---|---|---|---|---|
| India | China | Brazil | Ethiopia | DR Congo | Indonesia | |
| Visible employment | ||||||
| Forestry | 6.24 | 1.15 | 0.11 | 0.04 | ||
| Wood industry | 0.09 | 1.51 | 0.17 | 0.01 | 0.24 | |
| Paper industry | 0.25 | 1.39 | 0.19 | 0.00 | 0.15 | |
| Furniture | 0.06 | 1.20 | 0.24 | 0.17 | ||
| Printing | 0.15 | 0.92 | ||||
| Invisible employment | ||||||
| Forestry, excl. NWFP | ||||||
| minimum | 4.76 | 4.75 | 3.87 | 2.53 | ||
| maximum | 9.27 | 8.63 | 7.02 | 4.87 | ||
| Total employment | ||||||
| minimum | 6.78 | 6.16 | 5.46 | 4.76 | 3.87 | 3.13 |
| maximum | 6.78 | 6.16 | 9.97 | 8.65 | 7.02 | 5.47 |
| Source | Year | Forestry and Logging | Wood-Based Industries | Total | ||
|---|---|---|---|---|---|---|
| Formal | Informal | Formal | Informal | |||
| Poschen; ILO [5,6] | Late 1990s | 4.7 | 13.6 | 12.7 | 16 | 47 |
| FAO [3] | 2010–2011 | 3.5 | 9.2 | 9.7 | 31.8 | 54 |
| Visible | Invisible | |||||
| Our estimates | 2015 | 12.4 | 36 | 15.5 | - | 64 |
Publisher’s Note: MDPI stays neutral with regard to jurisdictional claims in published maps and institutional affiliations. |
© 2021 by the authors. Licensee MDPI, Basel, Switzerland. This article is an open access article distributed under the terms and conditions of the Creative Commons Attribution (CC BY) license (https://creativecommons.org/licenses/by/4.0/).
Share and Cite
Lippe, R.S.; Cui, S.; Schweinle, J. Estimating Global Forest-Based Employment. Forests 2021, 12, 1219. https://doi.org/10.3390/f12091219
Lippe RS, Cui S, Schweinle J. Estimating Global Forest-Based Employment. Forests. 2021; 12(9):1219. https://doi.org/10.3390/f12091219
Chicago/Turabian StyleLippe, Rattiya Suddeephong, Shannon Cui, and Jörg Schweinle. 2021. "Estimating Global Forest-Based Employment" Forests 12, no. 9: 1219. https://doi.org/10.3390/f12091219
APA StyleLippe, R. S., Cui, S., & Schweinle, J. (2021). Estimating Global Forest-Based Employment. Forests, 12(9), 1219. https://doi.org/10.3390/f12091219