Article

Effects of Antimony Stress on Growth and Physiology of 10 Genotypes of Catalpa bungei

1
State Key Laboratory of Tree Genetics and Breeding, Key Laboratory of Tree Breeding and Cultivation, National Forestry and Grassland Administration, National Innovation Alliance of Catalpa Bungei, Research Institute of Forestry, Chinese Academy of Forestry, Beijing 100091, China
2
Trees Clones Breeding Technology Key Laboratory of Hunan Province, Hunan Forestry Academy, Changsha 410004, China
*
Author to whom correspondence should be addressed.
Forests 2021, 12(8), 1036; https://doi.org/10.3390/f12081036
Submission received: 21 May 2021 / Revised: 29 July 2021 / Accepted: 31 July 2021 / Published: 4 August 2021
(This article belongs to the Section Genetics and Molecular Biology)

Abstract

:
Increasing levels of antimony (Sb) pollution have been recognized as an emerging environmental problem. Phytoremediation of Sb-contaminated soil is a green, economical, and effective method for restoring polluted soils. Here, we studied differences in Sb tolerance, accumulation, and transport by different genotypes of Catalpa bungei C. A. Mey, with the goal of identifying genotypes that are suitable for remediating Sb-contaminated soil. Different concentrations of Sb were applied to soil, and we analyzed variation in growth, biomass, Sb content in different organs, Sb transport capacity, oxidizing substances, antioxidants, and antioxidant enzyme activities in 10 C. bungei genotypes. Marked differences were found in plant height, ground diameter, and biomass among different genotypes at given Sb concentrations. The Sb concentration in different plant organs also varied between genotypes. The content of Sb in each genotype was proportional to the exposure. At 600 mg Sb/kg soil, the highest concentration of Sb in roots and leaves was found in Genotype 63, and that in stems was found in Genotype 8402. The lowest concentration of Sb in roots, stems, and leaves was found in Genotypes 8402, 2-8, and 20-01, respectively. At 1200 mg Sb/kg soil, Genotype 5-2 had the highest concentration of Sb in roots, and Genotype 1-1 had the highest concentration in stems and leaves. The lowest concentration of Sb in roots was in Genotype 72, and that in stems and leaves was found in Genotype 20-01. At 2000 mg Sb/kg soil, the highest concentration of Sb in roots was found in Genotype 5-8, in stems in Genotype 8402, and in leaves in Genotype 72. The lowest concentration of Sb in roots was observed in Genotype 72 and in stems and leaves in Genotype 2-8. After absorption by C. bungei, Sb mainly accumulated in the roots, and upward transfer ability was poor. The Sb biological concentration factor of roots of all genotypes was >1 at each tested Sb concentration. Our results demonstrate that all 10 C. bungei genotypes could be used for plant stabilization of Sb-contaminated soil. However, the different genotypes of C. bungei had different responses to different Sb concentrations. Based on root Sb accumulation values, at soil Sb concentrations around 600 mg/kg, Genotypes 1, 63, and 5-8 are suited to phytoremediation; Genotypes 5-8, 1, and 5-2 are suited to phytoremediation at soil Sb concentrations around 1200 mg/kg; and Genotypes 5-8, 1, and 8402 are suited to phytoremediation at soil Sb concentrations around 2000 mg/kg. We demonstrate for the first time that Sb-contaminated soil can be improved by using specific plant genotypes tailored to different levels of Sb pollution.

1. Introduction

Heavy metal pollution has become more severe with widespread industrialization and the intensification of agriculture. Mining and smelting of nonferrous metals are among the main sources of heavy metal pollutants in the environment [1]. Antimony (Sb) is used in a variety of industrial products [2,3]. Sb is a trace element similar to arsenic and is toxic to both plants and humans [4,5]. Excessive intake of Sb through the food chain can lead to a variety of diseases in humans, including cancer, cardiovascular disease, and liver disease [6,7,8]; as a result, Sb is listed as a priority pollutant by the US Environmental Protection Agency and the European Union [9,10]. Rock weathering and volcanic activity are natural sources of Sb in the environment, but these processes release little Sb, and natural environmental concentrations of this element are low [11]. However, human activities such as mining, smelting, and fossil fuel emissions have led to the release of large amounts of Sb, causing serious Sb pollution in some parts of the world [12]. China has the largest global Sb reserves, accounting for >90% of the world’s Sb production, followed by Australia, Russia, South Africa, Tajikistan, Canada, and the United States [13,14]. The Sb concentration in tin mine soil in Hunan Province, China, reached as high as 5045 mg/kg [15], and the concentration in the soil of an abandoned mining area in Italy was 4400 mg/kg [16].
Sb is not a necessary element for plants, but if present in soluble form, it is easily absorbed by plant roots. It is generally believed that Sb content >150 mg/kg soil will cause damage to plants [9]. Plants accumulate reactive oxygen species (ROS) produced by cells under high Sb concentration, which leads to oxidative stress [17]. Plants can avoid oxidative damage by inducing antioxidant enzyme activity and nonenzymatic antioxidants [18]. Sb toxicity in plants induces catalase (CAT), superoxide dismutase (SOD), peroxidase (POD), glutathione reductase (GR), and ascorbate peroxidase (APX) activity to cope with the heavy metal stress [19,20]. Some plants are tolerant of heavy-metal-contaminated soil and can thus be used to remediate contaminated soil. However, the effects of heavy metal concentration vary between plant species and among different varieties of the same plant [21,22]. Therefore, screening plant species and varieties is of great significance for the successful remediation of metal(loid)-contaminated soils.
Catalpa bungei C. A. Mey is a precious tree species unique to China. Its wood has high grain compressive strength and bending strength, and it is also resistant to corrosion, so it is often used as a material for making high-grade furniture, flooring, and special equipment [18,23]. C. bungei is also highly resistant to pollution, and it is a fast-growing tree species with high biomass. Therefore, C. bungei is an excellent candidate to remediate Sb-contaminated soil. The objective of this study was to experimentally address the following questions:
  • How do different genotypes of C. bungei grow under Sb stress?
  • How do different genotypes of C. bungei differ in their Sb absorption and transport abilities?
  • What are the physiological responses of different genotypes of C. bungei to different Sb concentrations?
We aimed to identify C. bungei genotypes with high tolerance to Sb to help select suitable genotypes for the remediation of Sb-contaminated soil.

2. Materials and Methods

2.1. Materials

We conducted this study using 10 genotypes of C. bungei selected by the Chinese Academy of Forestry: Genotypes 8402, 20-01, 5-8, 63, 5-2, 0, 1, 2-8, 1-1, and 72. Genotypes 8402, 63, 5-8, 5-2, 0, 1, and 72 are elite trees of C. bungei. Genotypes 20-01, 2-8, and 1-1 are clones of the hybrid progeny of elite trees. All the genotypes were propagated by tissue culture.

2.2. Plant Material Culture and Experimental Design

The study site was in the Longfu Scientific Research Base of the Hunan Academy of Forestry, Liuyang City, Hunan Province, China (28°24′0″ N, 113°29′35″ E). This region has a subtropical monsoon humid climate. The mean annual temperature in the region is 17.5 °C, and the annual average precipitation is 1467 mm. The soil is Quaternary red soil. All 10 C. bungei genotypes were obtained as rooting seedlings in tissue culture.
Seedlings were cultivated in local pollution-free red soil developed from Quaternary red clays; background values of chemical elements in the soil are shown in Table 1. Seedlings were grown in plastic pots (30 cm diameter × 18 cm height). Soil was sieved to 2 mm, and each pot contained 5 kg of soil. One month after transplanting, seedlings of similar size (20 ± 5 cm) were selected for the Sb stress experiments. The experiment was set up using a randomized block design. Four seedlings were planted in each basin, and these plantings were replicated three times. Sb treatment started on 15 June 2020. Four treatments were applied, with Sb concentrations 0, 600, 1200, and 2000 mg/kg soil. The Sb treatment was applied using irrigation, and the corresponding aqueous solution was prepared from potassium antimony tartrate (KSbC4H4O7·½H2O, purchased from Sinopharm Chemical Reagent Co., Ltd., Shanghai, China). The aqueous solution was applied three times; each irrigation run was long enough for the solution to avoid infiltrating the basin floor. To maintain consistency with the external climate, keep the soil moist, and avoid Sb loss, potted plants were placed under a transparent, ventilated cover that kept out only rain and were watered every 3 days.

2.3. Sample Collection and Characterization

After 90 days of cultivation, three plants in each treatment were randomly selected and washed with deionized water three times. Plant height and diameter at ground level were measured, and plant roots, stems, and leaves were harvested. Fresh leaf samples (5 g each) from each treatment were placed in liquid nitrogen before characterization of stress-resistance-related enzymes and nonenzymatic substances. Fresh leaf samples (5 g each) were placed on dry ice for determination of chlorophyll levels. The remaining plant matter was oven-dried at 105 °C for 30 min, then dried at 80 °C to constant weight, after which the biomass of roots, stems, and leaves was measured for each treatment. The roots, stems, and leaves from each treatment were crushed with a grinder and screened through a 100-mesh sieve (0.150 mm).

2.3.1. Sb Content Measurement

Dried plant material fine powder (0.5 g) was weighed in a 50 mL digestion vessel, and 10 mL of concentrated HNO3 (15.2 mol/L) was added and reacted overnight. The digestion was performed using a microwave digestion instrument (CEM Mars6, CEM Corporation, Charlotte, NC, USA). After cooling to room temperature, the resulting solutions were centrifuged, the supernatant was filtered (0.45 mm cellulose acetate membrane; Sartorius, Gottingen, Germany), the volume was adjusted to 50 mL by adding distilled water, and the content of Sb in each sample was determined by inductively coupled plasma mass spectrometry (Thermo ICAP7000, Thermo Fisher Scientific Inc., Waltham, MA, USA).

2.3.2. Measurement of Physiological and Biochemical Indices

Hydrogen peroxide (H2O2) content, superoxide anion (O2▪) content, CAT activity, reduced glutathione (GSH) content, and APX activity were measured using kits from Solarbio (Beijing Solarbio Science & Technology Co., Ltd., Beijing, China).

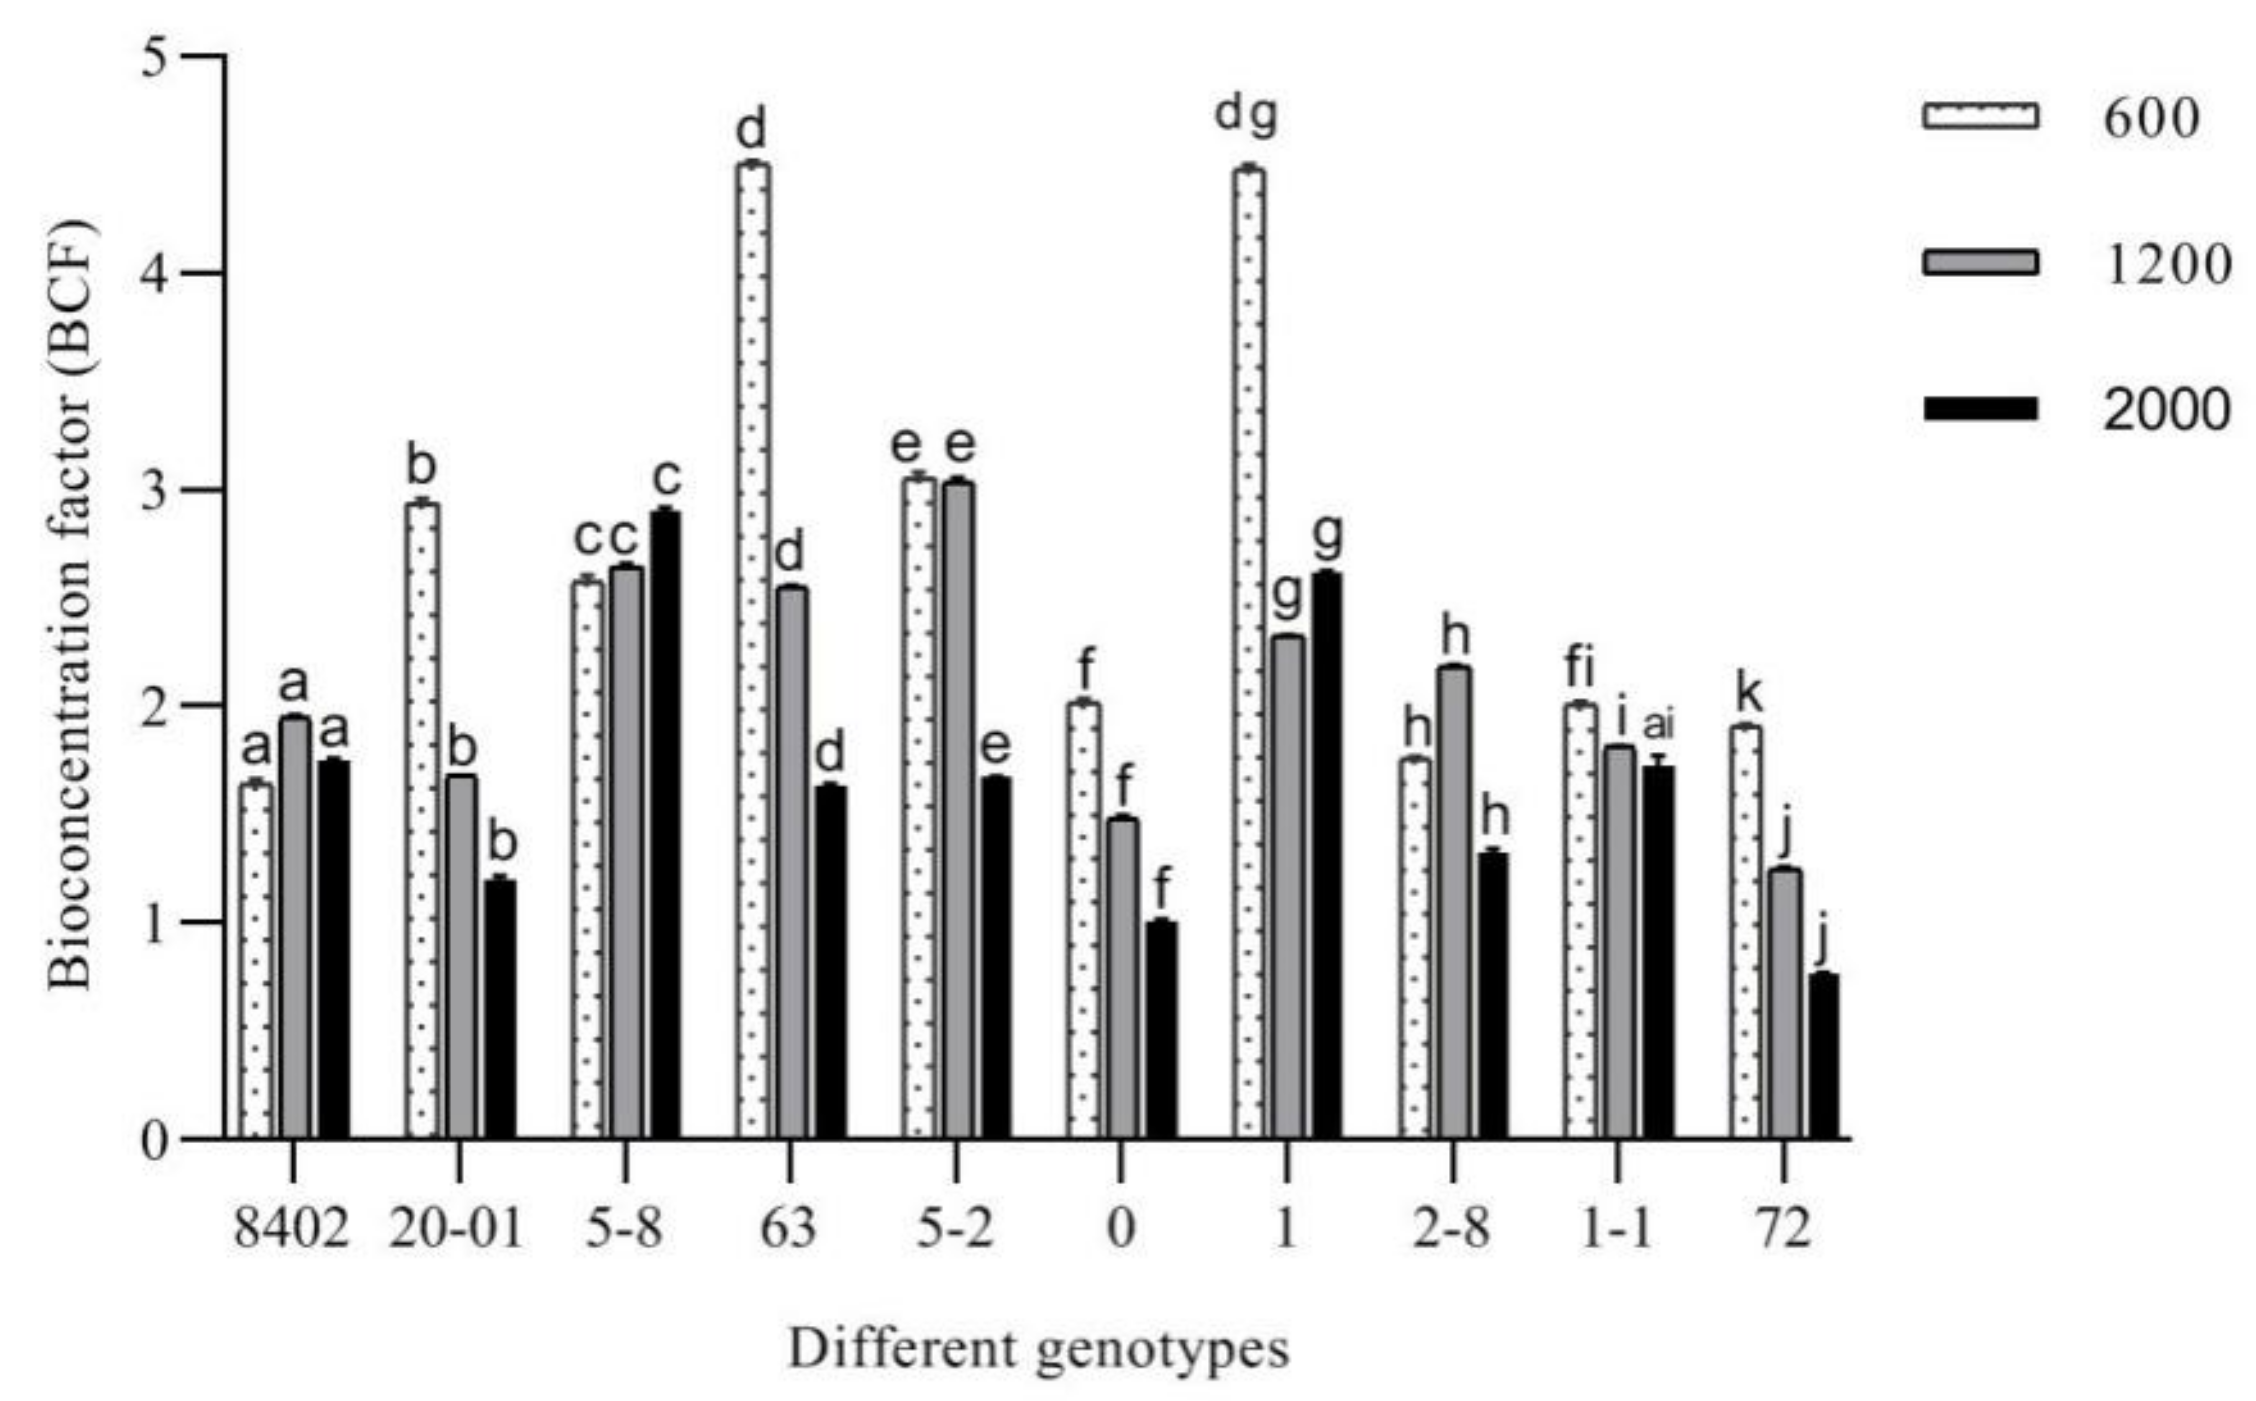
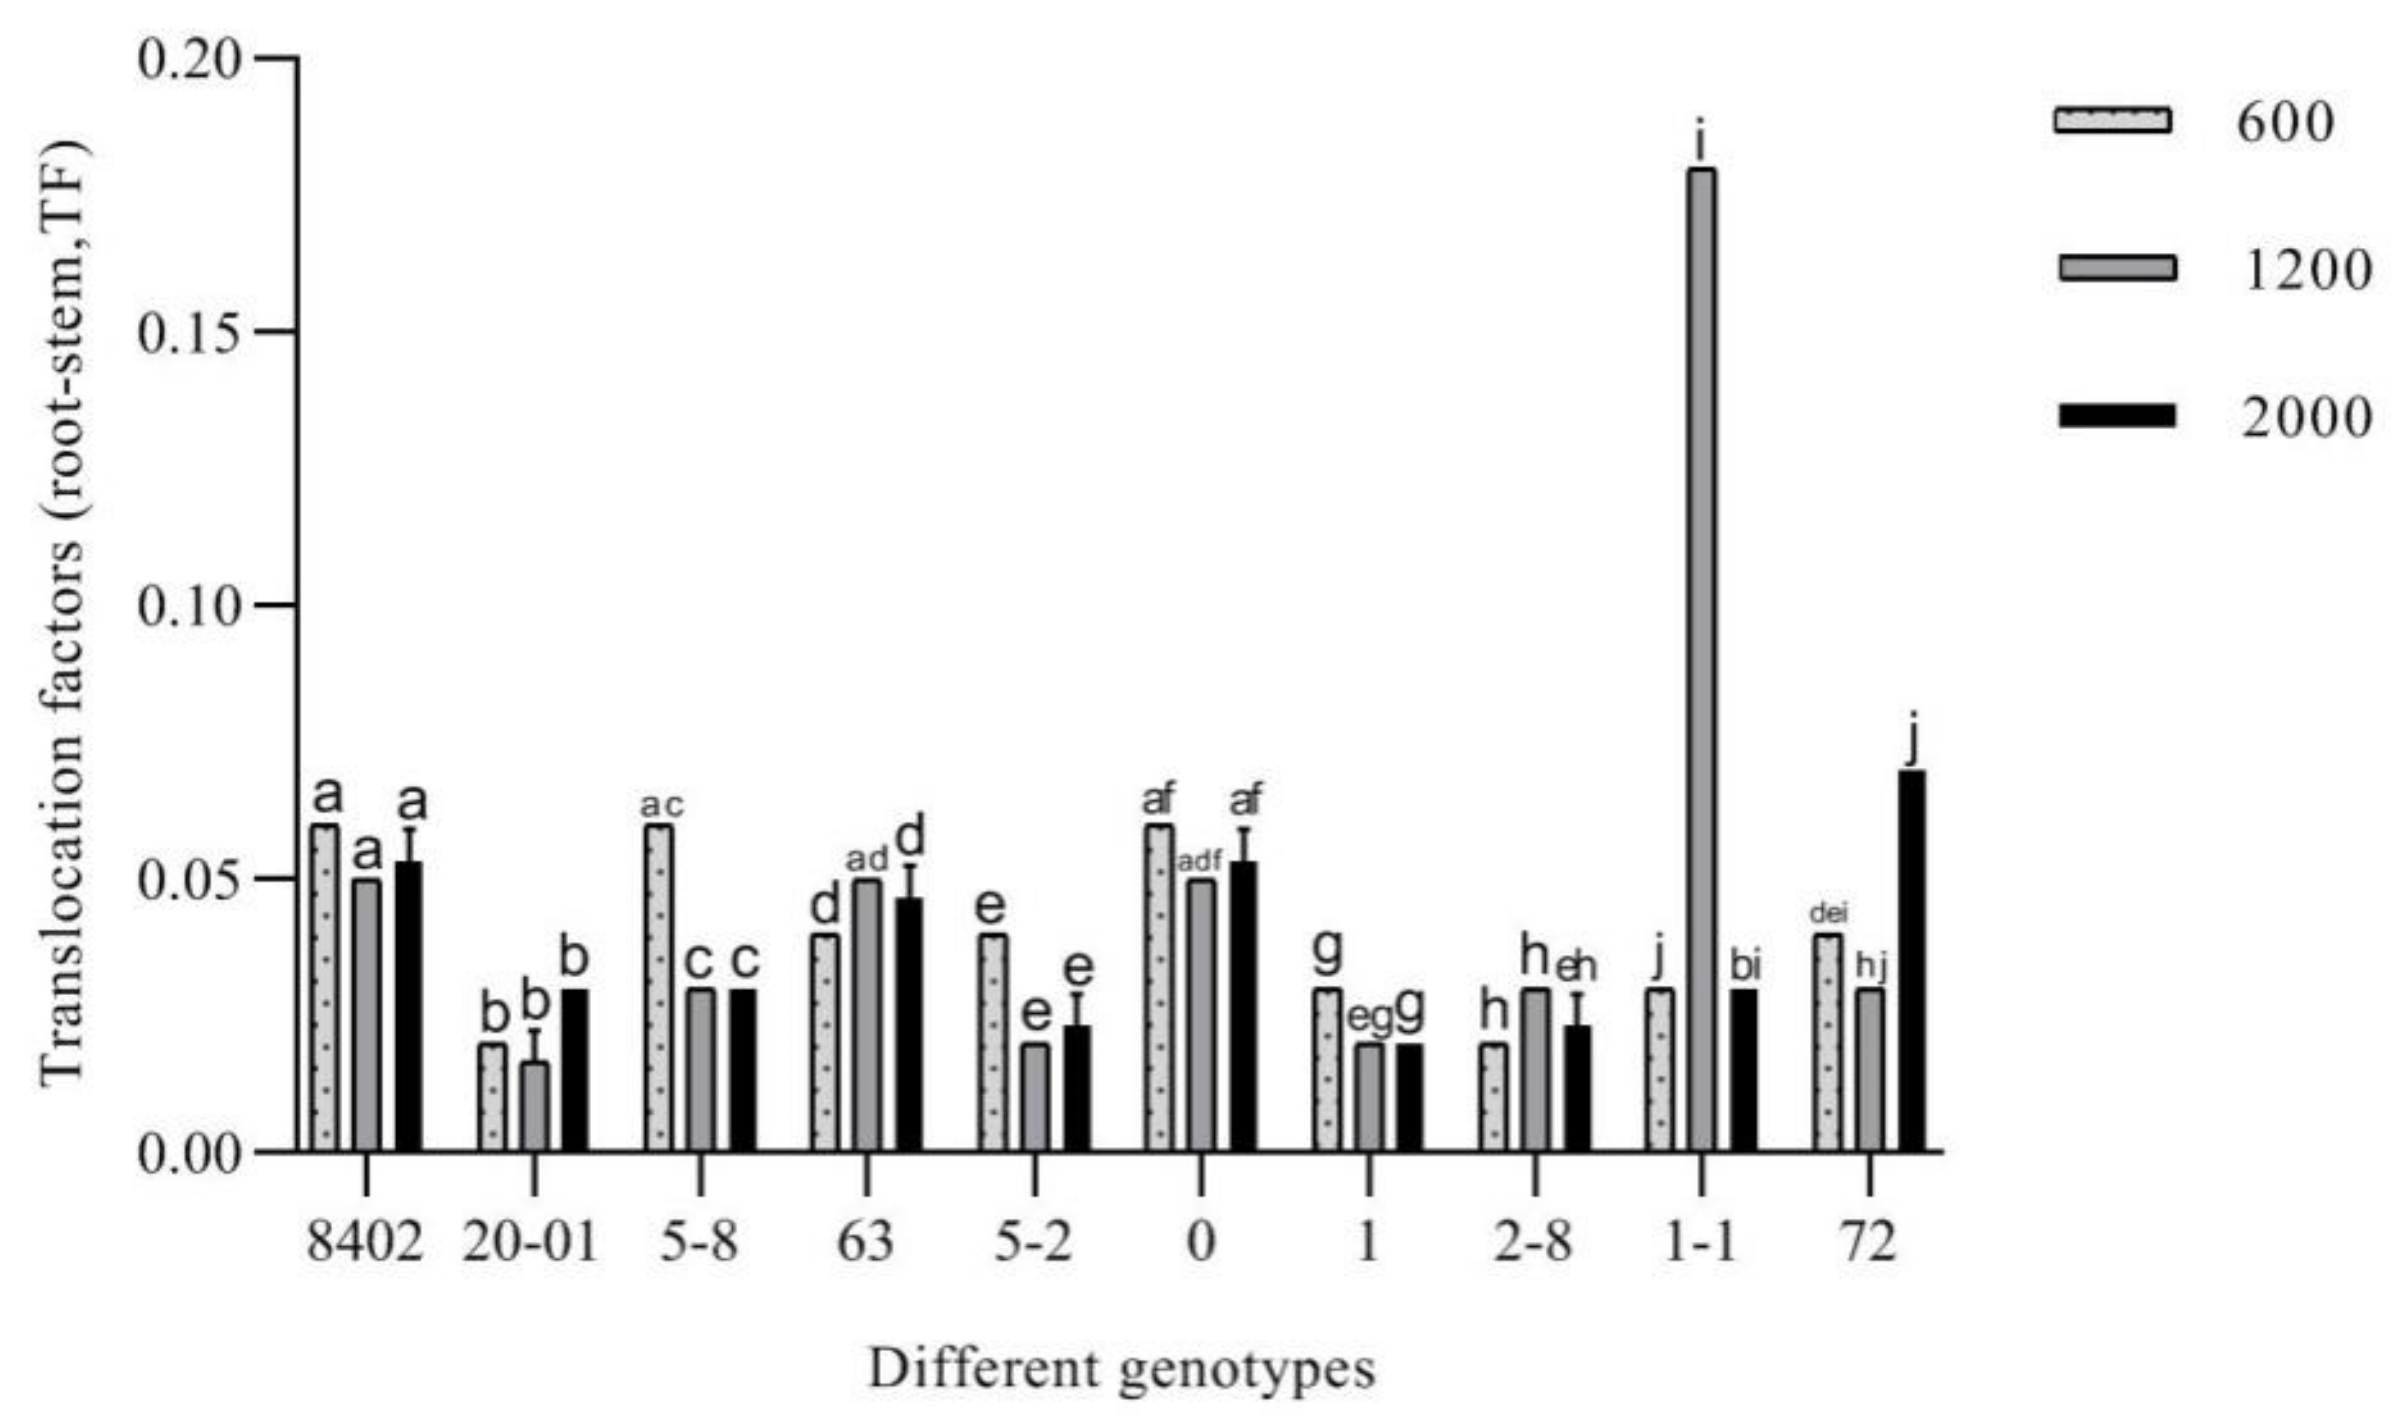
2.4. Biological Concentration Factor and Transfer Factor of Heavy Metal(loid)s

The biological concentration factor (BCF) in roots and the transfer factor (TF) were calculated according to the following formulae [24,25,26]:
BCF = CRoot/CSoil
where CRoot is the concentration of Sb in plant roots (mg/kg), and CSoil is the concentration of Sb in the soil.
The transfer factor (TF) represents the efficiency of heavy metal(loid) transfer from root to shoot [26,27]:
TFRoot-Stem = CStem-Sb/CRoot-Sb
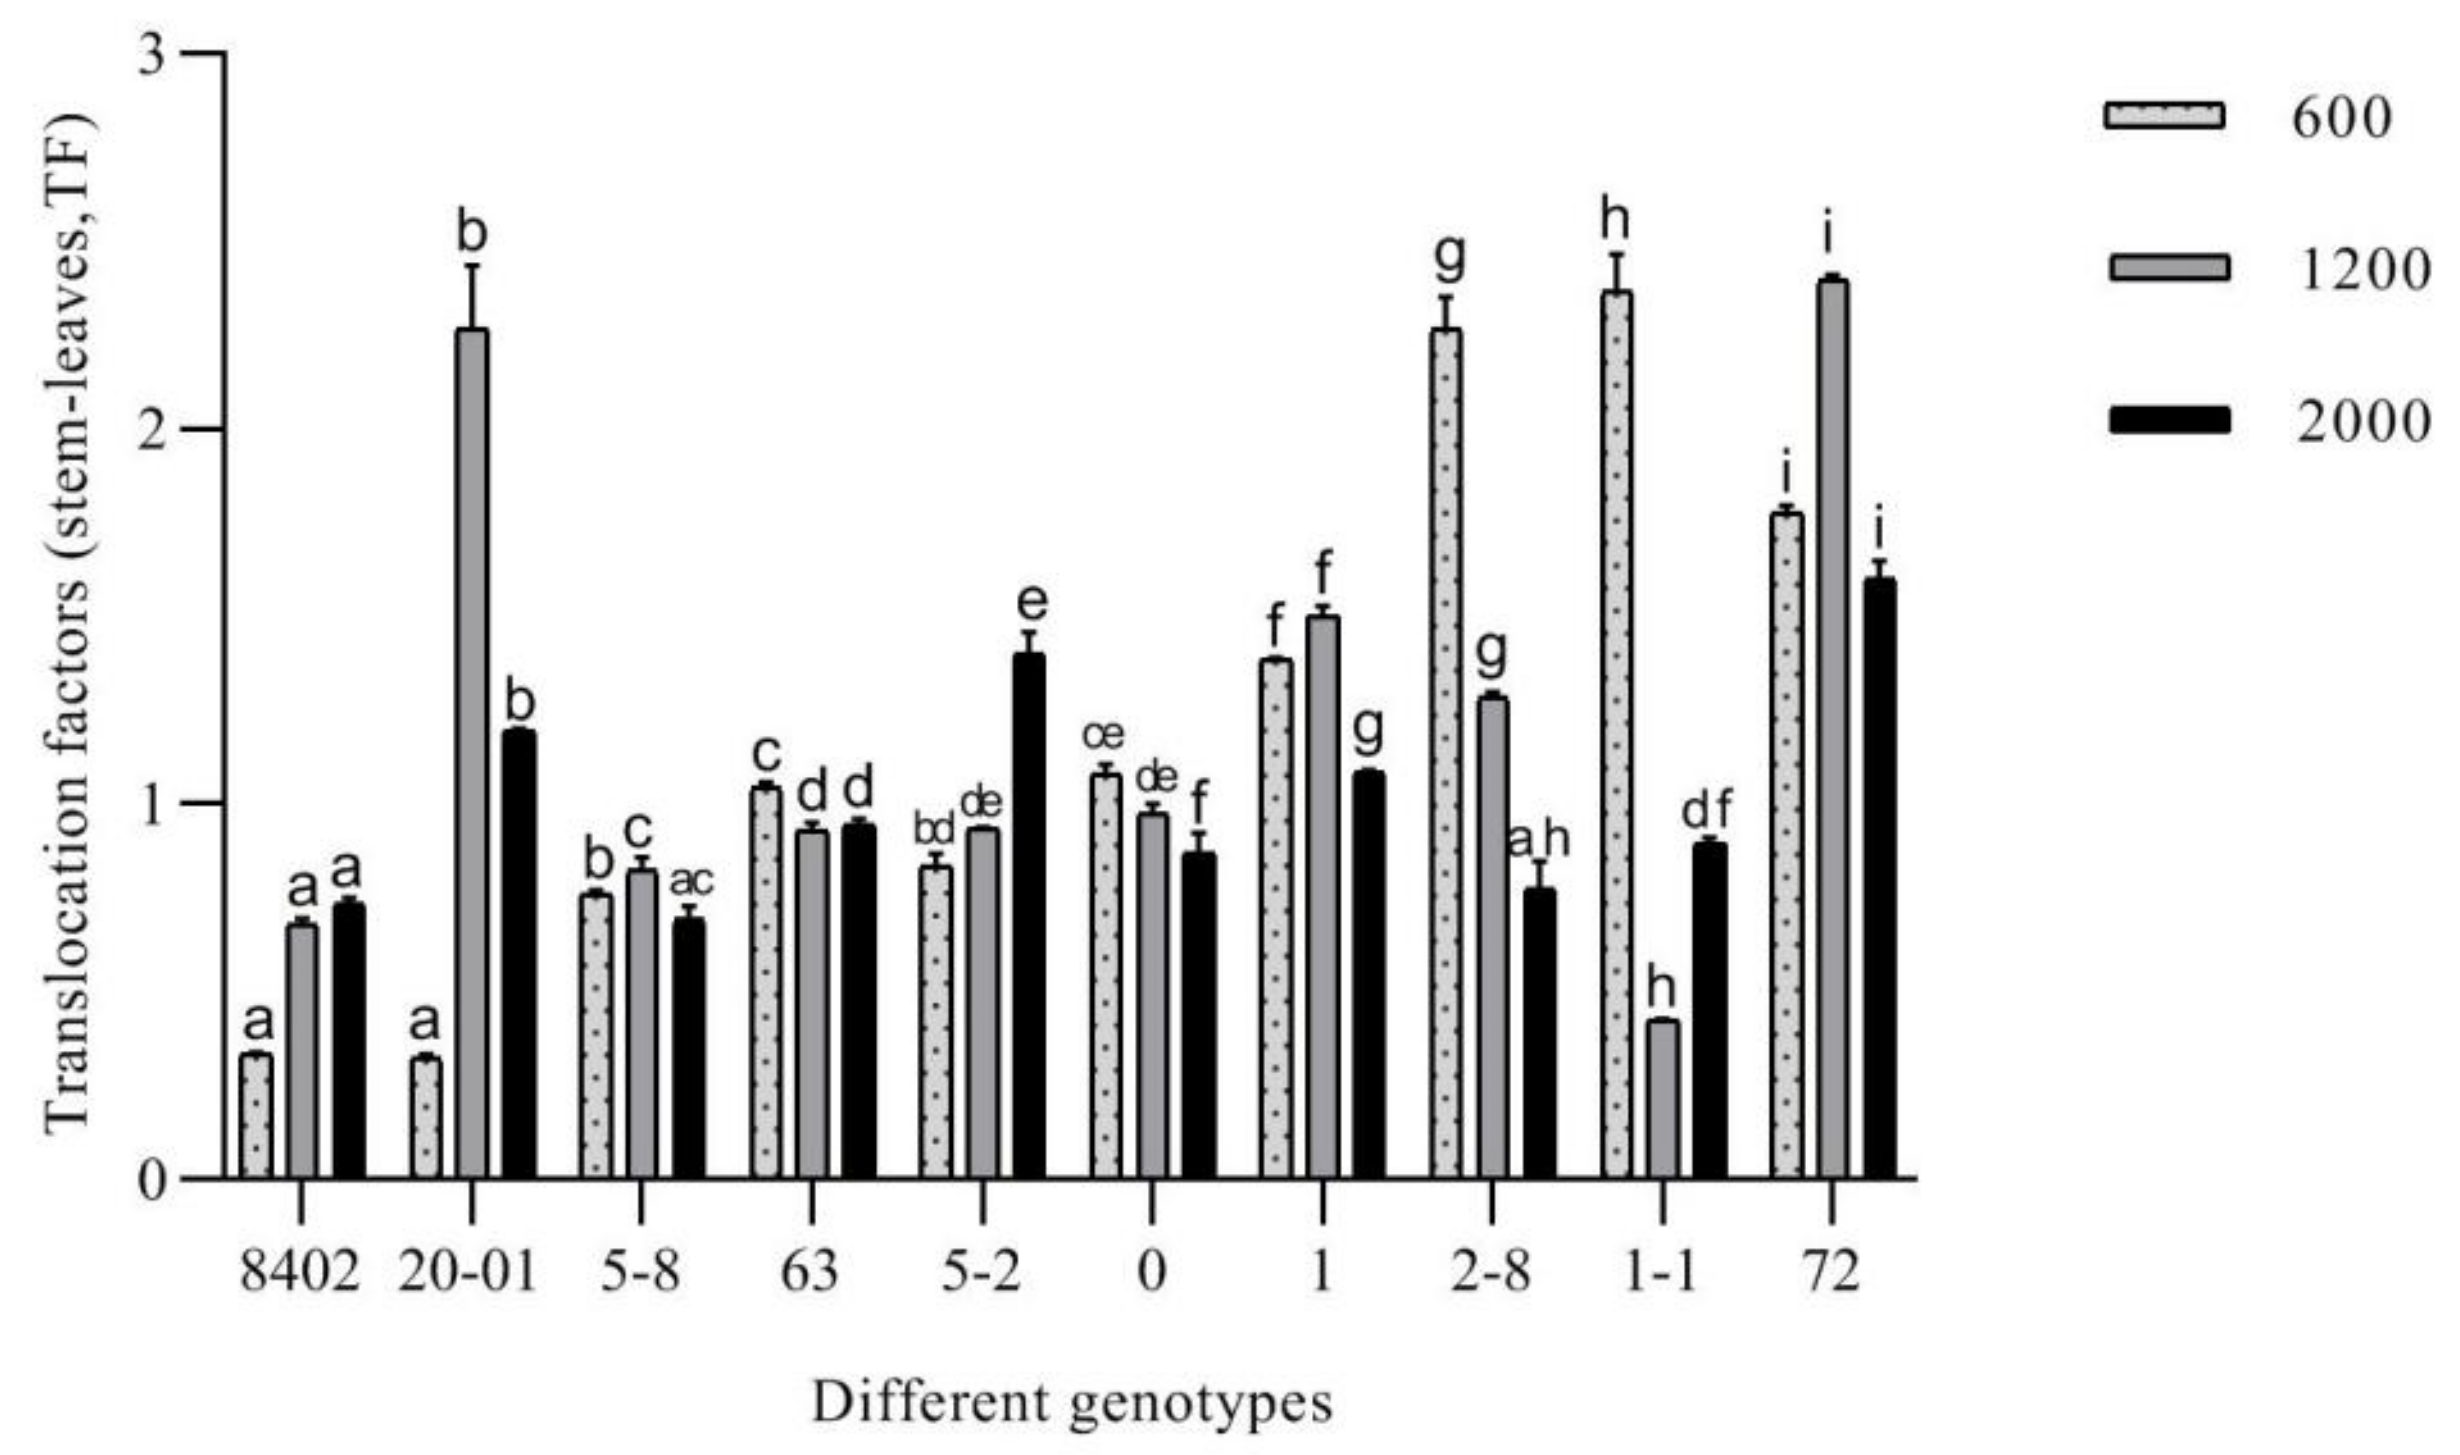
TFStem-Leaf = CLeaf-Sb/CStem-Sb
where TFRoot-Stem, TFStem-Leaf, CRoot-Sb, CStem-Sb, and CLeaf-Sb are the root–stem transfer factor, stem–leaf transfer factor, root Sb concentration, stem Sb concentration, and foliar Sb concentration, respectively.

2.5. Statistical Analysis

All results are reported as the mean ± standard deviation of three replicates, and there were three plants in each replicate. Data were analyzed using SPSS version 17.0 software (SPSS Inc., Chicago, IL, USA), including one-way analysis of variance (ANOVA) and Student–Newman–Keuls post-hoc tests. Differences were considered significant for p < 0.05, and highly significant for p < 0.01. GraphPad Prism8 software (GraphPad Software Inc., San Diego, CA, USA) was used to create figures.

3. Results

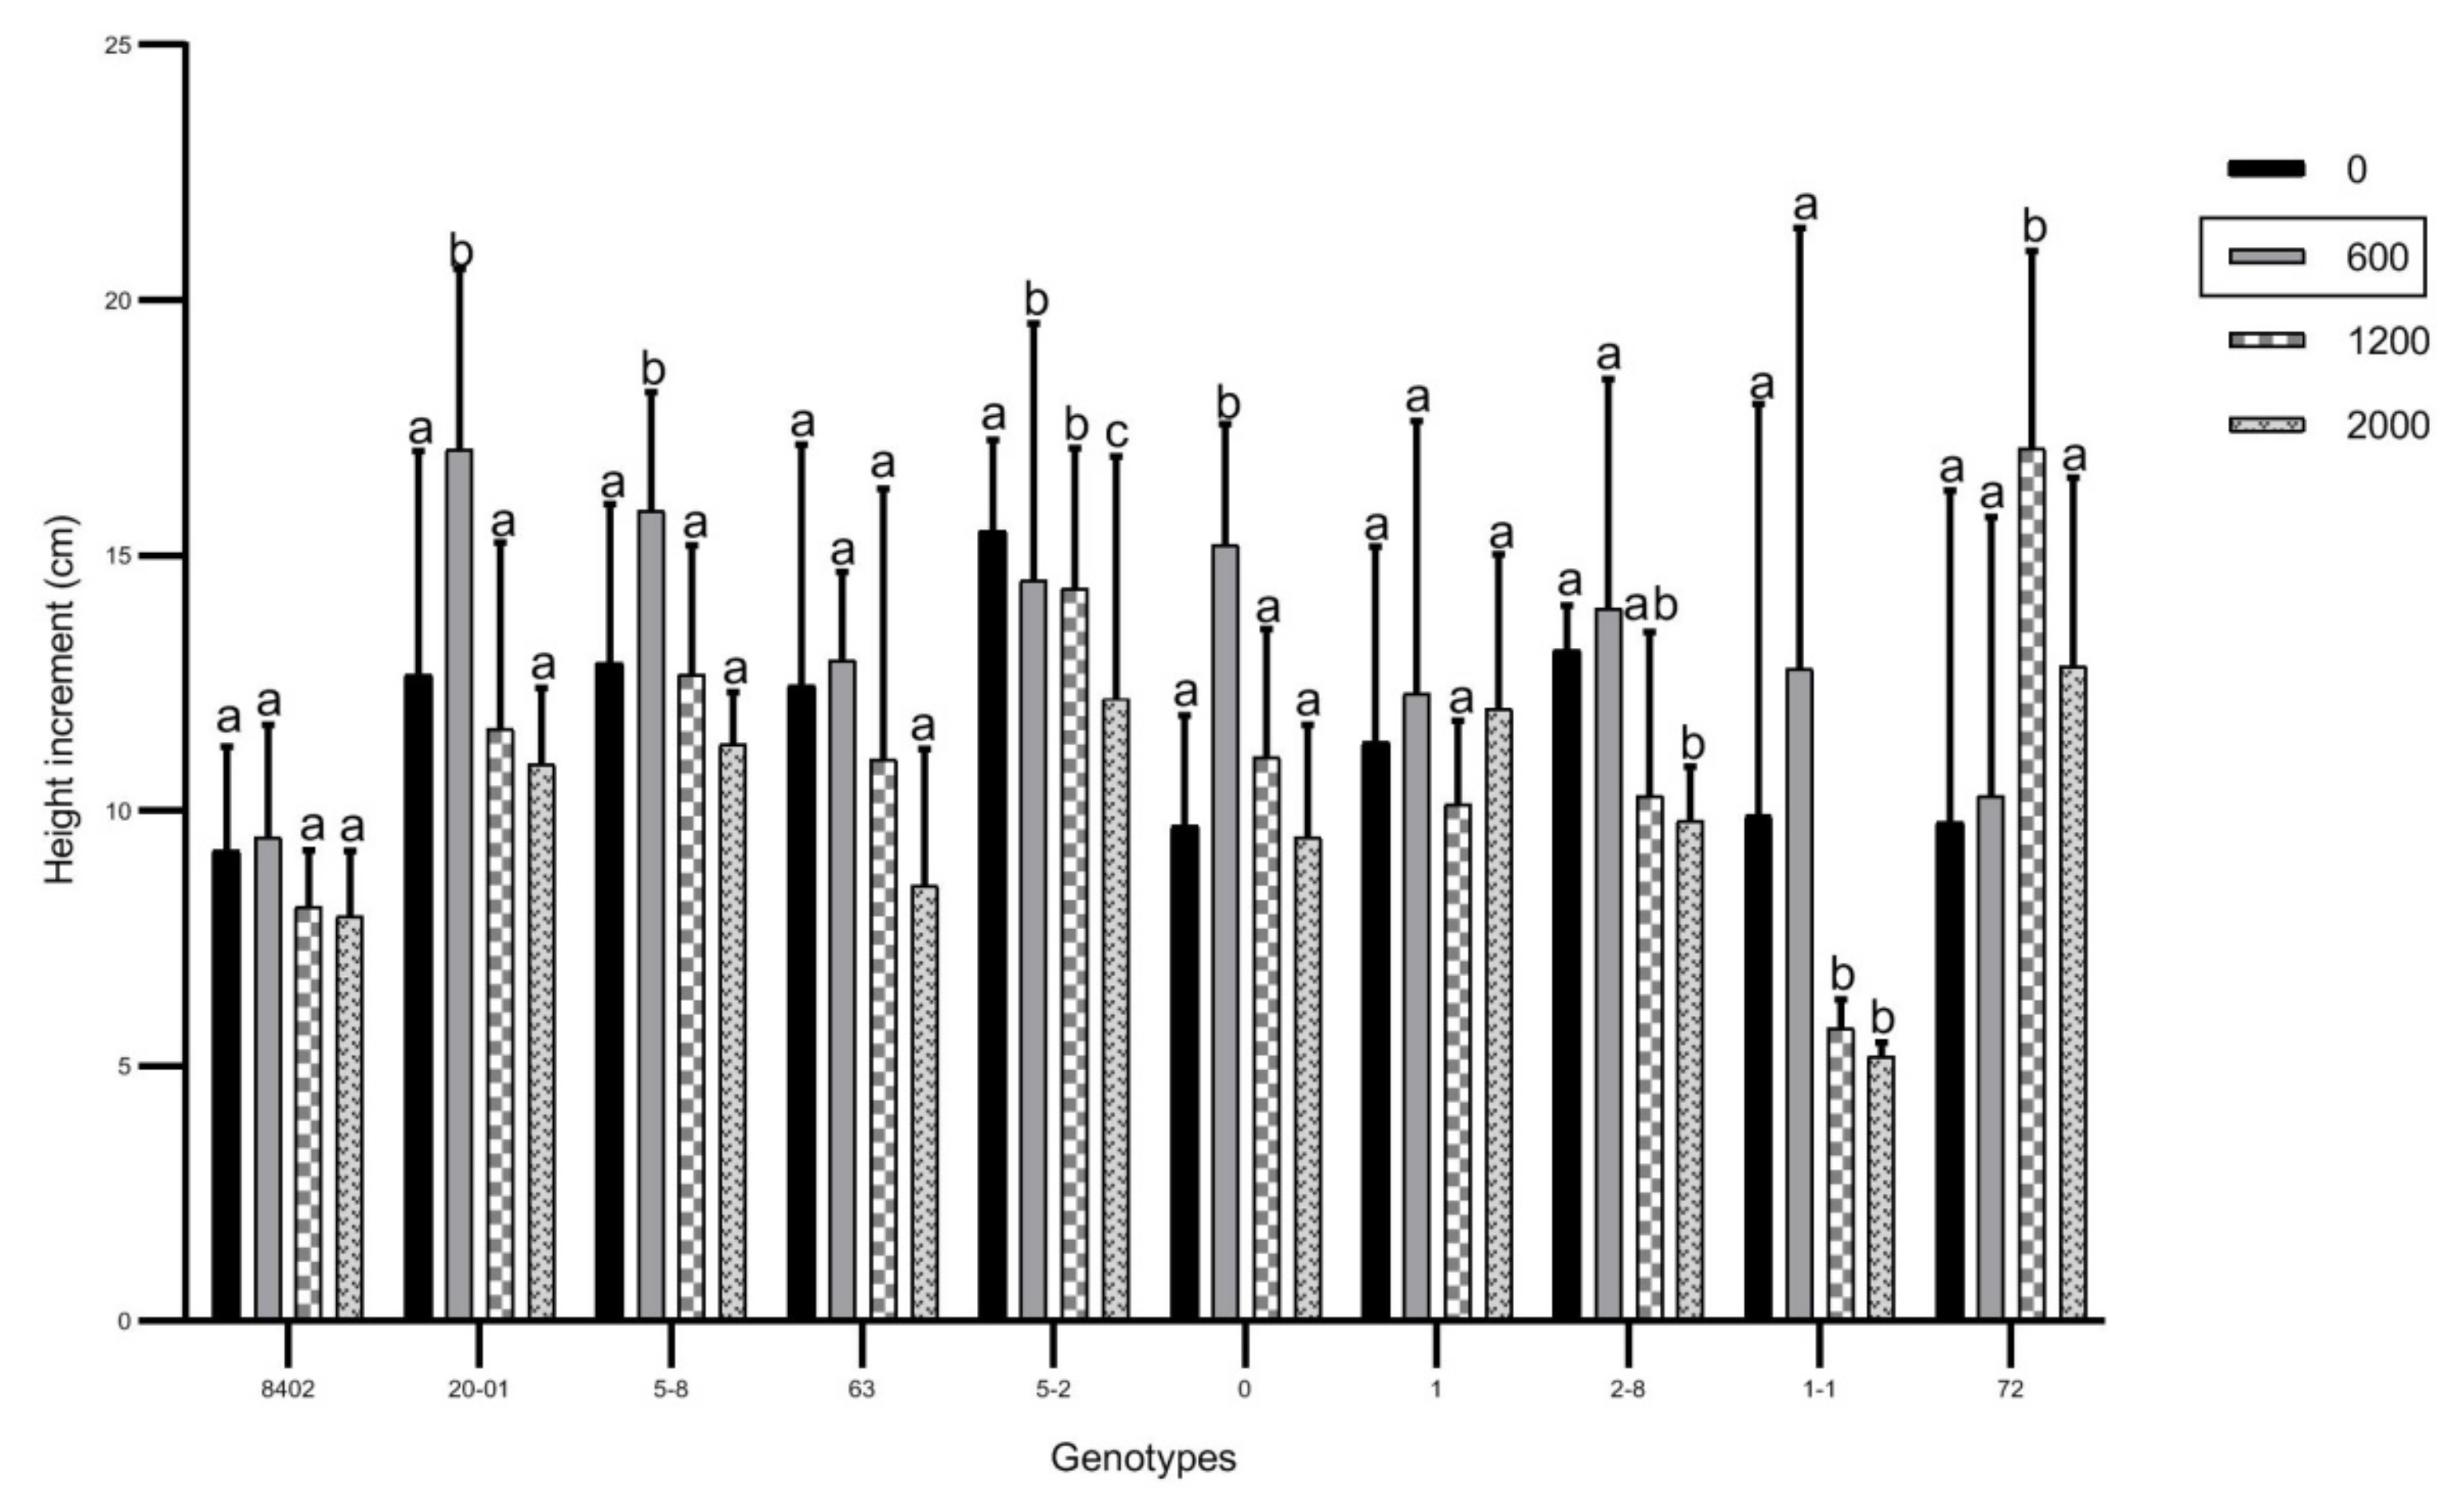
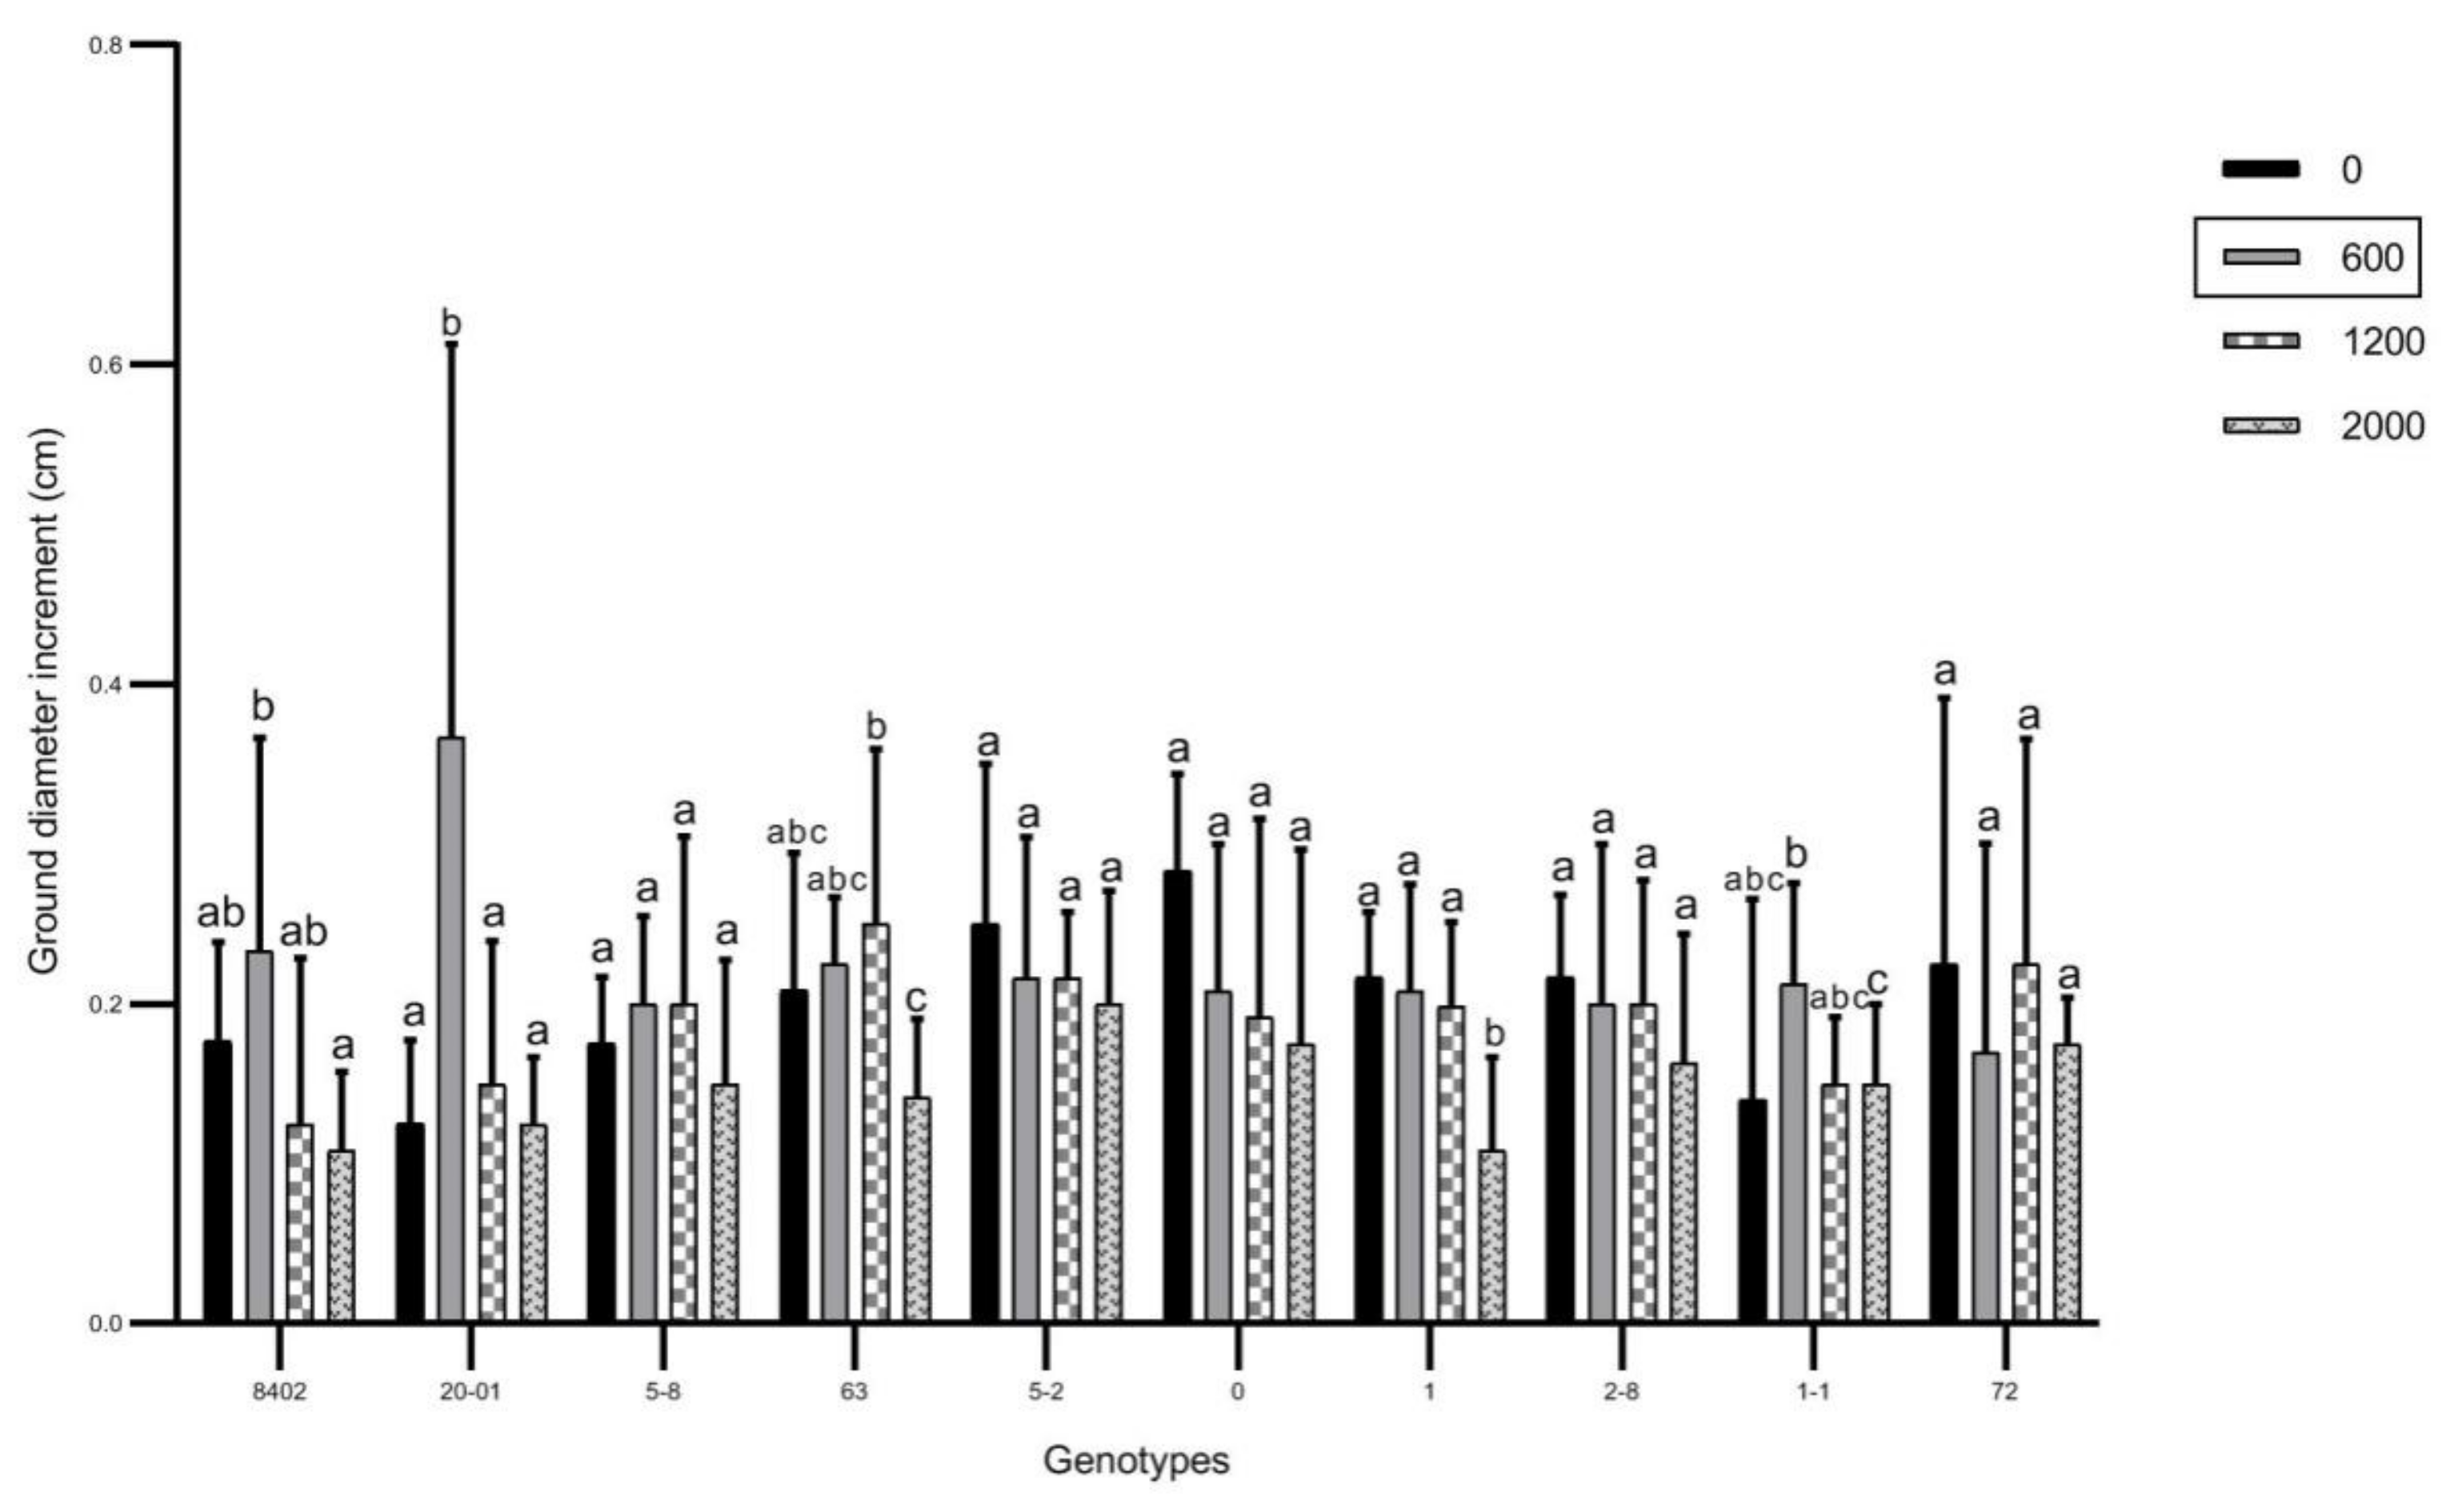
3.1. Effects of Soil Sb Concentration on Growth of C. bungei

C. bungei exposed to Sb did not display typical poisoning symptoms on the aboveground plant parts. No yellowing or necrosis appeared in the leaves. However, there were differences in plant height and ground diameter increment among the different genotypes, and most genotypes of C. bungei also exhibited different levels of growth under increasing Sb exposure (Figure 1, Figure 2 and Table S1). Plant growth (both plant height and ground diameter) of most genotypes initially increased and then decreased gradually with increasing Sb concentration. Different genotypes exhibited some distinct responses to Sb concentration: the height of Genotype 5-2 decreased with increasing Sb concentration, while Genotypes 1 and 72 exhibited no fixed trend; the ground diameter growth of Genotypes 0, 1, and 2-8 decreased gradually with increasing Sb concentration. In contrast, the ground diameter of Genotypes 8402, 20-01, 1-1, 5-8, and 63 first increased and then decreased with increasing Sb concentration. ANOVA revealed no significant difference in plant height between Genotypes 8402 and 1 under different concentrations of Sb, and we similarly found no significant difference in ground diameter growth among Genotypes 5-8, 5-2, 0, 2-8, and 72.

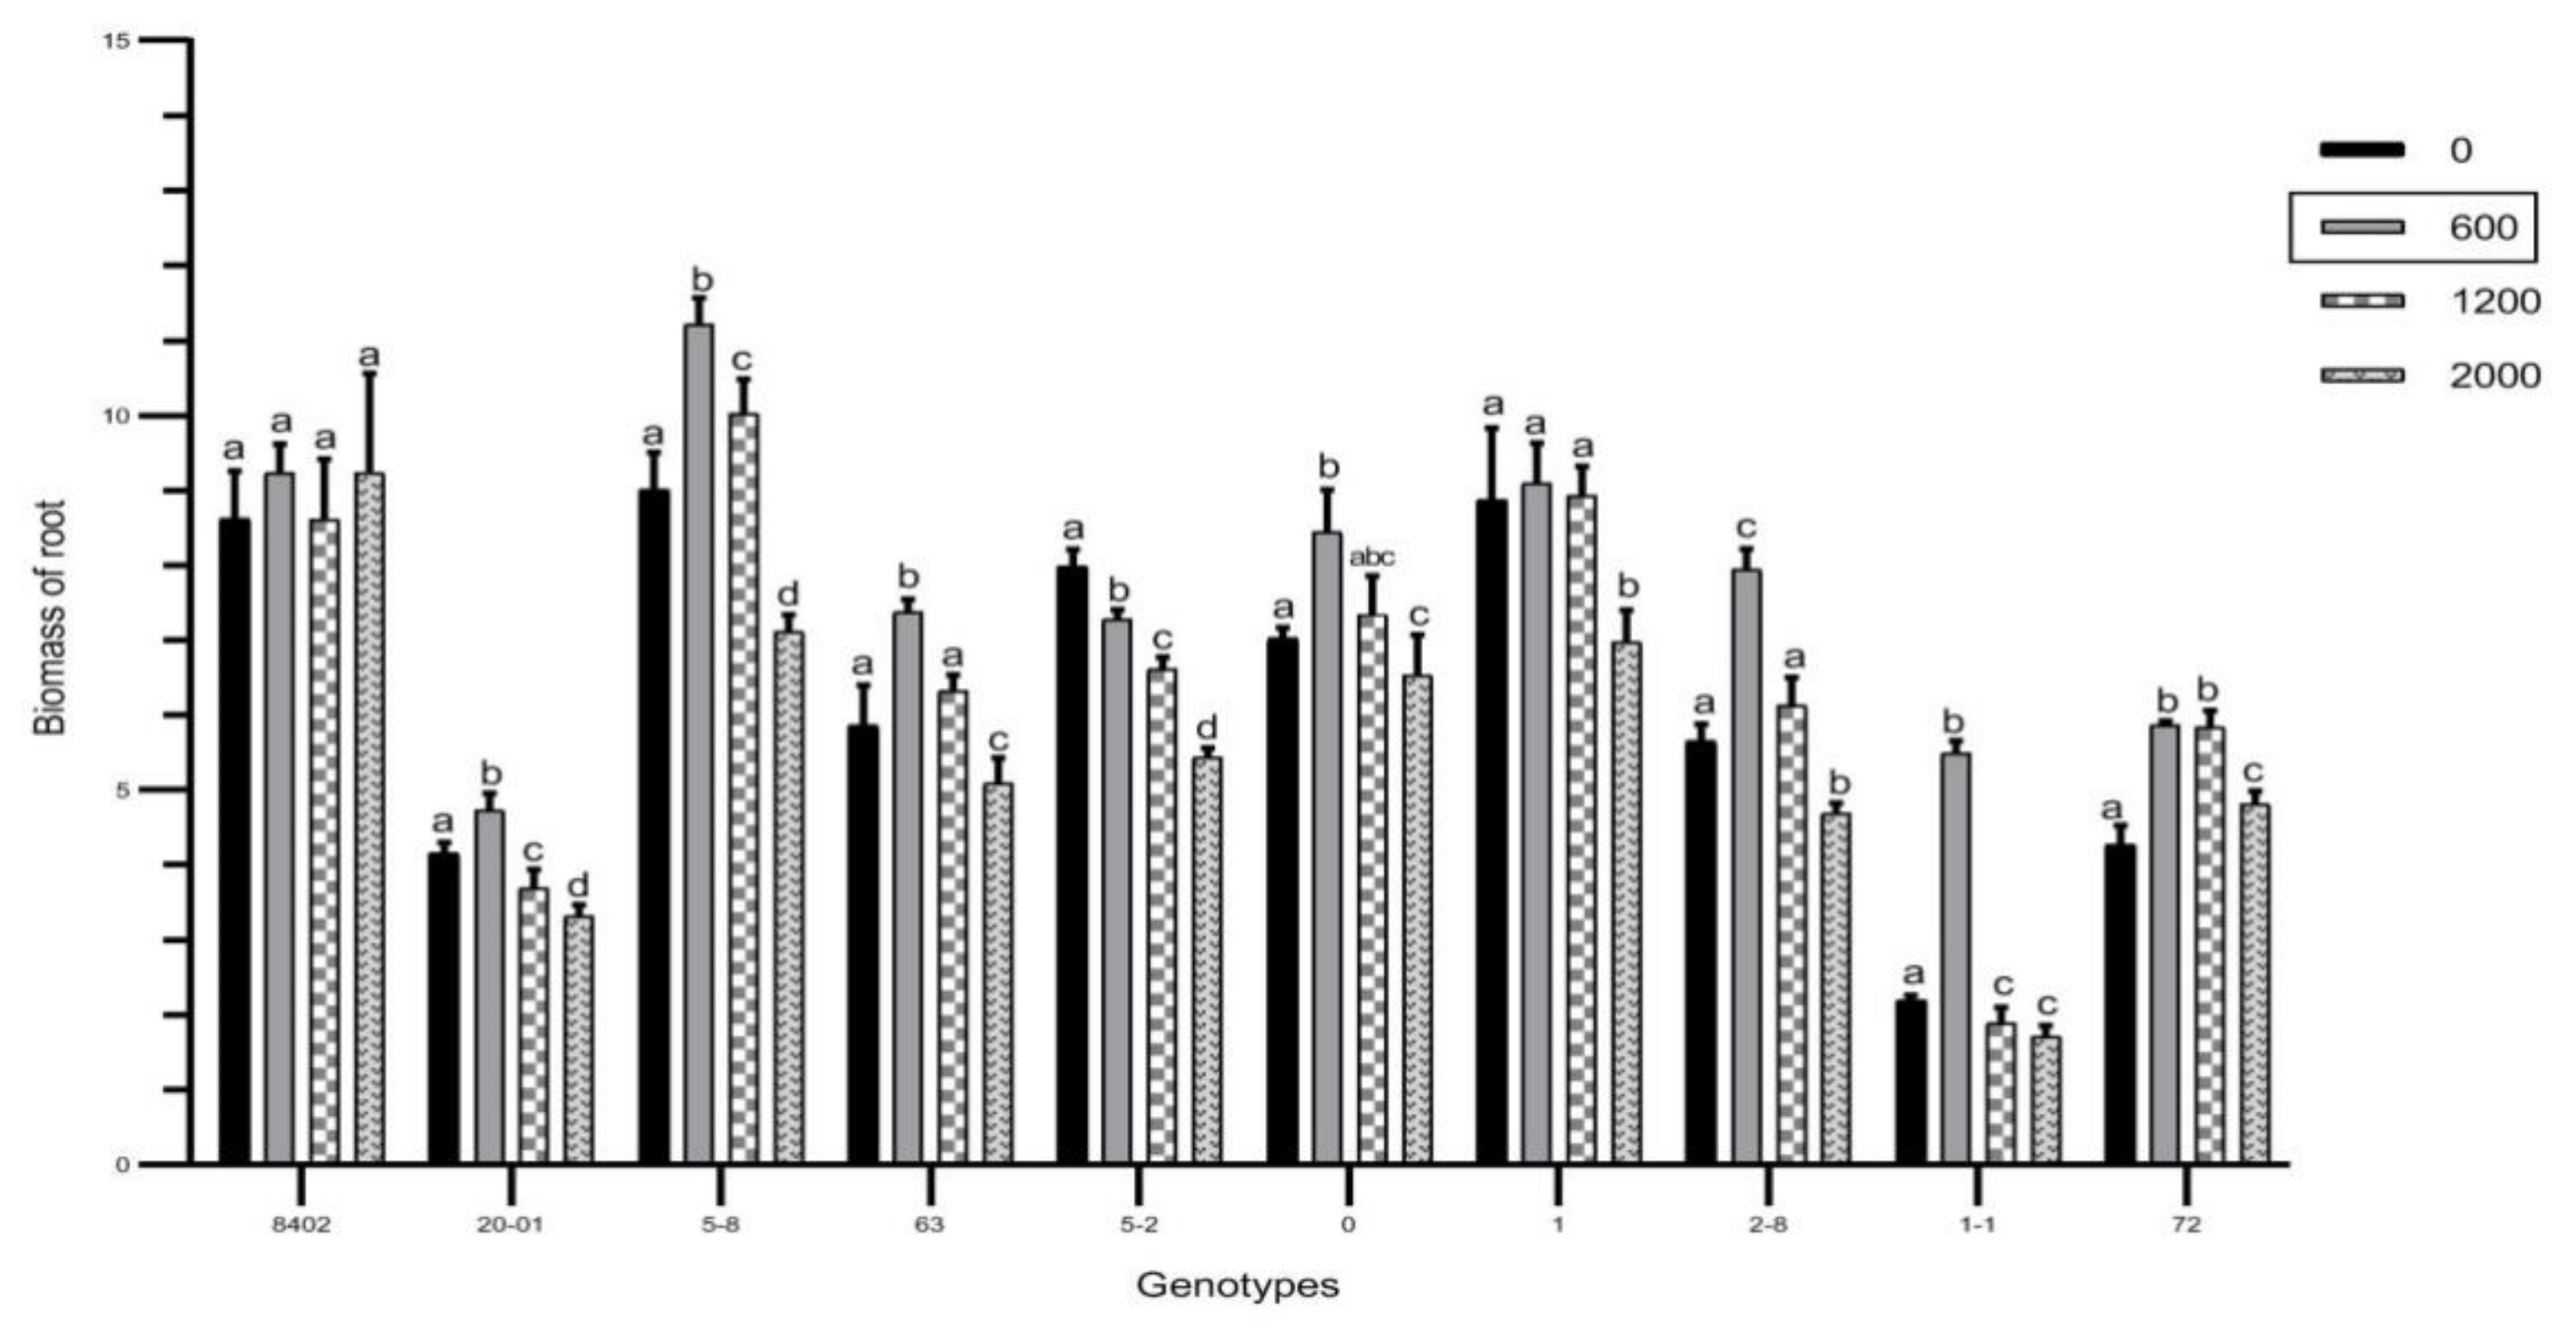
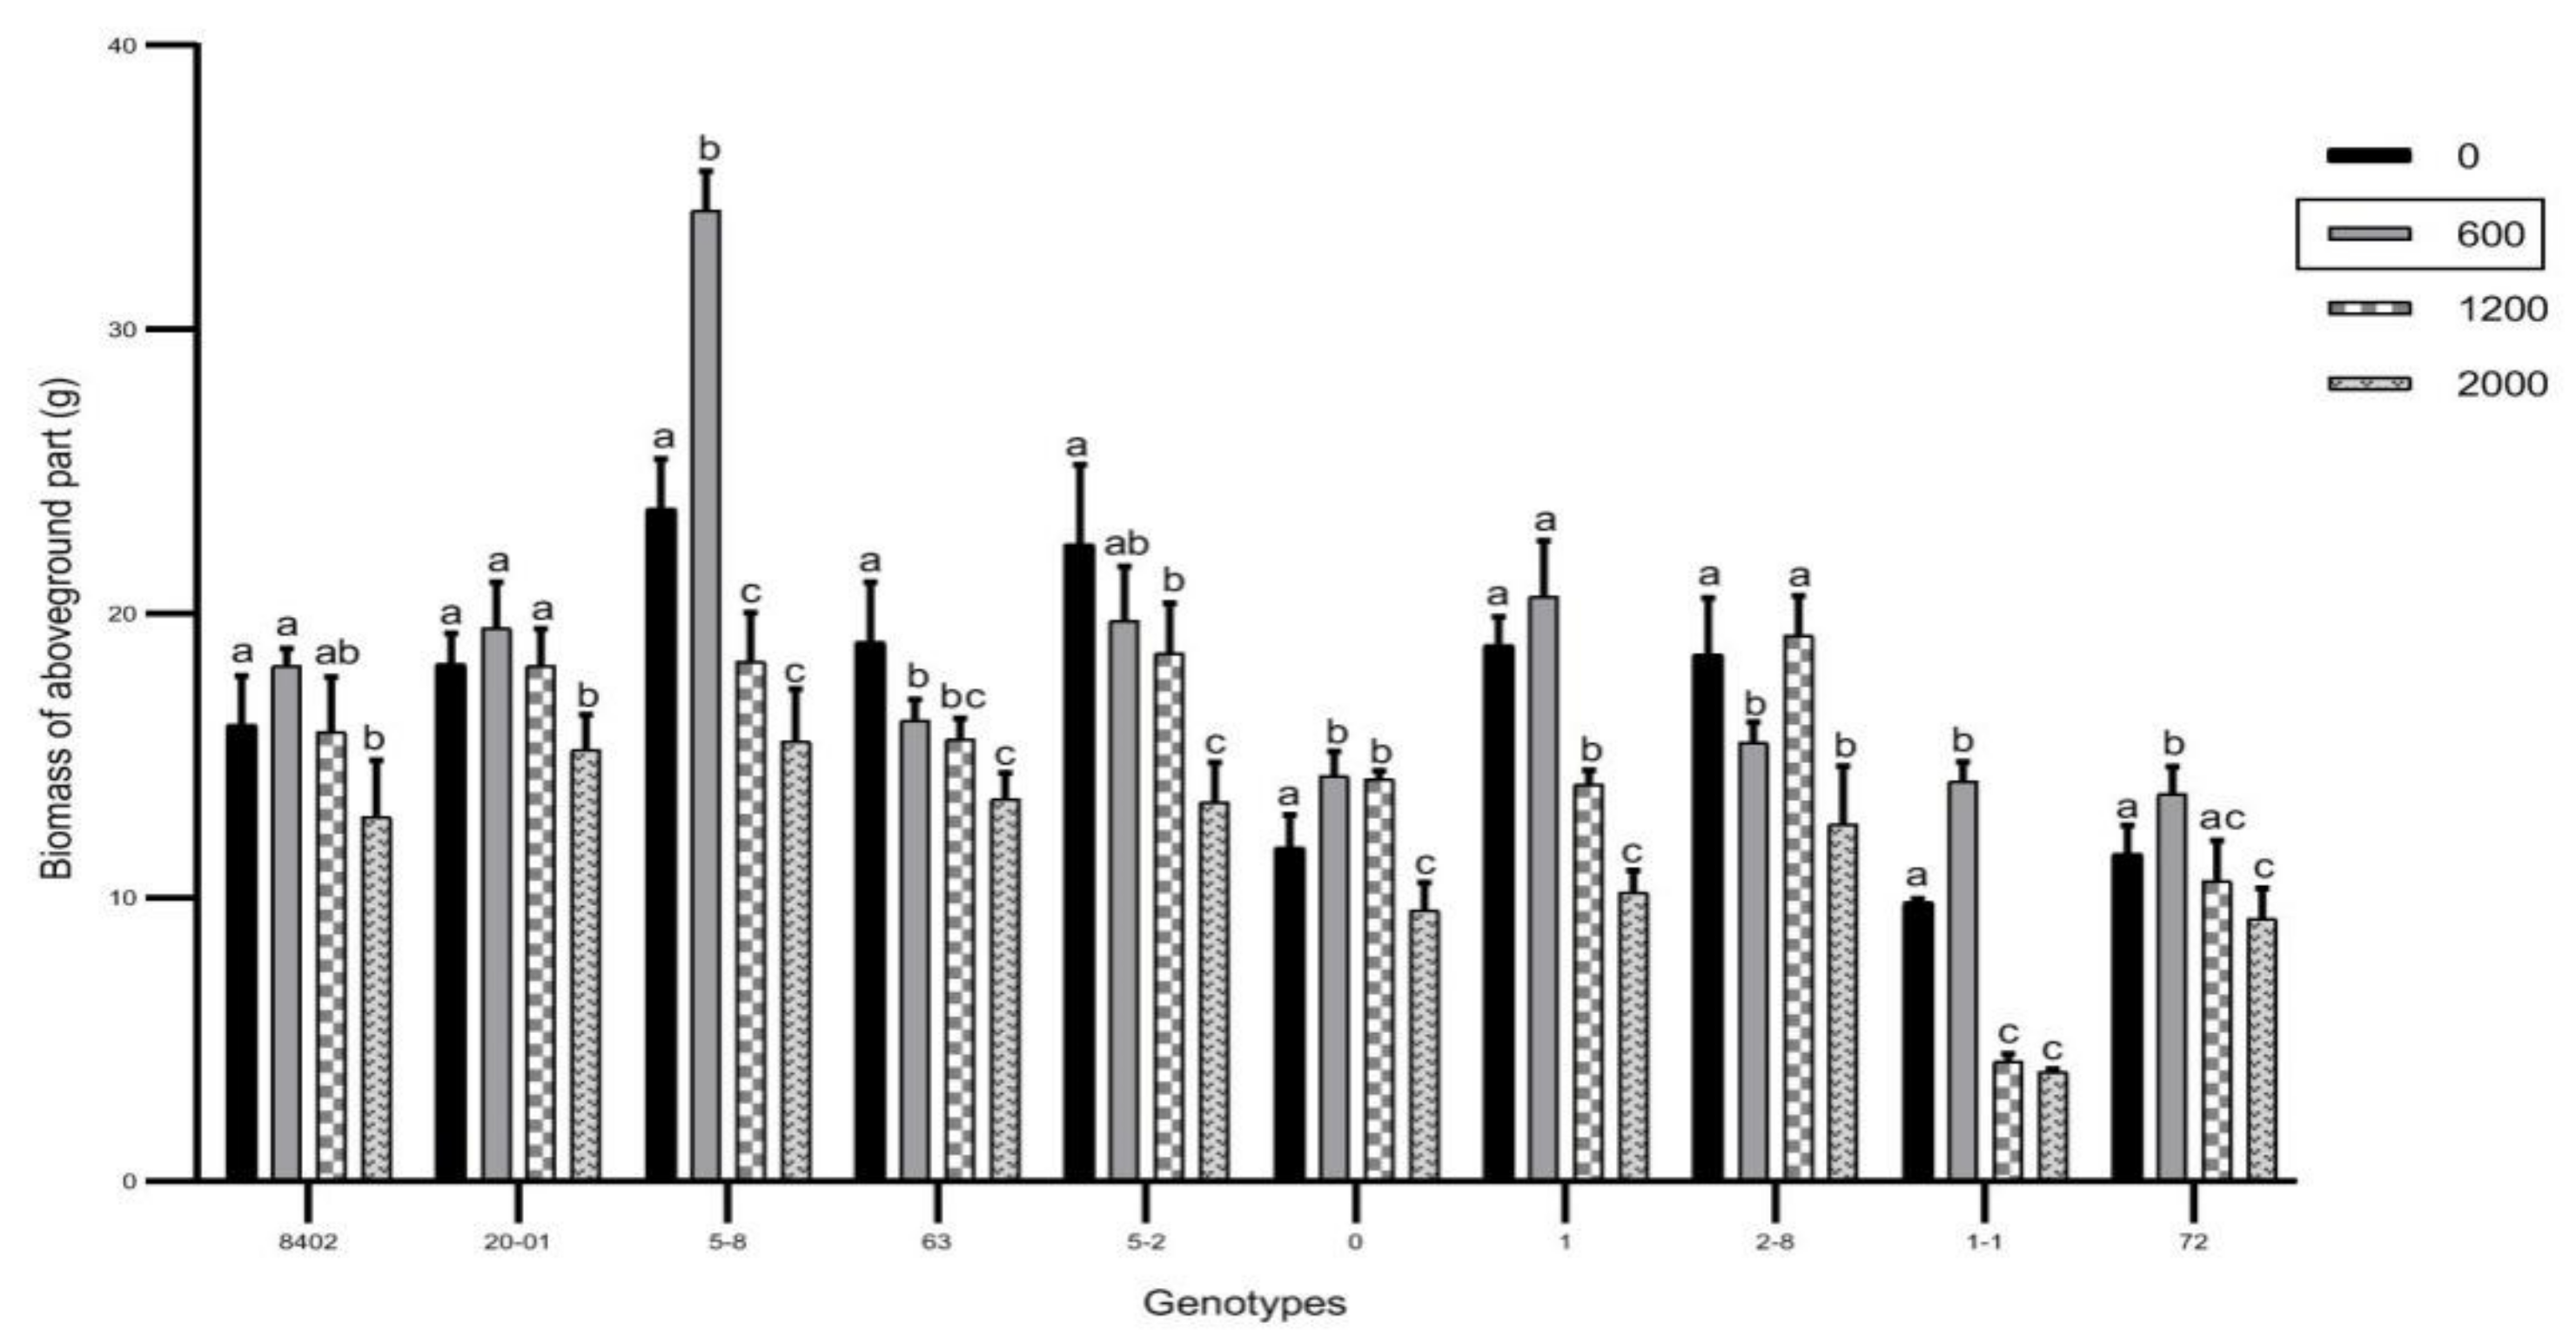
3.2. Effects of Sb on Biomass of C. bungei

We found significant differences between aboveground and root biomasses of genotypes except the root biomass of 8402 under Sb concentration (Figure 3, Figure 4 and Table S2). The root biomass of Genotypes 8402 and 72 was higher in the 2000 mg/kg soil Sb treatment than in control conditions, while other genotypes showed increases in biomass under lower concentrations of Sb, and the biomass then decreased gradually with increasing Sb concentration. Genotype 8402 had the highest root biomass among all genotypes at the highest Sb concentration; the root biomass of 8402 was 197% that of Genotype 1-1. Genotype 5-8 had the highest aboveground biomass of all genotypes at the highest Sb concentration; the aboveground biomass of Genotype 5-8 was 138% that of Genotype 1-1. In all treatments, aboveground biomass was higher than root biomass.

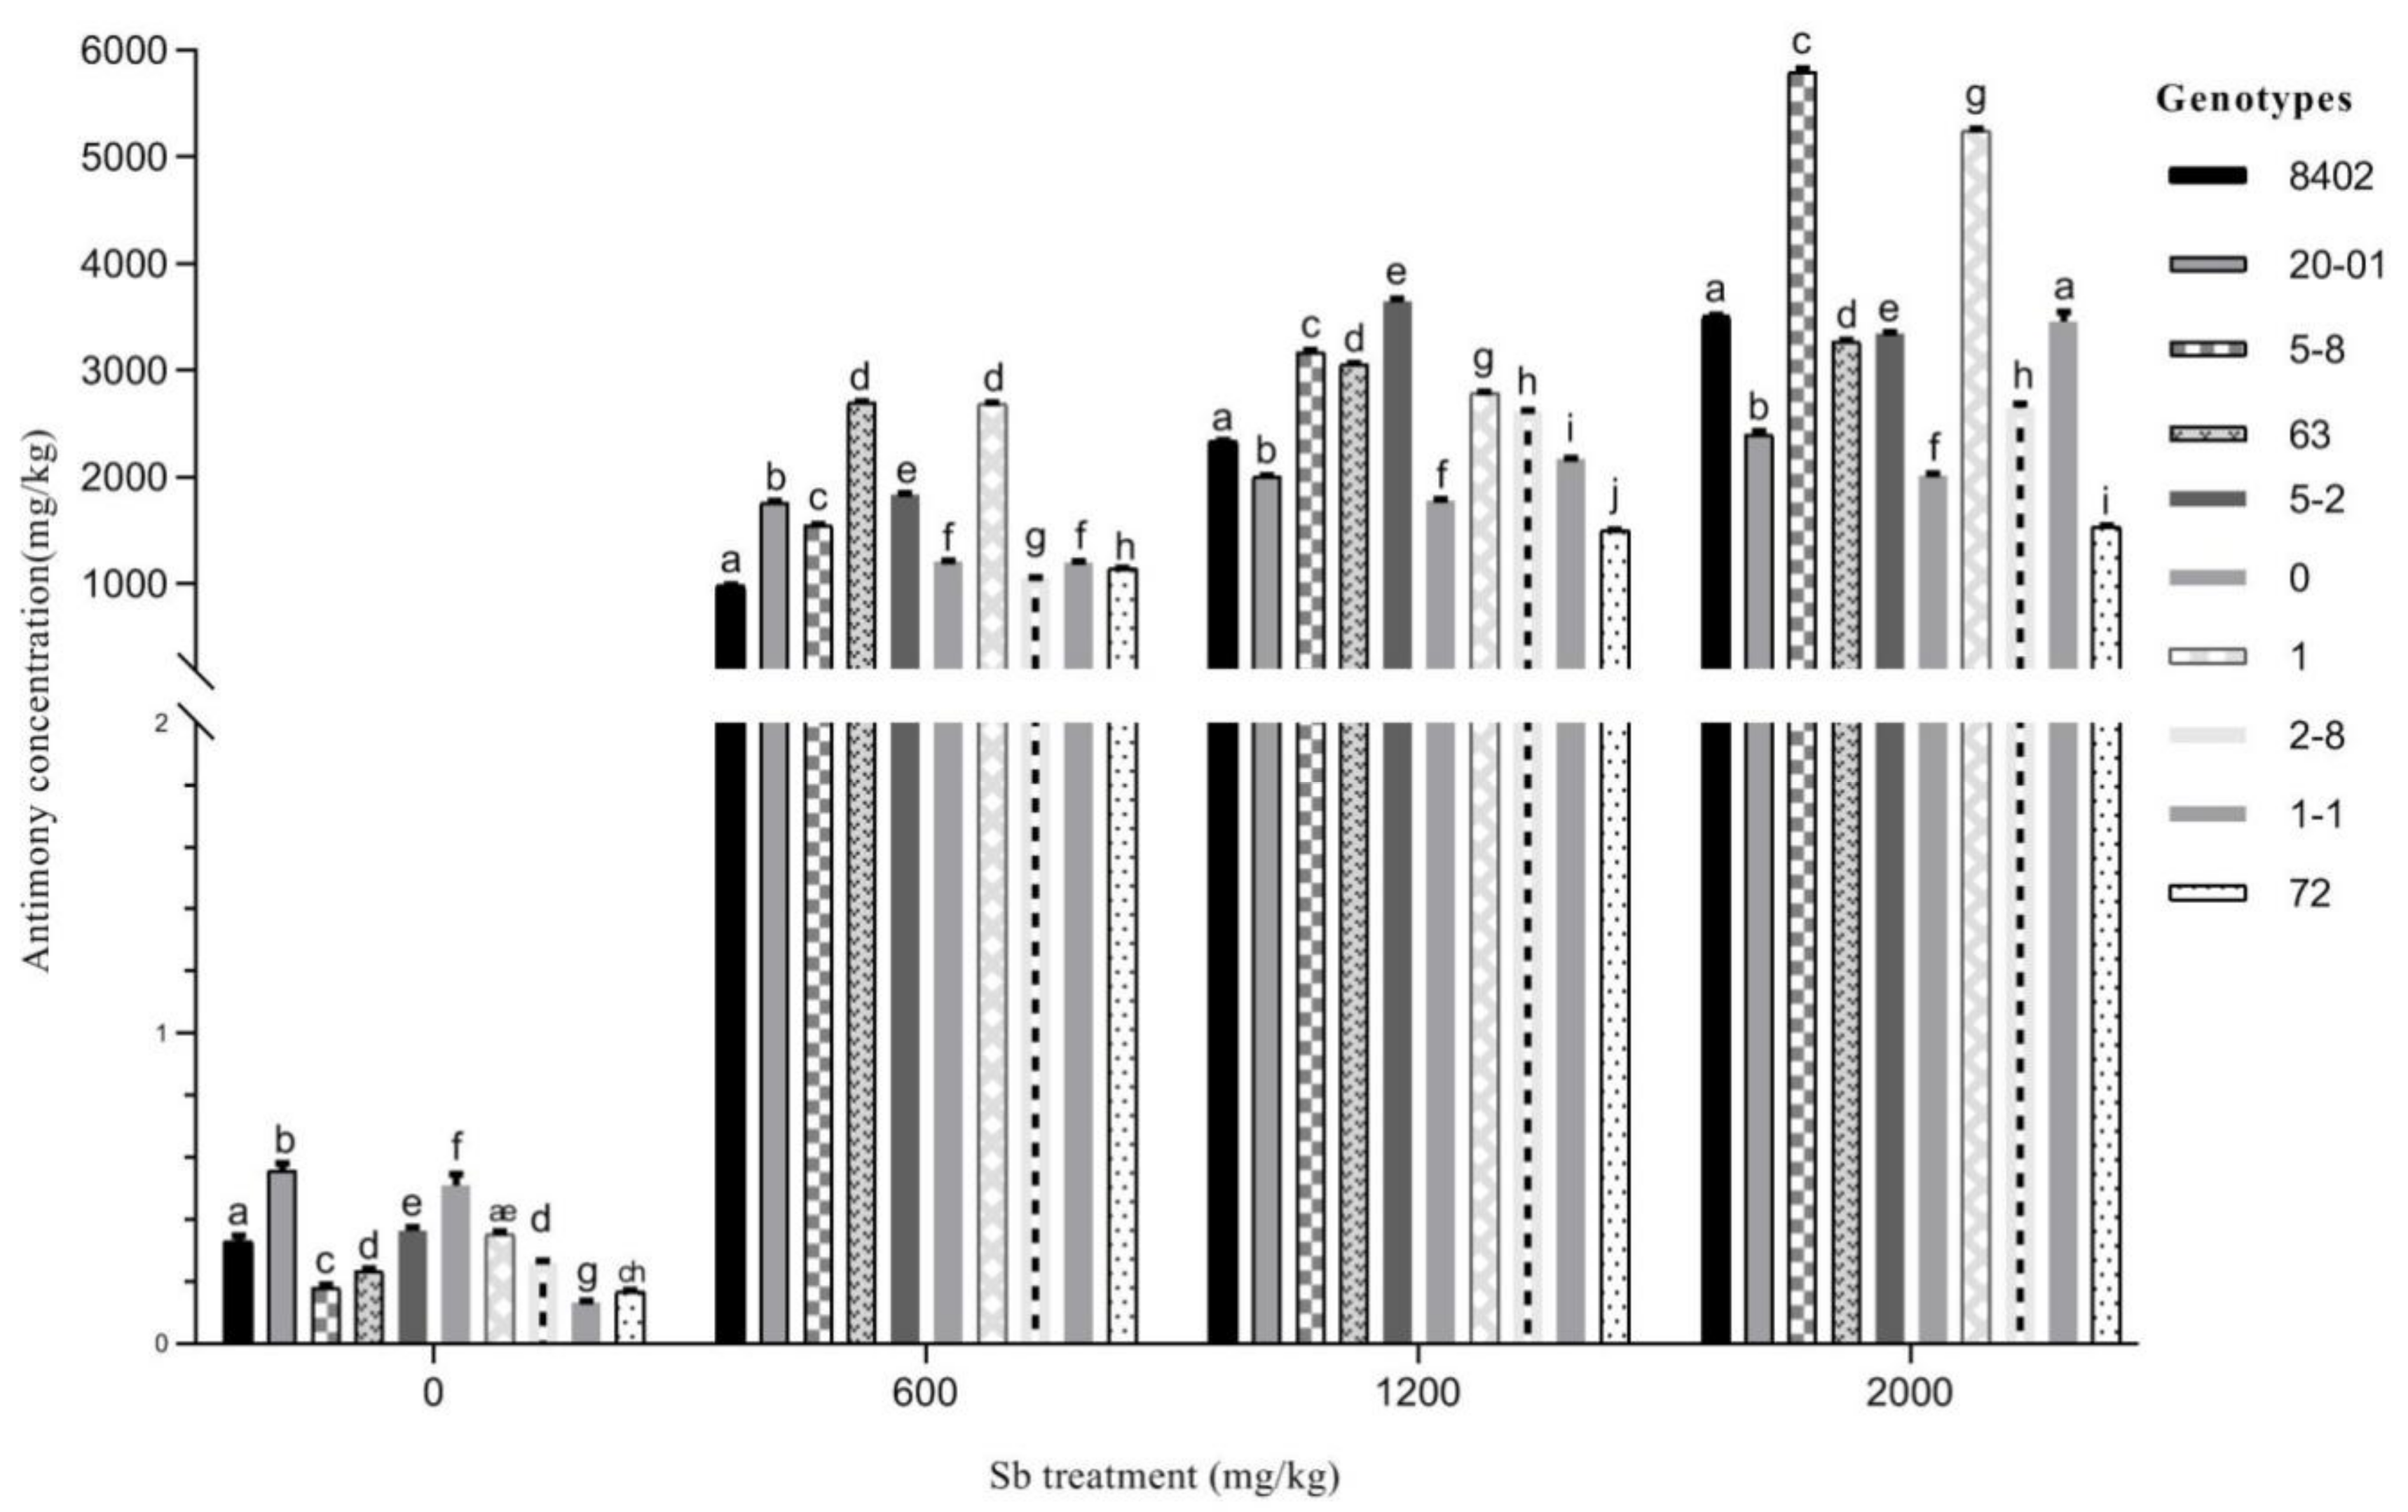
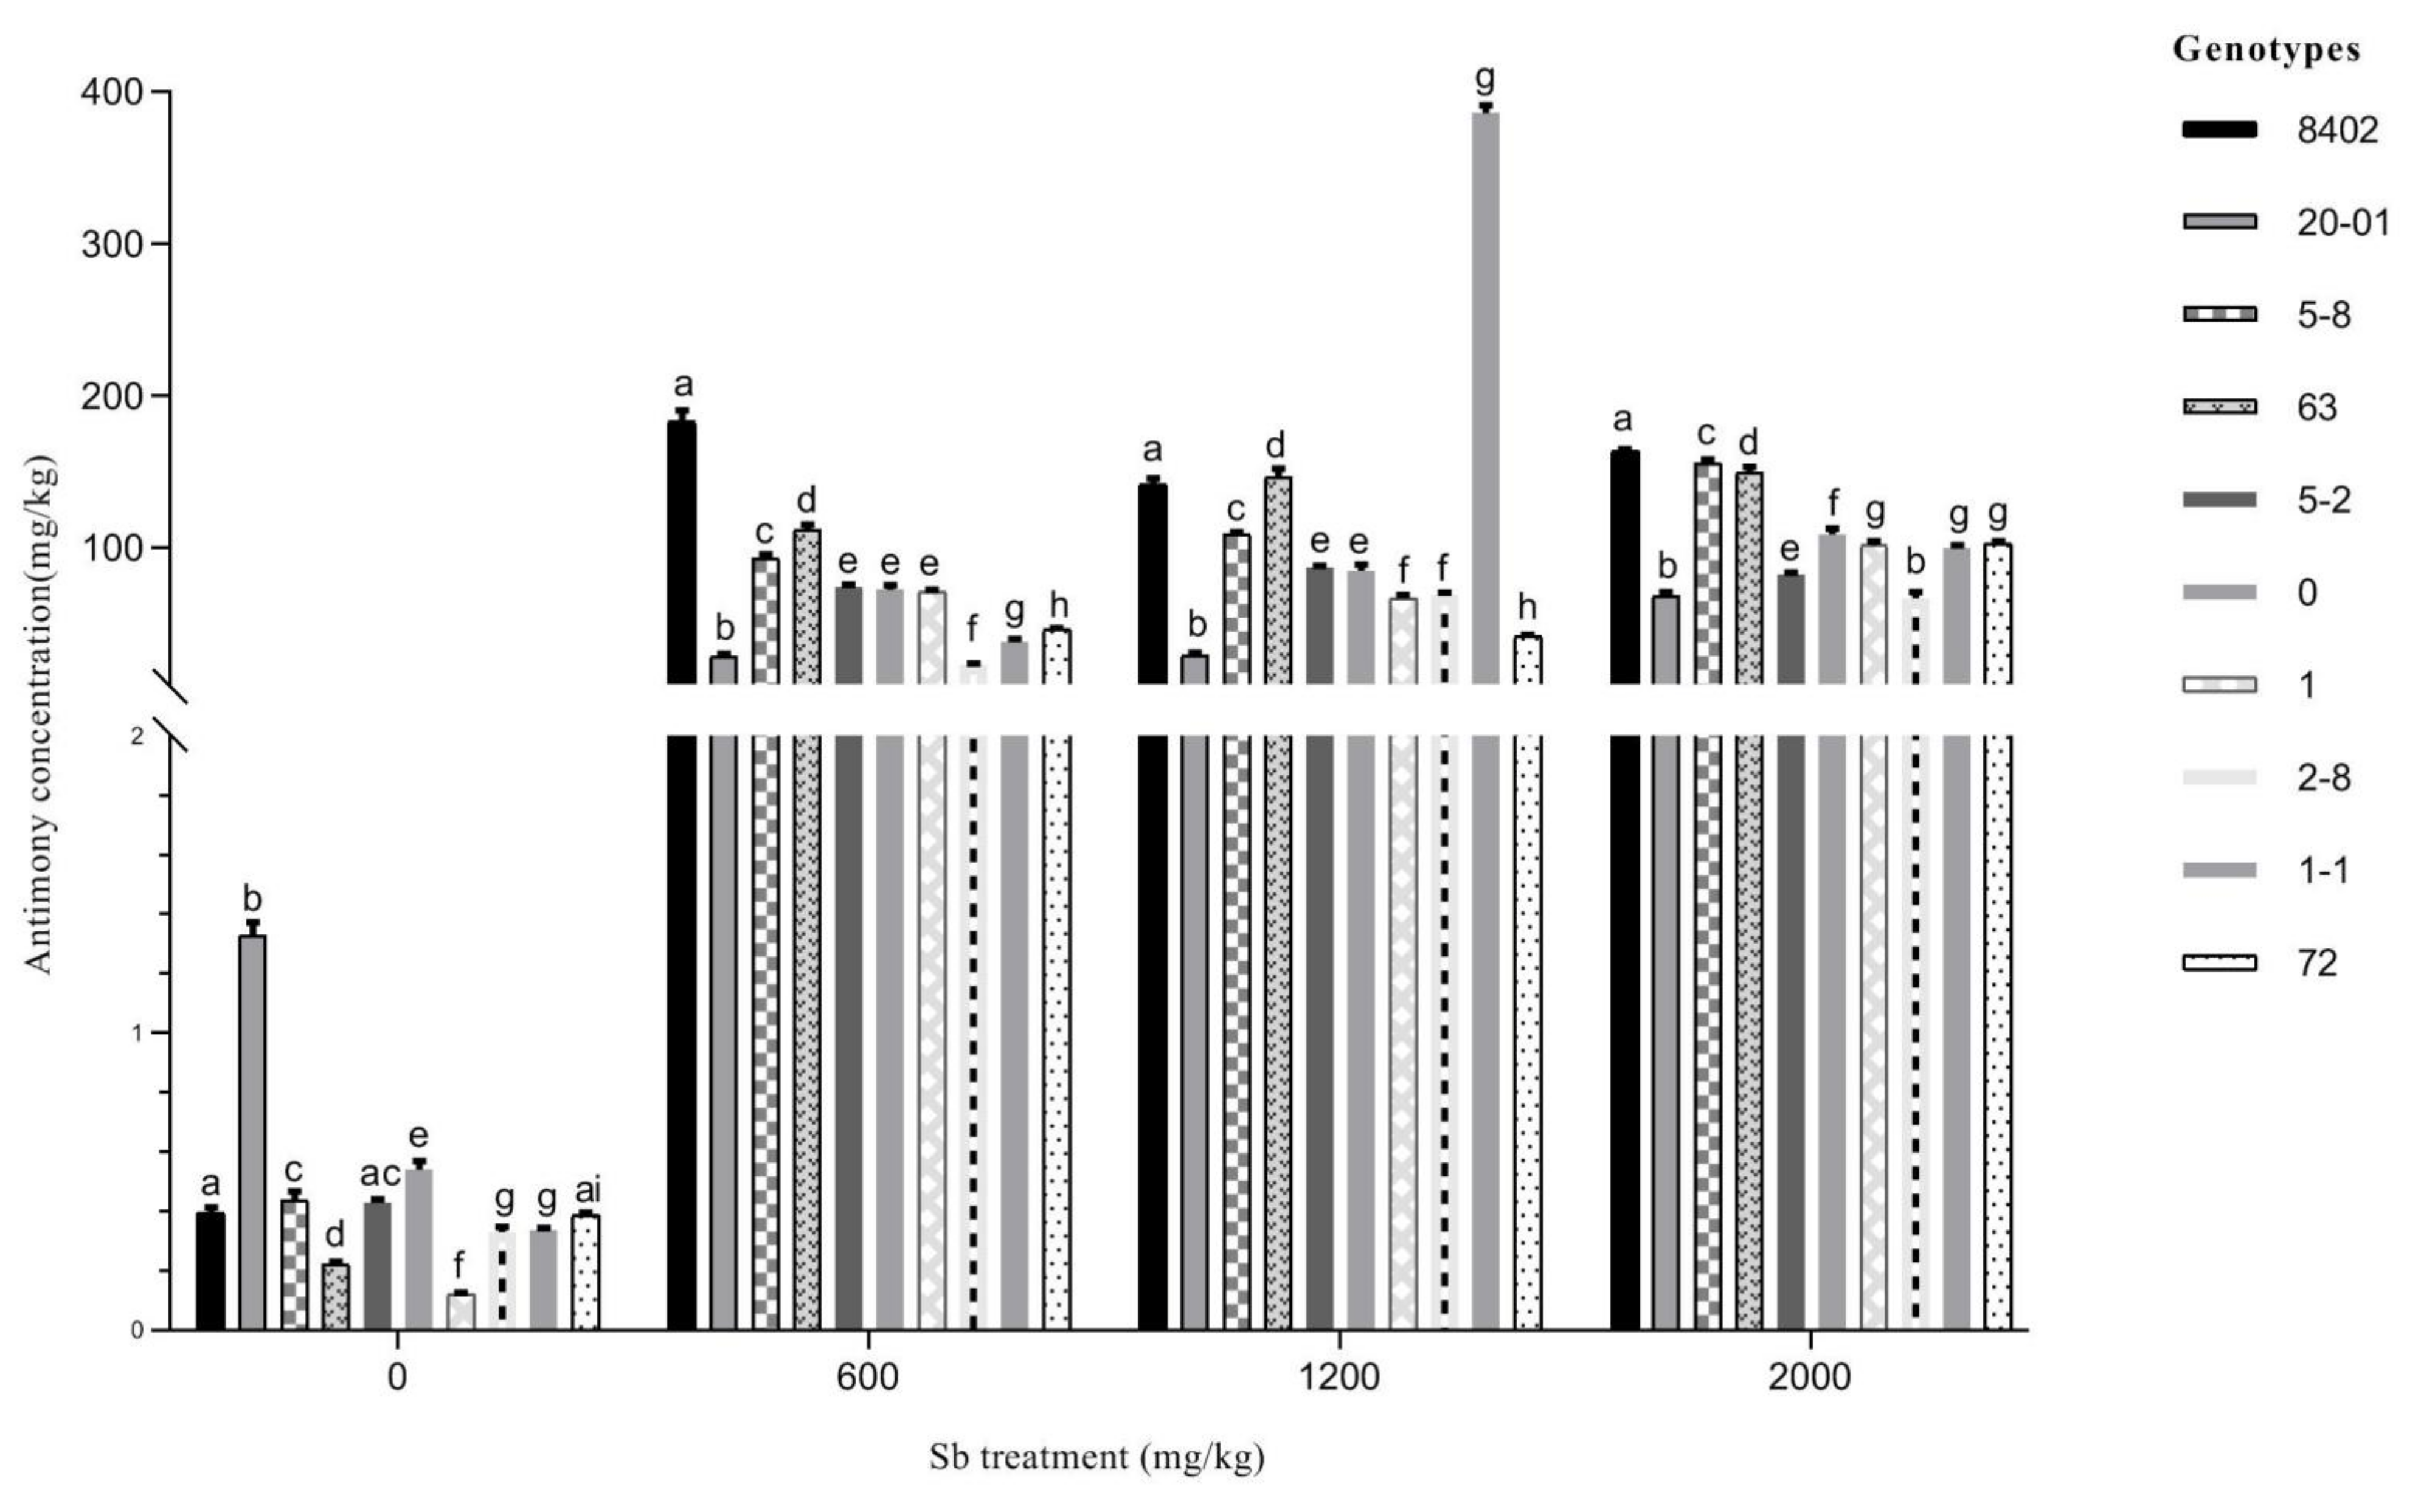
3.3. Sb Concentration in C. bungei

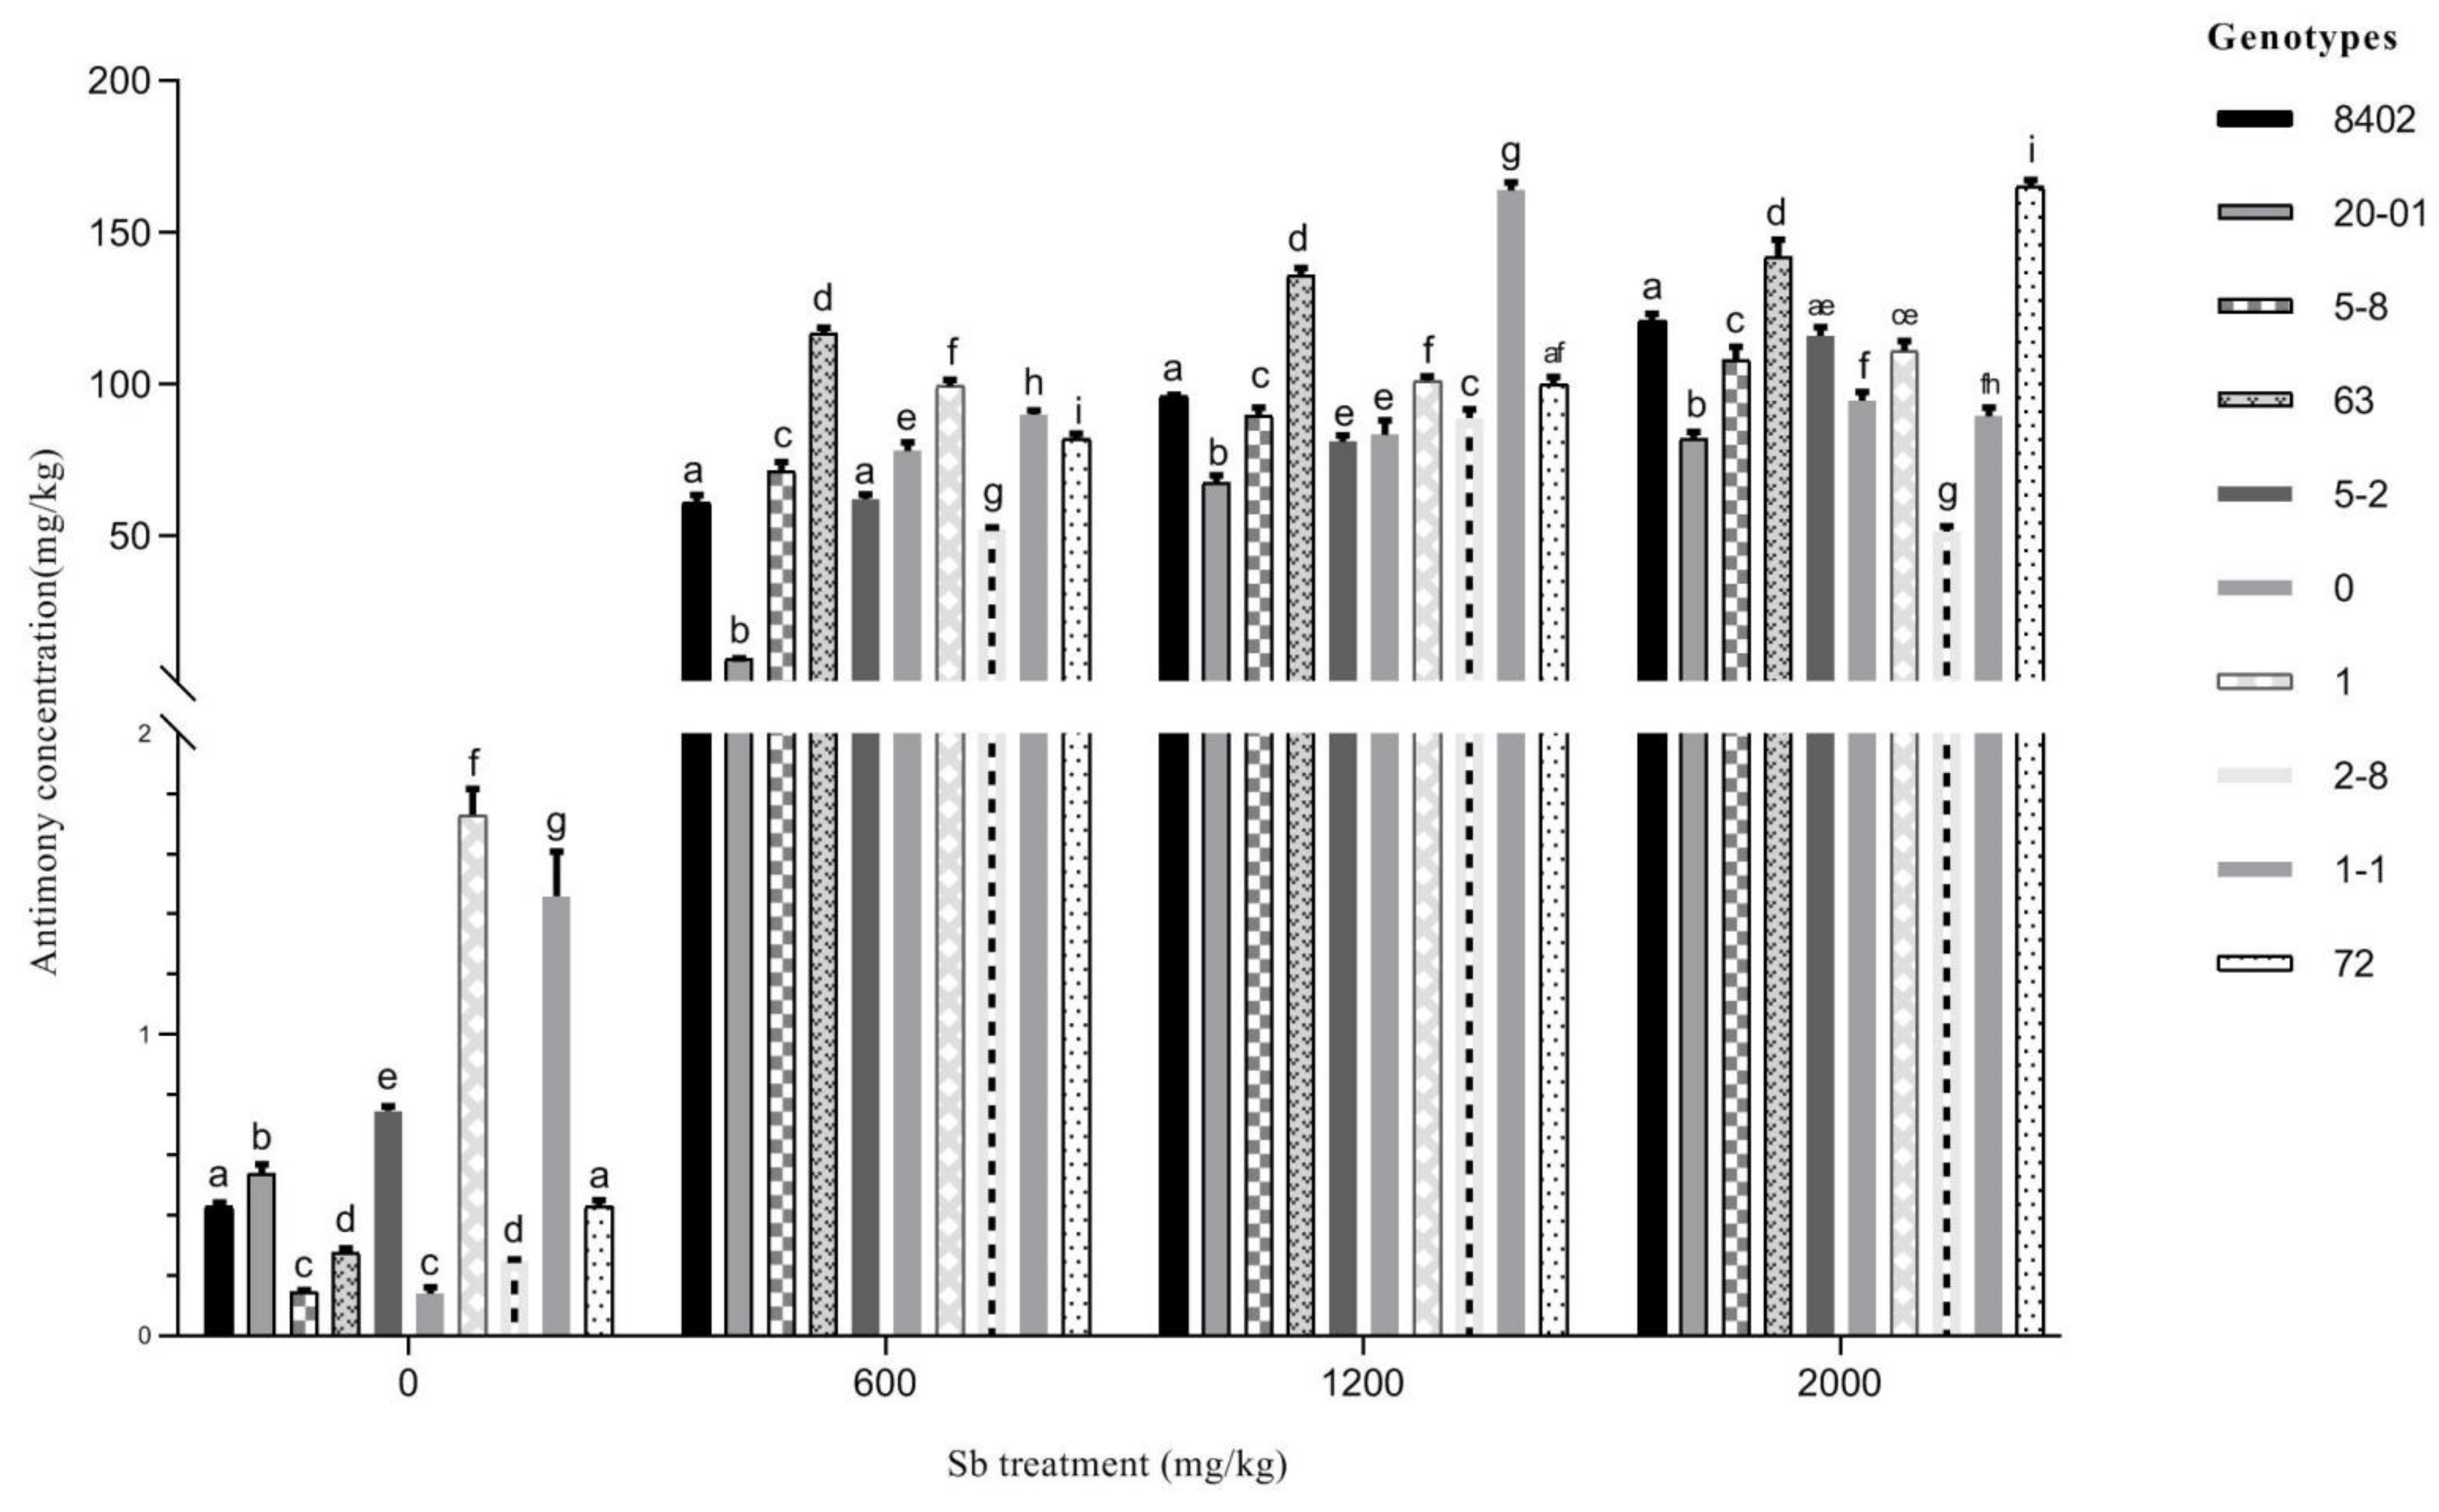
3.3.1. Sb Concentration in Roots of C. bungei

Sb mainly accumulated in the roots of C. bungei, and the absorption of Sb differed between genotypes and at different Sb concentrations (Figure 5). At 600 mg Sb/kg soil, the root Sb concentration of Genotype 63 was three times that in Genotype 8402, which had the lowest Sb concentration. At 1200 mg Sb/kg soil, the Sb concentration was highest in the roots of Genotype 5-2 and lowest in the roots of Genotype 72. At 2000 mg Sb/kg soil, the Sb concentration was highest in the roots of Genotype 5-8 and lowest in the roots of Genotype 72.

3.3.2. Sb Concentration in Stems of C. bungei

Stems play an important role in transporting Sb from roots to leaves. We found that the Sb concentration in stems was much lower than that in roots (Figure 6). At 600 mg Sb/kg soil, the stem Sb concentration was highest in Genotype 8402 and lowest in Genotype 2-8. At 1200 mg Sb/kg soil, the stem Sb concentration was highest in Genotype 1-1 and lowest in Genotype 20-01. At 2000 mg Sb/kg soil, the stem Sb concentration was highest in Genotype 8402 and lowest in Genotype 2-8. There were significant differences in the stem Sb concentration between most genotypes and at different Sb concentrations. For Genotypes 5-8, 0, and 63, the Sb concentration in stems increased with increasing Sb concentration in the soil. For Genotypes 2-8, 5-2, and 1-1, the Sb concentration in stems first increased and then decreased with increasing soil Sb concentration.

3.3.3. Sb Concentration in Leaves of C. bungei

For the invested genotypes except for 1-1 and 2-8, the Sb concentration in leaves initially increased and then decreased as the soil Sb concentration increased. Significant differences in leaf Sb concentrations were observed in most genotypes at a given Sb concentration (Figure 7). At 600 mg Sb/kg soil, the Sb concentration in leaves of Genotype 63 was 12.4 times that in Genotype 20-01. At 1200 mg Sb/kg soil, the Sb concentration in leaves of Genotype 1-1 was significantly higher than that in the other genotypes. At 2000 mg Sb/kg soil, the Sb concentration was highest in the leaves of Genotype 72 and lowest in the leaves of Genotype 2-8. Sb concentrations in the leaves of the other genotypes ranged from 82.2 to 136.0 mg/kg.

3.3.4. Evaluation of the Remediation Potential of C. bungei

BCF and TF are effective indexes to evaluate the ability of plants to absorb and transport heavy metals. Generally, BCF or TF values <1 indicate that plants are not suitable for heavy metal extraction [28]. Under different concentrations of Sb, the Sb BCFs of roots of all the C. bungei genotypes tested in this study were >1 (Figure 8). At 600 mg Sb/kg soil, Genotype 63 had the highest BCF, and Genotype 8402 had the lowest. The BCFs of Genotypes 20-01, 5-8, 5-2, and 1-1 were all >2. These results indicate that the 10 genotypes of C. bungei could be used for fixing Sb from contaminated soil. The TFs of Sb between roots and stems were <0.2 for all genotypes, and most were <0.1 (Figure 9). This may be because most Sb accumulates in the root and the upward transport is poor, or because the stem only acts as intermediate tissue for Sb transport, with Sb accumulating in leaves rather than remaining in the stem. The TFs of Sb between stems and leaves of Genotypes 8402 and 5-8 were <1 at multiple Sb concentrations (Figure 10). At 600 mg Sb/kg soil, the stem–leaf TFs of Genotypes 0, 2-8, 72, 1, 1-1, and 63 were >1, and the stem–leaf TFs of Genotypes 1-1 and 2-8 were >2, indicating that the Sb concentration was greater in the leaves than in the stems of these genotypes. At 1200 mg Sb/kg soil, the stem–leaf TFs of Genotypes 20-01, 2-8, 72, and 1 were 2.26, 1.29, 2.40, and 1.51, respectively. At 2000 mg Sb/kg soil, the stem–leaf TFs of Genotypes 20-01, 5-2, 1, and 72 were all >1. The TFs of Sb in stems and leaves of Genotypes 1 and 72 were >1 at all Sb concentrations.

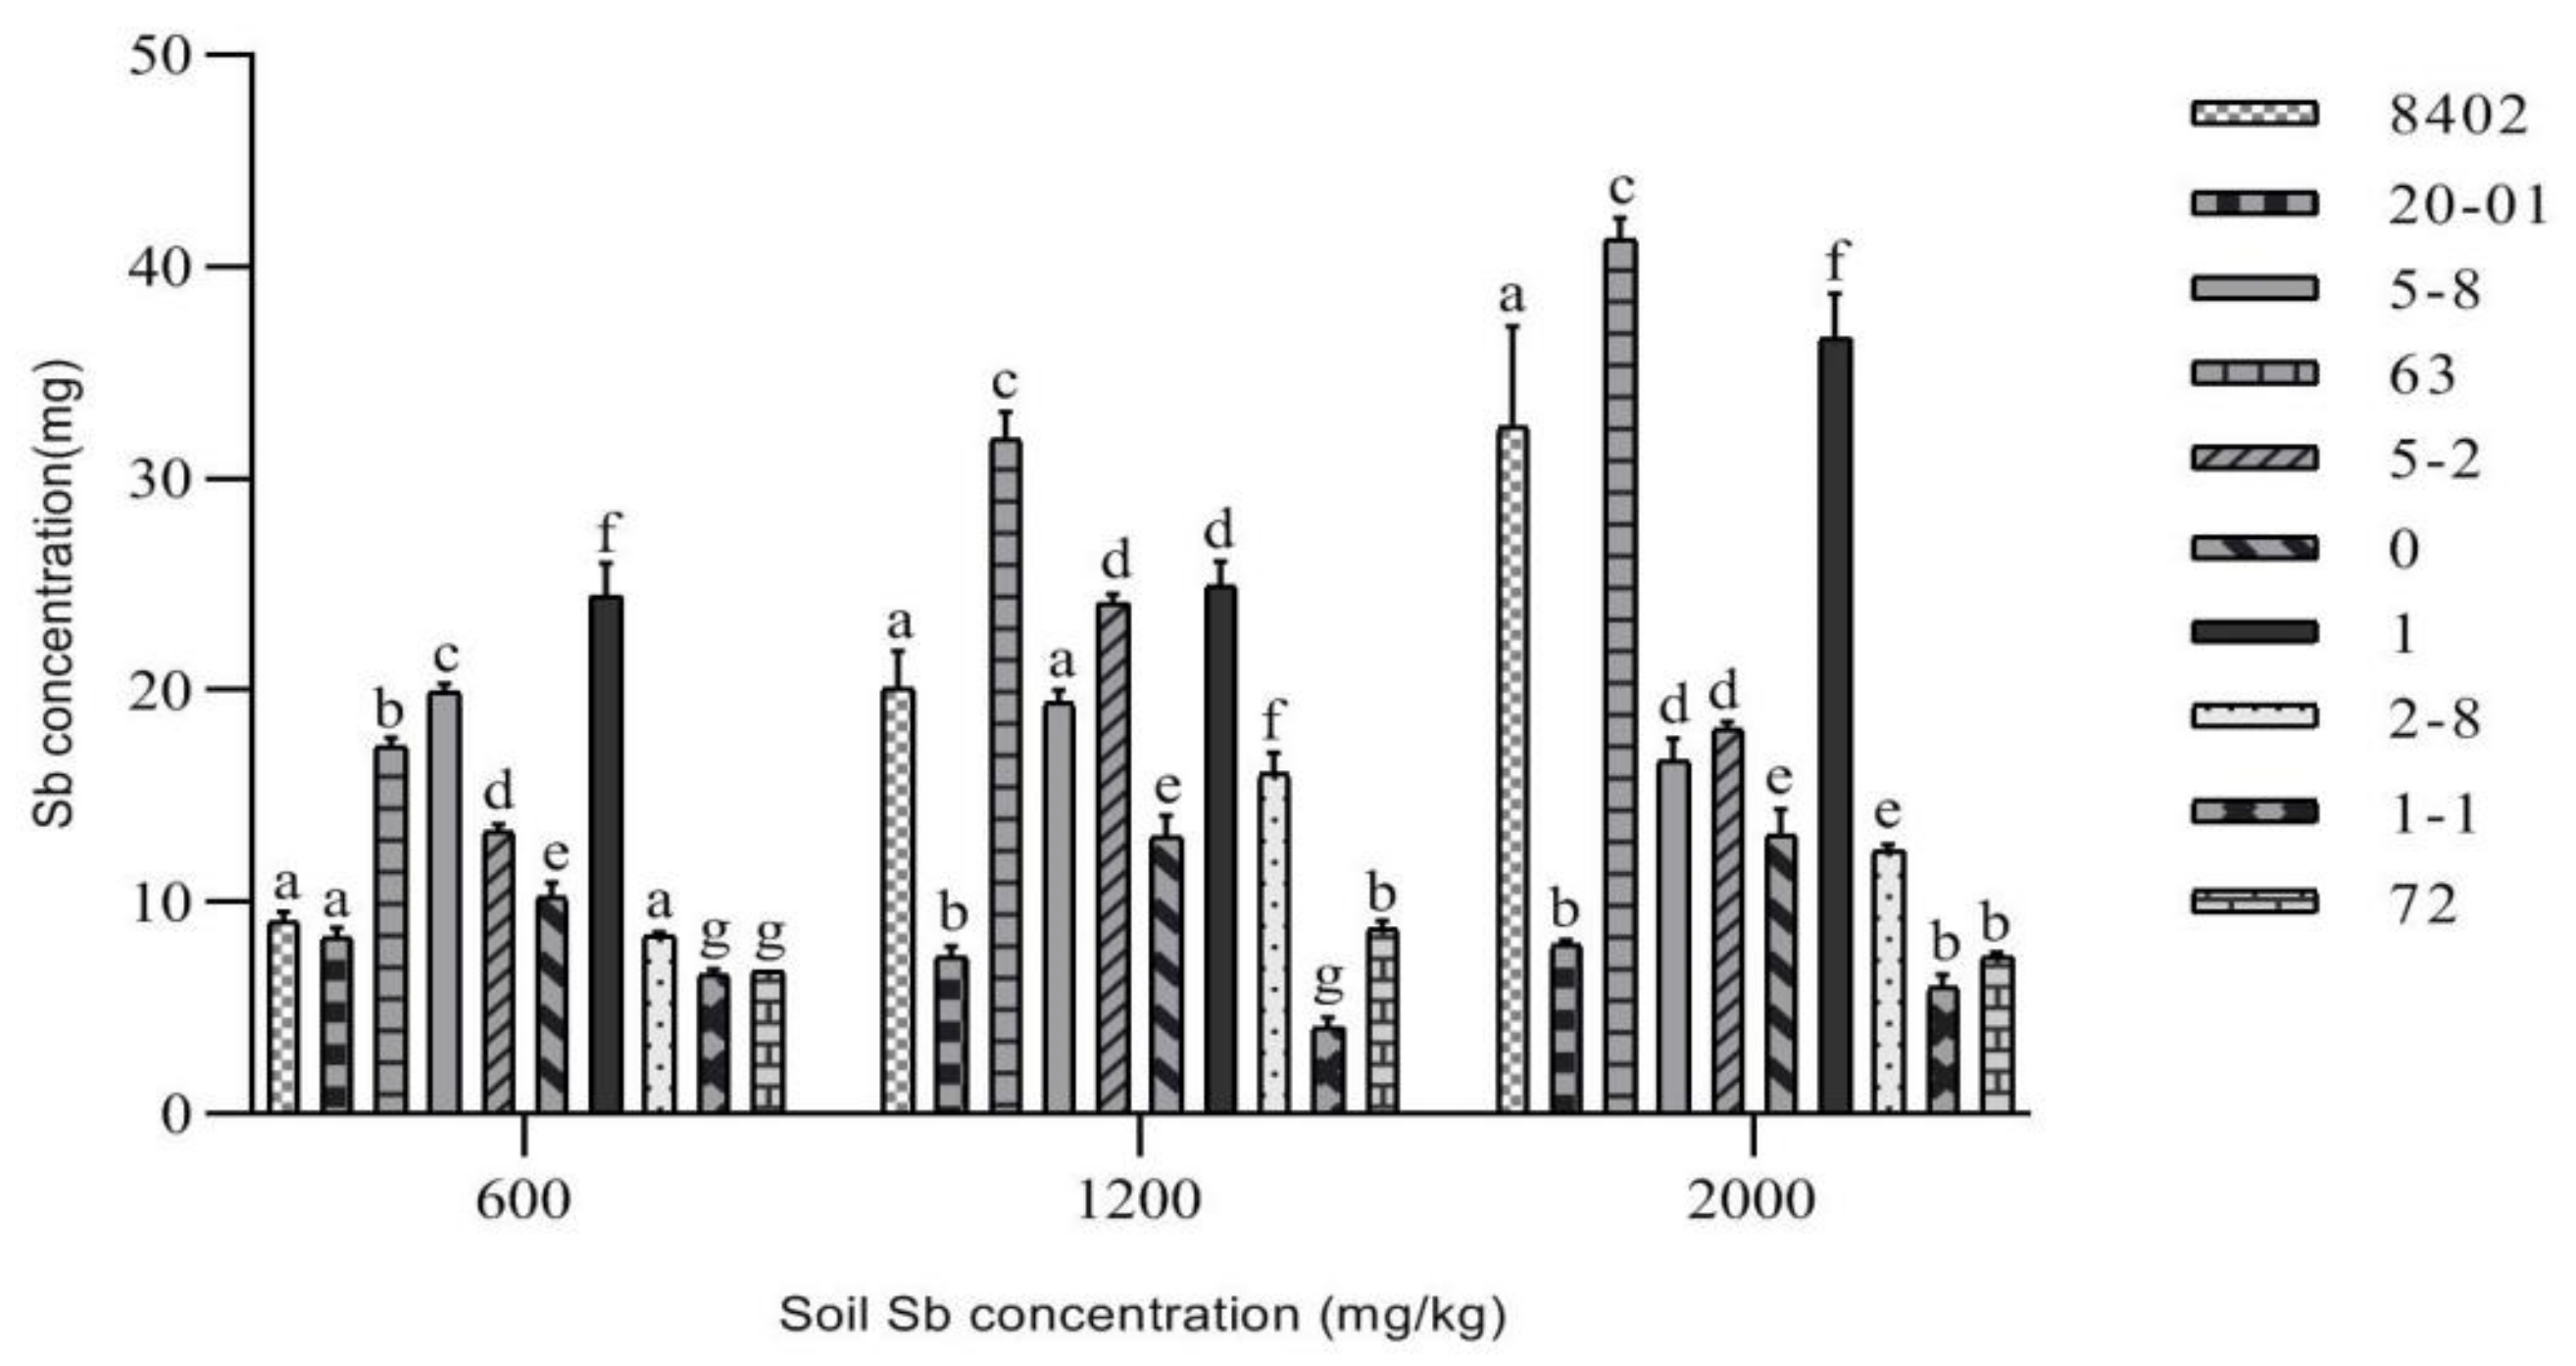
3.4. Root Sb Accumulation in 10 C. bungei Genotypes by Sb Concentration
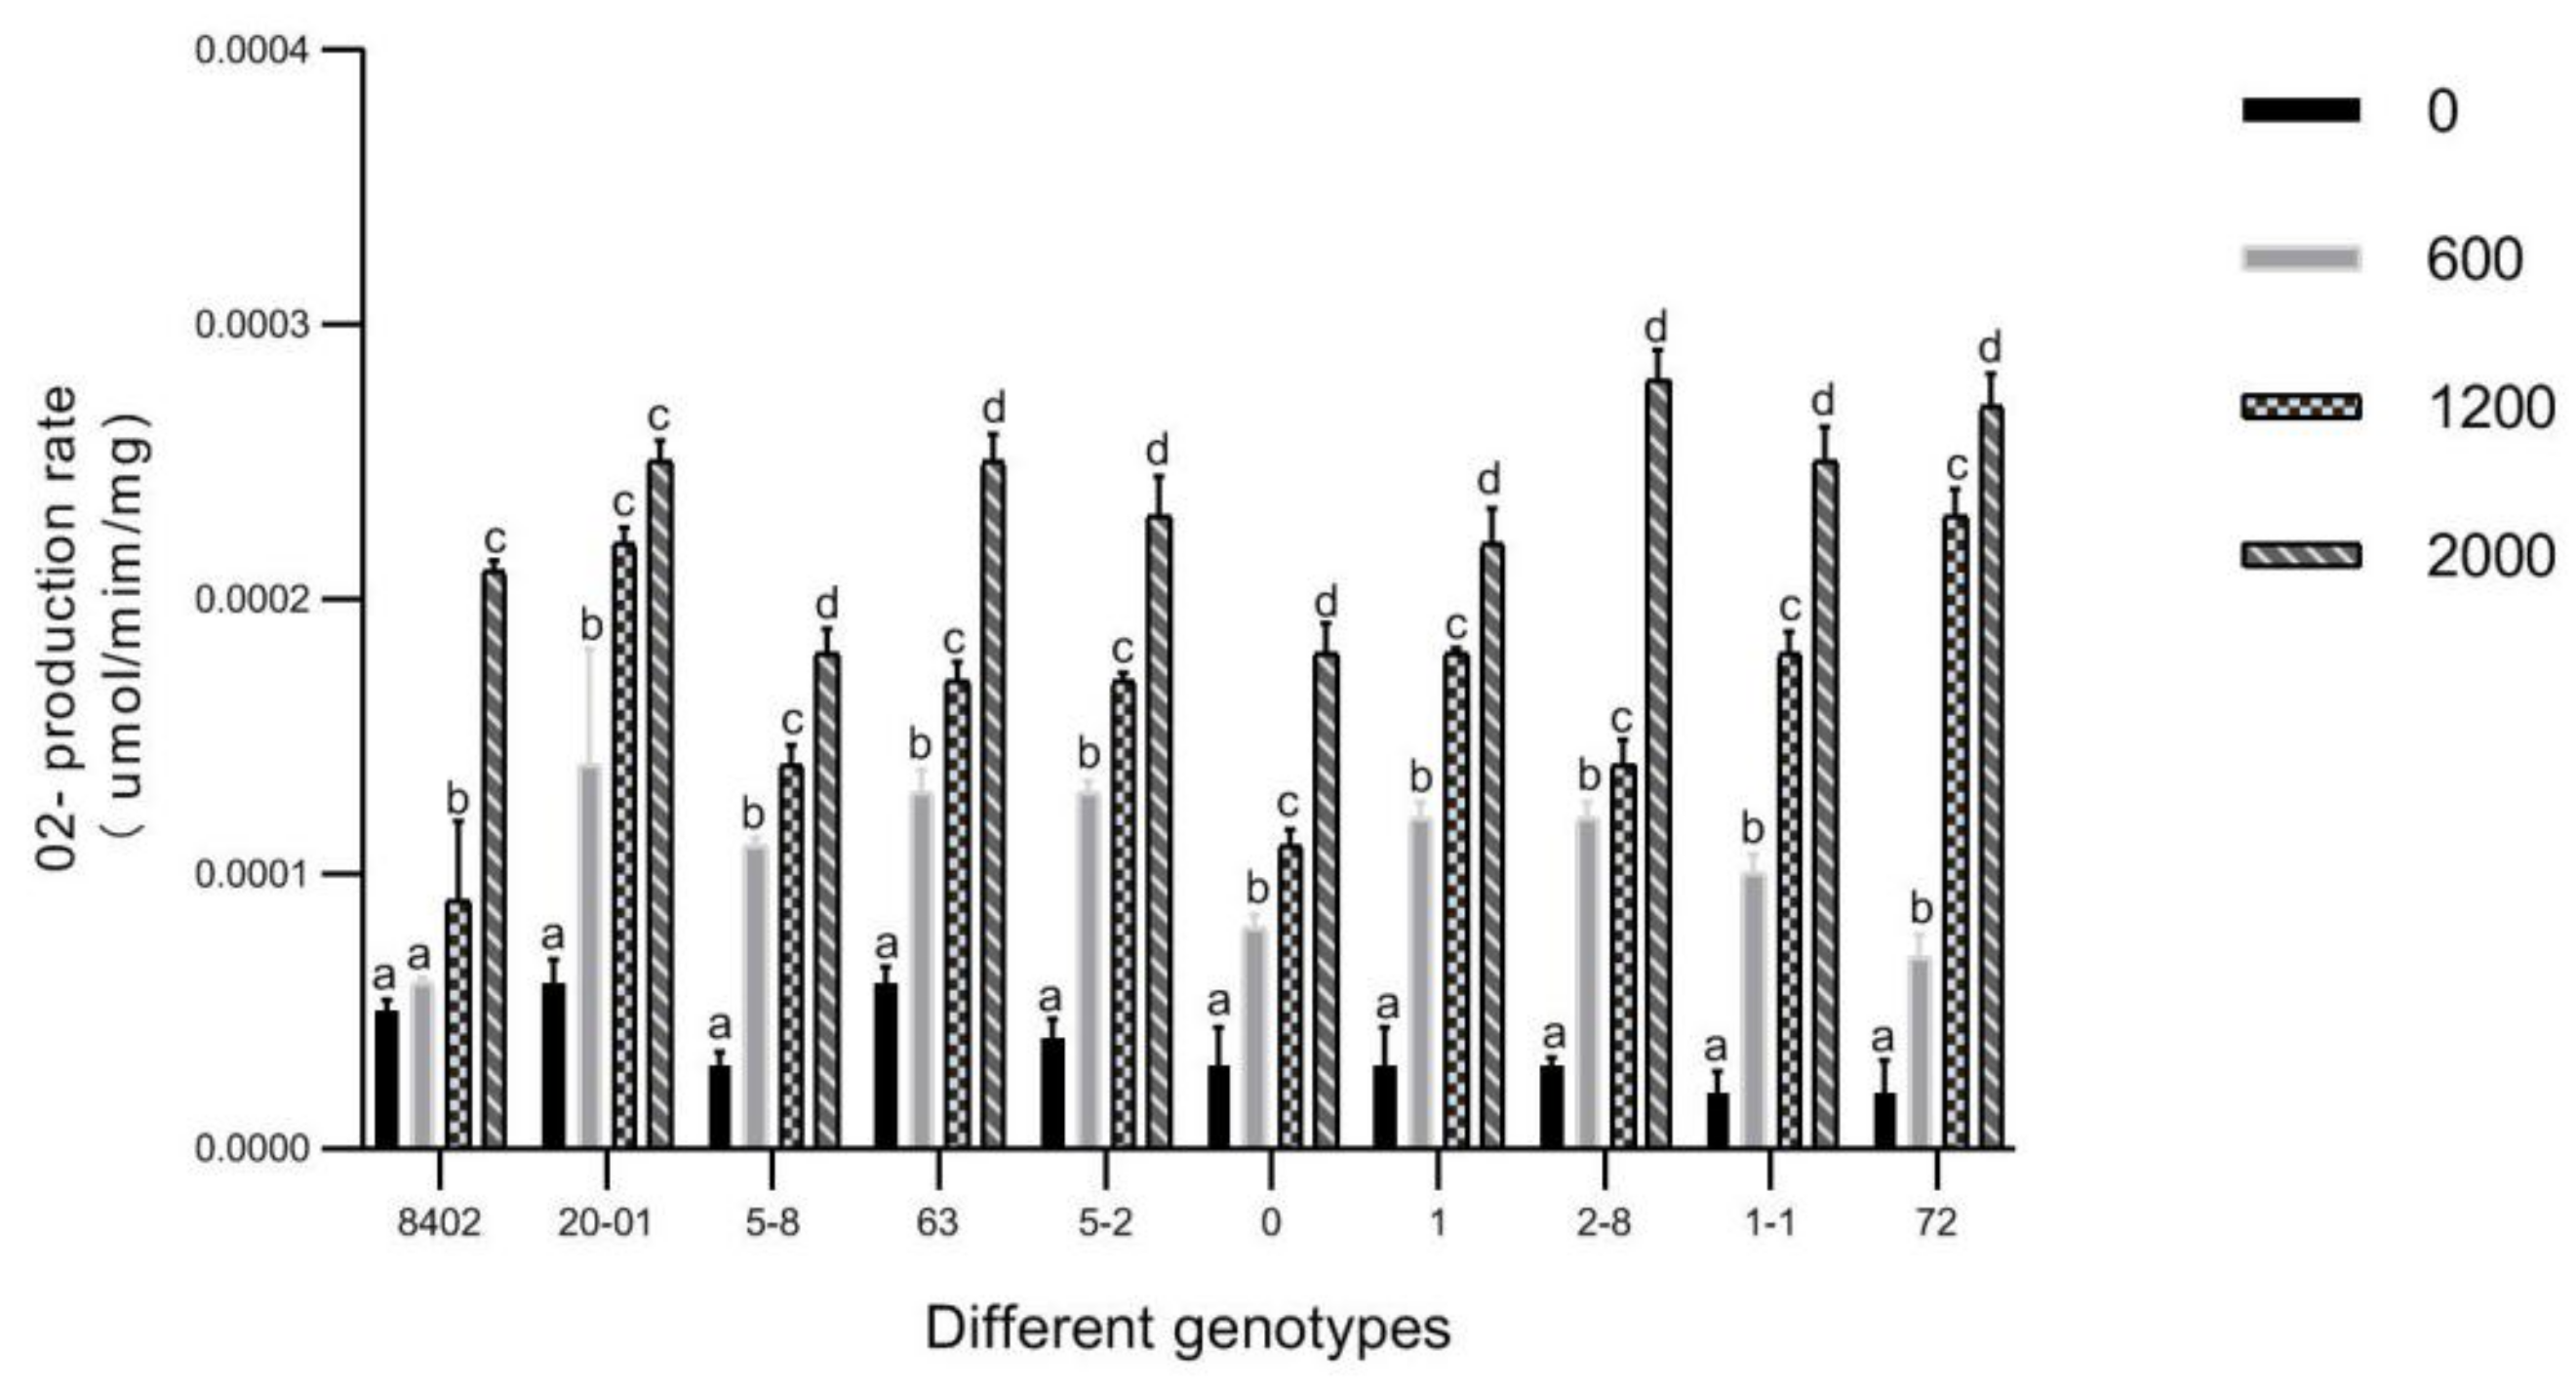
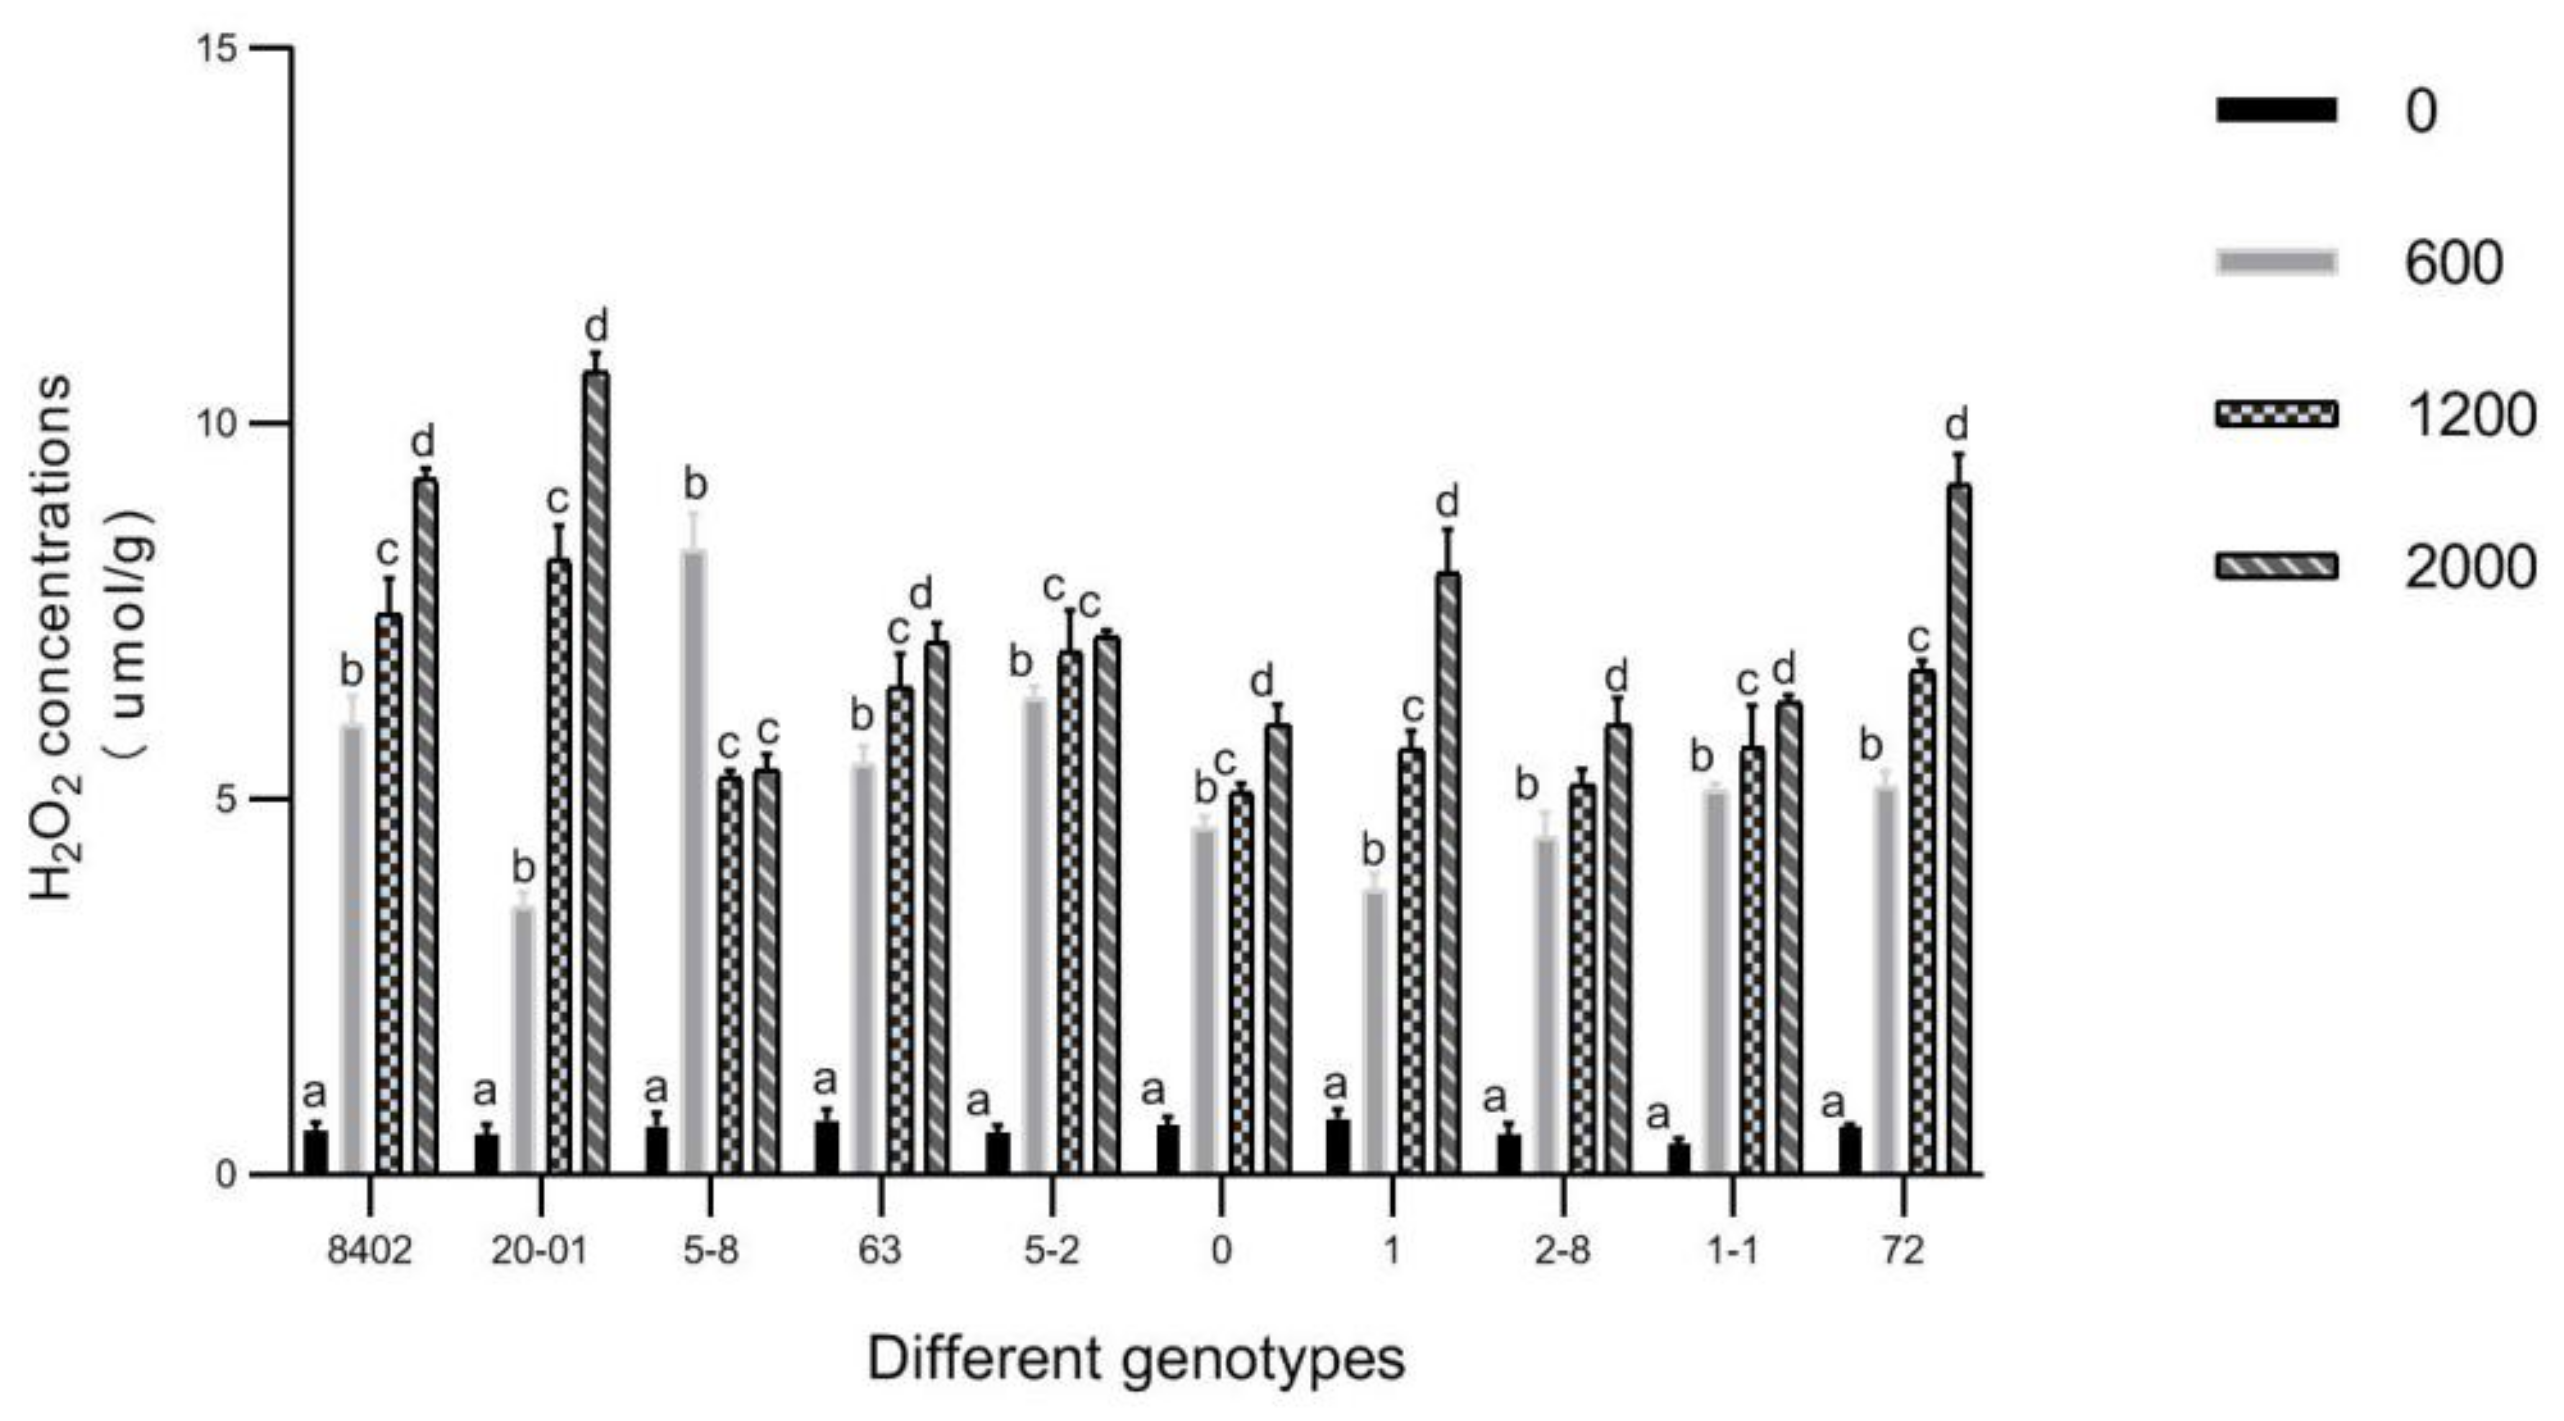
Root Sb accumulation (root biomass × root Sb concentration) was different among the 10 genotypes (Figure 11). At 600 mg Sb/kg soil, the highest root Sb accumulation was found in Genotype 1 (24.48 mg), followed by 63 (19.93 mg), respectively, 3.7 and 2.9 times that of the lowest genotype, 1-1 (6.61 mg). At 1200 mg Sb/kg soil, Sb accumulation was highest in Genotype 5-8 (31.85 mg), followed by Genotype 1 (24.96 mg), respectively 3.7- and 2.9- times that of the lowest genotype, 1-1 (4.11 mg). At 2000 mg Sb/kg soil, the root accumulated Sb in Genotype 5-8 was the highest (41.28 mg), followed by Genotype 1 (36.63 mg), respectively, 6.9 and 6.1 times that of the lowest genotype, 1-1 (5.96 mg).

3.5. O2▪ and H2O2 in Leaves of C. bungei by Sb Concentration

Under stress, plants produce large amounts of superoxide anions and H2O2, which lead to membrane lipid peroxidation, which can destroy the plant membrane system and affect plant growth. As a result of increased Sb concentration, production rates of O2▪ in leaves of C. bungei increased gradually (Figure 12). At 600 mg Sb/kg soil, Genotype 20-01 had the highest production rate of O2▪ and Genotype 8402 had the lowest. At 1200 mg Sb/kg soil, Genotype 72 had the highest production rate of O2▪ and Genotype 8402 again had the lowest. At 2000 mg Sb/kg soil, Genotype 2-8 had the highest production rate of O2▪ and Genotype 5-8 had the lowest.
At 600 mg Sb/kg soil, Genotype 5-8 had the highest production rate of H2O2 in leaves, and Genotype 20-01 had the lowest. At 1200 mg Sb/kg soil, Genotype 20-01 had the highest production rate of H2O2, and Genotype 0 had the lowest. At 2000 mg Sb/kg soil, Genotype 20-01 again had the highest production rate of H2O2, and Genotype 5-8 had the lowest (Figure 13).

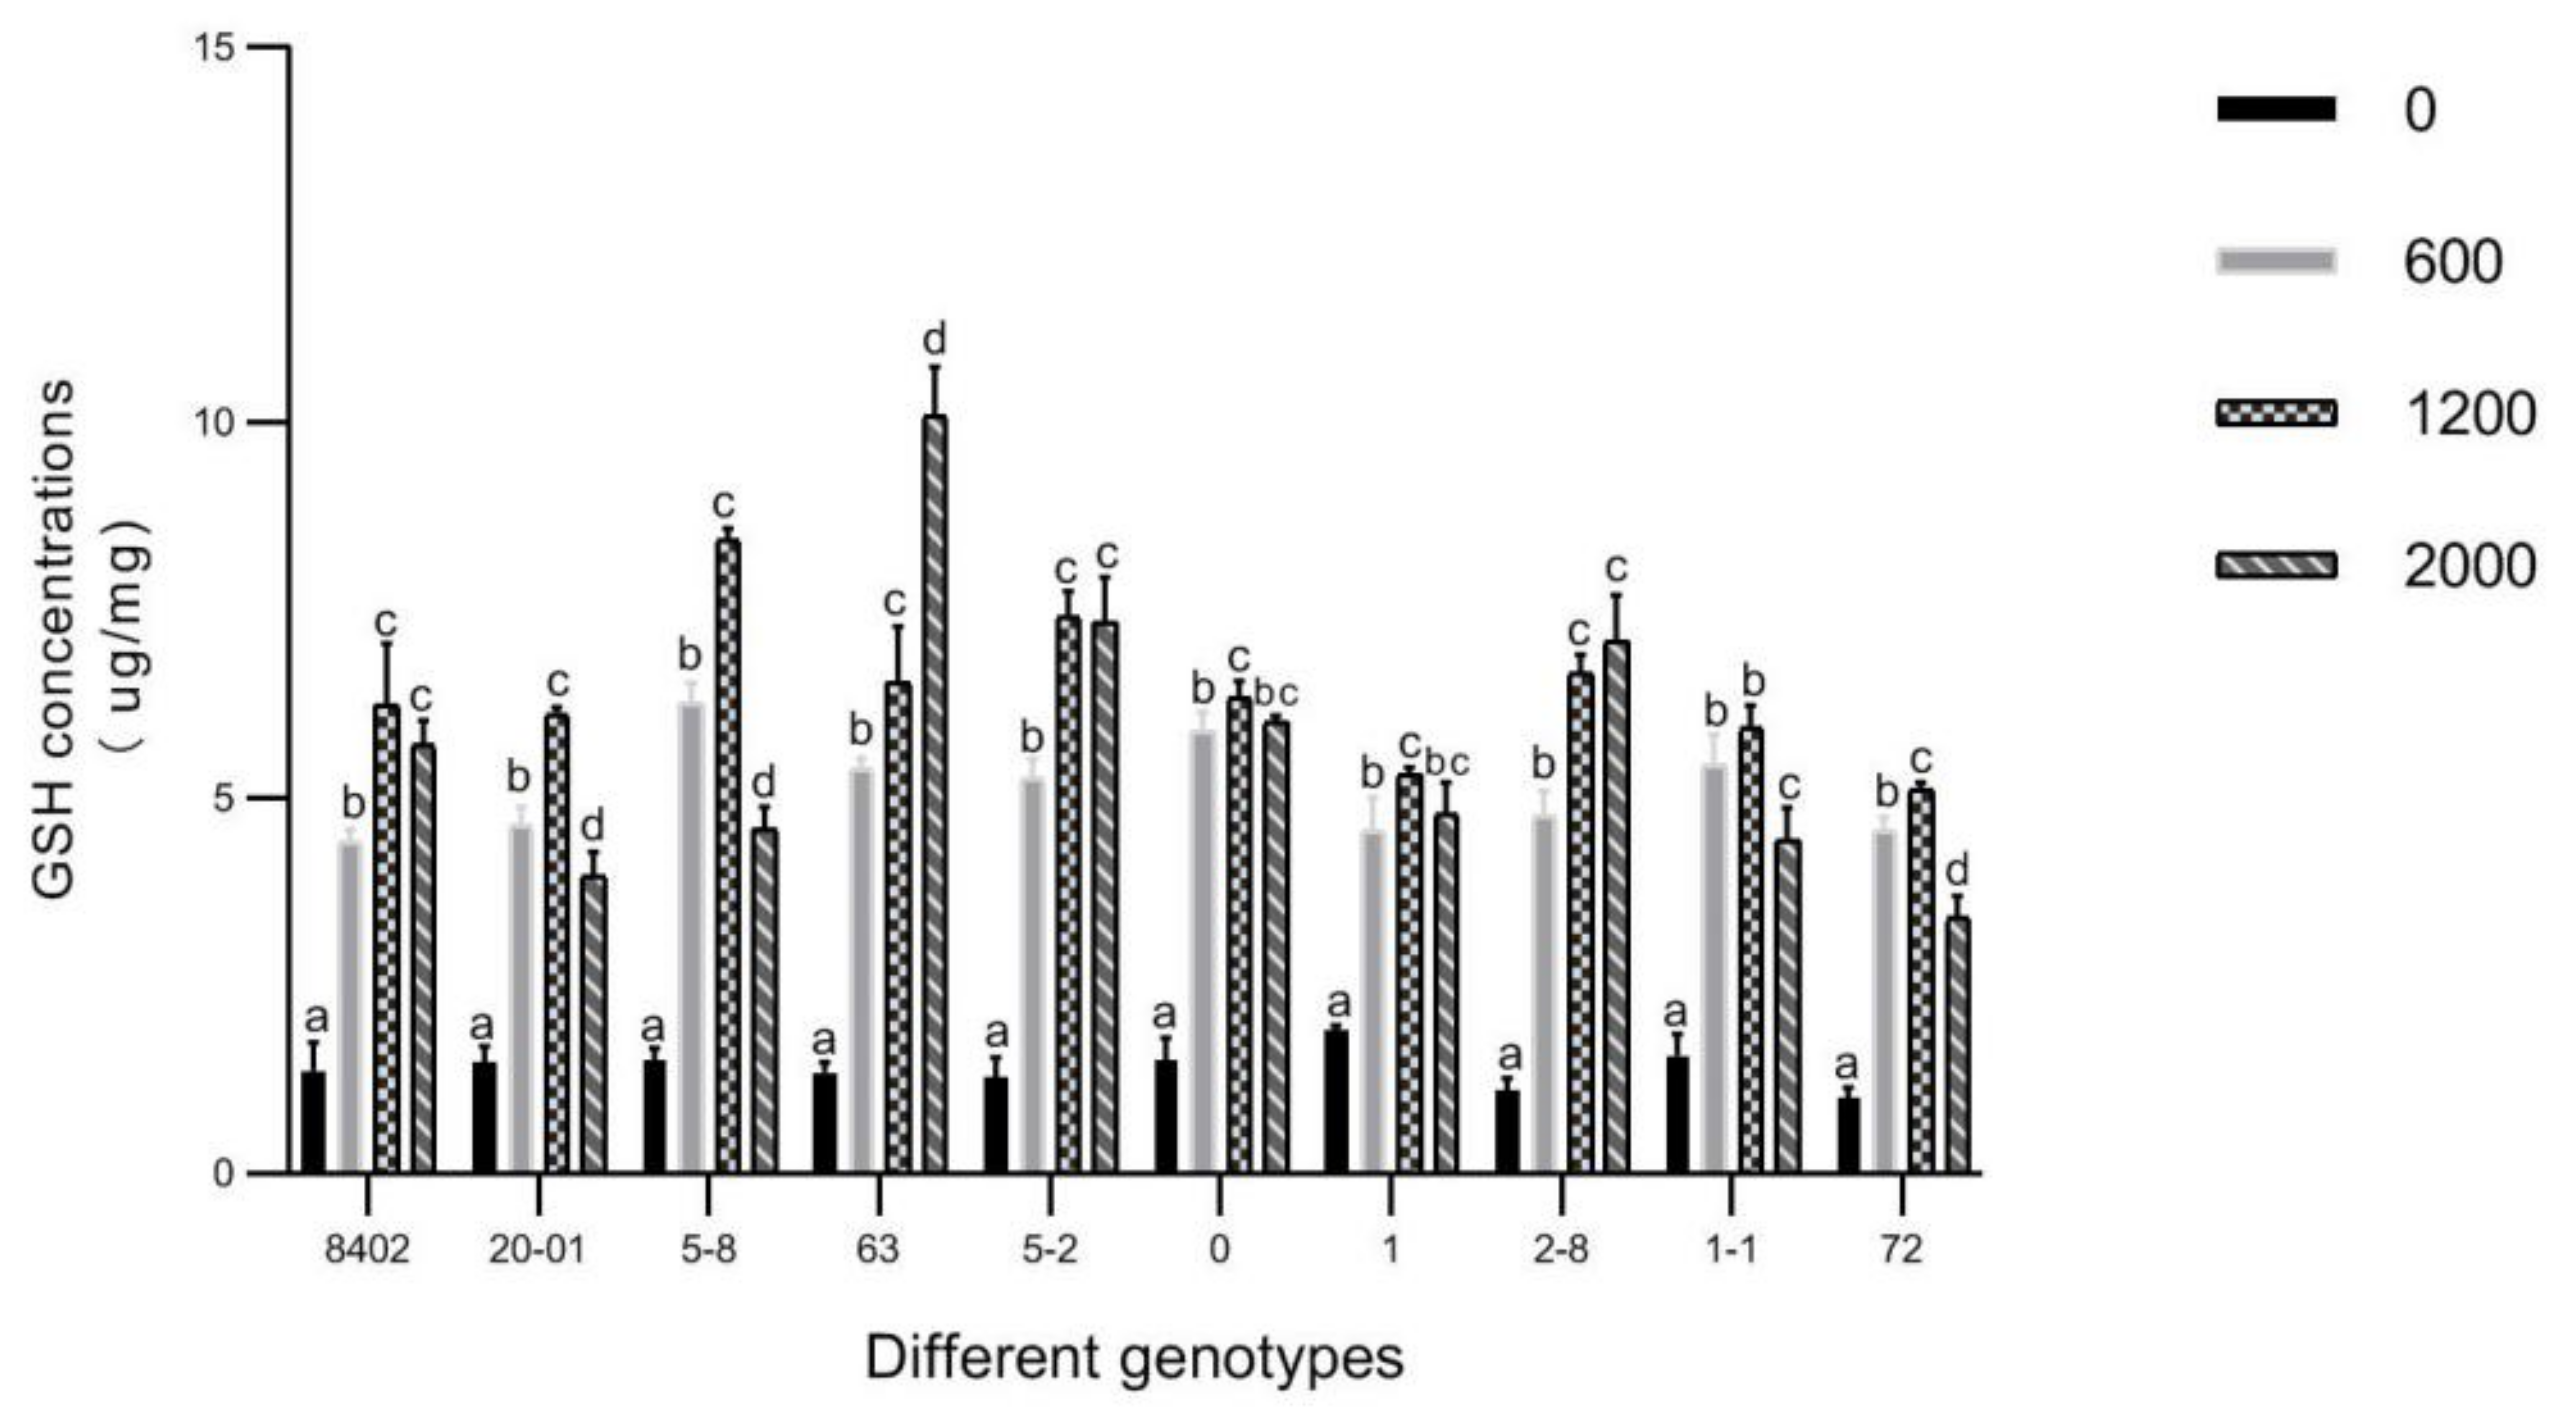
3.6. GSH in Leaves of C. bungei by Sb Concentration

GSH is an important antioxidant in the ascorbic acid–GSH cycle in plants. When the Sb concentration was <2000 mg/kg soil, the GSH concentrations in the leaves of each genotype increased with increasing Sb concentration. Other than for Genotypes 63 and 2-8, the GSH content in the leaves then decreased when the Sb concentration was increased to 2000 mg/kg soil. When Sb concentrations were <2000 mg/kg soil, all genotypes of C. bungei produced GSH and other nonenzymatic antioxidants to eliminate or slow down injury. However, when the Sb concentration reached 2000 mg/kg soil, GSH levels decreased, suggesting that high concentrations of Sb negatively affected GSH synthesis (Figure 14).

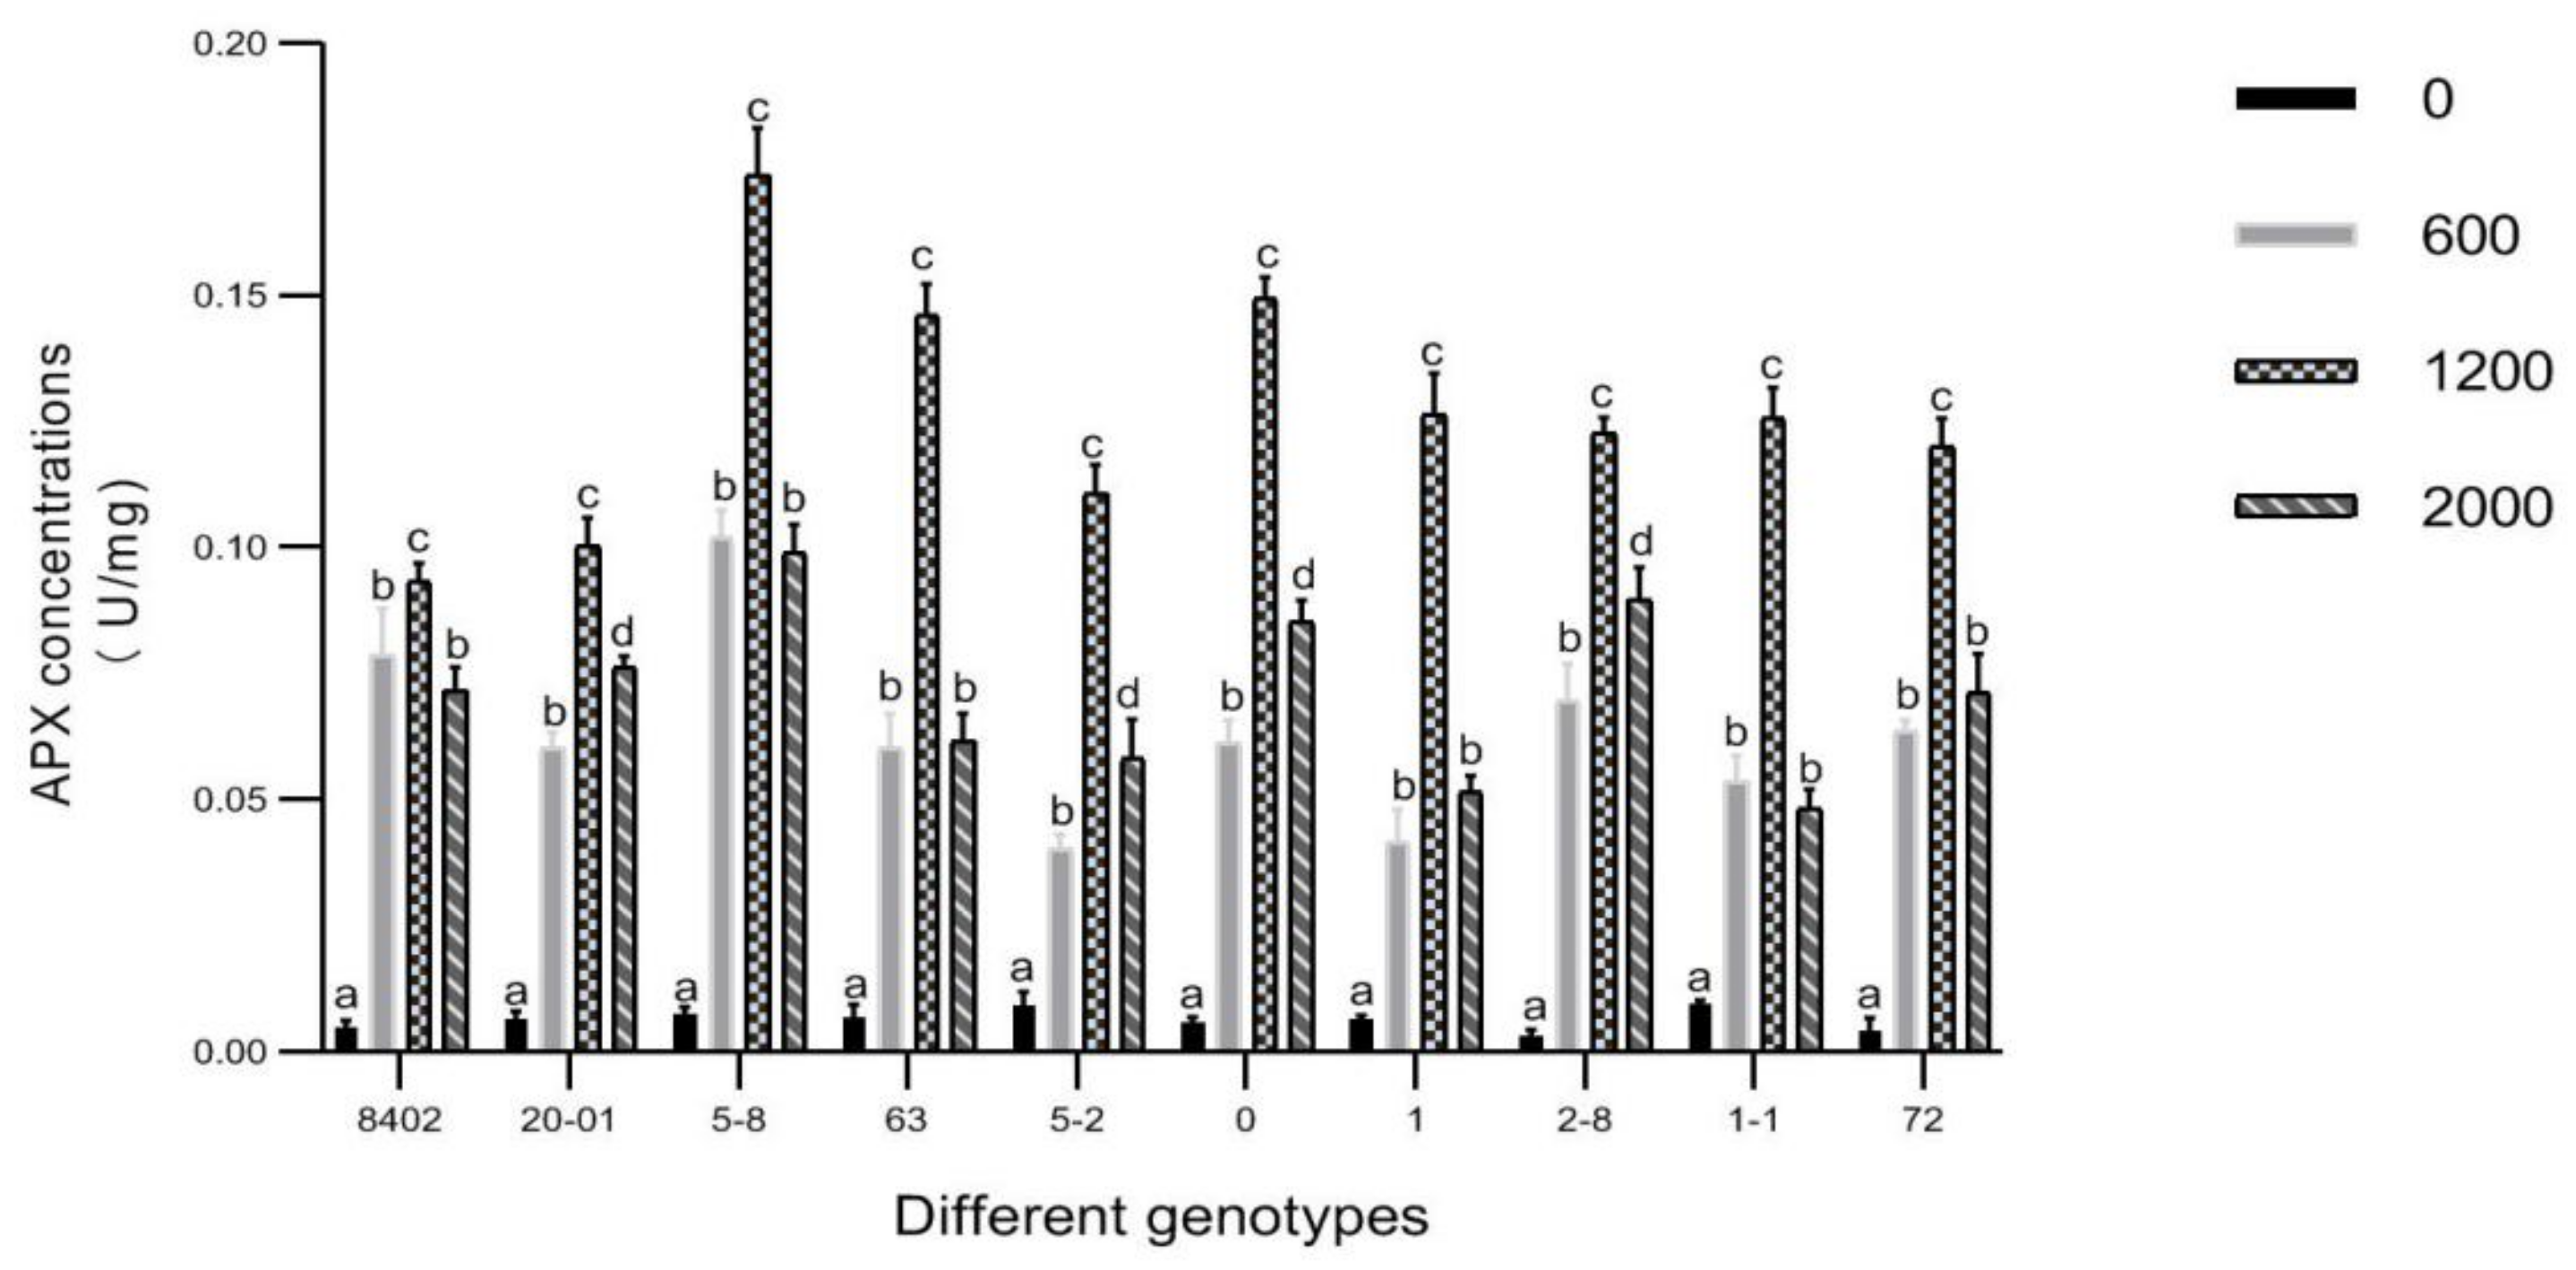
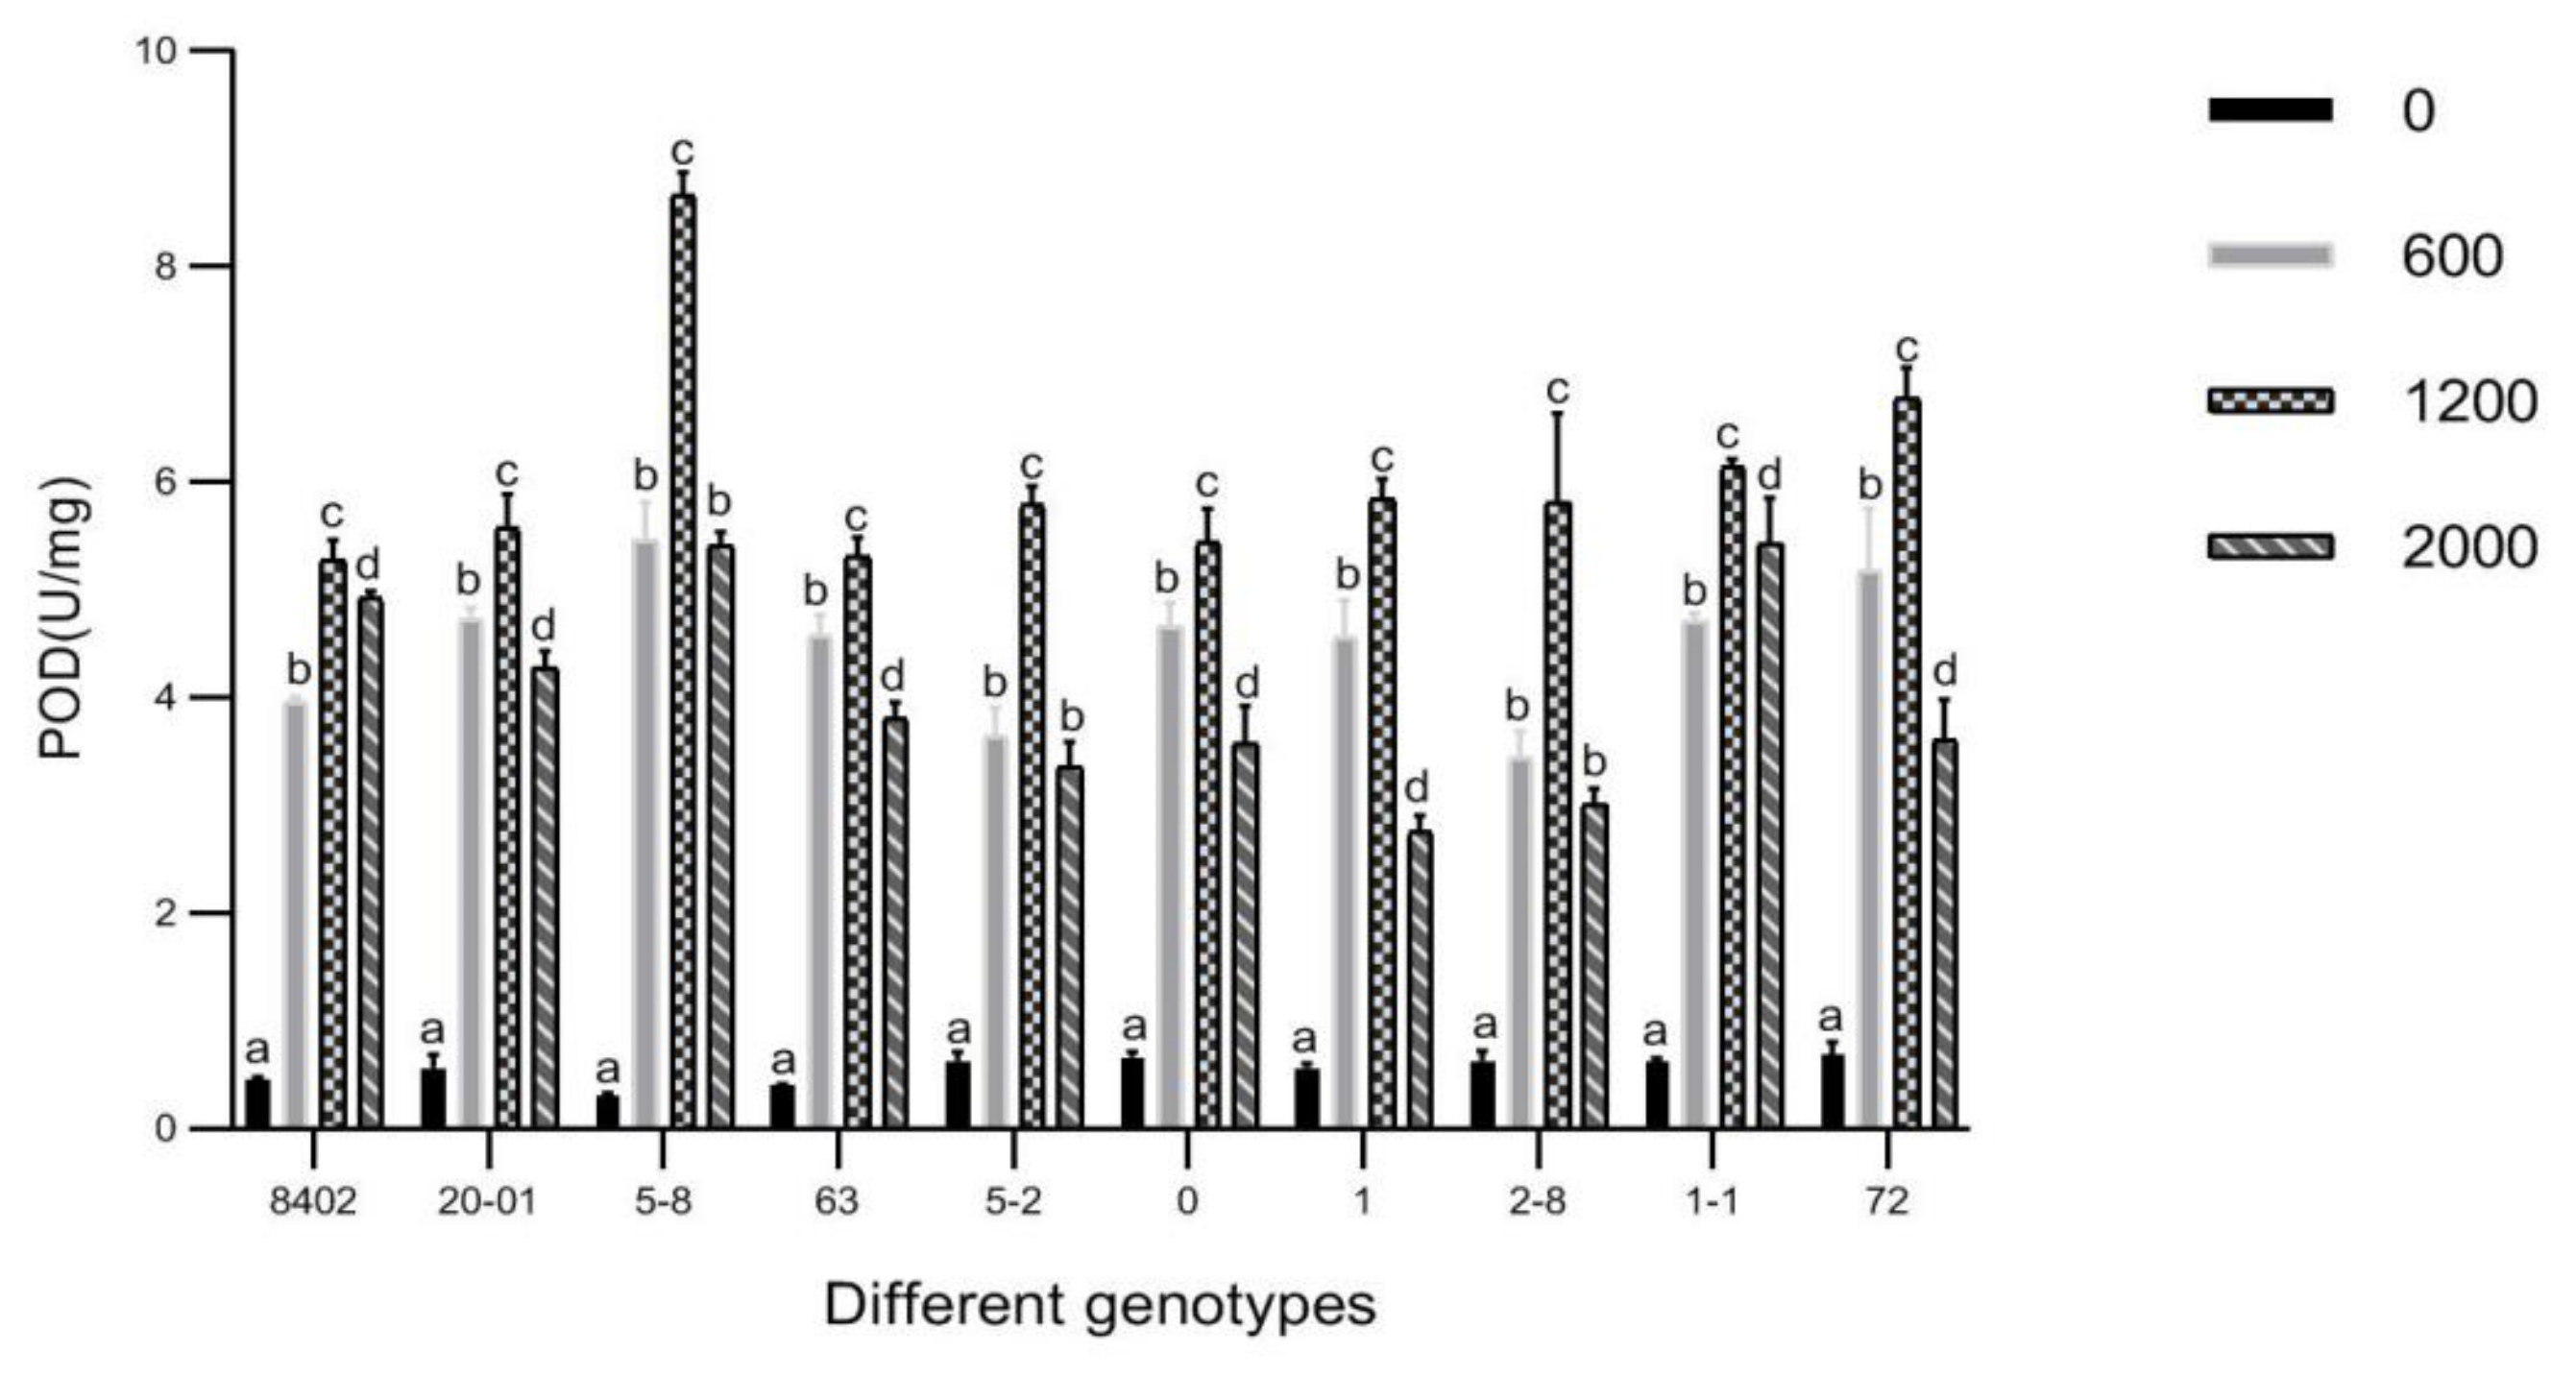
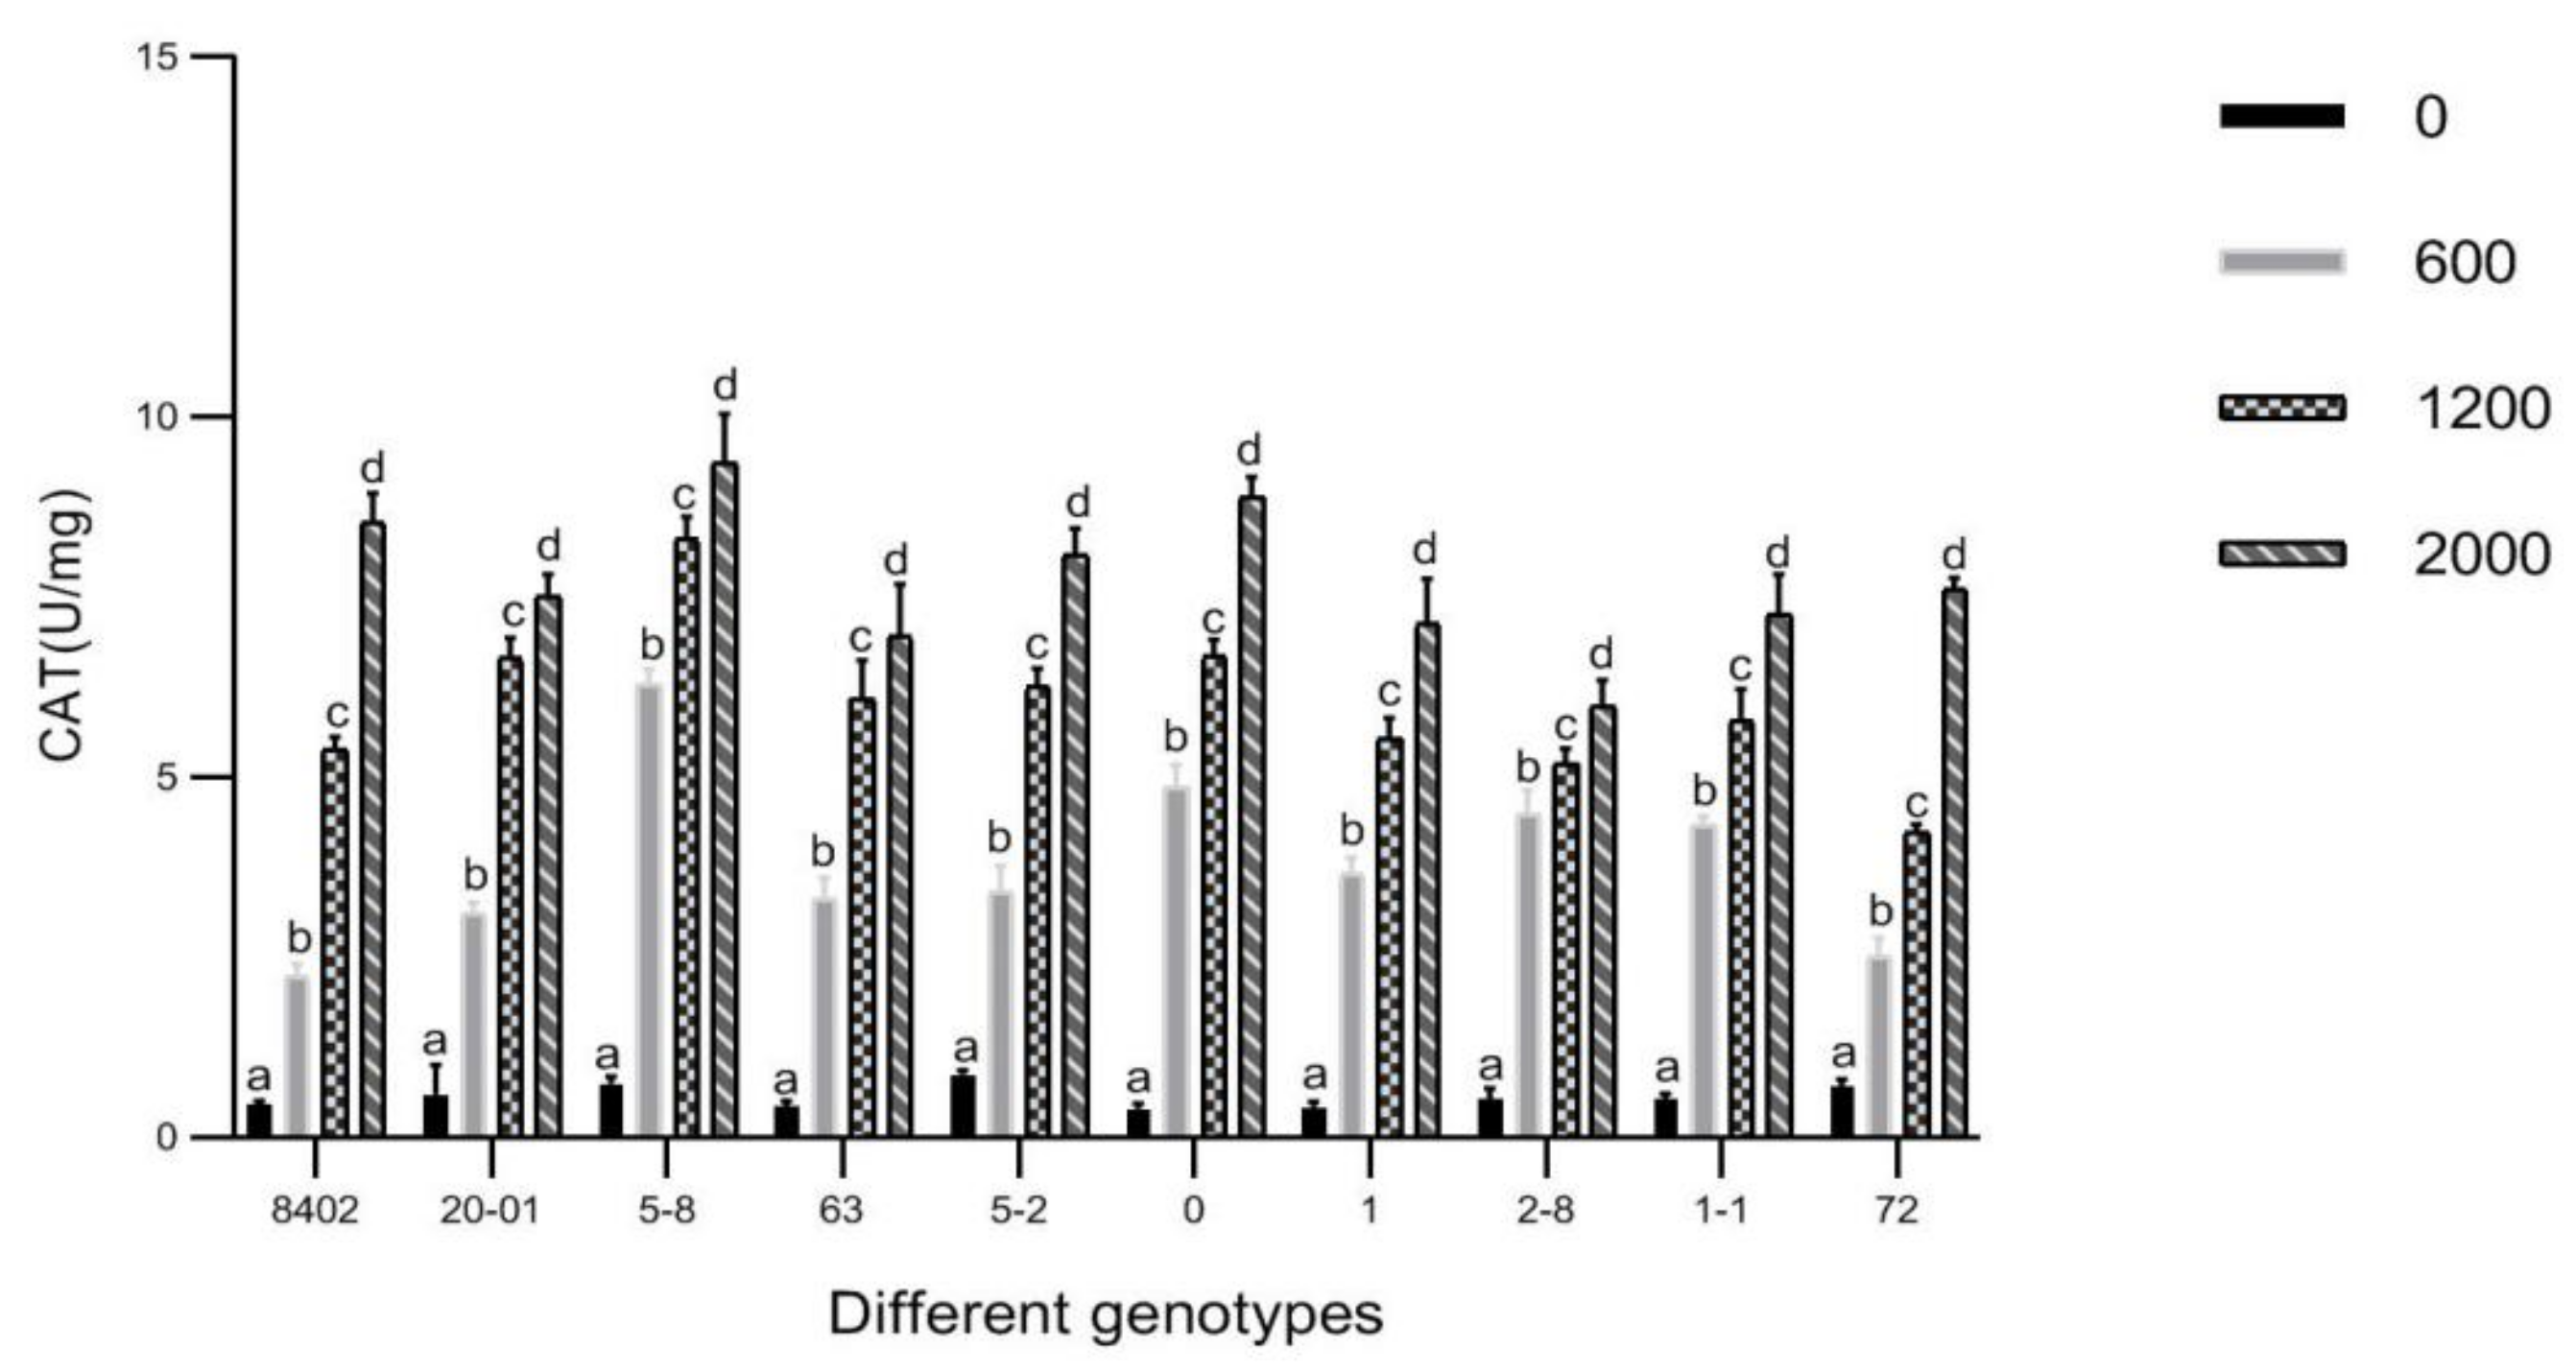
3.7. Effects of Sb Concentration on Antioxidant Enzyme Activities in Leaves of C. bungei

The production of ROS such as H2O2 induced increased activity of POD, APX, and CAT, and this increased enzyme activity was used to scavenge the ROS. APX activity in C. bungei leaves generally increased with increasing soil Sb concentration, though APX activity was lower at 2000 mg Sb/kg soil than at 1200 mg Sb/kg soil. CAT activity increased with increasing Sb concentration. POD behaved similarly to APX. We observed a positive correlation between the activity of antioxidant enzymes and the concentration of ROS in plants at certain concentrations of Sb (Figure 15, Figure 16 and Figure 17).

4. Discussion

The concentration of metal(loid)s in plants can be determined by environmental conditions, genetic characteristics, and the chemical speciation of the metal(loid)s in the soil [29]. Sb is not an essential element for plant growth. In mature leaves, Sb concentrations >150 mg/kg are generally considered toxic [9]. Many recent studies have confirmed that different genotypes of the same species can differ in their accumulation and absorption of heavy metals (e.g., Chinese cabbage (Brassica chinensis L.) [30] and rice (Oryza sativa L.) [31]). To identify suitable C. bungei varieties for the remediation of Sb-contaminated soil, the ability of each genotype to absorb Sb should be considered. Here, we found large differences in the absorption and distribution of Sb among 10 genotypes of C. bungei. At different soil Sb concentrations, Sb content in the roots, stems, and leaves of different genotypes differed significantly. The content of Sb in the aboveground and belowground parts of genotypes other than 2-8 and 1-1 was proportional to the concentration of Sb in the soil, which was consistent with a similar study of Sb stress in wheat (Triticum sestivum L.) [2]. The BCFs between soil and leaves will be determined in later research work.
We found significant differences in Sb absorption capacity among the 10 genotypes in our study, and the Sb absorption capacity of each genotype depended on the level of Sb pollution. Plants can resist heavy metals by either avoiding them or tolerating them, which can be achieved via exclusion and enrichment, respectively. In exclusion, plants decrease the absorption of heavy metals by roots and the heavy metal content in shoots; in enrichment, heavy metals are stored in plants in the form of nonbioactive macromolecules [32]. We found that the Sb concentrations in C. bungei roots were much higher than those in stems and leaves, which is consistent with recent studies of Sb uptake by rice [33] and wheat [2]. Root Sb concentrations in the belowground portion of plants were much higher than those in the aboveground portions, indicating that the Sb transfer ability of the 10 C. bungei genotypes was low and the macromolecular substances formed in the presence of Sb pollution were absorbed by the roots [34], limiting damage to the stems and leaves of the plants. This may be an important reason why there was no obvious toxicity of Sb to the stems and leaves of C. bungei.
The selection of genotypes that can effectively enrich Sb is key to the successful use of C. bungei to remediate Sb-contaminated soil. Based on our results, we make the novel recommendation that different genotypes should be used to absorb Sb in soils with different levels of Sb pollution. Although C. bungei does not reach the standard of super accumulator plants, large amounts of Sb can accumulate and be fixed in the roots of C. bungei. Furthermore, C. bungei is fast-growing with high biomass. Thus, C. bungei can extract and store Sb from contaminated soil. Because C. bungei has high aboveground biomass, it is of great significance for the remediation of Sb-contaminated soil to search for genotypes with higher transport factors. Moreover, Sb usually exists in soil together with other heavy metals. Thus, the accumulation of Sb and the absorption of other heavy metals by C. bungei needs to be studied in conditions including multiple heavy metal(loid) pollutants.

5. Conclusions

Differences in plant height and diameter at ground level among different genotypes of C. bungei were observed on exposure to different soil Sb concentrations. Each genotype responded differently to different Sb concentrations. Plant growth (measured in both height and diameter) of most genotypes initially increased and then decreased with increasing Sb concentration. Aboveground and root biomass differed significantly under different levels of Sb concentration for all genotypes except 8402. The root biomasses of Genotypes 8402 and 72 at 2000 mg Sb/kg soil were higher than that of the control, while the other genotypes exhibited gradual decreases in biomass after reaching a threshold Sb concentration.
The concentration of Sb in different plant organs also differed among genotypes and at different Sb concentrations. Sb levels in roots and the aboveground parts of the 10 genotypes were positively related to the Sb concentration in the soil. Sb largely remained in the roots after absorption, as upward transfer was poor. The Sb BCF of roots of all genotypes was >1. As a result, all 10 C. bungei genotypes could be used to fix Sb from Sb-contaminated soil.
With increasing Sb concentration, the production rate of O2▪ in each genotype increased. When the total soil Sb was <2000 mg/kg, GSH in the leaves of each genotype increased with increasing Sb concentration. However, except in Genotypes 63 and 2-8, the GSH content in leaves decreased when the Sb concentration reached 2000 mg/kg soil. APX activity increased with increasing Sb concentration, but APX activity at 2000 mg Sb/kg soil was lower than that at 1200 mg/kg soil. POD activity followed a similar pattern to APX. CAT activity increased with increasing Sb concentration in soil.
Different genotypes of C. bungei differed in their ability to store Sb in roots. Based on root Sb accumulation, at soil Sb concentrations around 600 mg/kg, Genotypes 1, 63, and 5-8 are suited to phytoremediation; Genotypes 5-8, 1, and 5-2 are suited to phytoremediation at soil Sb concentrations around 1200 mg/kg; and Genotypes 5-8, 1, and 8402 are suited to phytoremediation at soil Sb concentrations around 2000 mg/kg.

Supplementary Materials

The following are available online at https://www.mdpi.com/article/10.3390/f12081036/s1, Table S1: Effects of Sb concentration on growth of Catalpa bungei, Table S2: Effects of Sb concentration on the biomass of Catalpa bungei.

Author Contributions

Conceptualization, Z.L.; methodology, W.M.; formal analysis, F.T.; investigation, writing—original draft preparation, Z.L.; writing—review and editing, Z.L.; supervision, J.W. All authors have read and agreed to the published version of the manuscript.

Funding

The work was financially supported by the Fundamental Research Funds of Chinese Academy of Forestry (CAFYBB2020SZ003) and the Training Program for Excellent Young Innovators of Changsha (kq2009087).

Institutional Review Board Statement

Not applicable.

Informed Consent Statement

Not applicable.

Data Availability Statement

The data presented in this study are available on request from the corresponding author.

Conflicts of Interest

The authors declare no conflict of interest.

References

  1. Xing, W.; Liu, H.; Banet, T.; Wang, H.; Ippolito, J.A.; Li, L. Cadmium, copper, lead and zinc accumulation in wild plant species near a lead smelter. Ecotoxicol. Environ. Saf. 2020, 198, 110683. [Google Scholar] [CrossRef]
  2. Ma, C.; He, M.; Zhong, Q.; Ouyang, W.; Lin, C.; Liu, X. Uptake, translocation and phytotoxicity of antimonite in wheat (Triticum aestivum). Sci. Total Environ. 2019, 669, 421–430. [Google Scholar] [CrossRef] [PubMed]
  3. Smichowski, P. Antimony in the environment as a global pollutant: A review on analytical methodologies for its determination in atmospheric aerosols. Talanta 2008, 75, 2–14. [Google Scholar] [CrossRef]
  4. Chai, L.Y.; Mubarak, H.; Yang, Z.H.; Yong, W.; Tang, C.-J.; Mirza, N. Growth, photosynthesis, and defense mechanism of antimony (Sb)-contaminated Boehmeria nivea L. Environ. Sci. Pollut. Res. 2015, 23, 7470–7481. [Google Scholar] [CrossRef]
  5. Wilson, N.J.; Craw, D.; Hunter, K. Antimony distribution and environmental mobility at an historic antimony smelter site, New Zealand. Environ. Pollut. 2004, 129, 257–266. [Google Scholar] [CrossRef] [PubMed]
  6. Cavallo, D.; Iavicoli, I.; Setini, A.; Marinaccio, A.; Perniconi, B.; Carelli, G.; Iavicoli, S. Genotoxic risk and oxidative DNA damage in workers exposed to antimony trioxide. Environ. Mol. Mutagenesis 2002, 40, 184–189. [Google Scholar] [CrossRef] [PubMed]
  7. Herath, I.; Vithanage, M.; Bundschuh, J. Antimony as a global dilemma: Geochemistry, mobility, fate and transport. Environ. Pollut. 2017, 223, 545–559. [Google Scholar] [CrossRef]
  8. Jamali Hajiani, N.; Ghaderian, S.M.; Karimi, N.; Schat, H. A comparison of antimony accumulation and tolerance among Achillea wilhelmsii, Silene vulgaris and Thlaspi arvense. Plant Soil 2016, 412, 267–281. [Google Scholar] [CrossRef]
  9. Feng, R.; Lei, L.; Su, J.; Zhang, R.; Zhu, Y.; Chen, W.; Wang, L.; Wang, R.; Dai, J.; Lin, Z.; et al. Toxicity of different forms of antimony to rice plant: Effects on root exudates, cell wall components, endogenous hormones and antioxidant system. Sci. Total Environ. 2020, 711, 134589. [Google Scholar] [CrossRef]
  10. Wang, X.; Li, F.; Yuan, C.; Li, B.; Liu, T.; Liu, C.; Liu, C. The translocation of antimony in soil-rice system with comparisons to arsenic: Alleviation of their accumulation in rice by simultaneous use of Fe(II) and NO3. Sci. Total Environ. 2019, 650, 633–641. [Google Scholar] [CrossRef]
  11. Baroni, F.; Boscagli, A.; Protano, G.; Riccobono, F. Antimony accumulation in Achillea ageratum, Plantago lanceolata and Silene vulgaris growing in an old Sb-mining area. Environ. Pollut. 2000, 109, 347–352. [Google Scholar] [CrossRef]
  12. Tschan, M.; Robinson, B.H.; Schulin, R. Antimony in the soil-plant system—A review. Environ. Chem. 2009, 6, 106–115. [Google Scholar] [CrossRef] [Green Version]
  13. Cidu, R.; Biddau, R.; Dore, E.; Vacca, A.; Marini, L. Antimony in the soil–water–plant system at the Su Suergiu abandoned mine (Sardinia, Italy): Strategies to mitigate contamination. Sci. Total Environ. 2014, 497–498, 319–331. [Google Scholar] [CrossRef] [PubMed]
  14. Miao, Y.; Han, F.; Pan, B.; Niu, Y.; Nie, G.; Lv, L. Antimony(V) removal from water by hydrated ferric oxides supported by calcite sand and polymeric anion exchanger. J. Environ. Sci. 2014, 26, 307–314. [Google Scholar] [CrossRef]
  15. He, M. Distribution and phytoavailability of antimony at an antimony mining and smelting area, Hunan, China. Environ. Geochem. Health 2007, 29, 209–219. [Google Scholar] [CrossRef]
  16. Corrales, I.; Barceló, J.; Bech, J.; Poschenrieder, C. Antimony accumulation and toxicity tolerance mechanisms in Trifolium species. J. Geochem. Explor. 2014, 147, 167–172. [Google Scholar] [CrossRef]
  17. Remans, T.; Opdenakker, K.; Guisez, Y.; Carleer, R.; Schat, H.; Vangronsveld, J.; Cuypers, A. Exposure of Arabidopsis thaliana to excess Zn reveals a Zn-specific oxidative stress signature. Environ. Exp. Bot. 2012, 84, 61–71. [Google Scholar] [CrossRef]
  18. Zheng, H.; Zhang, X.; Ma, W.; Song, J.; Rahman, S.U.; Wang, J.; Zhang, Y. Morphological and physiological responses to cyclic drought in two contrasting genotypes of Catalpa bungei. Environ. Exp. Bot. 2017, 138, 77–87. [Google Scholar] [CrossRef]
  19. Li, Y.; Zhang, X.; Yang, Y.; Duan, B. Soil cadmium toxicity and nitrogen deposition differently affect growth and physiology in Toxicodendron vernicifluum seedlings. Acta Physiol. Plant. 2012, 35, 529–540. [Google Scholar] [CrossRef]
  20. Xue, L.; Ren, H.; Li, S.; Gao, M.; Shi, S.; Chang, E.; Wei, Y.; Yao, X.; Jiang, Z.; Liu, J. Comparative proteomic analysis in Miscanthus sinensis exposed to antimony stress. Environ. Pollut. 2015, 201, 150–160. [Google Scholar] [CrossRef]
  21. Dahmani-Muller, H.; van Oort, F.; Gélie, B.; Balabane, M. Strategies of heavy metal uptake by three plant species growing near a metal smelter. Environ. Pollut. 2000, 109, 231–238. [Google Scholar] [CrossRef]
  22. Shtangeeva, I.; Steinnes, E.; Lierhagen, S. Uptake of different forms of antimony by wheat and rye seedlings. Environ. Sci. Pollut. Res. Int. 2012, 19, 502–509. [Google Scholar] [CrossRef]
  23. Wang, P.; Ma, L.; Li, Y.; Li, L.; Yang, R.; Ma, Y.; Wang, Q. Transcriptome profiling of indole-3-butyric acid-induced adventitious root formation in softwood cuttings of the Catalpa bungei variety ‘YU-1’ at different developmental stages. Genes Genom. 2015, 38, 145–162. [Google Scholar] [CrossRef]
  24. Cai, F.; Ren, J.; Tao, S.; Wang, X. Uptake, translocation and transformation of antimony in rice (Oryza sativa L.) seedlings. Environ. Pollut. 2016, 209, 169–176. [Google Scholar] [CrossRef]
  25. Ghosh, M.; Singh, S.P. A comparative study of cadmium phytoextraction by accumulator and weed species. Environ. Pollut. 2005, 133, 365–371. [Google Scholar] [CrossRef]
  26. Xue, L.; Liu, J.; Shi, S.; Wei, Y.; Chang, E.; Gao, M.; Chen, L.; Jiang, Z. Uptake of Heavy Metals by Native Herbaceous Plants in an Antimony Mine (Hunan, China). CLEAN – Soil, Air, Water 2014, 42, 81–87. [Google Scholar] [CrossRef]
  27. Zhang, W.; Cai, Y.; Tu, C.; Ma, L.Q. Arsenic speciation and distribution in an arsenic hyperaccumulating plant. Sci. Total Environ. 2002, 300, 167–177. [Google Scholar] [CrossRef]
  28. Fitz, W.J.; Wenzel, W.W. Arsenic transformations in the soil-rhizosphere-plant system: Fundamentals and potential application to phytoremediation. J. Biotechnol. 2002, 99, 259–278. [Google Scholar] [CrossRef]
  29. Hongjiang, Z.; Xizhou, Z.; Tingxuan, L.; Fu, H. Variation of cadmium uptake, translocation among rice lines and detecting for potential cadmium-safe cultivars. Environ. Earth Sci. 2013, 71, 277–286. [Google Scholar] [CrossRef]
  30. Tang, L.; Luo, W.; Tian, S.; He, Z.; Stoffella, P.J.; Yang, X. Genotypic differences in cadmium and nitrate co-accumulation among the Chinese cabbage genotypes under field conditions. Sci. Hortic. 2016, 201, 92–100. [Google Scholar] [CrossRef]
  31. Liu, J.; Mei, C.; Cai, H.; Wang, M. Relationships Between Subcellular Distribution and Translocation and Grain Accumulation of Pb in Different Rice Cultivars. Water Air Soil Pollut. 2015, 226. [Google Scholar] [CrossRef]
  32. Zhuang, P.; Shu, W.; Li, Z.; Liao, B.; Li, J.; Shao, J. Removal of metals by sorghum plants from contaminated land. J. Environ. Sci. 2009, 21, 1432–1437. [Google Scholar] [CrossRef]
  33. Ren, J.H.; Ma, L.Q.; Sun, H.J.; Cai, F.; Luo, J. Antimony uptake, translocation and speciation in rice plants exposed to antimonite and antimonate. Sci. Total Environ. 2014, 475, 83–89. [Google Scholar] [CrossRef] [PubMed]
  34. Feng, R.; Wei, C.; Tu, S.; Ding, Y.; Wang, R.; Guo, J. The uptake and detoxification of antimony by plants: A review. Environ. Exp. Botany 2013, 96, 28–34. [Google Scholar] [CrossRef]
Figure 1. Effects of Sb concentration on height increment of Catalpa bungei. Note: Different letters indicate significant differences among the treatments at p < 0.05 (n = 3). The same below.
Forests 12 01036 g001
Figure 2. Effects of Sb concentration on ground diameter increment of Catalpa bungei.
Forests 12 01036 g002
Figure 3. Effects of Sb concentration on the biomass of roots.
Forests 12 01036 g003
Figure 4. Effects of Sb concentration on the biomass of the aboveground part.
Forests 12 01036 g004
Figure 5. Sb concentrations in roots of Catalpa bungei. Note: Different letters indicate significant differences among the treatments at p < 0.05 (n = 3).
Forests 12 01036 g005
Figure 6. Sb concentrations in the stems of Catalpa bungei. Note: Different letters indicate significant differences among the treatments at p < 0.05 (n = 3).
Forests 12 01036 g006
Figure 7. Sb concentration in leaves of Catalpa bungei. Note: Different letters indicate significant differences among the treatments at p < 0.05 (n = 3).
Forests 12 01036 g007
Figure 8. Bioconcentration factors of C. bungei. Note: Different letters at the same Sb concentration indicate significant differences among the treatments at p < 0.05 (n = 3). The same below.
Forests 12 01036 g008
Figure 9. Root–stem transfer factors of C. bungei.
Forests 12 01036 g009
Figure 10. Stem–leaf transfer factors of C. bungei.
Forests 12 01036 g010
Figure 11. Root Sb accumulation in 10 genotypes. Note: Different letters indicate significant differences in the same treatment at p < 0.05 (n = 3).
Forests 12 01036 g011
Figure 12. The production rate of O2▪ in leaves of C. bungei. Note: Different letters for the same genotype indicate significant differences among the treatments at p < 0.05 (n = 3). The same below.
Forests 12 01036 g012
Figure 13. H2O2 concentrations in leaves of C. bungei.
Forests 12 01036 g013
Figure 14. Reduced glutathione (GSH) concentration in leaves of C. bungei.
Forests 12 01036 g014
Figure 15. Ascorbate peroxidase (APX) activity in leaves of C. bungei.
Forests 12 01036 g015
Figure 16. Catalase (CAT) activity in leaves of C. bungei.
Forests 12 01036 g016
Figure 17. Peroxidase (POD) activity in leaves of C. bungei.
Forests 12 01036 g017
Table 1. Background chemistry of potted soil (units mg/kg soil).
pHCdPbHgAsSbTotal NTotal PTotal KOrganic MatterAvailable PAvailable KHydrolytic N
4.800.0616.800.079.081.940.740.1511.3010.500.5139.2063.70
Publisher’s Note: MDPI stays neutral with regard to jurisdictional claims in published maps and institutional affiliations.

