Article

Species-Specific Nitrogen Resorption Efficiency in Quercus mongolica and Acer mono in Response to Elevated CO2 and Soil N Deficiency

1
Department of Plant Ecology, Forestry and Forest Products Research Institute, Tsukuba 305-8687, Japan
2
Hokkaido Research Center, Forestry and Forest Products Research Institute, Sapporo 062-8516, Japan
*
Author to whom correspondence should be addressed.
Forests 2021, 12(8), 1034; https://doi.org/10.3390/f12081034
Submission received: 1 July 2021 / Revised: 27 July 2021 / Accepted: 2 August 2021 / Published: 4 August 2021
(This article belongs to the Special Issue Ecophysiology of Forest Succession under Changing Environment)

Abstract

:
To test the effects of elevated CO2 and soil N deficiency on N resorption efficiency (NRE) from senescing leaves in two non-N2-fixing deciduous broadleaved tree species, Japanese oak (Quercus mongolica var. grosseserrata Blume) and Painted maple (Acer mono Maxim. var. glabrum (Lév. Et Van’t.) Hara), potted seedlings were grown in a natural daylight phytotron with either ambient or elevated CO2 conditions (36 Pa and 72 Pa CO2) and with two levels of N (52.5 and 5.25 mg N pot−1 week−1 for high N and low N, respectively). We examined the N content (Nmass) of mature and senescent leaves, as well as photosynthesis and the growth of plants, and calculated both the mass-based NRE (NREmass) and leaf area-based NRE (NREarea). In both species, the Nmass of mature leaves decreased with high CO2 and low N, whereas the leaf mass per area (LMA) increased under elevated CO2, regardless of N treatments. In Q. mongolica, both the maximum rate of carboxylation (Vcmax) and the maximum electron transport rate (Jmax) were reduced by elevated CO2 and low N, but Vcmax exhibited an interactive effect of N and CO2 treatments. However, in A. mono, both the Vcmax and Jmax decreased under elevated CO2, regardless of N treatments. The partitioning of N for the photosynthetic function within leaves was also significantly decreased by elevated CO2 in both species and increased under low N in A. mono. The Nmass of senesced leaves decreased under low N in both species and exhibited an increase (Q. mongolica) or no effect (A. mono) by elevated CO2. The NREarea of Q. mongolica was affected by CO2 and N treatments, with a decrease under elevated CO2 compared to ambient CO2 and under low N compared to high N. The NREarea of A. mono was also affected by CO2 and N treatments and decreased under elevated CO2; however, unlike in the case of Q. mongolica, it increased under low N. We speculate that these interspecific differences in the responses of leaf N allocation, indicated by the photosynthetic (Vcmax and Jmax) and morphological (LMA) responses to elevated CO2, may have affected the NRE during defoliation under high CO2 and soil N-deficient conditions.

1. Introduction

The increasing atmospheric CO2 concentration is a crucial factor influencing global climate change [1,2]. Projections for atmospheric CO2 concentrations are provided by distinct representative concentration pathways (RCPs). According to the projected trajectories, the CO2 concentration in 2100 may range from 421 (RCP2.6) to 936 ppm (RCP8.5, a scenario with very high greenhouse gas emissions; [2,3]). Elevated CO2 stimulates photosynthesis, which can increase forest net primary production but, at longer timescales, may not necessarily increase plant biomass. Biomass increase depends on nutrient availability, rising temperatures, heat stress, and variation in precipitation and plant water availability [4]. The nutrient limitation, especially N, will also determine ecosystem responses to elevated CO2 [1,5,6,7,8,9]. A recent study reported that the degree to which N limitation diminished the effects of CO2 on plant growth varied among experiments, depending on the age of forests and distinct nutrient strategies, for example, those involving microbial associations [4,10,11].
N is absorbed into the soil mainly through leaf litter. The initial N content or C/N ratio of leaf litter affects its rate of decomposition [12] and influences the growth of trees through the nutrients supplied to the soil. Elevated atmospheric CO2 can affect the quality of leaf litter and even the rate of its decomposition [13,14,15]. Indeed, the green leaves of many tree species show decreased N concentrations under elevated CO2 [16,17]. Strain and Bazzaz [18] proposed the litter quality hypothesis, i.e., that a decrease in the N concentration of green leaves under high CO2 causes a decrease in the N concentration of fallen leaves and a slower decomposition rate. However, there is no consistent view on how high CO2 affects the N concentration of leaf litter [13,19,20,21,22,23] and its decomposition rate [24,25,26].
Leaf litter N levels depend on the characteristics of green leaves and nutrient resorption during leaf senescence. N resorption from senescing leaves is the primary mechanism by which plants conserve nutrients [27,28]. N resorption efficiency (NRE), which is often expressed as the fraction of N resorbed at senescence relative to green leaf N [29], can be influenced by numerous factors, including soil N availability [30,31], N additions [32], climate zone (mean annual precipitation and latitude), plant age [33,34,35], plant functional types [36,37], and the balance between N and P availability [38].
Under high CO2, the ratio of soluble N, which is easily reabsorbed, has been reported to decrease in relation to the ratio of structural N, which is used for cell walls and is less easily reabsorbed; thus, NRE may decrease through a decrease in the ratio of leaf soluble N to structural N [16,39,40,41]. However, it has also been reported that NRE did not change [22,42,43,44,45] or exhibited an increase [22,23,43,46,47] under elevated CO2. Unfortunately, data on how elevated CO2 affects NRE are scant, relative to data on how it affects photosynthetic activities in green leaves. Therefore, a consensus has yet to be reached on how high CO2 affects the NRE of deciduous tree species [21].
N that has been allocated to metabolic proteins, many of which are enzymes associated with photosynthesis [48], is easily degraded and reabsorbed during leaf senescence [49,50]. The downregulation of photosynthesis under high CO2 levels often leads to decreases in the maximum CO2 assimilation rate (Vcmax), which represents the amount or activity of Rubisco, the most abundant plant protein [51,52,53,54]. In addition, the leaf mass per area (LMA), which correlates with the amount of N allocated to structural proteins [55], often increases under high CO2 [51]. Based on the above idea that NRE may be reduced with a decrease in the ratio of soluble N to structural N in leaves, the response of NRE to high CO2 may be related to this photosynthetic response and the response of LMA in each species.
The sink–source balance, that is, whether the sink capacities for the additional photosynthate are adequate or insufficient for each plant, is one explanation for photosynthetic downregulation under high CO2 [56]. N2 fixers, such as Alnus species with indeterminate growth, are largely independent of soil N, and their photosynthetic activity and growth responses to increased CO2 may be more direct than those of non-N2 fixers [52,57,58]. In previous studies of Manchurian alder (Alnus hirsuta Turcz.), distinct photosynthetic downregulation and a marked increase in LMA were not observed under high-CO2 treatment [59,60]. Moreover, an interactive effect of CO2 and N treatments on the area-based NRE of A. hirsuta was also observed, which decreased under elevated CO2, with only N-deficient soil [59], and only a small change in the NRE of A. hirsuta under high CO2 levels. The response of photosynthetic activity, LMA, and NRE to high CO2 levels in A. hirsuta may support the idea mentioned above.
The two non-N2-fixing deciduous broadleaved tree species Japanese oak (Quercus mongolica var. grosseserrata Blume) and Painted maple (Acer mono Maxim. var. glabrum (Lév. Et Van’t.) Hara), which are representative of mid- and late-successional species, respectively, from the boreal forests of Northeast Asia, express flushing-type phenology (determinate growth). Since species with determinate growth are prone to downregulate photosynthesis due to the sink limitation for photosynthates [56], these two species may clearly downregulate photosynthesis, especially in N-deficient soil conditions, compared to A. hirsuta. As a result, the NRE may be more reduced at high CO2 in Q. mongolica and A. mono than in A. hirsuta.
We hypothesized that NRE would be reduced in Q. mongolica and A. mono under elevated CO2, with a decrease in the ratio of soluble N to structural N in mature leaves, which might be involved in the photosynthetic downregulation and the increased LMA. To test this hypothesis, we evaluated the effects of elevated CO2 and soil N deficiency on the photosynthetic activities, leaf morphology, plant growth, and NRE during senescence in Q. mongolica and A. mono.

2. Materials and Methods

2.1. Plant Material

One-year-old seedlings of Q. mongolica var. grosseserrata Blume and A. mono Maxim. var. glabrum (Lév. Et Van’t.) Hara were obtained from Oji Forestry and Landscaping, Sapporo, Japan, and transplanted individually into free-draining 5 L plastic pots (diameter: 21 cm) filled with 1:1 (v/v) Kanuma pumice and clay loam. Each pot was placed in a tray to prevent nutrient drainage. The initial height of seedlings was 14–18 cm in both species. These species are representative deciduous broadleaved trees of the boreal forests of Northeast Asia; seedlings and adult trees have similar sensitivities to environmental stress [61]. Quercus mongolica is a mid-successional species and a major constituent of mature mixed forests, whereas A. mono is a late-successional species capable of persisting in the forest understory for most of its life. Although Q. mongolica expresses the same flushing-type phenology as A. mono, this species often shows additional shoot elongation when the environment is favorable for growth [62,63]. Quercus mongolica is distributed in convex terrain and on south-facing slopes where it tends to dry out [64] and often forms secondary forests even in poor soil conditions [65]. On the other hand, A. mono is distributed in relatively wet and fertile areas [66].

2.2. Elevated CO2 and Soil N Supply Treatments

Seedlings were placed in a natural daylight phytotron (Koito Industries, Yokohama, Japan) equipped with CO2 concentration controllers (DAIWA Air Co. Ltd., Sapporo, Japan) at Hokkaido Research Center, FFPRI, Sapporo, Japan (43° N, 141° E; 180 m a.s.l.). They were grown with CO2 at 36 Pa (ambient CO2 treatment; it was ambient CO2 at the time of this study) or 72 Pa (elevated CO2 treatment) from mid-May 2001. We set a double CO2 concentration (at that time) as the value corresponding to the CO2 concentration of RCP 6, a scenario with relatively high greenhouse gas emissions [2,3]. Each CO2 treatment was replicated in two chambers; details of the CO2 treatments were described in previous studies [59,67]. Twenty-four seedlings per species were grown in each chamber; 12 seedlings were supplied with N at 52.5 mg N pot1 week1 (high-N treatment), while the other twelve received 5.25 mg N pot1 week1 (low-N treatment) in 0.5 × Hoagland solution [68] (containing 3 mM KNO3, 2 mM Ca(NO3)2/4 H2O, 0.5 mM NH4H2PO4, 2.25 mM KCl, 1.8 mM CaCl2, 0.45 mM KH2PO4, 1 mM MgSO4/7 H2O, 25 µM EDTA-Fe, 4.5 µM MnCl2/4 H2O, 23 µM H3BO3, 0.4 µM ZnSO4/7 H2O, 0.15 µM CuSO4/5 H2O, and 0.007 µM (NH4)6Mo7O24/4 H2O). In the low-N treatment, KCl, CaCl2, and KH2PO4 were added to provide the same concentrations of K+ and Ca2+ as those in the high-N tests. Air temperature was maintained at 26/16 °C (day/night) until August and gradually decreased from 20/10 to 14/10 °C from September to November. Pots were kept in trays with water to avoid desiccation.

2.3. Growth and Biomass Allocation

In order to obtain data of green leaves for calculating NRE along with examining growth responses to CO2 and N, after 100 days of treatment (24 August 2001), the dry masses of leaves, shoots, stems, coarse roots (>2 mm), and fine roots (<2 mm) of six seedlings in each treatment group were determined after drying at 80 °C. The N content of each tissue was determined using a combustion method and an NC analyzer (Sumigraph NC-800; Sumika Chem. Anal. Service, Osaka, Japan). N content of leaves was analyzed separately by elongation order. In addition, total leaf area (LA) was measured, and the leaf area ratio (LAR; LA per whole plant biomass) and top-to-root ratio (T/R ratio; aboveground biomass per root biomass) of each seedling were calculated. Twenty-five seedlings were harvested before treatment to determine the initial mass and RGR (total-W-RGR) of plants. Total-W-RGR for 100 days was calculated using the following equation:
Total-W-RGR = ln(Winitial) − ln(W100day),
where Winitial (g) and W100day (g) represent the initial whole plant weight and 100-day whole plant weight of each plant harvested after 100 days of treatment, respectively.

2.4. Gas Exchange Measurements

Leaf gas exchange was measured in five to seven mature leaves (about 1 month old) from plants in each treatment group using an open gas exchange system (LI-6400; Li-Cor Inc., Lincoln, NE, USA). Both A. mono and Q. mongolica started leaf opening soon after the start of treatment (mid-May). A. mono exhibited secondary elongation from early June, but most individuals did not show tertiary elongation. Q. mongolica exhibited secondary elongation from mid-June and tertiary elongation from late July. However, few individuals in low N exhibited tertiary elongation. Leaf length reached its maximum by about 2 weeks regardless of tree species or treatment, and CO2 and N treatments had no effect on leaf opening rates (data not shown). Mature leaves were measured on days 57–65 and 50–52 for Q. mongolica and A. mono, respectively, with each treatment. Secondary flushed leaves, which were produced under the conditions of each treatment, were used for analyses. For Q. mongolica, we also measured photosynthesis in an additional six to nine mature leaves (secondary elongation leaves aged about 1.5 months) in each treatment group during the tertiary elongation. Light-saturated net photosynthetic rates per LA (Aarea) were measured at both CO2 conditions (36 and 72 Pa CO2) for the immature leaves (about 2 weeks old; data not shown). Full Aarea versus internal CO2 (Ci) curves were determined for mature leaves. Saturating photon flux density at the upper leaf surface was 1200 µmol m−2 s−1, which was determined based on light–response curves of photosynthetic rates (data not shown). Each curve consisted of the following seven steps: 2000, 1500, 720, 360, 200, 100, and 50 µmol of CO2 mol−1. Leaf temperature was maintained at 25 °C, and the leaf-to-air vapor pressure saturation deficit was maintained below 1.2 kPa. The Vcmax and the maximum electron transport rate (Jmax) were calculated with the ‘fitaci’ function (‘plantecophys’ package, R version 4.0.3. [69]) proposed by Duursma [70], which uses the Farquhar, von Caemmerer, and Berry model [71]. The coefficients of temperature dependence of Vcmax and Jmax were taken from the values of Quercus and Acer species in Dreyer [72].

2.5. Leaf Characters

After measuring gas exchange, leaf area was measured using an LA meter (LI-3000A; Li-Cor Inc.), and soil plant analysis development (SPAD) values, an indicator of chlorophyll content, were also measured (SPAD 502, MINOLTA, Osaka, Japan). LMA was measured after drying at 80 °C for 48 h, and then the Nmass was determined using the NC analyzer mentioned above. In this paper, LMA was used as an indicator of structural N. On the other hand, since LMA is also affected by contents other than N, we measured total nonstructural carbohydrate (TNC), which affects the photosynthetic response to elevated CO2, as one of them. Soluble sugars and starch contents were measured, and TNC was calculated as the sum of these contents. Using a grounded leaf sample, soluble sugars were extracted with 80% ethanol and then determined via the phenol–sulfuric acid method [73]. Starch in the residue was solubilized by potassium hydroxide and then digested to glucose with an amyloglucosidase (A9228; Sigma-Aldrich, St. Louis, MO, USA) solution. The digested glucose was determined with the Wako Auto Kit Glucose (439–90901; Wako Pure Chemical Industries Ltd., Osaka, Japan).
Nitrogen allocation within leaves was assumed to be one of the factors influencing NRE, and the results of gas exchange measurements were used for indirect estimation of leaf N partitioning within leaves. The model proposed by Niinemets and Tenhunen [74] was used to determine the coefficient for leaf N partitioning to carboxylation capacity (mainly Rubisco; Fr: g N in Rubisco (g total leaf N)−1) and the coefficient of allocation of leaf N to energy transfer (i.e., bioenergetic pools; Fb: g N in cytochrome f, ferredoxin NADP reductase, and coupling factor (g total leaf N)−1). Fr and Fb were calculated using the follow equations:
Fr = Vcmax/(6.25 Vcr LMA Nmass),
Fb = Jmax/(8.06 Jmc LMA Nmass),
where Vcr is the specific activity of Rubisco: for 20.5 µmol CO2 (g Rubisco)−1 s−1 (25 °C) [75], 6.25 (g Rubisco (g N in Rubisco)−1) converts N content to protein content; and Jmc is the photosynthetic electron transfer capacity per unit of cytochrome f: for 156 mol e (mol cyt f)−1 s−1 (25 °C), 8.06 (µmol cyt f.) converts N content to energy transfer [76]. Although Frak et al. [77] suggested that this method possibly leads to underestimation, we used these parameters as indicators for the allocation ratio of N to Rubisco (e.g., [78]).

2.6. N Resorption Efficiency before Senescence

Leaf litter from each individual, which was remaining after 100 days sampling, was collected daily as leaves abscised from October to November. The onset of defoliation began in mid-October and ended in early to mid-November for both tree species. LMA and Nmass were determined in each senescent leaf as well as in leaves of the harvested seedlings after 100 days of treatment. Leaf litter data were calculated for each individual plant. NRE was calculated using the following equation [30,79,80,81]:
NRE = 100 (NgNs)/Ng,
where Ng represents the average N in the green leaves of each plant harvested after 100 days of treatment, and Ns represents the average N in senescent leaves. We calculated the NRE both on a mass basis (NREmass) and on an area basis (NREarea) because leaf weight had decreased at the time of leaf shedding due to the resorption of mobile carbohydrates and nutrients [30,79]. Recent studies on mass-based NRE used a mass loss correction factor, which was determined from leaf mass loss during senescence, to prevent nutrient resorption underestimation [36,38]. NREarea in this study corresponds to the corrected mass-based NRE value. Leaching of N from leaves was assumed to be minimal [82].

2.7. Statistical Analysis

Two-way ANOVA for split-plot designs was used to evaluate the effects of CO2 and N treatments on gas exchange (Vcmax and Jmax), growth properties, green leaf characteristics, fallen leaf characteristics, and NRE; the probability level was set at p < 0.05, and analyses were conducted in R version 4.0.3 [69]. A linear mixed model was applied to analyze the Vcmax and Jmax, with Narea, CO2, species, and the interaction of CO2 and species as fixed factors, and the chamber as a random effect. A linear mixed model was also applied to analyze the NREarea, NREmass, LMA, and Fr + Fb with CO2, N, species, and their interactions as fixed factors, and the chamber as a random effect. We used the lmer function of the R package lme4, and the ANOVA function of the R package car.

3. Results

3.1. Growth Responses of Q. mongolica and A. mono Seedlings to CO2 and N Treatments

The 100-day relative growth rate of the whole plant weight (total-W-RGR) showed significant effects of CO2 (p < 0.05) and N treatments (p < 0.001) in Q. mongolica, and an enhanced whole plant biomass was observed under elevated CO2 and under high N (Table S1). However, the total-W-RGR of A. mono was not influenced by both CO2 and N treatment. In Q. mongolica, elevated CO2 had a negative effect on LAR (p < 0.05). N treatments also had an effect on LAR in Q. mongolica and A. mono, with LAR in Q. mongolica and in A. mono decreasing (p < 0.01) and increasing (p < 0.05) at low N, respectively. The T/R ratio was not influenced by CO2 treatments in either species, but it decreased under low N in Q. mongolica (p < 0.001).

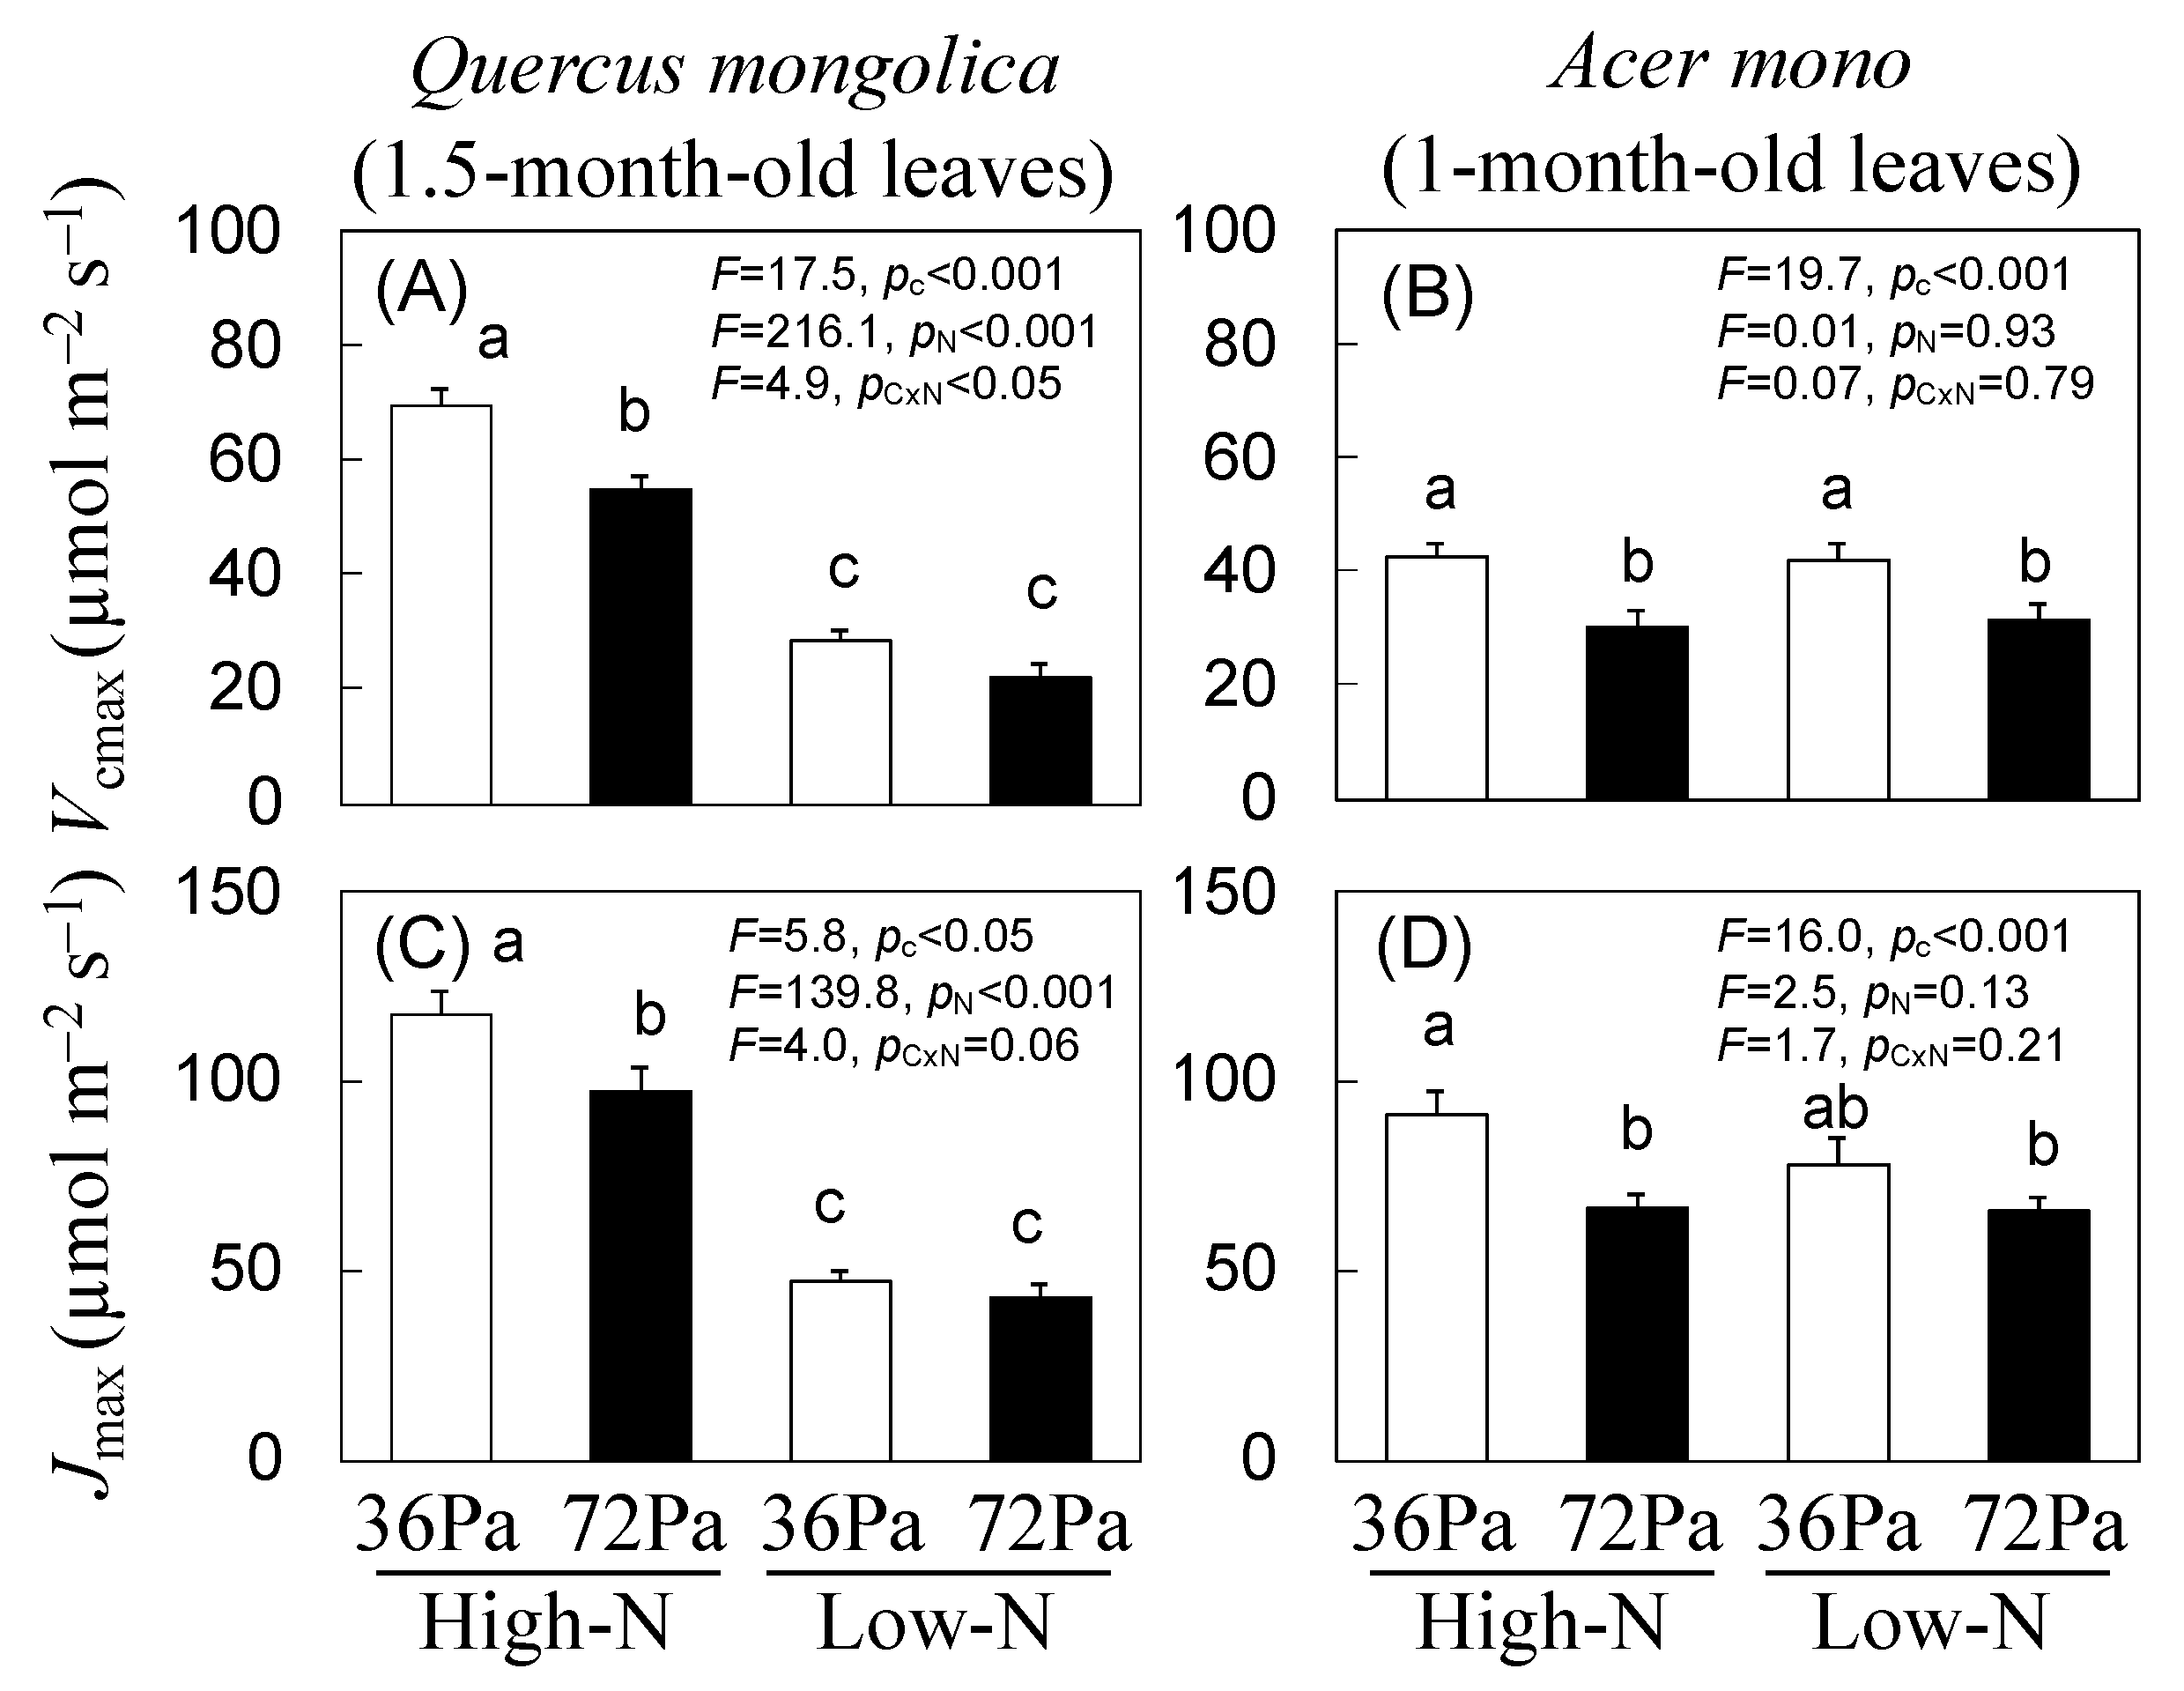
3.2. Maximum Carbon Fixation Rate (Vcmax) and Maximum Electron Transfer Rate (Jmax) of Q. mongolica and A. mono Seedlings under CO2 and N Treatments

In A. mono (1-month-old leaves), both the Vcmax and Jmax showed an effect of CO2 treatment and decreased under elevated CO2 compared with these rates under ambient CO2 conditions, but they showed no effect of N treatments (Figure 1B,D). In 1-month-old leaves of Q. mongolica, Jmax was not affected by CO2 treatment, and only Vcmax was decreased by elevated CO2 and low N (data not shown). On the other hand, in 1.5-month-old leaves of Q. mongolica, both Vcmax and Jmax were reduced by elevated CO2 and low N, but Vcmax showed an interactive effect of N and CO2 treatments (Figure 1A,C). These results indicate that the leaf age, which clearly showed the downregulation of photosynthesis, was different between A. mono (1-month-old leaves) and Q. mongolica (1.5-month-old leaves).

3.3. Characteristics of Green Mature Leaves of Q. mongolica and A. mono Seedlings under CO2 and N Treatments

In Q. mongolica (1.5-month-old leaves) and A. mono (1-month-old leaves), the Nmass of leaves decreased with high CO2 (p < 0.01 and p < 0.05, respectively) and low N (p < 0.001 and p < 0.01, respectively), whereas LMA increased under elevated CO2 compared to under ambient CO2, regardless of N treatments (p < 0.001 and p < 0.01, respectively; Table 1). As a result, in Q. mongolica and A. mono, the Narea decreased under low N compared to under high N (p < 0.001 for both). However, no significant effect of CO2 treatment on Narea (p > 0.05) was observed. SPAD values decreased in Q. mongolica under low N (p < 0.001) and in A. mono under elevated CO2 (p < 0.05). The concentration of TNC in mature leaves increased significantly with elevated CO2 in Q. mongolica (1.5-month-old leaves, p < 0.05) and in A. mono (p < 0.01). There was no significant change in the soluble sugar concentration, and the increase in the starch concentration corresponded to the change in the TNC concentration. In Q. mongolica, the TNC concentration was higher in the low-N treatment than in the high-N treatment. The characteristics of the 1-month-old leaves of Q. mongolica differed from those of the 1.5-month-old leaves only in the fact that the TNC was not affected by the CO2 and N treatments.

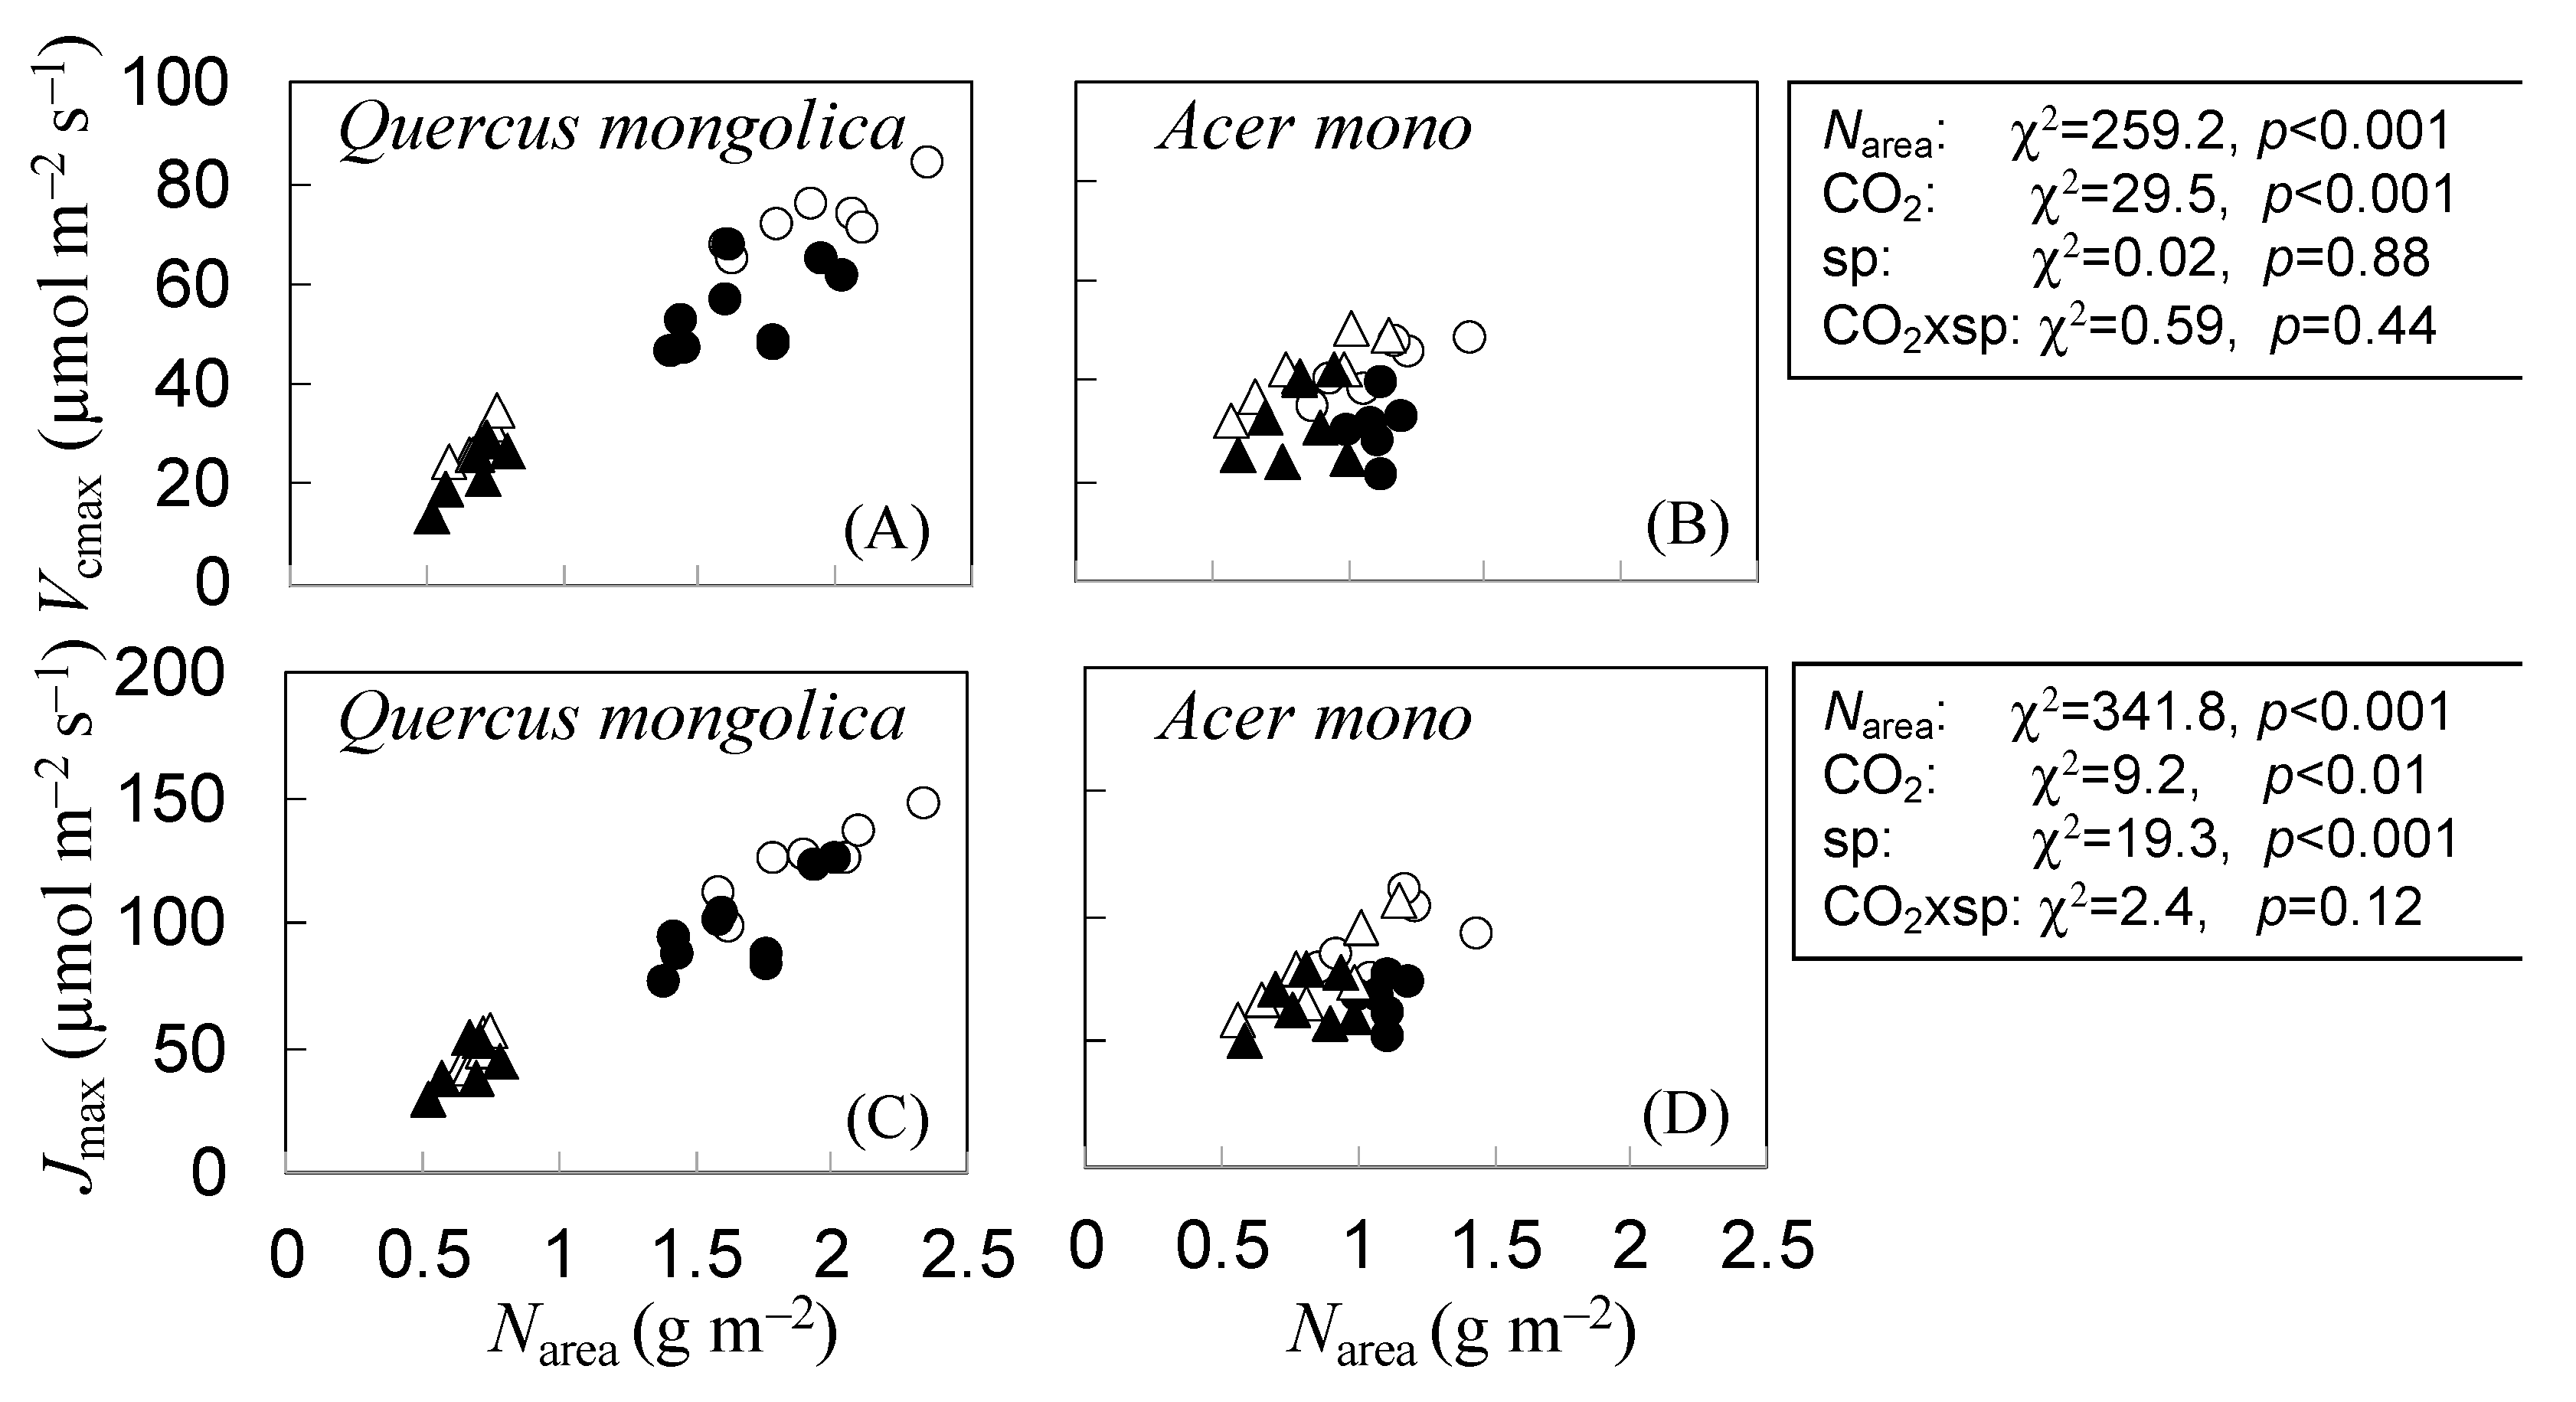
3.4. Indirect Estimation of N Partitioning within Leaves of Q. mongolica and A. mono Seedlings under CO2 and N Treatments

When the two N treatments were analyzed together, the relationship between the Narea and Vcmax of Q. mongolica (1.5-month-old leaves) and A. mono (1-month-old leaves) was affected by CO2 treatment but not by species, and Vcmax for Narea decreased 10.6 µmol m−2 s−1 under elevated CO2 compared with under ambient CO2 (Figure 2A,B). The relationship between Narea and Jmax was affected by CO2 treatment and by species, and Jmax for Narea decreased by 17.1 µmol m−2 s−1 under elevated CO2 and was 17.3 µmol m−2 s−1 lower in Q. mongolica than in A. mono (Figure 2C,D). The partitioning of N to the photosynthetic function within leaves, i.e., Fr and Fb, which were estimated from Vcmax and Jmax, was affected by CO2 treatment in both species and by N treatment only in A. mono (Table 2). Fr and Fb were significantly decreased by elevated CO2 in Q. mongolica (1.5-month-old) and in A. mono and were increased under low N in A. mono. The characteristics of the 1-month-old leaves of Q. mongolica differed from those of the 1.5-month-old leaves only in the fact that Fb was not affected by the CO2 treatments. The total ratio of N allocation to the photosynthetic function, i.e., Fr + Fb, showed similar responses to the CO2 and N treatments to each parameter (Fr, Fb), for each species. Photosynthetic N use efficiency (PNUE) to Ci decreased under elevated CO2 and increased under low N in A. mono (ANOVA; F = 8.4, p < 0.01 and F = 7.5, p < 0.05, respectively), and it decreased under elevated CO2 in the older (1.5-month-old) leaves of Q. mongolica (ANOVA; F = 17.5, p < 0.001).

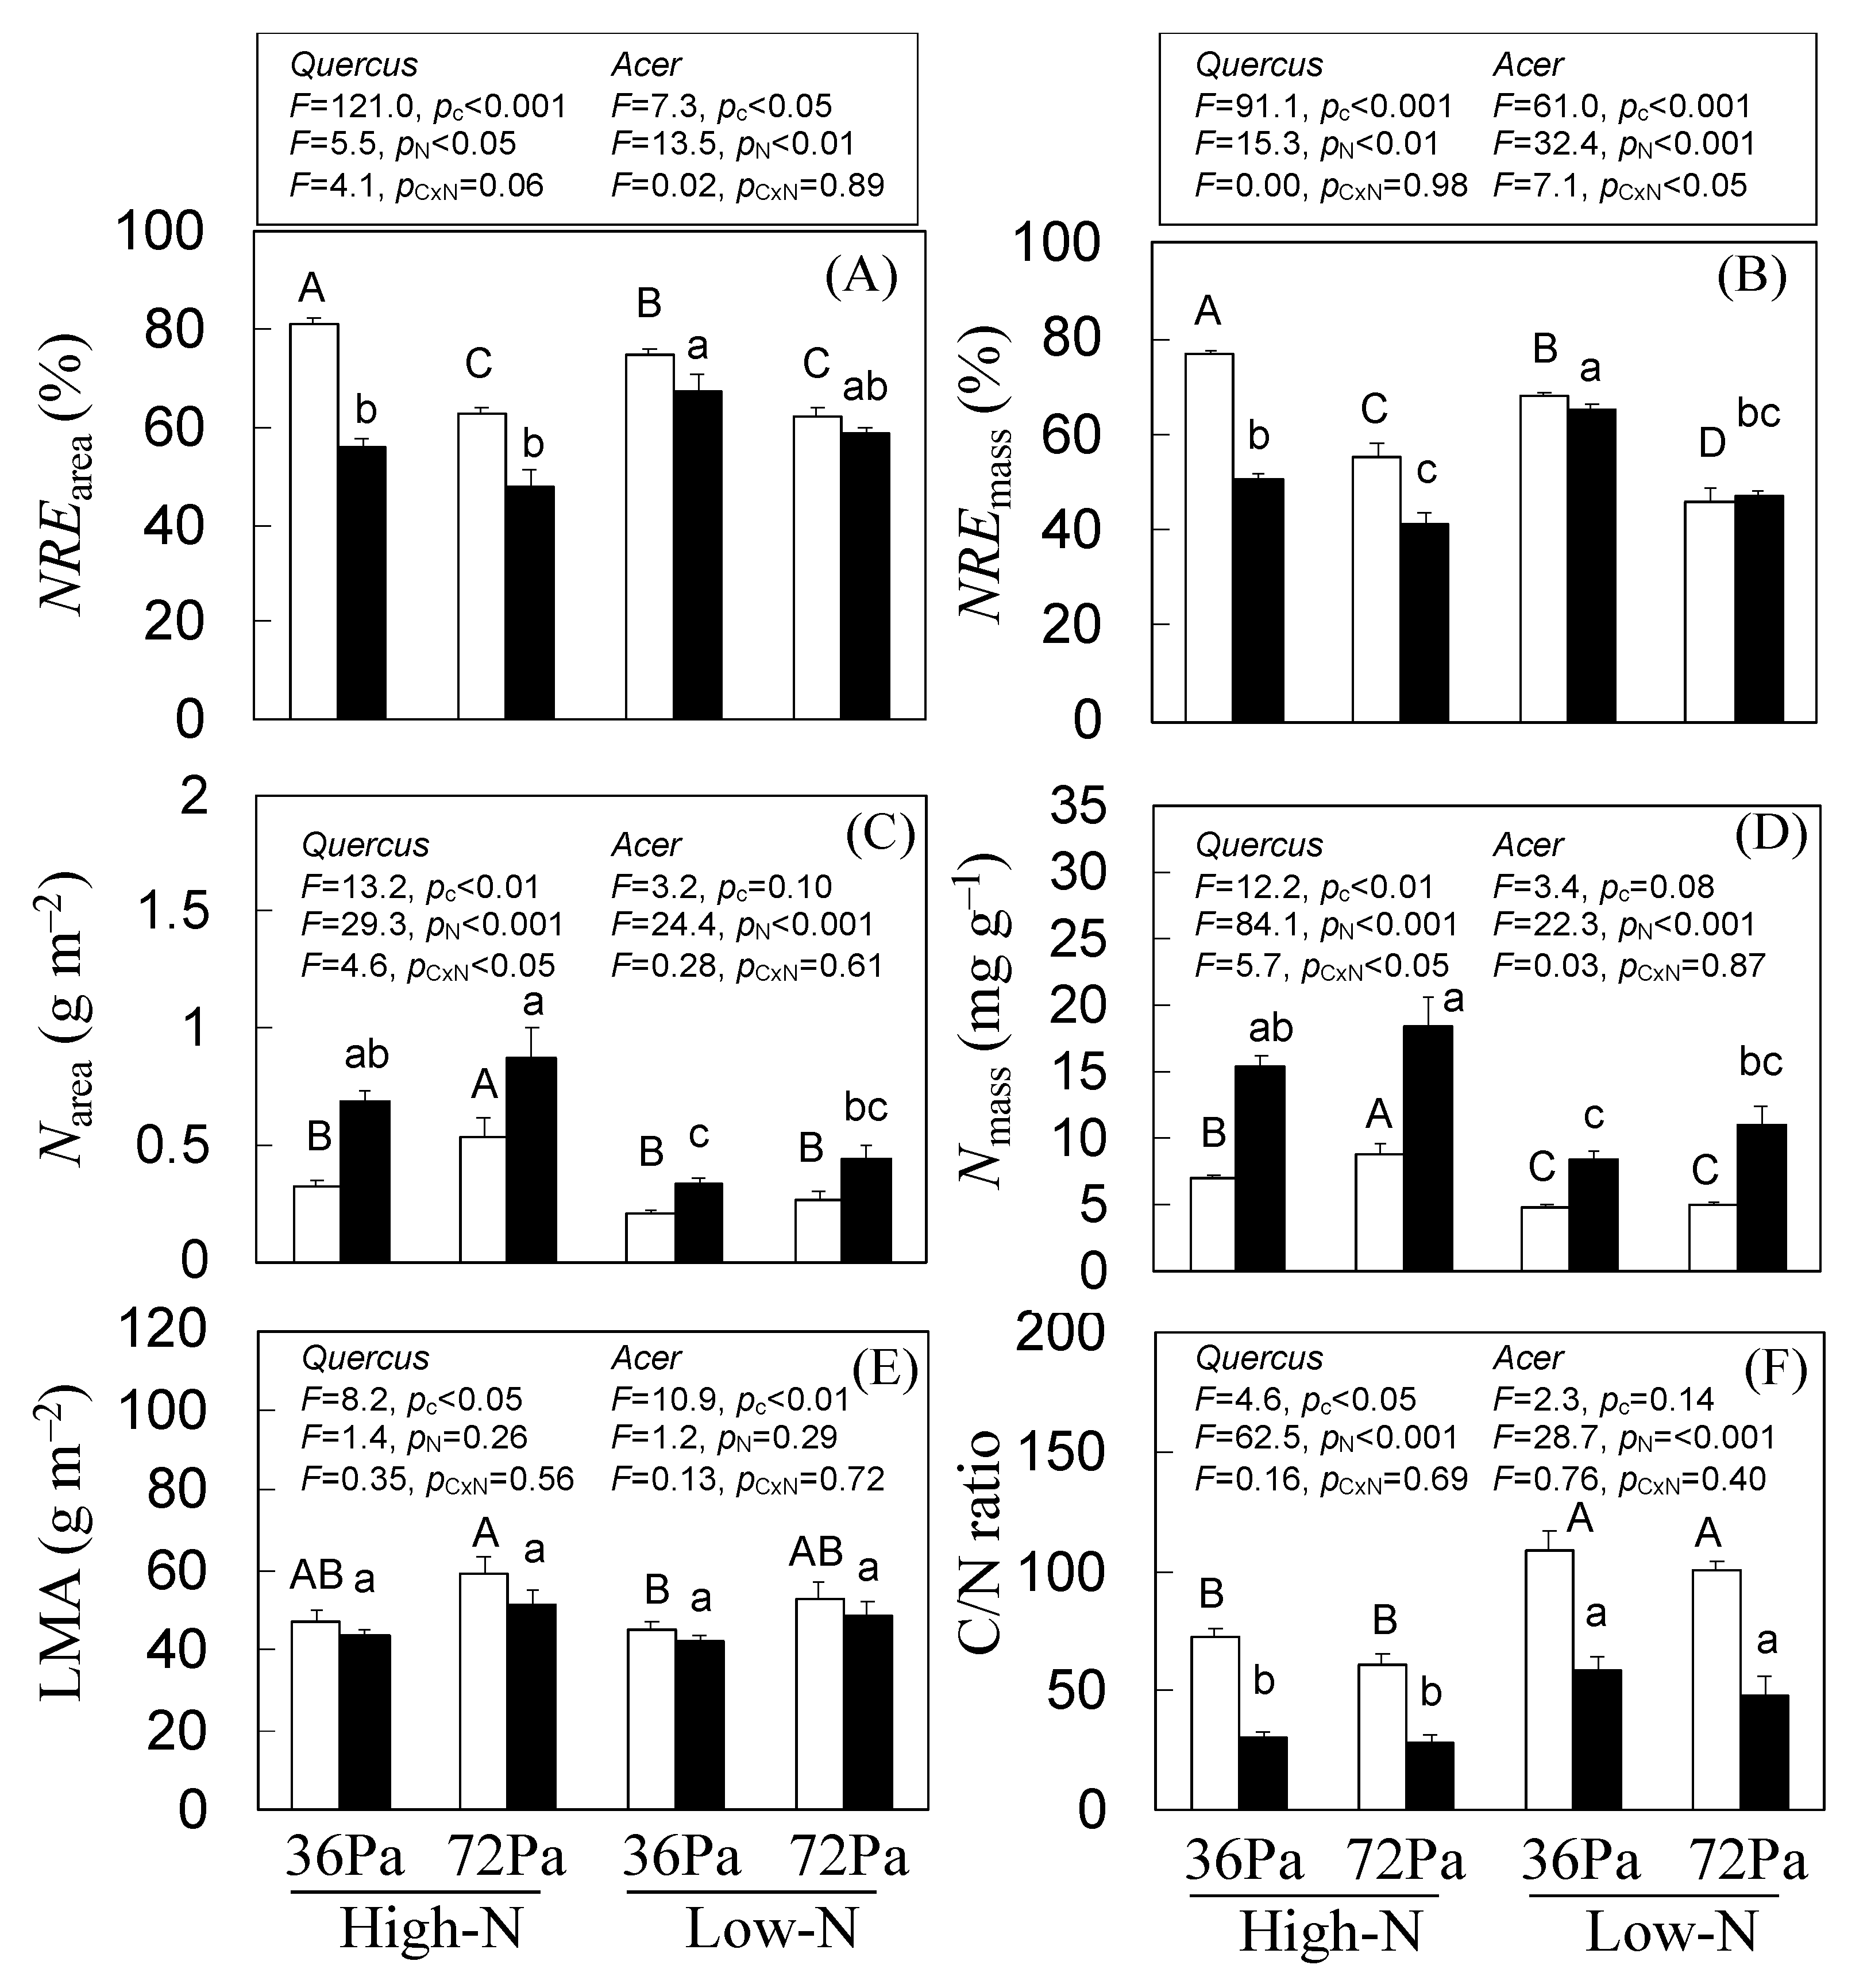
3.5. N Resorption Efficiency of Q. mongolica and A. mono Seedlings under CO2 and N Treatments

In both species, NREarea and NREmass decreased under elevated CO2 levels relative to NREarea and NREmass under ambient CO2 conditions, respectively (Figure 3A,B). The responses of NREarea and NREmass to N treatment differed in the two species. The NREarea of Q. mongolica was affected by CO2 and N treatments, with a decrease under elevated CO2 compared to ambient CO2 (−18.7%) and under low N compared to high N (−6.3%; Figure 3A). The NREarea of A. mono was also affected by CO2 and N treatments, with a decrease under elevated CO2 (−7.7%), but, unlike Q. mongolica, it increased under low N (+11.4%). The NREmass of Q. mongolica also significantly decreased under elevated CO2 (−21.8%) and under low N (−8.9%; Figure 3B). The NREmass of A. mono showed interactive effects for CO2 and N treatments, with a tendency to decrease under elevated CO2 (−9.0%) and to increase under low N (+14.7%). The LMA of senesced leaves increased with elevated CO2 in both species, regardless of the N treatment (Figure 3E). The Nmass of senesced leaves in Q. mongolica showed interactive effects for CO2 and N treatments, with a tendency to increase under elevated CO2, and to decrease under low N (Figure 3D). Meanwhile, the Nmass of A. mono was not significantly affected by CO2 treatment but was affected by N treatment, with a decrease under low-N conditions. The Narea of the senesced leaves showed similar responses to those of Nmass (Figure 3C). The C/N ratio of senesced leaves decreased with elevated CO2 in Q. mongolica and increased with low N in both species (Figure 3F).

4. Discussion

4.1. N Content in Senesced Leaves of Q. mongolica and A. mono Seedlings Showed No Decline under Elevated CO2 Regardless of N Conditions

Elevated CO2 can change leaf litter biomass and chemistry (N content, C/N ratio, lignin/N ratio, etc.), which can, in turn, affect the decomposition rate of leaf litter, e.g., by microbiology [13,26,83], and may also influence the availability of N that can be absorbed by trees [46,84,85]. Many tree species have been reported to show decreased N concentrations in green leaves under elevated CO2 conditions [13,14]. In our study, the Nmass of senesced leaves decreased under low N in both species and showed an increase (Q. mongolica) or no effect (A. mono) by elevated CO2. As a result, the C/N ratio of senesced leaves did not increase with elevated CO2 in both species, though it increased with low N in both species. These results support the finding that leaf litter N content shows little or no decline under elevated CO2 [86] but do not support the litter quality hypothesis [18]. Similarly, elevated CO2 has little or no effect on the N content in the leaf litter of Quercus rubra [21]. On the other hand, Acer rubrum [22,23] and Tilia americana [47] show a decline in N in senescent leaves under elevated CO2 conditions. Therefore, the question remains, why does high CO2 have no clear effect on the Nmass of leaf litter while tending to cause Nmass to decrease in green leaves in our study?

4.2. N Resorption Efficiency of Q. mongolica and A. mono Seedlings under CO2 and N Treatments

Nutrient resorption varies greatly among plant species, functional types [36,37,87], plant age [33,34], and numerous abiotic factors, such as soil N availability [30,31], N additions [32], and climate zone (mean annual precipitation and latitude). Nutrient resorption can both increase [22,23,43,46,47] and decrease [16,39,40,41] under increasing CO2 conditions. Furthermore, it has been reported that elevated CO2 had no effect on N resorption in Quercus rubra [21] and other species [22,42,43,44,45,88]. In the present study, NRE was evaluated as both per leaf mass and per leaf area; the NRE during defoliation of Q. mongolica and A. mono decreased under elevated CO2 in both cases, though in A. mono, the NREmass displayed interactive effects of CO2 and N. During defoliation, leaf weight loss (mass resorption) occurs and LMA decreases; hence, it is desirable to evaluate NRE per unit leaf area [30,36,38,89]. In the present study, NREarea was 5.3% higher in A. mono and 4.6% higher in Q. mongolica than NREmass, although there was an interactive effect between N and CO2 treatment and the assessment method in Q. mongolica (GLMM, p < 0.05). The NREarea of Q. mongolica ranged from 62% to 81%, and A. mono ranged from 48% to 67%, both of which are equal to or higher than the range of values reported for several species [23,24,37,87,90]. It has been well documented that NRE is higher under poor nutritional status [30,31], and that A. mono also had higher NRE at low N, independent of CO2 conditions. Lower NRE values during defoliation under high CO2 may have obscured the effect of high CO2 on the Nmass of senescent leaves, despite the Nmass of green leaves showing a downward trend under high CO2. Another question therefore arises: why did NRE decrease under high CO2 condition?

4.3. Relationship between NRE and N Partitioning within Leaves of Q. mongolica and A. mono Seedlings under CO2 and N Treatments

N is distributed in leaves among structural and metabolic proteins [55,91]; the ratio of soluble to structural N is considered one of the most important factors controlling NRE [40]. N allocated to structural proteins is used, for example, in cell walls and is not easily reabsorbed [49,91,92,93]. LMA correlates not only with the thickness [94] and amount of material [95,96] in the cell wall but also with the amount of intraleaf N allocated to structural proteins [55]. In mature leaves, LMA often increases under high CO2 [51]; this was also shown in our study, in which LMA increased in mature leaves under elevated CO2 in both Q. mongolica (+6.7 g m−2) and A. mono (+8.5 g m−2). Thus, we infer that the N allocation to structural proteins may also be larger with increased CO2 in both species. However, the increase in LMA was also influenced by the increase in starch under elevated CO2, and in our study, area-based TNC increased by +4.1 g m−2 in Q. mongolica and +3.7 g m−2 in A. mono under elevated CO2 conditions. These results indicate that an increase in LMA does not necessarily mean that structural N increased in mature leaves.
N allocated to metabolic proteins, many of which are enzymes associated with photosynthesis [48], is easily degraded and reabsorbed during leaf senescence [49,50]. The most abundant plant protein is Rubisco, an enzyme of the photosynthetic system, which accounts for 15–30% of all proteins in C3 plant leaves [48,76]. Downregulation of photosynthesis under high CO2 often leads to a decrease in the amount of Rubisco or in Vcmax, which represents the activity of Rubisco [51,52,53]. In our study, both Vcmax and Jmax decreased under high CO2 in mature Q. mongolica (1.5-month-old) and A. mono (1-month-old) leaves. In addition, the sum of the allocation ratios (Fr, Fb) of the N fractions to the Rubisco and the electron transfer system also decreased significantly in both species under high CO2 levels. These results imply a decrease in the allocation of N to metabolic proteins under elevated CO2 and suggest that this decrease influences the decrease in NRE at high CO2 in the mature leaves of both species. A similar relationship between changes in the N allocation ratio to metabolic proteins and NRE is suggested by the fact that the sum of the allocation ratios (Fr, Fb) and NRE in mature A. mono leaves increased in low-N conditions. The PNUE has been suggested to be relatively low in tree species with higher allocations to structural non-photosynthetic elements in leaf N [97]. The reduction in the N allocation to metabolic proteins under high CO2 may also be suggested by the reduced PNUE (without increased SPAD) response of both species under elevated CO2 conditions. Overall, these results suggest that the photosynthetic response to high CO2 and low N affects NRE through N allocation in the leaves. When the sum of the N allocation ratio, Fr + Fb, was used as an index of soluble (metabolic) N, and LMA was used as an index of structural N, the results support the hypothesis that NRE may decrease through changes in the leaf ratio of soluble N to structural N under high CO2 [16,39,40,41] in both Q. mongolica and A. mono.

4.4. Response of NRE with N2 Fixer and Non-N2 Fixer (Q. mongolica and A. mono) to CO2 and N Treatments

The photosynthetic activity and growth responses of N2 fixers to increased CO2 may be more direct than those of non-N2 fixers [52,57,58]. The NRE of N2 fixers under ambient CO2 conditions is usually lower than that of non-N2 fixers [36,38]. We previously reported that in an N2 fixer, Alnus hirsuta, NREmass was not affected by elevated CO2, regardless of N conditions, while NREarea tended to decrease under elevated CO2 with low N levels [59]. Moreover, only Vcmax for Narea decreased with elevated CO2 in A. hirsuta (Figure S1), and, in the allocation ratios (Fr, Fb) of the N fractions within the leaves, only Fr decreased with elevated CO2 in A. hirsuta (Table S2), with the sum of Fr and Fb showing no effect of the elevated CO2. These results also suggest that there may be an association between the lower reduction in the N allocation to metabolic proteins at high CO2 and the unclear response in NRE. In A. hirsuta, the increase in LMA of mature leaves was also small under elevated CO2 [59,60]. Overall, the allocation of N to metabolic system proteins under high CO2 seems to be largely reduced in Q. mongolica and A. mono compared with A. hirsuta under the same conditions. The two non-N2 fixers, Q. mongolica and A. mono, may be more prone to photosynthetic downregulation under high CO2 than the N2 fixer A. hirsuta, resulting in lower N allocation ratios to metabolic proteins within leaves and a distinct decrease in NRE at elevated CO2 conditions. We speculate that these interspecific differences in N allocation responses to elevated CO2 may affect not only the photosynthetic response of mature leaves but also the changes in NRE.

4.5. Phtosynthetic Responses of Q. mongolica and A. mono Seedlings under CO2 and N Treatments

In the present study, the magnitude of the decrease in photosynthetic activity under elevated CO2 differed among leaf maturation stages and between tree species. In Q. mongolica and A. mono, downregulation of photosynthesis occurred earlier in A. mono (in 1-month-old leaves) than in Q. mongolica (in 1.5-month-old leaves). Furthermore, A. mono showed a decrease in photosynthetic capacity even with high N levels, suggesting that N deficiency was not the only cause of the decreased photosynthetic capacity with high CO2 levels. Since a genetic limitation of leaf opening, such as a determinant growth pattern, can accelerate the downregulation of photosynthesis [51,52], we considered the possibility that the sink limit was caused by the simultaneous leaf opening nature of A. mono. It is possible that the plasticity of the leaf opening style of Q. mongolica, which is more prone to tertiary elongation under different growth conditions than that of A. mono, led to a larger sink that affected the high CO2 response. Since, contrary to expectations, photosynthesis was also downregulated during tertiary elongation in Q. mongolica, and an accumulation of starch was observed in the leaves under high CO2, we suggest that the source–sink balance could not be regulated by tertiary elongation alone.

4.6. Evaluation Method of N Resorption Efficiency

When evaluating NRE, the experimental setup and sampling method can influence the results [22,92]. In our study, we used a phytotron and did not fix the position of collecting mature and fallen leaves in the same individual; therefore, it is possible that we artificially influenced the assessment of the N concentration in fallen leaves and NRE during defoliation. Killingbech [29] used a N concentration of 1% in fallen leaves as an indicator of incomplete resorption. On the other hand, Norby et al. [16] showed that the effect of high CO2 was significant when the N concentration of fallen leaves exceeded 1%. In the present study, the average N concentration of leaf litter was sometimes higher than 1% in A. mono, and thus we cannot exclude the possibility that N resorption was incomplete. Although there is no unified view on the response of NRE to high CO2, the results of this experiment are useful for considering material cycling under high-CO2 conditions.

5. Conclusions

The mature leaves of two non-N2-fixing deciduous broadleaved tree species, Q. mongolica and A. mono, showed clear photosynthetic downregulation under elevated CO2 conditions. In addition, the range of change in the LMA of green leaves from Q. mongolica and A. mono was greater under elevated CO2. These differences in photosynthetic (Vcmax and Jmax) and morphological (LMA) responses to elevated CO2 may affect NRE during defoliation via N allocation changes within leaves. Overall, these results support the hypothesis that NRE is reduced in Q. mongolica and A. mono under elevated CO2, with a decrease in the ratio of soluble N to structural N in mature leaves. In addition, these results also suggest that NRE in the non-N2 fixers Q. mongolica and A. mono responds to elevated CO2 in a different manner than the NRE of the N2 fixer A. hirsuta, in part because of differences in the plants’ photosynthetic activities. We speculate that these interspecific differences in N allocation responses to elevated CO2 may affect not only the photosynthetic response of mature leaves but also the changes in NRE.

Supplementary Materials

The following are available online at https://www.mdpi.com/article/10.3390/f12081034/s1: Figure S1: Relationship between area-based leaf N content (Narea) and maximum carbon fixation rate (Vcmax) (A) and maximum electron transfer rate (Jmax) (B) of Alnus hirsuta; Table S1: Relative growth rate of whole plant weight (total-W-RGR), leaf area ratio (LAR), leaf weight ratio (LWR), fine root ratio (fine RWR/RW), and T/R ratio in Quercus mongolica (Quercus) and Acer mono (Acer); Table S2: Allocation of the coefficient of leaf N to carboxylase reactions (Fr: g N in Rubisco (g total leaf N)1) and to bioenergetic pools (Fb; g N in cytochrome f, ferredoxin NADP reductase, and coupling factor (g total leaf N)1) in Alnus hirsuta.

Author Contributions

H.T. and M.K. designed the research and collected the photosynthetic data. H.T., M.K., A.U. and H.U. performed the data analysis. H.T. led the writing. All authors have read and agreed to the published version of the manuscript.

Funding

This research was funded, in part, by the Program for Promotion of Basic and Applied Research for Innovations in Bio-oriented Industry (BRAIN), a Grant-in-Aid for Research Revolution 2002 (RR2002) Project from the Ministry of Education, Culture, Sports, Science and Technology, Japan, and by JSPS KAKENHI Grant Number JP20H03036.

Data Availability Statement

The data presented in this study are available within the article and its Supplementary Materials.

Acknowledgments

We thank H. Taoka and K. Mima for their help in sampling and technical assistance. We also thank Y. Maruyama, K. Kitayama, M. Tani, and A. Osawa for their helpful comments for this study.

Conflicts of Interest

The authors declare no conflict of interest.

References

  1. IPCC. Climate change 2007: Impacts, adaptation and vulnerability. In Contribution of Working Group II to the Fourth Assessment Report of the Intergovernmental Panel on Climate Change; Parry, M.L., Canziani, O.F., Palutikof, J.P., van der Linden, P.J., Hanson, C.E., Eds.; Cambridge University Press: Cambridge, UK, 2007. [Google Scholar]
  2. IPCC. Climate Change 2013: The Physical Science Basis. In Contribution of Working Group I to the Fifth Assessment Report of the Intergovernmental Panel on Climate Change; Stocker, T.F., Qin, D., Plattner, G.-K., Tignor, M., Allen, S.K., Boschung, J., Nauels, A., Xia, Y., Bex, V., Midgley, P.M., Eds.; Cambridge University Press: Cambridge, UK; New York, NY, USA, 2013; p. 1535. [Google Scholar]
  3. van Vuuren, D.P.; Edmonds, J.; Kainuma, M.; Riahi, K.; Thomson, A.; Hibbard, K.; Hurtt, G.C.; Kram, T.; Krey, V.; Lamarque, J.F.; et al. The representative concentration pathways: An overview. Clim. Chang. 2011, 109, 5–31. [Google Scholar] [CrossRef]
  4. Ainsworth, E.A.; Lemonnier, P.; Wedow, J.M. The influence of rising tropospheric carbon dioxide and ozone on plant productivity. Plant Biol. 2020, 22, 5–11. [Google Scholar] [CrossRef] [Green Version]
  5. Norby, R.J.; Warren, J.M.; Iversen, C.M.; Medlyn, B.E.; McMurtrie, R.E. CO2 enhancement of forest productivity constrained by limited nitrogen availability. Proc. Natl. Acad. Sci. USA 2010, 107, 19368–19373. [Google Scholar] [CrossRef] [Green Version]
  6. Zak, D.R.; Pregitzer, K.S.; Kubiske, M.E.; Burton, A.J. Forest productivity under elevated CO2 and O3: Positive feedbacks to soil N cycling sustain decade-long net primary productivity enhancement by CO2. Ecol. Lett. 2011, 14, 1220–1226. [Google Scholar] [CrossRef] [Green Version]
  7. Sigurdsson, B.D.; Medhurst, J.L.; Wallin, G.; Eggertsson, O.; Linder, S. Growth of mature boreal Norway spruce was not affected by elevated [CO2] and/or air temperature unless nutrient availability was improved. Tree Physiol. 2013, 33, 1192–1205. [Google Scholar] [CrossRef] [Green Version]
  8. Walker, A.P.; De Kauwe, M.G.; Medlyn, B.E.; Zaehle, S.; Iversen, C.M.; Asao, S.; Guenet, B.; Harper, A.; Hickler, T.; Hungate, B.A.; et al. Decadal biomass increment in early secondary succession woody ecosystems is increased by CO2 enrichment. Nat. Commun. 2019, 10, 454. [Google Scholar] [CrossRef] [PubMed]
  9. Terrer, C.; Jackson, R.B.; Prentice, I.C.; Keenan, T.F.; Kaiser, C.; Vicca, S.; Fisher, J.B.; Reich, P.B.; Stocker, B.D.; Hungate, B.A.; et al. Nitrogen and phosphorus constrain the CO2 fertilization of global plant biomass. Nat. Clim. Chang. 2019, 9, 684–689. [Google Scholar] [CrossRef] [Green Version]
  10. Klein, T.; Bader, M.K.-F.; Leuzinger, S.; Mildner, M.; Schleppi, P.; Slegwolf, R.T.W.; Körner, C. Growth and carbon relations of mature Picea abies trees under 5 years of free-air CO2 enrichment. J. Ecol. 2016, 104, 1720–1733. [Google Scholar] [CrossRef] [Green Version]
  11. Terrer, C.; Vicca, S.; Stocker, D.; Hungate, B.A.; Phillips, R.P.; Reich, P.B.; Finzi, A.C.; Prentice, I.C. Ecosystem responses to elevated CO2 governed by plant–soil interactions and the cost of nitrogen acquisition. New Phytol. 2018, 217, 507–522. [Google Scholar] [CrossRef] [Green Version]
  12. Yoon, T.K.; Noh, N.J.; Lee, S.H.J.; Son, Y. Soil moisture effects on leaf litter decomposition and soil carbon dioxide efflux in wetland and upland forests. Soil Sci. Soc. Am. J. 2014, 78, 1804–1816. [Google Scholar] [CrossRef]
  13. Parsons, W.F.J.; Bockheim, J.G.; Lindroth, R.L. Independent, interactive, and species-specific responses of leaf litter decomposition to elevated CO2 and O3 in a northern hardwood forest. Ecosystems 2008, 11, 505–519. [Google Scholar] [CrossRef]
  14. Liu, L.L.; King, J.S.; Booker, F.L.; Giardiana, C.P. Enhanced litter input rather than changes in litter chemistry drive soil carbon and nitrogen cycles under elevated CO2: A microcosm study. Glob. Chang. Biol. 2009, 15, 441. [Google Scholar] [CrossRef]
  15. Cha, S.; Chae, H.M.; Lee, S.H.; Shim, J.K. Effect of elevated atmospheric CO2 concentration on growth and leaf litter decomposition of Quercus actissima and Fraxinus rhynchophylla. PLoS ONE 2017, 12, e01171197. [Google Scholar] [CrossRef] [Green Version]
  16. Norby, R.J.; Cotrufo, M.F.; Ineson, P.; O’Neill, E.G.; Canadell, J.G. Elevated CO2, litter chemistry, and decomposition: A synthesis. Oecologia 2001, 127, 153–165. [Google Scholar] [CrossRef] [PubMed]
  17. Cotrufo, M.F.; Ineson, P.; Scott, A. Elevated CO2 reduces the nitrogen concentration of plant tissues. Glob. Chang. Biol. 2010, 4, 43–54. [Google Scholar] [CrossRef]
  18. Strain, B.R.; Bazzaz, F.A. Terrestrial plant communities. In CO2 and Plants; Lemon, E.R., Ed.; Westview Press: Boulder, CO, USA, 1983; pp. 177–222. [Google Scholar]
  19. Curtis, P.S.; Wang, X. A meta-analysis of elevated CO2 effects on woody plant mass, form, and physiology. Oecologia 1998, 113, 299–313. [Google Scholar] [CrossRef] [PubMed]
  20. Kasurinen, A.; Peltonen, P.; Julkunen-Tiitto, R.; Apaavuori, E.; Nuutinen, V.; Holopainen, T.; Holopainen, J. Effects of elevated CO2 and O3 on leaf litter phenolics and subsequent performance of litter-feeding soil macrofauna. Plant Soil 2007, 292, 25–43. [Google Scholar] [CrossRef]
  21. Vizoso, S.; Gerant, D.; Guehl, J.M.; Joffre, R.; Chalot, M.; Gross, P.; Maillard, P. Do elevated CO2 concentration and nitrogen fertilization alter storage and remobilization of carbon and nitrogen in pedunculate oak saplings? Tree Physiol. 2008, 28, 1729–1739. [Google Scholar] [CrossRef]
  22. Norby, R.J.; Long, T.M.; Hartz-Rubin, J.S.; O’Neill, E.G. Nitrogen resorption in senescing tree leaves in a warmer, CO2-enriched atmosphere. Plant Soil 2000, 224, 15–29. [Google Scholar] [CrossRef]
  23. Li, L.; Manning, W.; Wang, X. Elevated CO2 increased root mass and leaf nitrogen resorption in red maple (Acer rubrum L.). Forests 2019, 10, 420. [Google Scholar] [CrossRef] [Green Version]
  24. Cotrufo, M.F.; Briones, M.A.J.I.; Ineson, P. Elevated CO2 affects field decomposition rate and palatability of tree leaf litter: Importance of changes in substrate quality. Soil Biol. Biochem. 1998, 30, 1565–1571. [Google Scholar] [CrossRef]
  25. Parsons, W.F.J.; Lindroth, R.I.; Bockheim, J.G. Decomposition of Betula papyrifera leaf litter under the independent and interactive effects of elevated CO2 and O3. Glob. Chang. Biol. 2004, 10, 1666–1677. [Google Scholar] [CrossRef]
  26. Liu, L.L.; King, J.S.; Giardiana, C.P. Effects of elevated atmospheric CO2 and tropospheric O3 on leaf litter production and chemistry in trembling aspen and paper birch ecosystems. Tree Physiol. 2005, 15, 1511–1522. [Google Scholar] [CrossRef]
  27. Vitousek, P.M. Nutrient cycling and nutrient use efficiency. Am. Nat. 1982, 4, 553–572. [Google Scholar] [CrossRef]
  28. Aerts, R.; Chapin, F.S., III. The mineral nutrition of wild plants revisited: A re-evaluation of processes and patterns. Adv. Ecol. Res. 2000, 30, 1–67. [Google Scholar]
  29. Killingbeck, K. Nutrients in senesced leaves: Keys to the search for potential resorption and resorption proficiency. Ecology 1996, 77, 1716–1727. [Google Scholar] [CrossRef]
  30. Van Heerwaarden, L.M.; Toet, S.; Aerts, R. Nitrogen and phosphorus resorption efficiency and proficiency in six-arctic bog species after 4 years of nitrogen fertilization. J. Ecol. 2003, 91, 1060–1070. [Google Scholar] [CrossRef]
  31. Maeda, Y.; Tashiro, N.; Enoki, T.; Urakawa, R.; Hishi, T. Effects of species replacement on the relationship between net primary production and soil nitrogen availability along a topographical gradient: Comparison of belowground allocation and nitrogen use efficiency between natural forests and plantations. For. Ecol. Manag. 2018, 422, 214–222. [Google Scholar] [CrossRef]
  32. Li, L.-H.; Dijkstra, P.; Hymus, G.J.; Wheeler, R.M.; Piastuch, W.C.; Hinkle, C.R.; Drake, B.G. Leaf senescence of Quercus myrtifolia as affected by long-term CO2 enrichment in its native environment. Glob. Chang. Biol. 2000, 6, 727–733. [Google Scholar] [CrossRef] [Green Version]
  33. Mediavilla, S.; García-Iglesias, J.; González-Zurdo, P.; Escudero, A. Nitrogen resorption efficiency in mature trees and seedlings of four tree species co-occurring in a Mediterranean environment. Plant Soil 2014, 385, 205–215. [Google Scholar] [CrossRef]
  34. Wang, Z.; Lu, J.; Yang, H.; Zhang, X.; Luo, C.; Zhao, Y. Resorption of nitrogen, phosphorus and potassium from leaves of lucerne stands of different ages. Plant Soil 2014, 383, 301–312. [Google Scholar] [CrossRef]
  35. Deng, J.; Wang, S.; Ren, C.; Zhang, W.; Zhao, F.; Li, X.; Zhang, D.; Han, X.; Yang, G. Nitrogen and phosphorus resorption in relation to nutrition limitation along the chronosequence of black locust (Robinia pseudoacacia L.) plantation. Forests 2019, 10, 261. [Google Scholar] [CrossRef] [Green Version]
  36. Vergutz, L.; Manzonl, S.; Porporato, A.; Novals, R.F.; Jackson, R.B. Global resorption efficiencies and concentrations of carbon and nutrients in leaves of terrestrial plants. Ecol. Monogr. 2012, 82, 205–220. [Google Scholar] [CrossRef] [Green Version]
  37. Jiang, D.; Gzeng, Q.; Li, Q.; Luo, Y.; Vogel, J.; Shi, Z.; Ruan, H.; Xu, X. Nitrogen and phosphorus resorption in planted forests worldwide. Forests 2019, 10, 201. [Google Scholar] [CrossRef] [Green Version]
  38. Jiang, D.; Yang, B.; Cheng, X.; Chen, H.Y.H.; Ruan, H.; Xu, X. The stoichiometry of leaf nitrogen and phosphorus resorption in plantation forests. For. Ecol. Manag. 2021, 483, 2021. [Google Scholar] [CrossRef]
  39. Arp, W.J. Effects of source–sink relations on photosynthetic acclimation to elevated CO2. Plant Cell Environ. 1991, 14, 869–875. [Google Scholar] [CrossRef]
  40. Pugnaire, F.I.; Chapin, F.S., III. Controls over nutrient resorption from leaves of evergreen Mediterranean species. Ecology 1993, 74, 124–129. [Google Scholar] [CrossRef]
  41. Norby, R.J.; Wullschleger, S.D.; Gjunderson, C.A.; Johnson, D.W.; Ceulemans, R. Tree responses to rising CO2 in field experiments: Implications for the future forest. Plant Cell Environ. 1999, 22, 683–714. [Google Scholar] [CrossRef]
  42. Norby, R.J.; Iversen, C.M. Nitrogen uptake, distribution, turnover, and efficiency of use in a CO2-enriched sweetgum forest. Ecology 2006, 87, 5–14. [Google Scholar] [CrossRef] [Green Version]
  43. Finzi, A.C.; Allen, A.S.; DeLucia, E.H.; Ellsworth, D.S.; Schlesinger, W.H. Forest litter production, chemistry, and decomposition following two years of free-air CO2 enrichment. Ecology 2001, 82, 470–484. [Google Scholar]
  44. Billings, S.A.; Zitzer, S.F.; Weatherly, H.; Schaeffer, S.M.; Charlet, T.; Arnon, J.A., III; Evans, R.D. Effects of elevated carbon dioxide on green leaf tissue and leaf litter quality in an intact Mojave Desert ecosystem. Glob. Chang. Biol. 2003, 9, 729–735. [Google Scholar] [CrossRef] [Green Version]
  45. Housman, D.C.; Killingbeck, K.T.; Evans, R.D.; Charlet, T.N.; Smith, S.D. Foliar nutrient resorption in two Mojave Desert shrubs exposed to free-air CO2 enrichment (FACE). J. Arid Environ. 2012, 78, 26–32. [Google Scholar] [CrossRef]
  46. Calfapietra, C.; Angelis, P.D.; Gielen, B.; Lukac, M.; Moscatelli, M.C.; Avino, G.; Lagomarsino, A.; Polle, A.; Ceulemans, R.; Mugnozza, G.S.; et al. Increased nitrogen-use efficiency of a short-rotation poplar plantation in elevated CO2 concentration. Tree Physiol. 2007, 27, 1153–1163. [Google Scholar] [CrossRef] [PubMed] [Green Version]
  47. Li, L.; Wang, X.; Manning, W.J. Effects of elevated CO2 on leaf senescence, leaf nitrogen resorption, and late-season photosynthesis in Tilia americana L. Front Plant Sci. 2019, 10, 1217. [Google Scholar] [CrossRef] [Green Version]
  48. Evans, J.R. Photosynthesis and nitrogen relationships in leaves of C3 plants. Oecologia 1989, 78, 9–19. [Google Scholar] [CrossRef]
  49. Field, C. Allocation leaf nitrogen for the maximization of carbon gain: Leaf age as a control on the allocation program. Oecologia 1983, 56, 341–347. [Google Scholar] [CrossRef] [PubMed]
  50. Mae, T. Leaf senescence and nitrogen metabolism. In Plant Cell Death Process; Noodén, L.D., Ed.; Elsevier Academic Press: San Diego, CA, USA, 2004; pp. 157–168. [Google Scholar]
  51. Long, S.P.; Ainsworth, E.A.; Rogers, A.; Ort, D.R. Riding atmospheric carbon dioxide: Plants FACE the future. Ann. Rev. Plant Biol. 2004, 55, 591–628. [Google Scholar] [CrossRef]
  52. Ainsworth, E.A.; Long, S.P. What have we learned from 15 years of free-air CO2 enrichment (FACE)? A meta-analytic review of the responses of photosynthesis, canopy properties and plant production to rising CO2. New Phytol. 2005, 165, 351–372. [Google Scholar] [CrossRef] [PubMed]
  53. Rogers, A.; Ainsworth, E.A. The response of foliar carbohydrates to elevated carbon dioxide concentration. In Managed Ecosystems and CO2. Case Studies, Processes and Perspectives; Nörsberger, J., Long, S.P., Norby, R.J., Stitt, M., Hendrey, G.R., Blum, H., Eds.; Springer: Berlin/Heidelberg, Germany, 2006; pp. 293–308. [Google Scholar]
  54. Koike, T.; Watanabe, M.; Watanabe, Y.; Agathokleous, E.; Eguchi, N.; Takagi, K.; Satoh, F.; Kitaoka, S.; Funada, R. Ecophysiology of deciduous trees native to Northeast Asia grown under FACE (Free Air CO2 Enrichment). J. Agric. Meteorol. 2015, 71, 174–184. [Google Scholar] [CrossRef]
  55. Yasumura, Y.; Hikosaka, K.; Hirose, T. Resource allocation to vegetative and reproductive growth in relation to mast seedlings in Fagus crenata. For. Ecol. Manag. 2006, 229, 228–233. [Google Scholar] [CrossRef]
  56. Ainsworth, E.A.; Rogers, A.; Nelson, R.; Long, S.P. Testing the “source–sink” hypothesis of down-regulation of photosynthesis in elevated [CO2] in the field with single gene substitutions in glycine max. Agric. For. Meteorol. 2004, 122, 85–94. [Google Scholar] [CrossRef]
  57. Temperton, V.M.; Grayston, S.J.; Jackson, G.; Barton, C.V.M.; Millard, P.; Jarvis, P.G. Effects of elevated carbon dioxide concentration on growth and nitrogen fixation in Alnus glutinosa in a long-term field experiment. Tree Physiol. 2003, 23, 1051–1059. [Google Scholar] [CrossRef] [PubMed] [Green Version]
  58. Nowak, R.S.; Ellsworth, D.S.; Smith, S.D. Functional responses of plants to elevated atmospheric CO2—Do photosynthetic and productivity data from FACE experiments support early predictions? New Phytol. 2004, 162, 253–280. [Google Scholar] [CrossRef] [Green Version]
  59. Tobita, H.; Kitao, M.; Koike, T.; Maruyama, Y. Effects of elevated CO2 and nitrogen availability on nodulation of Alnus hirsuta Turcz. Phyton 2005, 45, 125–131. [Google Scholar]
  60. Tobita, H.; Uemura, A.; Kitao, M.; Kitaoka, S.; Maruyama, Y.; Utsugi, H. Effects of elevated atmospheric carbon dioxide, soil nutrients and water conditions on photosynthetic and growth responses of Alnus hirsuta. Funct. Plant Biol. 2011, 38, 702–710. [Google Scholar] [CrossRef] [PubMed]
  61. Koike, T. Leaf structure and photosynthetic performance as related to the forest succession of deciduous broad-leaved trees. Plant Species Biol. 1988, 3, 77–87. [Google Scholar] [CrossRef]
  62. Ishizuka, M.; Sugawara, S.; Kanazawa, Y. The relationship between diffused light intensity under canopy and leader growth of some hardwoods saplings. Trans. Mtg. Hokkaido Br. Jpn. For. Soc. 1988, 36, 48–50. [Google Scholar]
  63. Kitao, M.; Lei, T.T.; Koike, T.; Tobita, H.; Maruyama, Y. Tradeoff between shade adaptation and mitigation of photoinhibition in leaves of Quercus mongolica and Acer mono acclimated to deep shade. Tree Physiol. 2006, 26, 441–448. [Google Scholar] [CrossRef] [Green Version]
  64. Terasawa, K.; Usui, G.; Gosyu, K. Relationship between site and stand structure of mizunara oak (Quercus mongolica var. grosseserrata) secondary forests in central Hokkaido. Bull. Hokkaido For. Exp. Stn. 1989, 26, 97–106. [Google Scholar]
  65. Tomioka, E.; Amano, Y. Studies on the base-status of soils in northern-east Hokkaido. Res. Ball. Hokkaido Natul. Agric. Exp. Stn. 1978, 123, 79–87. [Google Scholar]
  66. Usui, G. An environmental study on the coastal natural stands to establish the disaster prevention forests in north west Hokkaido. Bull. Hokkaido For. Res. Inst. 1990, 28, 1–52. (In Japanese) [Google Scholar]
  67. Watanabe, Y.; Tobita, H.; Kitao, M.; Maruyama, Y.; Choi, D.; Sasa, K.; Funada, R.; Koike, T. Effects of elevated CO2 and nitrogen on wood structure related to water transport in seedlings of two deciduous broad-leaved tree species. Trees 2008, 22, 403–411. [Google Scholar] [CrossRef]
  68. Asher, C.J.; Edwards, D.G. Modern solution culture techniques. In Inorganic Plant Nutrition; Encyclopedia of Plant Physiology (New Series); Läuchli, A., Bieleski, R.L., Eds.; Springer: Berlin/Heidelberg, Germany, 1983; Volume 15, pp. 94–119. [Google Scholar]
  69. R Core Team. 2020 R: A Language and Environment for Statistical Computing, 4.0.3 ed.; R Foundation for Statistical Computing: Vienna, Austria, 2020. [Google Scholar]
  70. Duursma, R.A. Plantecophys—An R Package for analysing and modelling Leaf Gas Exchange Data. PLoS ONE 2015, 10, e0143346. [Google Scholar] [CrossRef] [PubMed]
  71. Farquhar, G.D.; von Caemmerer, S.; Berry, J.A. A biochemical model of photosynthetic acclimation in leaves of C3 species. Planta 1980, 149, 78–90. [Google Scholar] [CrossRef] [Green Version]
  72. Dreyer, E.; Roux, X.L.; Montpied, P.; Daudet, F.; Masson, F. Temperature response of leaf photosynthetic capacity in seedlings from seven temperate tree species. Tree Physiol. 2001, 214, 223–232. [Google Scholar] [CrossRef] [Green Version]
  73. Kabeya, D.; Sakai, A.; Matsui, K.; Sakai, S. Resprouting ability of Quercus crispula seedlings depends on the vegetation cover of their microhabitats. J. Plant Res. 2003, 116, 207–216. [Google Scholar] [CrossRef]
  74. Niinemets, Ü.; Tenhunen, J.D. A model separating leaf structural and physiological effects on carbon gain along light gradients for the shade-tolerant species Acer saccharum. Plant Cell Environ. 1997, 20, 845–866. [Google Scholar] [CrossRef]
  75. Jordan, D.B.; Ogren, W.L. The CO2/O2 specificity of ribulose 1,5-bisphosphate carboxylase/oxygenase. Planta 1984, 161, 308–313. [Google Scholar] [CrossRef]
  76. Evans, J.R.; Seeman, J.R. The allocation of protein nitrogen in the photosynthetic apparatus: Costs, consequences, and control. In Photosynthesis; Brigs, W.R., Alan, R., Eds.; Liss Press: New York, NY, USA, 1989; pp. 183–205. [Google Scholar]
  77. Frak, E.; LeRoux, X.; Millard, P.; Dreyer, E.; Jaouen, G.; Saint-Joanis, B.; Wendler, R. Changes in total leaf nitrogen and partitioning of leaf nitrogen drive photosynthetic acclimation to light in fully developed walnut leaves. Plant Cell Environ. 2001, 24, 1279–1288. [Google Scholar] [CrossRef] [Green Version]
  78. Niinemets, Ü.; Tenhunen, J.D. Within-canopy variation in the rate of development of photosynthetic capacity is proportional to integrated quantum flux density in temperate deciduous trees. Plant Cell Environ. 2004, 27, 293–313. [Google Scholar] [CrossRef]
  79. Tateno, R.; Kawaguchi, H. Differences in nitrogen use efficiency between leaves from canopy and subcanopy trees. Ecol. Res. 2002, 17, 695–704. [Google Scholar] [CrossRef]
  80. Wang, W.Q.; Wang, M.; Lin, P. Seasonal changes in element contents in mangrove element retranslocation during leaf senescence. Plant Soil 2003, 252, 187–193. [Google Scholar] [CrossRef] [Green Version]
  81. Aerts, R.; Cornelissen, J.H.C.; van Loghestijn, R.S.P.; Callaghan, T.V. Climate change has only a minor impact on nutrient resorption parameters in a high-latitude peatland. Oecologia 2007, 151, 132–139. [Google Scholar] [CrossRef]
  82. Parker, G.G. Throughfall and stemflow in the forest nutrient cycle. Adv. Ecol. Res. 1983, 13, 57–133. [Google Scholar]
  83. Dray, M.W.; Crowther, T.W.; Thomas, S.M.; A’Bear, A.D.; Godbold, D.L. Effects of elevated CO2 on litter chemistry and subsequent invertebrate detritivore feeding responses. PLoS ONE 2014, 9, e86246. [Google Scholar] [CrossRef]
  84. Chapman, J.A.; King, J.S.; Pregitzer, K.S.; Zak, D.R. Effects of elevated concentrations of atmospheric CO2 and tropospheric O3 on decomposition of tree fine roots. Tree Physiol. 2005, 25, 1501–1510. [Google Scholar] [CrossRef] [Green Version]
  85. Gill, R.A.; Anderson, L.J.; Polley, H.W.; Johnson, H.B.; Jackson, R.B. Potential nitrogen constraints on soil carbon sequestration under low and elevated atmospheric CO2. Ecology 2006, 87, 41–52. [Google Scholar] [CrossRef] [PubMed]
  86. Hall, M.C.; Stiling, P.; Moon, D.C.; Drake, B.G.; Hunter, M.D. Effects of elevated CO2 and herbivore damage on litter quality in a scrub oak ecosystem. J. Chem. Ecol. 2005, 31, 2343–2356. [Google Scholar] [CrossRef] [PubMed]
  87. Chapin, F.S., III; Kedrowski, R.A. Seasonal changes in nitrogen and phosphorus fractions and autumn retranslocation in evergreen and deciduous taiga trees. Ecology 1983, 64, 376–391. [Google Scholar] [CrossRef]
  88. Crous, K.Y.; Wujeska-Klause, A.; Jiang, M.; Medlyn, B.E.; Ellsworth, D.S. Nitrogen and phosphorus retranslocation of leaves and stemwood in a mature Eucalyptus forest exposed to 5 years of elevated CO2. Front. Plant Sci. 2019, 10, 664. [Google Scholar] [CrossRef] [Green Version]
  89. Tateno, R.; Hishi, T.; Takeda, H. Above- and belowground biomass and net primary production in a cool-temperate deciduous forest in relation to topographical changes in soil nitrogen. For. Ecol. Manag. 2004, 193, 297–306. [Google Scholar] [CrossRef]
  90. Aerts, R. Nutrient Resorption from Senescing Leaves of Perennials: Are there General Patterns? J. Ecol. 1996, 84, 597–608. [Google Scholar] [CrossRef]
  91. Charles-Edwards, D.A.; Stutzel, H.; Ferraris, R.; Beech, D.F. An analysis of spatial variation in the nitrogen content of leaves from different horizons within a canopy. Ann. Bot. 1987, 60, 421–426. [Google Scholar] [CrossRef]
  92. O’Neill, E.G.; Norby, R.J. Litter quality and decomposition rates of foliar litter produced under CO2 enrichment. In Carbon Dioxide and Terrestrial Ecosystems; Koch, G.W., Mooney, H.A., Eds.; Academic Press: San Diego, CA, USA, 1996; pp. 87–103. [Google Scholar]
  93. Hikosaka, K. A model of dynamics of leaves and nitrogen in a plant canopy: An integration of canopy photosynthesis, leaf life span, and nitrogen use efficiency. Am. Nat. 2003, 162, 149–164. [Google Scholar] [CrossRef] [PubMed] [Green Version]
  94. Niinemets, Ü. Distribution patterns of foliar carbon and nitrogen as affected by tree dimensions and relative light conditions in the canopy of Picea abies. Trees 1997, 11, 144–154. [Google Scholar]
  95. Onoda, Y.; Hikosaka, K.; Hirose, T. Allocation of nitrogen to cell walls decreases photosynthetic nitrogen use efficiency. Funct. Ecol. 2004, 18, 419–425. [Google Scholar] [CrossRef]
  96. Takashima, T.; Hikosaka, K.; Hirose, T. Photosynthesis or persistence: Nitrogen allocation in leaves of evergreen and deciduous Quercus species. Plant Cell Environ. 2004, 27, 1047–1054. [Google Scholar] [CrossRef]
  97. Hikosaka, K. Interspecific difference in the photosynthesis-nitrogen relationship: Patterns, physiological causes, and ecological importance. J. Plant Res. 2004, 117, 481–494. [Google Scholar] [CrossRef]
Figure 1. Maximum carbon fixation rate (Vcmax) and maximum electron transfer rate (Jmax) of Quercus mongolica (1.5-month-old leaves) (A,C), and Acer mono (B,D). Means and standard errors are shown (n = 5–9). Ambient CO2: 36 Pa; elevated CO2: 72 Pa. F-value and probability (p) of the effects of CO2 (pC), N (pN), and their interaction (pCxN) are indicated in the panel. Lowercase letters represent multiple comparison results among four treatments when the treatment effects are significant at p < 0.05.
Forests 12 01034 g001
Figure 2. Relationship between area-based leaf N content (Narea) and maximum carbon fixation rate (Vcmax) and maximum electron transfer rate (Jmax) of Quercus mongolica (1.5-month-old leaves) (A,C) and Acer mono (1-month-old leaves) (B,D). Open symbols: ambient CO2; closed symbols: elevated CO2; circles: high N; triangles: low N. Results of the generalized linear mixed model (χ2-value and p-value) are indicated besides the panel. The two N treatments (high N and low N) were analyzed together in this instance.
Forests 12 01034 g002
Figure 3. Area-based N resorption efficiency (NRE) (NREarea; (A)) and mass-based NRE (NREmass; (B)) during defoliation as well as area-based N content (Narea; (C)), mass-based N content (Nmass; (D)), leaf mass per area (LMA; (E)), and C/N ratio (F) of fallen leaves of Quercus mongolica and Acer mono. Means and standard errors are shown (n = 6). Open bars: Q. mongolica; closed bars: A. mono; ambient CO2: 36 Pa; elevated CO2: 72 Pa. F-value and probability (P) of the effects of CO2 (pC), N (pN), and their interaction (pCxN) for Q. mongolica (Quercus) and A. mono (Acer) are indicated in or above the panel. Uppercase and lowercase letters represent multiple comparison results among four treatments when the treatment effects are significant at p < 0.05 for Q. mongolica and A. mono, respectively.
Forests 12 01034 g003
Table 1. Leaf mass per area (LMA), mass-based leaf N (Nmass), area-based leaf N (Narea), soil plant analysis development (SPAD) values, and total nonstructural carbohydrate (TNC; sum of soluble sugar and starch) according to CO2 and N treatments in Quercus mongolica (Quercus; 1.5-month-old leaves) and Acer mono (Acer; 1-month-old leaves). Mean values (standard error) for each treatment are shown (n = 5–9). Results of ANOVA (F-value) for CO2 treatments (ambient: ambient CO2; elevated: elevated CO2) and N treatments (high N, low N) are shown. * p < 0.05; ** p < 0.01; *** p < 0.001.
CharacteristicsSpeciesHigh NLow NSource of Variance
AmbientElevatedAmbientElevatedCO2NCO2 × N
LMA
(g m−2)
Quercus64.3 (1.7)71.3 (2.1)63.4 (1.7)78.9 (2.8)25.3 ***2.94.2
Acer42.7 (1.2)51.2 (2.6)41.2 (1.5)48.3 (2.8)11.8 **1.00.09
Nmass
(mg g−1)
Quercus29.8 (1.3)23.6 (1.4)10.8 (0.4)8.4 (0.3)12.8 **286.0 ***3.6
Acer26.1 (2.0)21.7 (1.1)20.6 (1.5)17.0 (1.2)7.9 *13.3 **0.09
Narea
(g m−2)
Quercus1.9 (0.10)1.7 (0.10)0.68 (0.03)0.66 (0.04)1.2192.8 ***2.1
Acer1.1 (0.09)1.1 (0.03)0.85 (0.08)0.81 (0.05)0.1718.4 ***0.04
SPAD valueQuercus42.0 (1.3)41.9 (1.4)21.1 (1.6)20.8 (1.0)0.73247.8 ***0.003
Acer33.1 (0.6)29.7 (1.1)30.4 (1.7)27.8 (1.4)5.4 *3.30.13
TNC
(%)
Quercus7.6 (1.3)12.6 (2.7)15.4 (1.5)20.1 (1.6)4.9 *19.4 ***0.004
Acer7.8 (1.4)13.1 (2.6)7.5 (1.4)14.3 (2.8)10.6 **0.060.15
Table 2. The allocation coefficient of leaf N to carboxylase reactions (Fr: g N in Rubisco (g total leaf N)−1) and to bioenergetic pools (Fb: g N in cytochrome f, ferredoxin NADP reductase, and coupling factor (g total leaf N)−1) in Quercus mongolica (Quercus; 1.5-month-old leaves) and Acer mono (Acer; 1-month-old leaves). Mean values (standard error) for each treatment are shown (n = 5–9). Results of ANOVA (F-value) for CO2 treatments (ambient: ambient CO2; elevated: elevated CO2) and N treatments (high N, low N) are shown. * p < 0.05; ** p < 0.01; *** p < 0.001.
CharacteristicsSpeciesHigh NLow NSource of Variance
AmbientElevatedAmbientElevatedCO2NCO2 × N
FrQuercus0.29 (0.01)0.26 (0.01)0.33 (0.01)0.26 (0.02)17.2 ***1.31.1
Acer0.30 (0.01)0.22 (0.02)0.40 (0.02)0.31 (0.03)17.6 ***18.8 ***0.005
FbQuercus0.050 (0.002)0.047 (0.002)0.054 (0.002)0.051 (0.003)4.4 *2.60.12
Acer0.066 (0.004)0.048 (0.003)0.074 (0.003)0.065 (0.005)12.0 **10.2 **1.3
Publisher’s Note: MDPI stays neutral with regard to jurisdictional claims in published maps and institutional affiliations.

