Article

Spatial Patterns of ‘Ōhi‘a Mortality Associated with Rapid ‘Ōhi‘a Death and Ungulate Presence

1
Department of Geography & Environmental Science, University of Hawai‘i at Hilo, Hilo, HI 96720, USA
2
Spatial Data Analysis & Visualization Laboratory, University of Hawai‘i at Hilo, Hilo, HI 96720, USA
3
Hawai‘i Volcanoes National Park, National Park Service, Volcano, HI 96720, USA
4
Institute of Pacific Islands Forestry, Pacific Southwest Station, U.S. Forest Service, 60 Nowelo Street, Hilo, HI 96720, USA
5
Daniel K. Inouye U.S. Pacific Basin Agricultural Research Center, United States Department of Agriculture, Agricultural Research Service, Hilo, HI 96720, USA
*
Author to whom correspondence should be addressed.
Forests 2021, 12(8), 1035; https://doi.org/10.3390/f12081035
Submission received: 8 July 2021 / Revised: 29 July 2021 / Accepted: 2 August 2021 / Published: 4 August 2021

Abstract

:
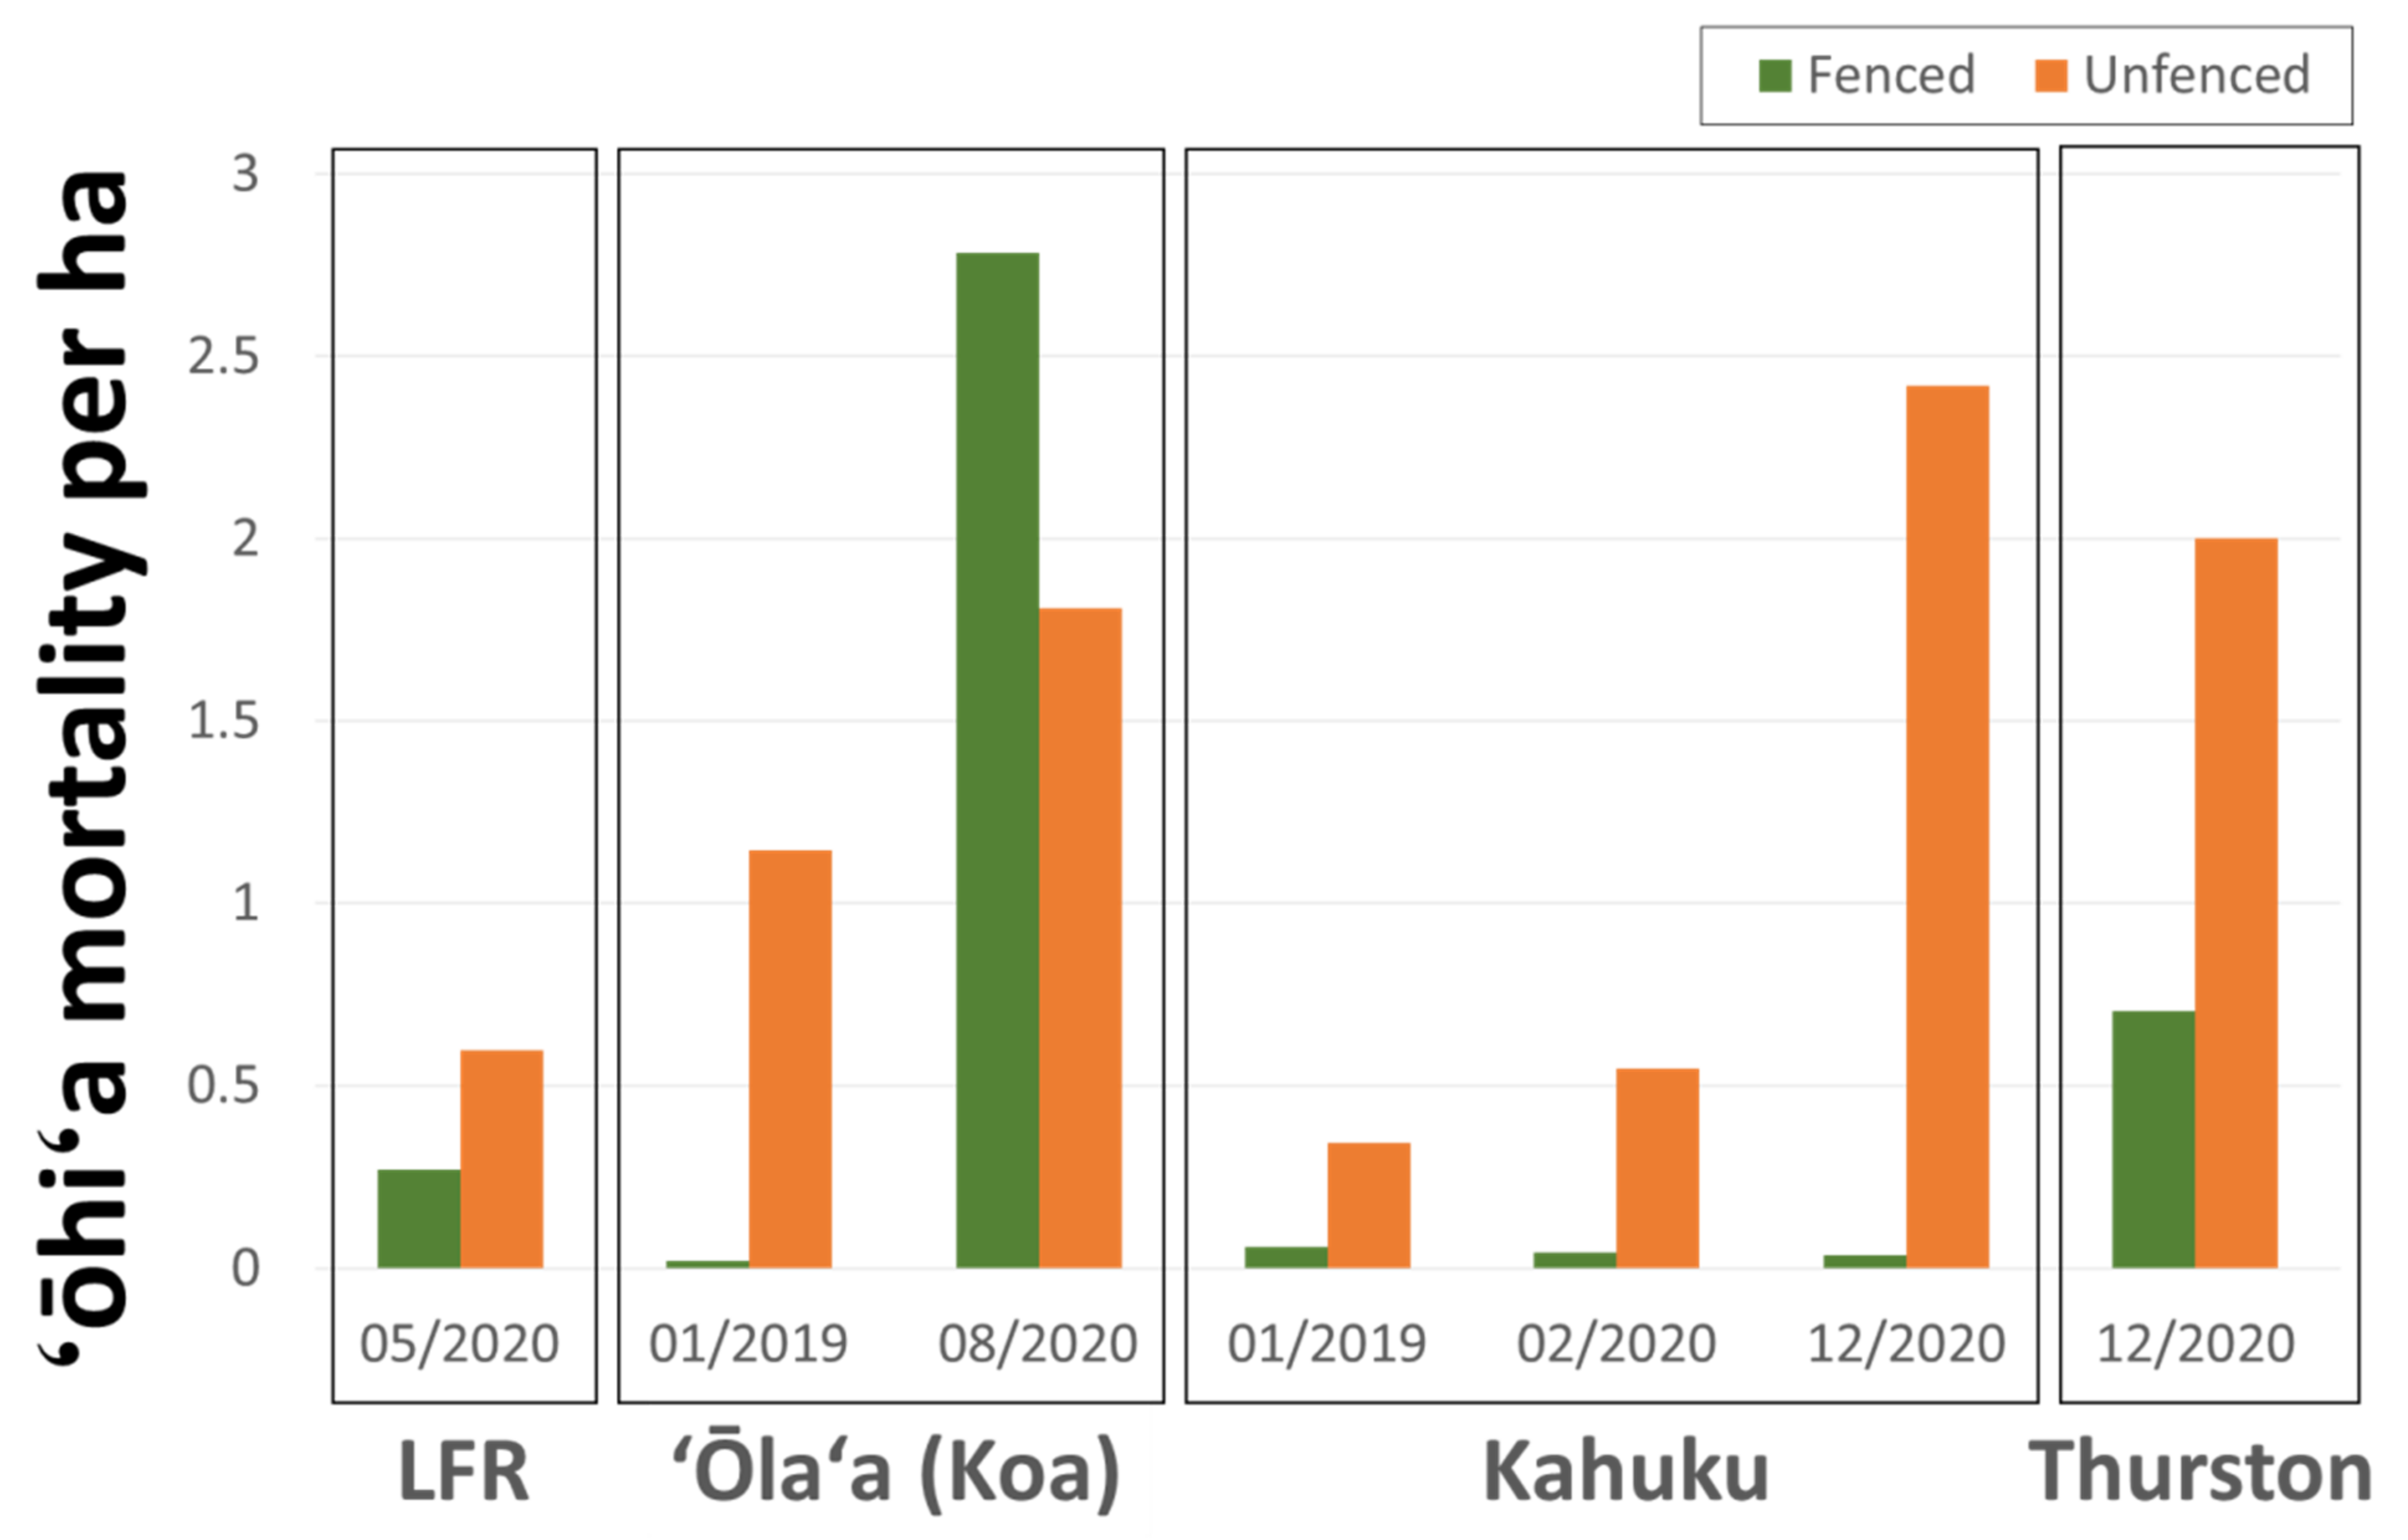
Effective forest management, particularly during forest disturbance events, requires timely and accurate monitoring information at appropriate spatial scales. In Hawai‘i, widespread ‘ōhi‘a (Metrosideros polymorpha Gaud.) mortality associated with introduced fungal pathogens affects forest stands across the archipelago, further impacting native ecosystems already under threat from invasive species. Here, we share results from an integrated monitoring program based on high resolution (<5 cm) aerial imagery, field sampling, and confirmatory laboratory testing to detect and monitor ‘ōhi‘a mortality at the individual tree level across four representative sites on Hawai‘i island. We developed a custom imaging system for helicopter operations to map thousands of hectares (ha) per flight, a more useful scale than the ten to hundreds of ha typically covered using small, unoccupied aerial systems. Based on collected imagery, we developed a rating system of canopy condition to identify ‘ōhi‘a trees suspected of infection by the fungal pathogens responsible for rapid ‘ōhi‘a death (ROD); we used this system to quickly generate and share suspect tree candidate locations with partner agencies to rapidly detect new mortality outbreaks and prioritize field sampling efforts. In three of the four sites, 98% of laboratory samples collected from suspect trees assigned a high confidence rating (n = 50) and 89% of those assigned a medium confidence rating (n = 117) returned positive detections for the fungal pathogens responsible for ROD. The fourth site, which has a history of unexplained ‘ōhi‘a mortality, exhibited much lower positive detection rates: only 6% of sampled trees assigned a high confidence rating (n = 16) and 0% of the sampled suspect trees assigned a medium confidence rating (n = 20) were found to be positive for the pathogen. The disparity in positive detection rates across study sites illustrates challenges to definitively determine the cause of ‘ōhi‘a mortality from aerial imagery alone. Spatial patterns of ROD-associated ‘ōhi‘a mortality were strongly affected by ungulate presence or absence as measured by the density of suspected ROD trees in fenced (i.e., ungulate-free) and unfenced (i.e., ungulate present) areas. Suspected ROD tree densities in neighboring areas containing ungulates were two to 69 times greater than those found in ungulate-free zones. In one study site, a fence line breach occurred during the study period, and feral ungulates entered an area that was previously ungulate-free. Following the breach, suspect ROD tree densities in this area rose from 0.02 to 2.78 suspect trees/ha, highlighting the need for ungulate control to protect ‘ōhi‘a stands from Ceratocystis-induced mortality and repeat monitoring to detect forest changes and resource threats.

1. Introduction

Land managers, perennially faced with difficult choices, need to make informed decisions regarding deployment of limited resources, access rights for public and livestock, and long-term strategies relating to climate change, development pressures, invasive species, and other issues [1,2,3,4]. Effective forest management requires access to current and accurate monitoring data, particularly in the midst of disturbance events such as wildfires or sudden mortality outbreaks [5,6,7,8]. Remote sensing imagery can play an important role in forestry decision-making, as long as acquired data are cost-effective and exhibit sufficient spatial and spectral resolution to detect phenomena of interest at appropriate geographic coverages and currencies [9,10,11]. High-resolution remote sensing imagery is widely used in mapping tree mortality associated with insect and disease disturbances [12,13]. Here, we present results from an integrated method to monitor and test forest health at the individual-tree level in regions of interest on Hawai‘i island which experienced widespread native forest declines since 2010 associated with ‘ōhi‘a (Metrosideros polymorpha Gaudich.) mortality characterized as rapid ‘ōhi‘a death [14,15]. This approach included multi-platform remote sensing in conjunction with field sampling and confirmatory laboratory testing to characterize new ROD outbreaks and illustrate the importance of fencing, feral ungulate removal, and felling of infected trees in suppressing ‘ōhi‘a mortality levels across affected regions.

Rapid ‘Ōhi‘a Death

A newly identified fungal disease, commonly referred to as “rapid ‘ōhi‘a death” or “ROD”, was confirmed on the Hawaiian islands of Kaua‘i, O‘ahu, Maui, and Hawai‘i. ROD killed hundreds of thousands of mature ‘ōhi‘a trees (Metrosideros polymorpha) in forests and residential areas throughout Hawaii, where it affected an estimated 130,000 ha through 2020, the majority (97,000 ha) occurring on Hawai‘i island (B. Tucker, personal communication). ‘Ōhi‘a is a foundational keystone species in Hawaiian native forests and provides critical habitat, ecosystem services, and medicinal products and is deeply ingrained in Hawaiian history and culture [16,17,18]. It is a slow-growing, broad leaf evergreen tree; flowering is most abundant after seasonal rains but may occur at any point throughout the year [16]. ROD is characterized by rapid visual symptom development in affected tree crowns [19,20,21]. The causal agent of ROD was originally identified as Ceratocystis fimbriata s.lat. based on pathogenicity and sequence homology [15]. A combination of phylogenetics, morphology, biological species concepts, pathogenicity tests, and microsatellite analyses was used to characterize isolates collected from diseased ohia trees showing typical symptoms of ROD across Hawai‘i island, and two novel species were named and described [19]. Although the pathogens cause two different diseases, typical symptoms include black-colored staining of sapwood and rapid crown wilting, resulting in death of the tree [14]. C. lukuohia I. Barnes, T.C. Harr. & L.M. Keith is the more aggressive of the two newly described Ceratocystis species, which spreads throughout the entire tree and kills it in as little as two months [14]. C. lukuohia is found on Hawai‘i island and Kaua‘i [19,22] and accounts for nearly 80% of the widespread mortality (B. Tucker, personal communication). C. huliohia I. Barnes, T.C. Harr. & L.M. Keith forms discrete cankers around entry points, suggesting that multiple infections of C. huliohia may be required to kill a mature tree (Juzwik et al. in preparation). Land managers across Hawai‘i prioritized management of the more aggressive C. lukuohia pathogen.
Symptomatic trees on Hawai‘i island were successfully mapped on an island-wide basis via imaging spectroscopy [20,23,24]. In addition, semi-annual digital mobile sketch mapping helicopter (DMSM) flights were used to produce point and polygon estimates of areas exhibiting active mortality on the basis of visible crown symptoms [25]. Although these large-scale mapping efforts are invaluable in determining the broader spatial extent of ‘ōhi‘a mortality across Hawai‘i island, their utility for quickly and precisely mapping new outbreaks at an individual tree level is limited by the infrequency of imaging spectroscopy flights and the extensive post-processing required as well as the semi-quantitative nature of DMSM flights. An additional challenge is posed by the need for ground-sampling of suspect trees, which is required to definitively determine the cause of mortality and is limited in these mapping efforts. ROD, particularly when caused by C. lukuohia, results in mortality and desiccation of the remaining tree snags. If substantial time passes between detection of the suspect tree and sampling by ground crews, or if the detected tree is already in the late stages of the disease, desiccation may challenge efforts to obtain a sample for confirmatory laboratory analysis and avoid a false-negative result.

2. Materials and Methods

2.1. Study Site Locations

Study sites were distributed across the island of Hawai‘i (Figure 1) and consisted of ‘ōhi‘a-dominated native forests representing different elevation, rainfall, and environmental characteristics (Table 1). All sites included both fenced (ungulate-free) and unfenced (ungulate present) areas. Three of the sites, ‘Ōla‘a, Thurston, and Kahuku, were primarily located inside fenced units managed by Hawai‘i Volcanoes National Park. The Laupāhoehoe Forest Reserve (LFR) site is managed by the State of Hawai‘i Department of Land and Natural Resources; it is largely unfenced except for a small number of exclosures ranging in size from 0.1–3.5 ha within the study area. Ungulates, including cattle (Bos taurus), goats (Capra hircus), sheep (Ovis aries), mouflon (O. gmelini musimon), and pigs (Sus scrofa), are found across the island of Hawai‘i, and each is a known agent of forest disturbance [26]. Because Hawaiian ecosystems evolved without pressures from ungulates and other large mammals, these animals are believed to disrupt succession and alter disturbance regimes [27] and are also suspected of spreading ROD through wounding and other mechanisms.
The LFR is a wet tropical forest located along the Hāmākua coast of eastern Hawai‘i island with a forest overstory dominated by the native trees, M. polymorpha, Acacia koa, or both, and a subcanopy dominated by native tree ferns in the genus Cibotium and other native and non-native small stature trees and shrubs [28,29]. ROD was first confirmed in the LFR in November 2016 through laboratory testing of a sample from a single symptomatic ‘ōhi‘a tree. The ‘Ōla‘a Forest Unit of Hawai‘i Volcanoes National Park consists of two adjacent tracts of montane rain forest that were partitioned into a number of fenced units beginning in 1981 [30]; these tracts are focal sites for management activities including ungulate removal, invasive plant control, and rare plant restoration. ROD was first confirmed in the ‘Ōla‘a Forest Koa unit in February 2019. The Thurston unit of Hawai‘i Volcanoes National Park is located to the east of Kīlauea Iki crater and contains some of the most heavily visited roads and trails in the National Park as well as some of the most intact native forests in Hawai‘i. ROD was first confirmed in the Thurston unit in April 2018, though ‘ōhi‘a trees exhibiting similar symptoms were observed in the area prior to this date. Vegetation at both the ‘Ōla‘a and the Thurston sites consists of a native-dominated open overstory canopy of M. polymorpha forest with occasional A. koa and a subcanopy dominated by native tree ferns or other native trees and ferns. The fourth site, the Kahuku Paddocks Unit of Hawai‘i Volcanoes National Park, was a working cattle ranch prior to being acquired by the National Park Service in 2003. The upper paddock area was fenced off in 2012, above which mouflon and pigs were removed and controlled. The upper paddock was considered to be ungulate-free in 2015. The lower paddock system was fenced off in 2017 and considered ungulate-free in June 2021 (Jon Faford, personal communication). Though both units are considered ungulate free, occasional ingress of feral mouflon or pigs from neighboring Kau Forest Reserve may occur either following windstorms or other localized events resulting in breaches. These animals are removed as soon as they are found. ROD was first confirmed in the Kahuku Unit in June 2016, and the vast majority of confirmed cases were located in the lower paddock area. Vegetation at the Kahuku site consists of a mesic woodland with an open overstory canopy of M. polymorpha and an understory dominated by introduced non-native grasses. The unfenced area to the east is the Ka‘u Forest Reserve, a state-managed property that supports a high density of pigs and some mouflon.

2.2. Remote Sensing Platforms and Imaging Campaigns

As part of a regular monitoring program for the four study sites, imaging flight operations involving small unmanned aerial systems (sUAS) and manned helicopters were conducted on a semi-regular basis (Figure 2). Coverage areas generally expanded over time with the adoption of the helicopter-based system.

2.2.1. sUAS Operations

sUAS operations were conducted with Inspire 2 or Matrice 200 (DJI Inc., Shenzhen, China) platforms carrying a Zenmuse X5S RGB camera (CMOS, 4/3”, 20.8 MP) (Figure 3). Images were collected in .jpg format from a flight altitude between 110 m–120 m and at an average forward speed of 10–13 m per second. A tablet-based Map Pilot mission planning iOS software (Drones Made Easy, San Diego, CA, USA) was used for all flights. Both forward and side image overlap percentages were set between 75%–80%, and ISO, f-stop, and exposure time were set to “auto” in the Map Pilot software. All sUAS operations were conducted by fully licensed pilots following Federal Aviation Administration regulations and all federal and state landowner requirements and permission conditions.

2.2.2. Manned Helicopter Imaging Operations

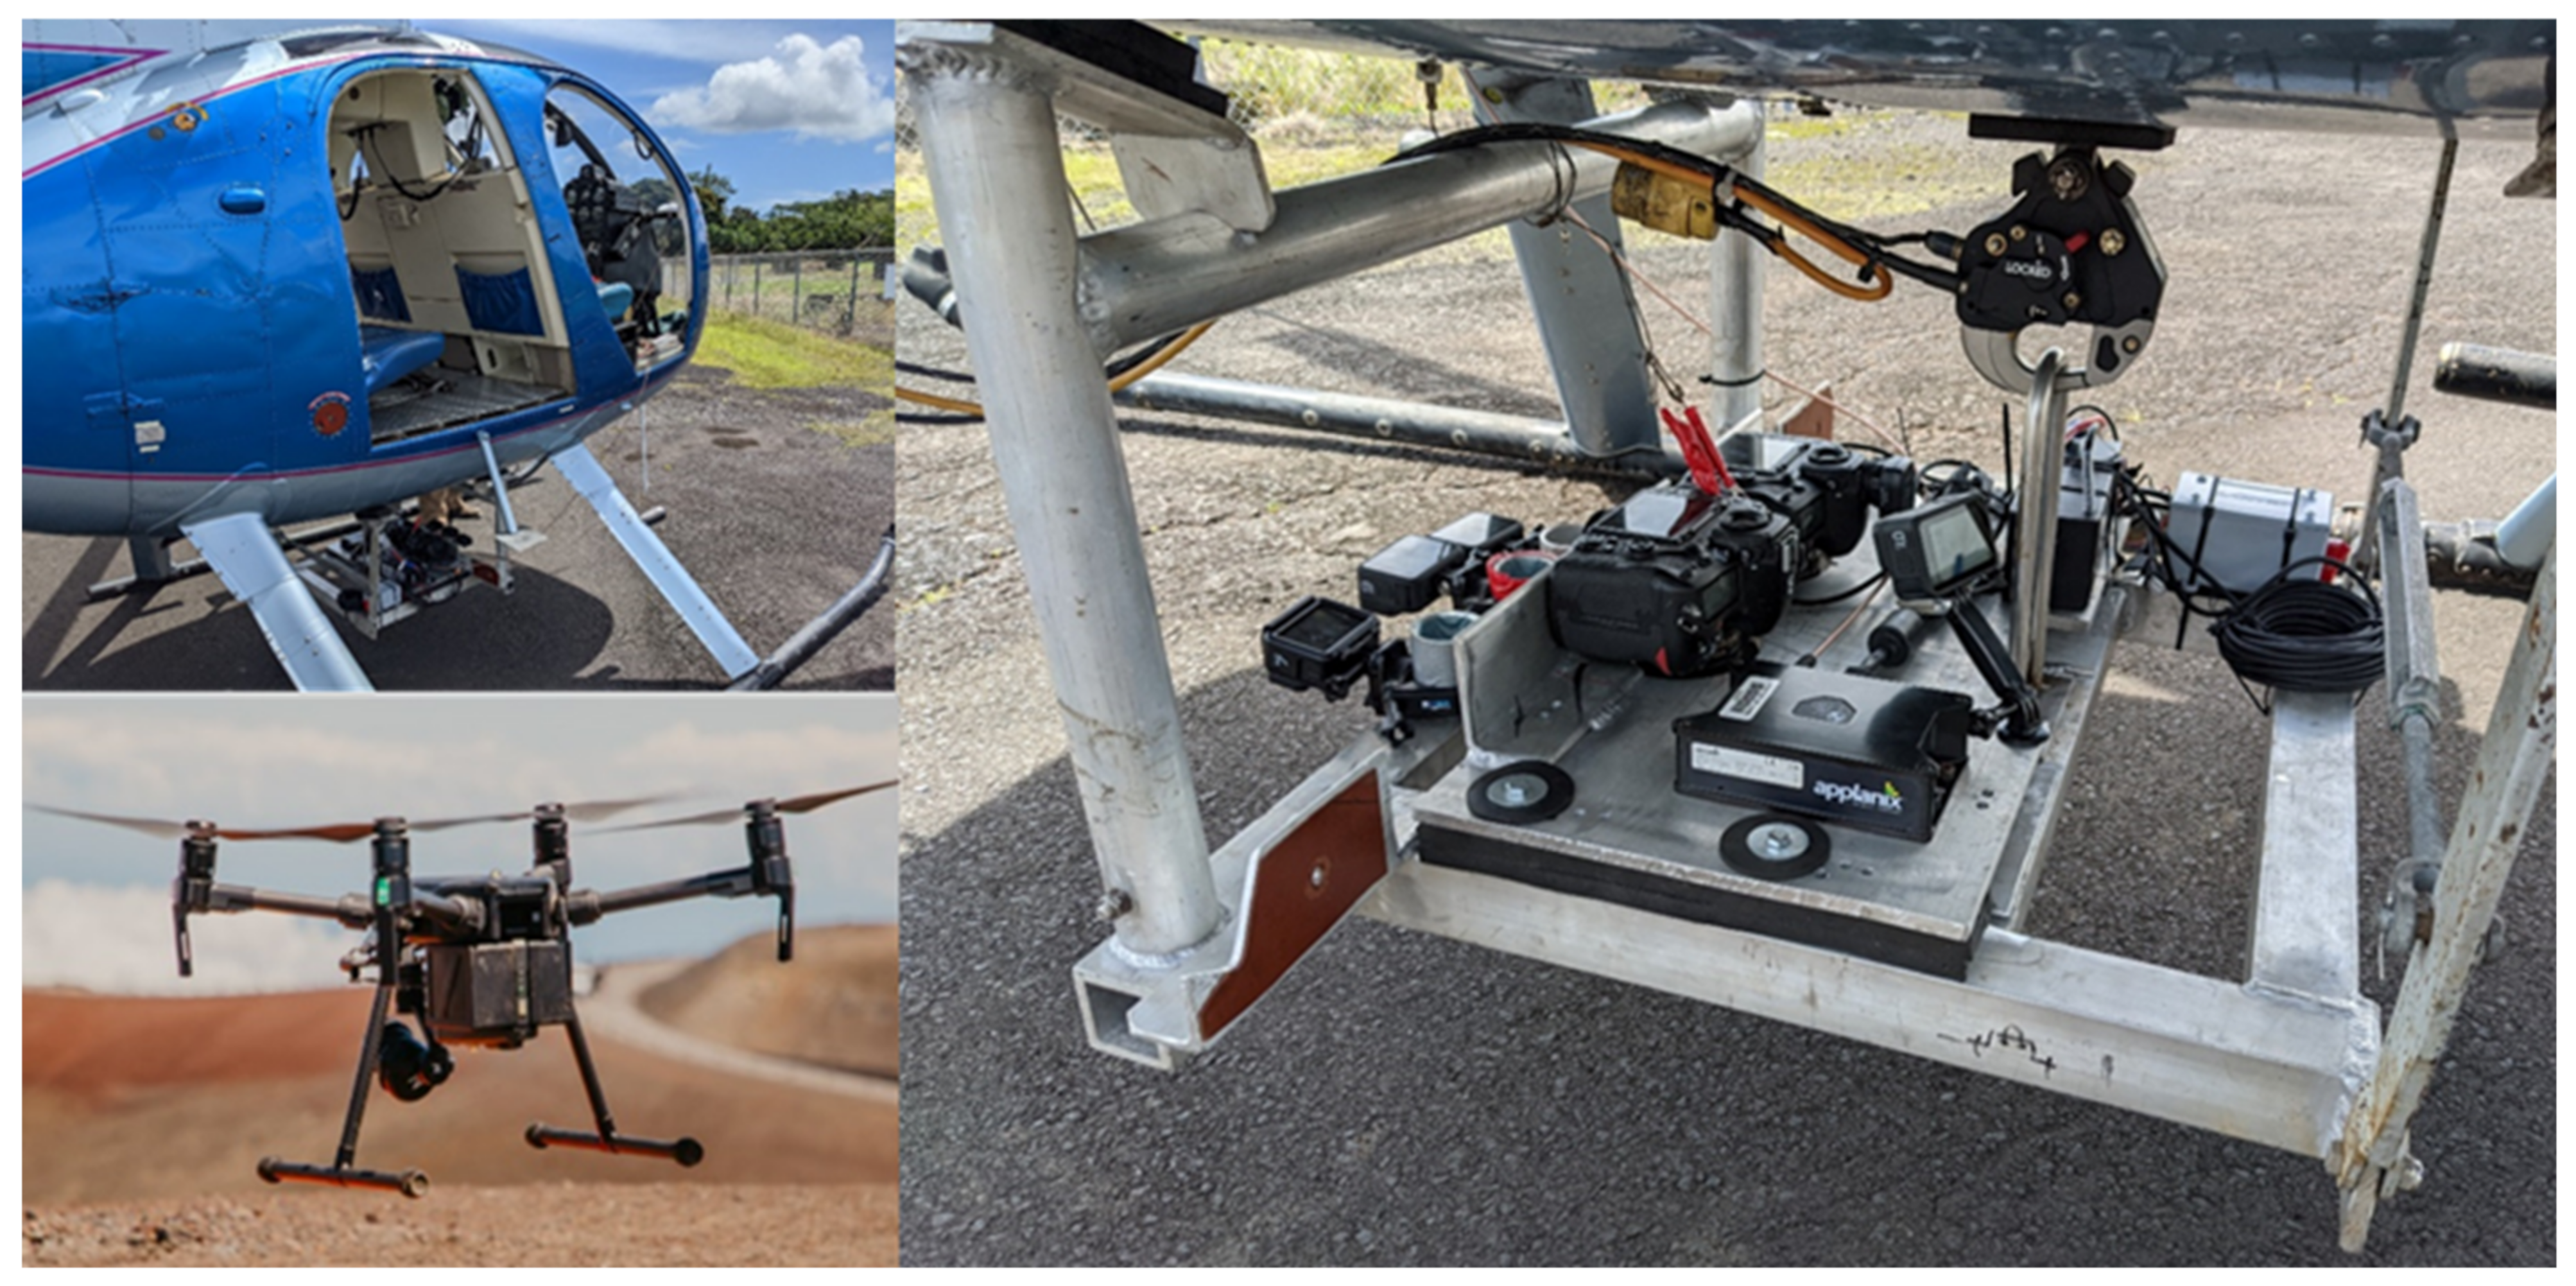
During January 2019 to December 2020, manned helicopter imaging operations were conducted with a Hughes 500 MD369C carrying a custom imaging payload developed by the UH Hilo Spatial Data Analysis & Visualization (SDAV) Research laboratory in partnership with the National Park Service, Volcano Helicopters, and R&R Machining and Welding in Hilo, Hawai‘i. The payload consisted of a GPS-enabled inertial measurement unit (GNSS-IMU) to provide accurate positional information and an array of consumer-grade cameras (Figure 3). These were mounted to an aluminum frame attached to the helicopter via a cargo hook as a Class B jettisonable external load (Figure 3). Four padded arms were used to brace and level the platform. The system was reviewed by regional inspectors from the U.S. Department of the Interior Office of Aviation Services and determined to be an approved and appropriate configuration for these flight operations.
The modular camera configuration included up to four Nikon D850 DSLR cameras (FX-format full frame CMOS, 45.7 MP), one of which was modified to an infrared sensor (MaxMax, Inc., Carlstadt, NJ, USA) to discriminate ROD-affected reddish-brown canopies from backgrounds of red colored soils. Images were collected with a 35 mm lens, an exposure time of 1/2000 to 1/3200, an f-stop of 4 to 5.6, and the ISO set to “auto”. A GNSS-IMU (POS AVX 210, Applanix Corporation, Richmond Hill, ON, Canada) with an external antenna provided camera orientation and GPS position information recorded to the DSLR camera photograph metadata. The DSLR cameras and the GNSS-IMU unit were isolated from vibration by a double-layer of 1.27 cm thick Sorbothane Duro 50 material (Sorbothane Inc., Kent, OH, USA). The camera configuration also included three GPS-enabled “action” cameras (GoPro Inc., San Mateo, CA, USA) with auto settings used to generate lower resolution orthomosaics of the flight coverage area. The cameras were set to collect photographs via internal intervalometers set to 1 s.
Helicopter mapping flights were typically conducted at 225–275 m above ground level (agl) with an average forward speed of 30 m/s, resulting in an average image GSD of 3 cm and swath width of 370 m for a single nadir DSLR camera. Flight lines were flown manually, guided by a set of pre-determined transects visible on a GPS-enabled touchscreen device.

2.3. Suspect Tree Detection and Confidence Rating

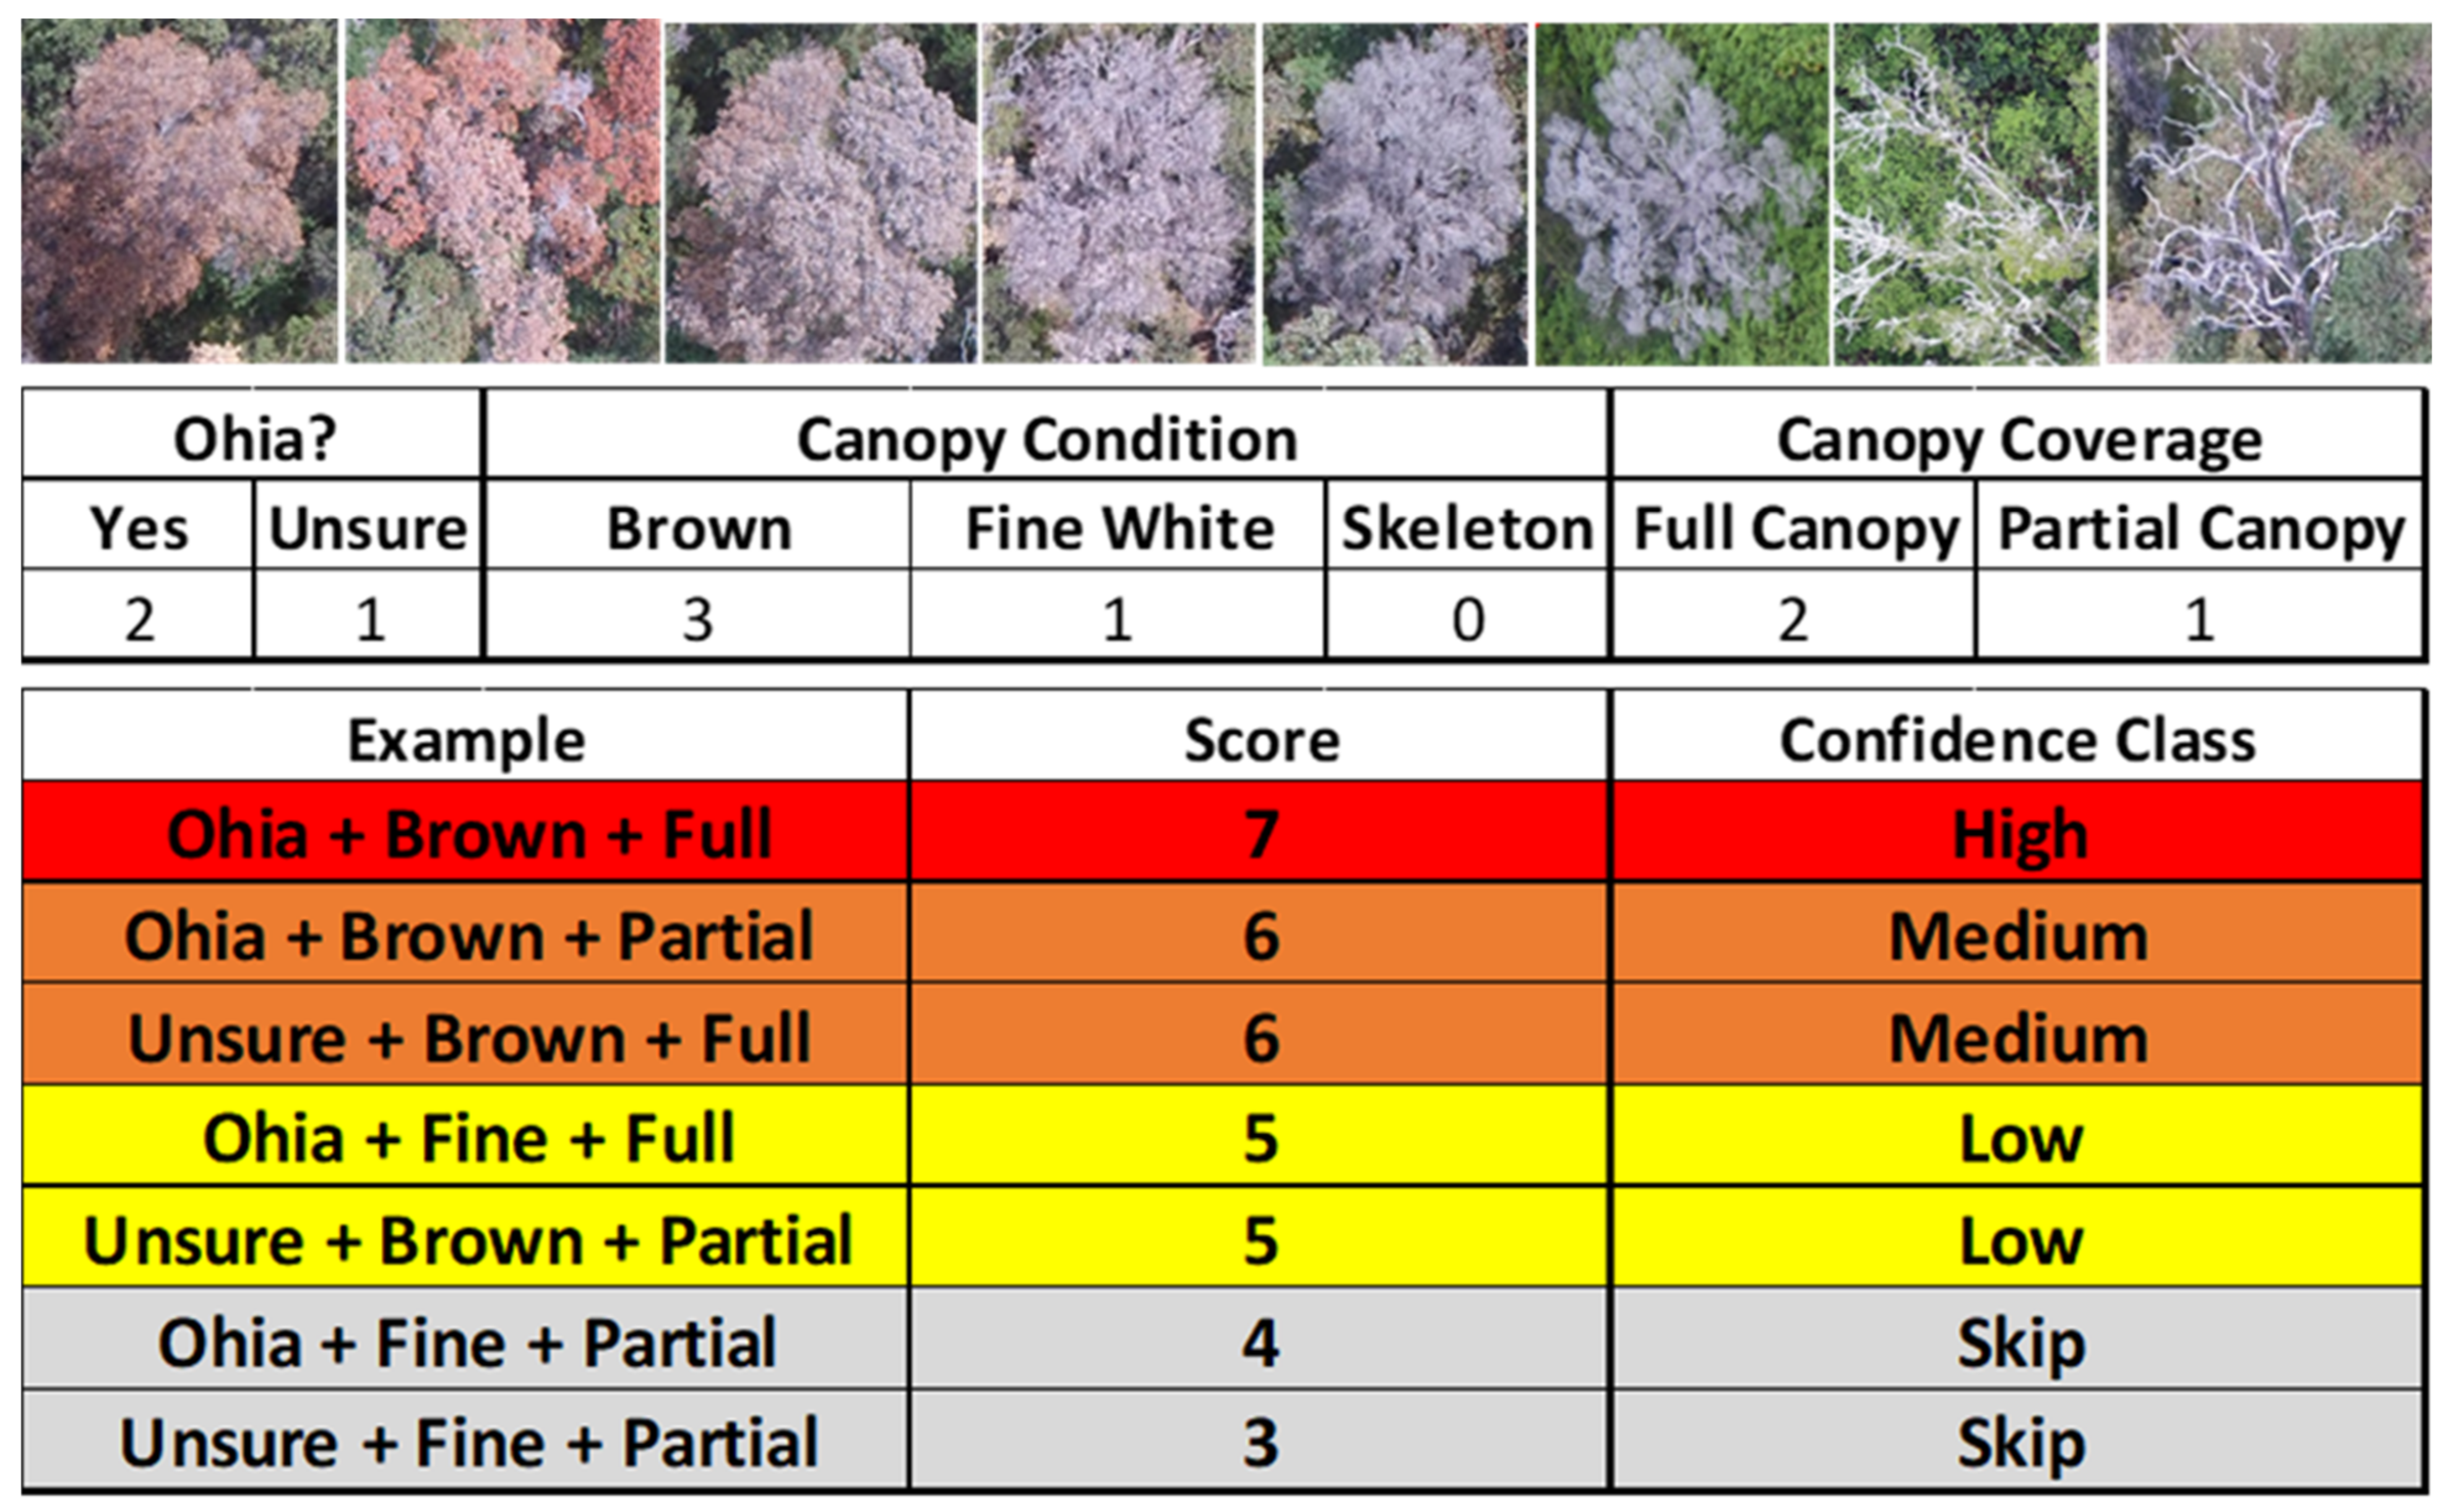
Following each imaging flight, trained and experienced human analysts identified suspect trees from original individual geotagged images and derived orthomosaics created via structure-from-motion (SfM) software Pix4D Mapper Pro (v4.5, Zurich, Switzerland) using standard settings. A set of reference photographs of confirmed ROD trees exhibiting various stages of canopy condition were used to assist with identification. A numeric system based on species identification and canopy condition was developed to provide confidence ratings (i.e., high, medium, or low) for individual trees suspected of ROD based on high resolution sUAS and helicopter RGB imagery (Figure 4). ‘Ōhi‘a is the dominant tree species in our study areas; it is generally readily identifiable, but shade and image blur can occasionally challenge species identification. Suspect trees designated as high confidence targets were determined to be ‘ōhi‘a trees exhibiting full reddish-brown canopies. Geographic coordinates of the center point of each suspect tree were determined from the orthomosaics.

2.4. Determination of Spatial Densities of Suspect ROD Trees

Suspect tree densities were determined for fenced and unfenced areas within each survey date using the generated suspect ROD tree point data, the surveyed area, and a GIS fencing layer for Hawai‘i island provided by the Hawai‘i Division of Forestry and Wildlife and updated by the Rapid ‘Ōhi‘a Death Data Manager (Brian Tucker, personal communication). For the May 2020 LFR helicopter survey, we determined the unfenced suspect point density for a core ROD infested area of 550 ha rather than the full 2600 ha coverage, which included pasture and other agricultural areas. The fenced area for the LFR was composed of multiple small exclosures that collectively amounted to 7.3 ha. Unfenced areas for the other three sites were the continuous imaged areas bordering the fenced-in units.

2.5. Sampling and Laboratory Analyses

Following image processing, suspect tree confidence ratings and positional coordinates were generated for each site. These data were provided to field crews experienced with ROD sampling protocols in the form of GIS layers uploaded to handheld GPS devices along with corresponding aerial photos with the targets clearly marked. Confidence ratings and geographic coordinates of the identified trees along with any site-specific considerations were used to prioritize sampling efforts. Time between imagery collection and delivery of suspect points to field crews at the four sites ranged from 8 days (LFR) to 36 days (‘Ōla‘a). Immediately following field sample collection, samples were delivered to the USDA Agricultural Research Service, Pacific Basic Agricultural Research Center (USDA ARS PBARC) in Hilo for testing via qPCR assay of sapwood shavings [34].
Together, our methods provide a time-series sequence of suspect tree points for each of the four study sites, with associated confidence levels from the areas covered by our imaging platforms. The imaged area increased over time for those sites where we initially relied on sUAS imagery alone and/or where we decided to expand the imaged area based on results from the prior flight. For the most recent imaging campaign included in this study, sampled points along with their confidence ratings are also shown. Not every suspect tree identified via aerial imagery was visited and sampled.

3. Results

3.1. Laupāhoehoe Forest Reserve (LFR)

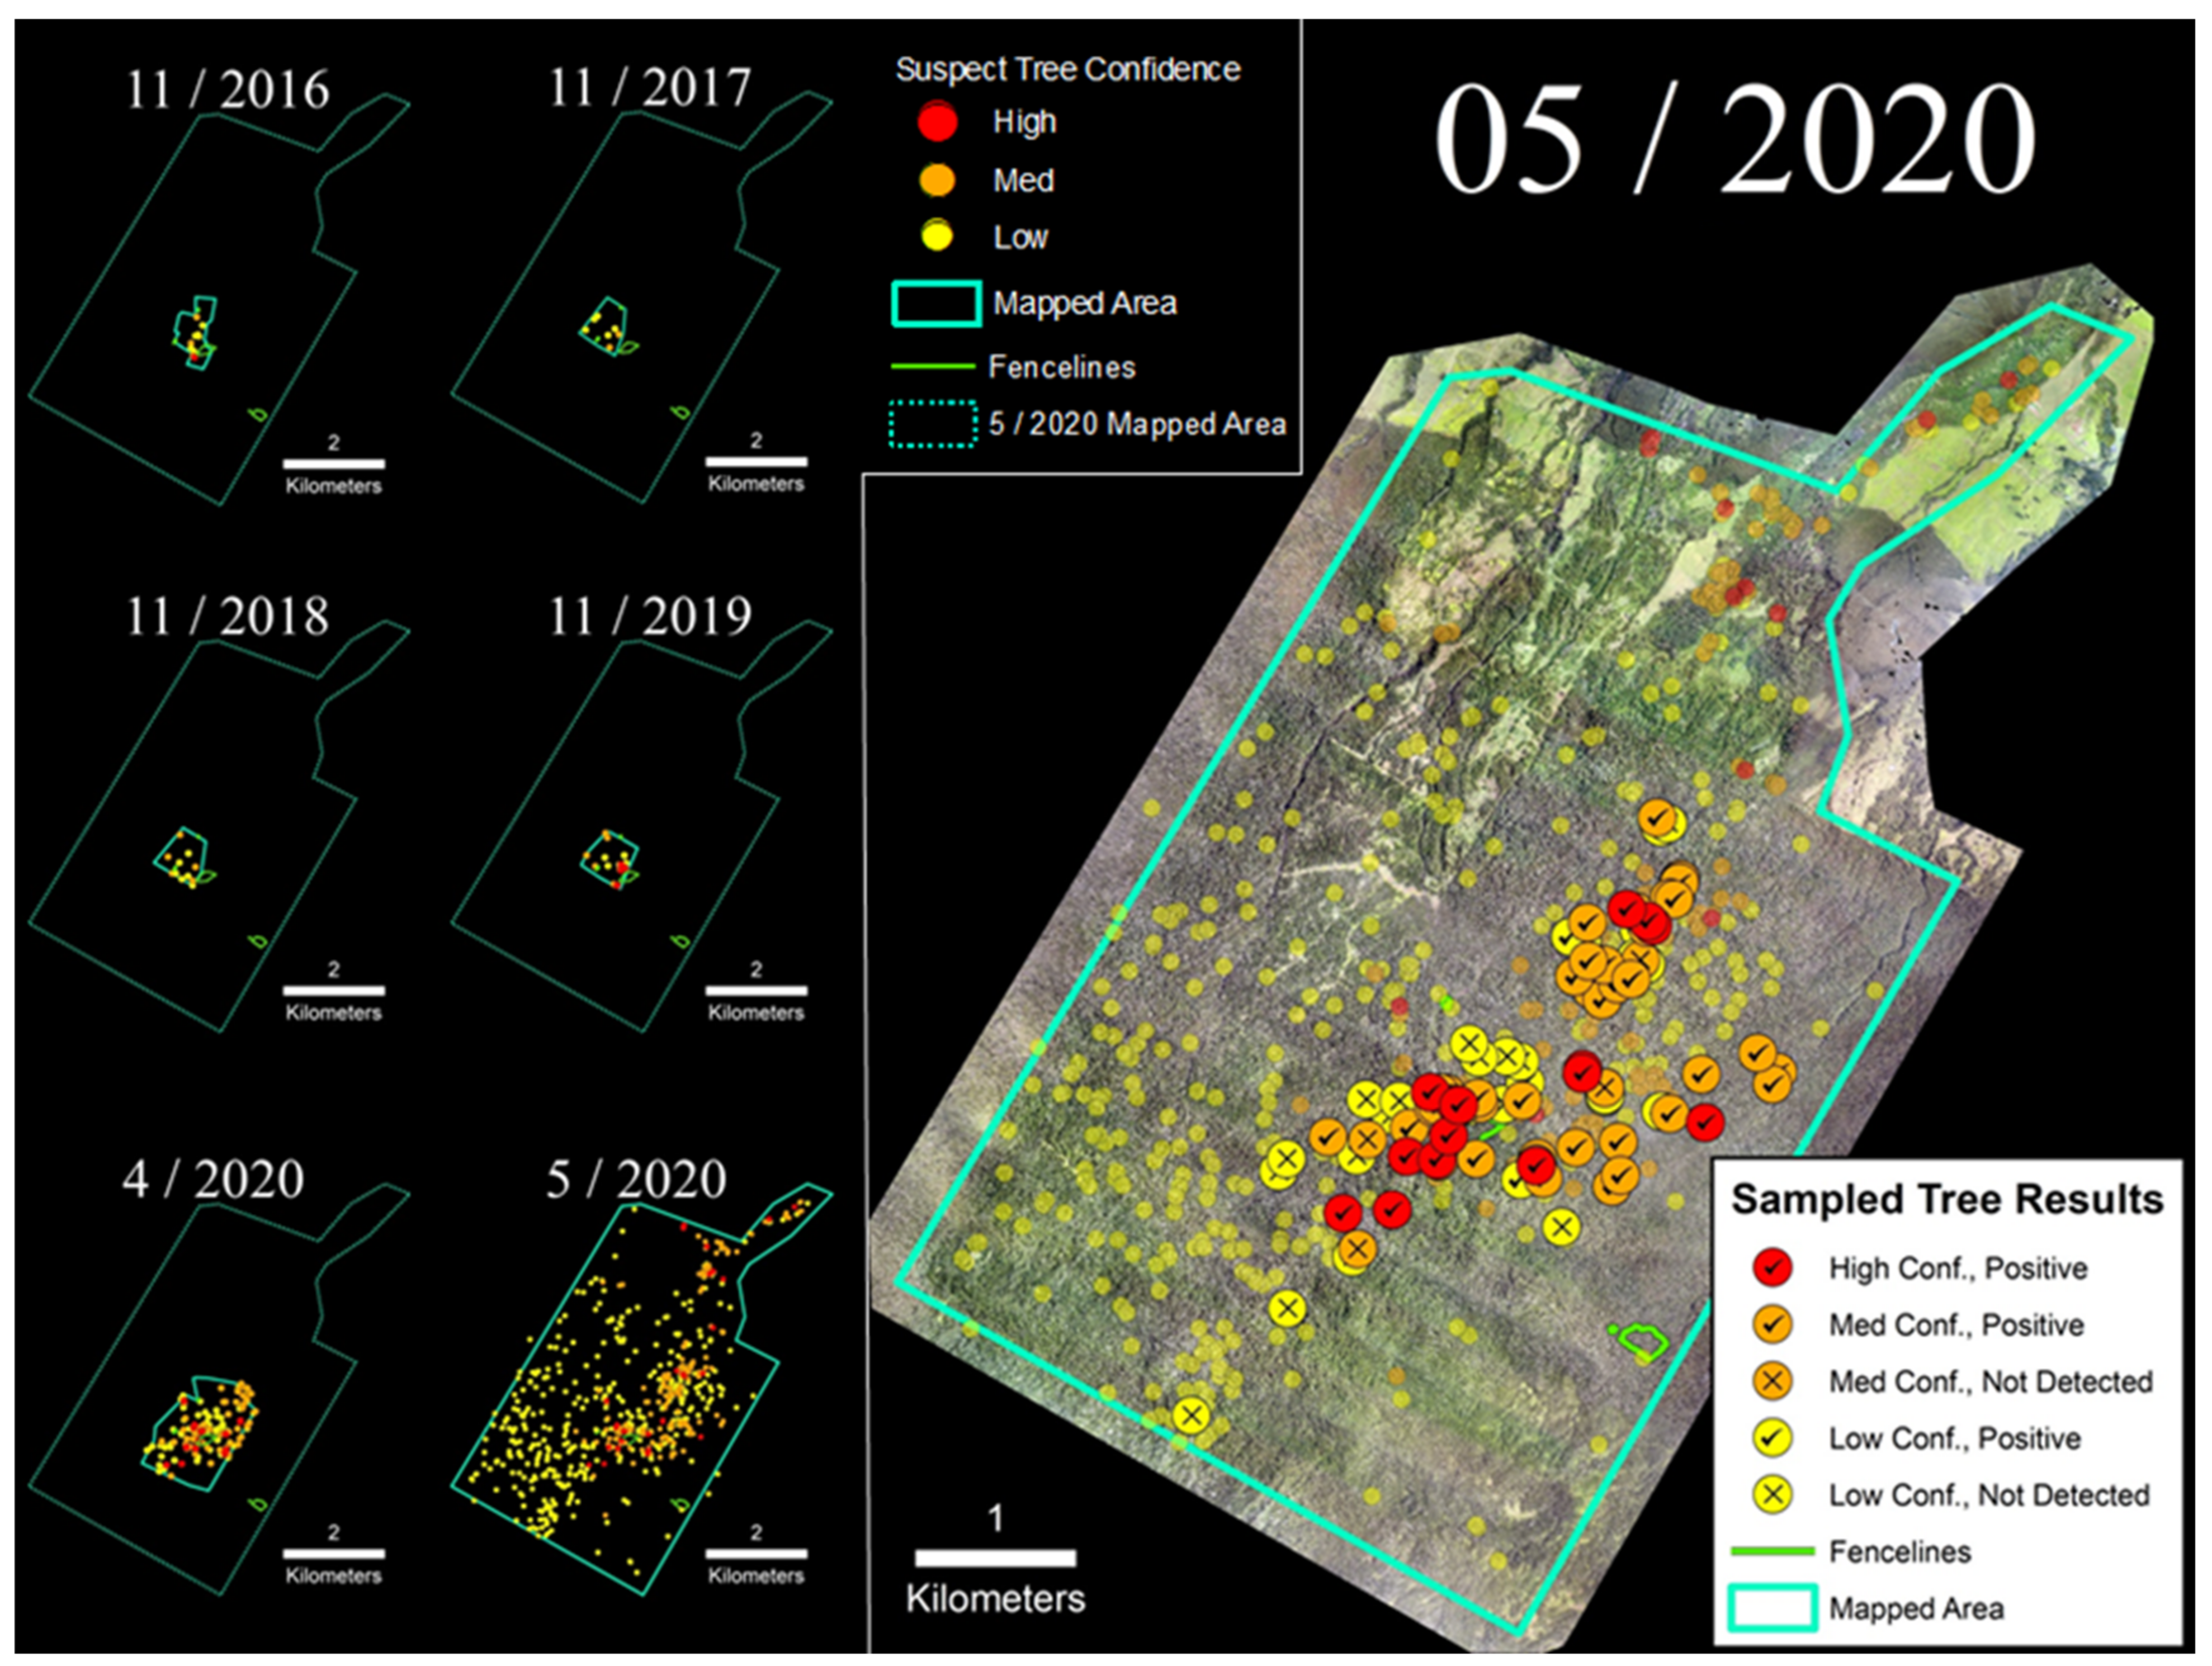
The LFR site was the largest and the most extensively sampled of the four sites included in this study (Figure 5). Following discovery of the initial infected tree in 2016, the number of suspect trees within the sUAS-monitored area remained very low and relatively stable until late 2019, at which point there was an increase in the number of trees expressing characteristic symptoms and positive laboratory samples; five trees were confirmed as infected with C. lukuohia in 2019 (B. Buckley, personal communication). The number of observed suspect trees increased further by April 2020, leading to additional sUAS flights that expanded the regular survey area from 60 ha to 260 ha, followed by a more extensive 2600 ha helicopter survey the following month (Figure 5). On the basis of that May 2020 survey, 675 suspect ROD trees were detected, with two located within 7.3 ha of LFR fenced exclosure areas. Samples collected from May 2020 helicopter surveys (n = 99) returned C. lukuohia detection rates of 88% and 100%, respectively, for a subset of medium and high confidence trees, while 46% of the samples collected from low confidence trees tested positive for C. lukuohia (Table 2).

3.2. ‘Ōla‘a Tract

We employed the helicopter imaging system to survey the ‘Ōla‘a tract of Hawai‘i Volcanoes National Park in January 2019 and again in August 2020 (Figure 6). The January 2019 survey (550 ha) covered the southeastern corner of the Koa Unit and portions of the surrounding unfenced forest. Results revealed a strong fence line signal with much higher densities of suspect trees in the outer unfenced area where ungulates were present (1.14 suspect trees/ha) compared to within the fenced Koa Unit (0.02 suspect trees/ha). Six sampled trees located within the Koa Unit detected from the 2019 survey tested positive for C. lukuohia. Our surveyed area more than doubled in August 2020 to 1200 ha. Following that survey, we observed a much higher density of suspect trees within the Koa Unit (i.e., 2.78 suspect trees/ha). Of the 56 sampled trees following the 2020 survey, 86% of the medium confidence trees and 100% of the high confidence suspect trees tested positive for C. lukuohia (Table 2). Four non-detections were collected from medium confidence suspect trees located in the northern Pu‘u Unit.

3.3. Kahuku Unit

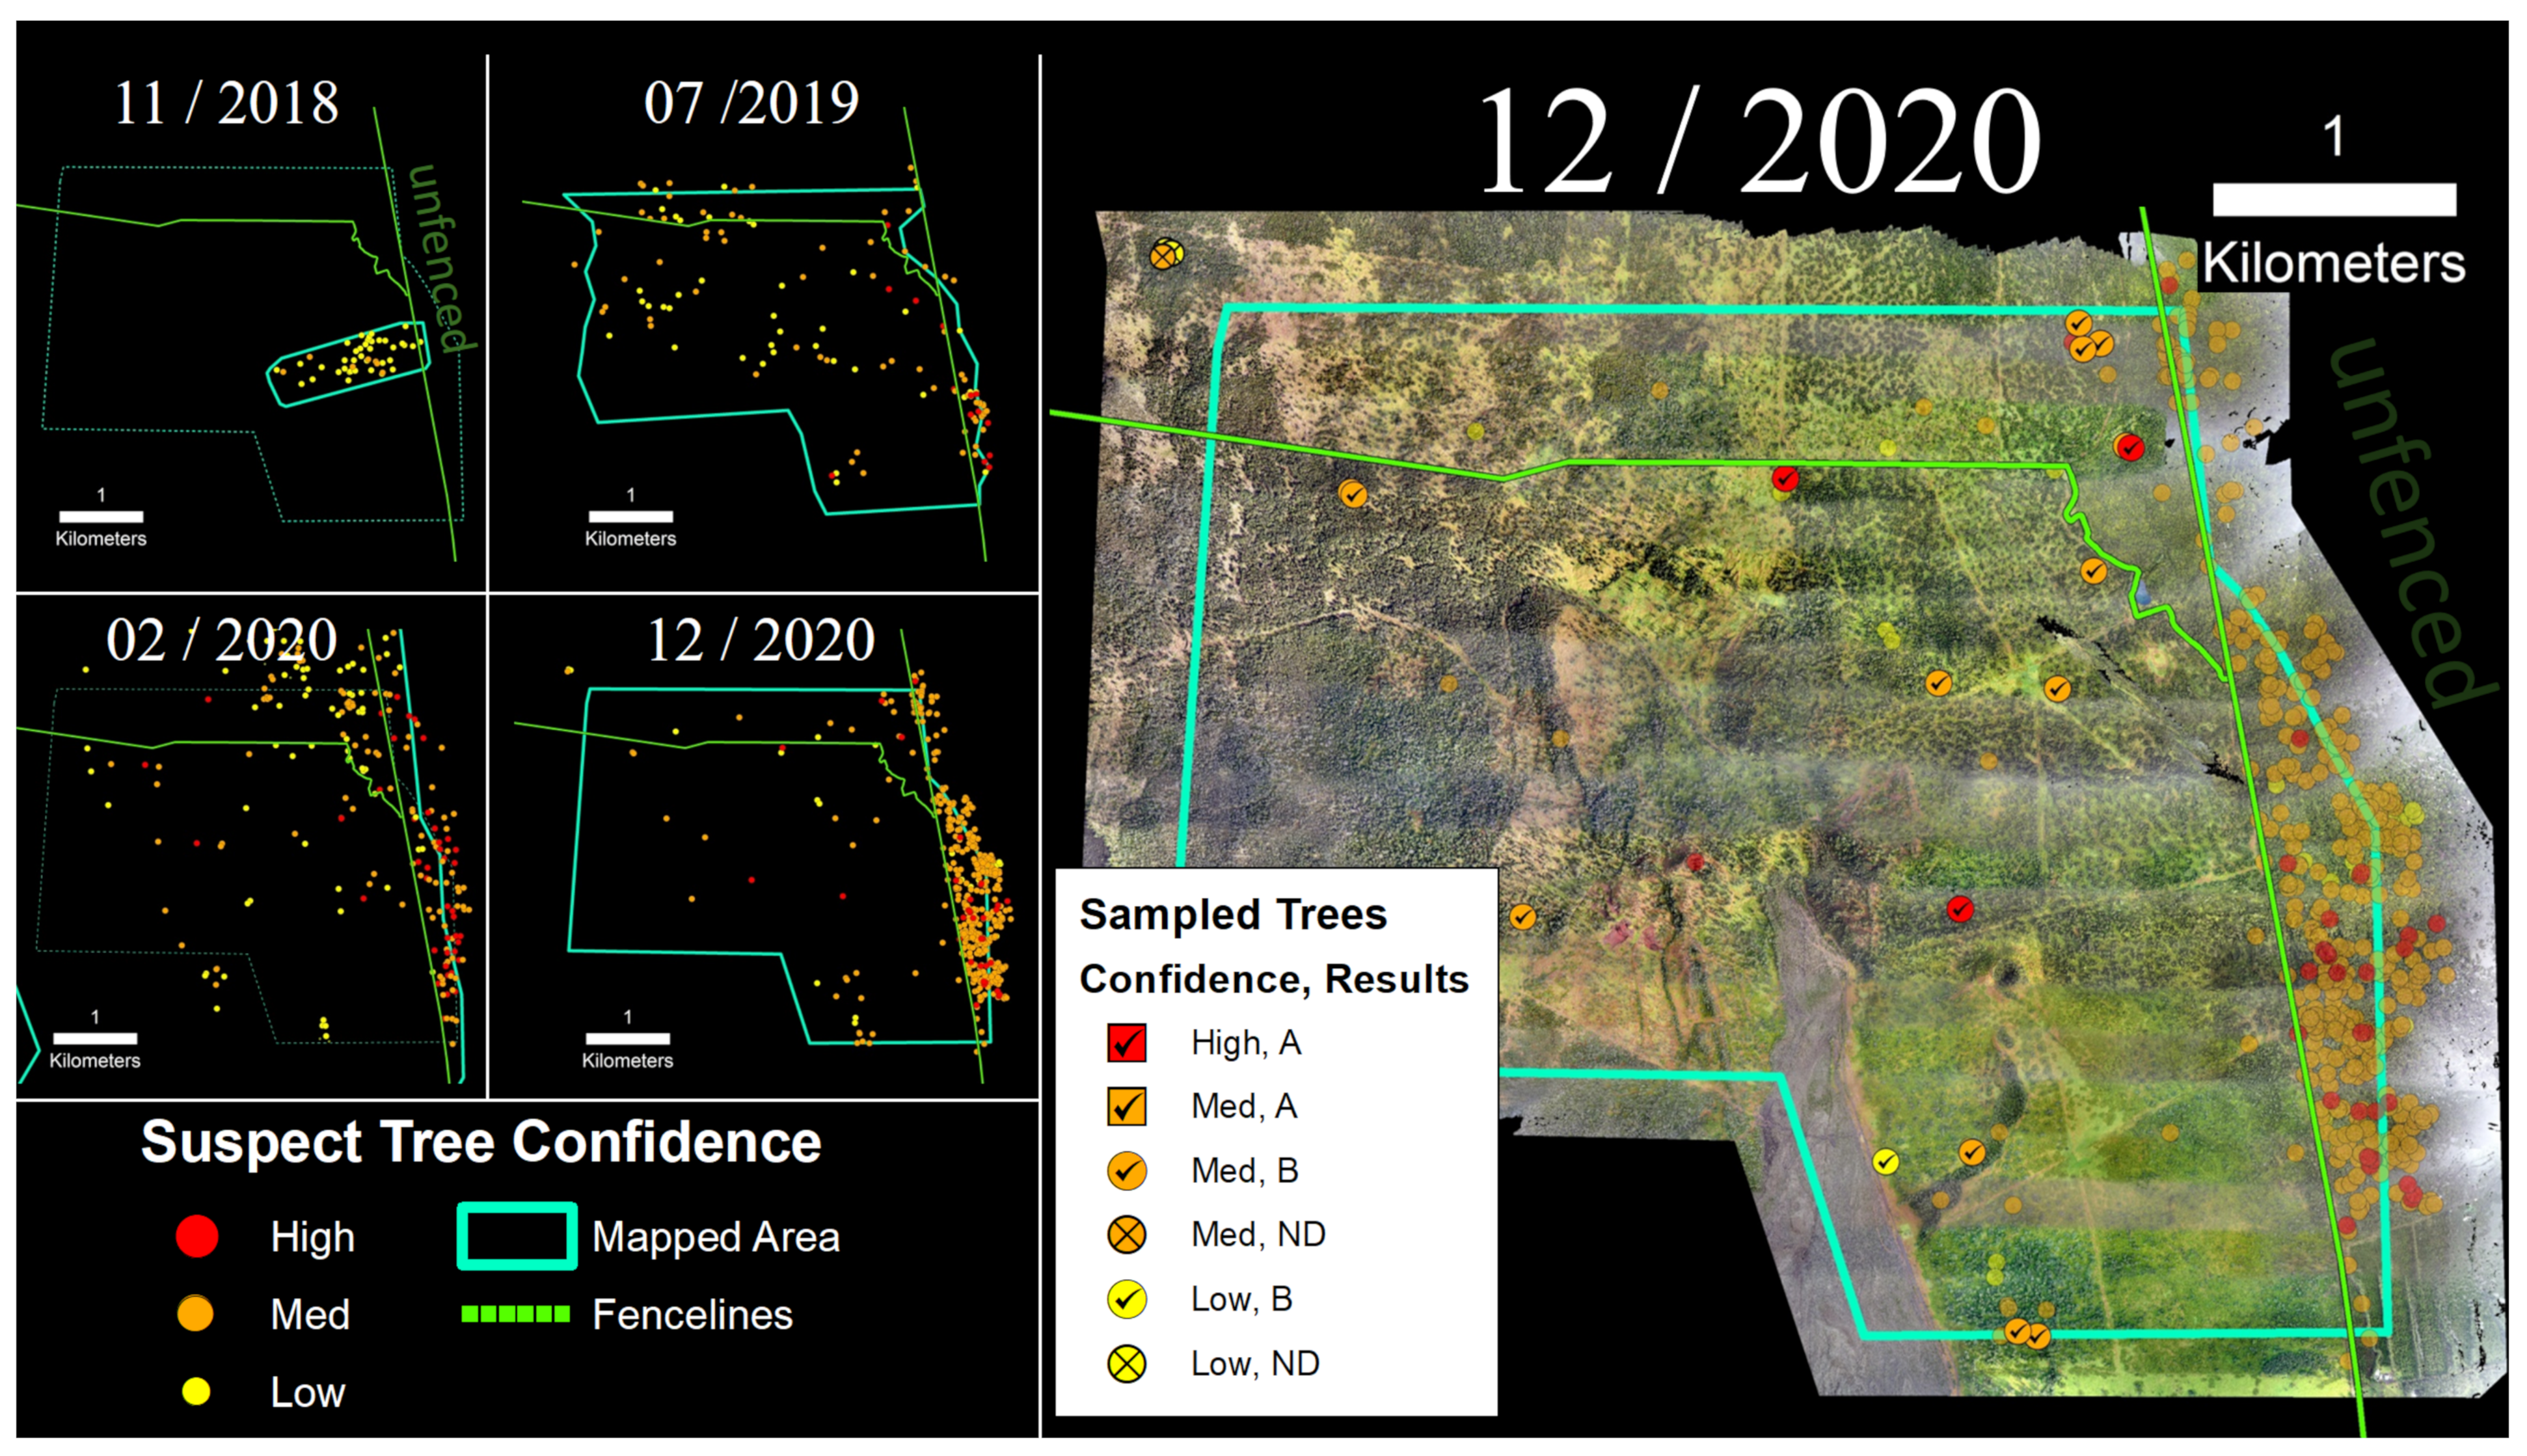
Portions of the Kahuku Paddocks Unit of Hawai‘i Volcanoes National Park were surveyed between 2018 and 2020 (Figure 7). In November 2018, 110 ha were mapped via sUAS flights, and a number of suspect trees were identified and tested positive for C. lukuohia. The survey area was expanded to ~1650 ha with helicopter flights in 2019 and 2020. Samples collected from suspect trees identified following the two helicopter surveys in 2020 (n = 55) resulted in detection rates of 93% for medium confidence trees and 83% for high confidence trees (Table 2). The Kahuku Unit was the only site where C. huliohia was detected. Within the fenced-in Kahuku Unit, the density of suspect trees decreased from 0.06 to 0.03 suspect trees/ha between 2019 and 2020. In the unfenced area to the east, suspect tree densities increased over this same period from 0.34 to 2.42 suspect trees/ha.

3.4. Thurston Unit

Three hundred ha of the Thurston Unit of Hawai‘i Volcanoes National Park were surveyed in December 2020 via the helicopter imaging system (Figure 8). Within the fenced section of the park captured in the survey, we identified 130 suspect trees, and we sampled and tested a subset of medium and high confidence trees (n = 56). Of those, 0% of the medium confidence trees and 6% of the high confidence suspect trees tested positive for C. lukuohia (Table 2). These detection rates were significantly lower than those of the other three sites. Within the fenced-in survey area, the density of suspect trees was 0.70 trees/ha. Outside of the park boundary to the northeast, a dense band of 114 suspect trees was observed running along the boundary of the survey area (2.00 suspect trees/ha), but these were not tested.

3.5. Ungulate Presence and ROD-Related ‘Ōhi‘a Mortality

Across all four study sites, imagery revealed a strong fence line signal with higher densities of ‘ōhi‘a mortality and suspect trees in unfenced (ungulate-present) compared to fenced (ungulate-free) areas (Figure 9). Suspect ROD tree densities were 2.2 times higher in unfenced areas in the 5/2020 LFR imagery, 53.7 times higher in the 01/2019 ‘Ōla‘a (Koa unit) imagery, 69.2 times higher in the 12/2020 Kahuku imagery, and 2.8 times higher in the 12/2020 Thurston imagery. The exception was the 08/2020 survey of the ‘Ōla‘a tract of Hawai‘i Volcanoes National Park where the fenced Koa Unit had a mortality density 1.5 times higher than in the surrounding imaged unfenced area.

4. Discussion

4.1. Confidence Ratings and Laboratory Sample Results

Sampled suspect trees identified from high resolution aerial imagery across all four sites (n = 246) exhibited positive detection rates of 76% (high confidence), 76% (medium confidence), and 49% (low confidence), respectively. These overall detection rates were suppressed by results from the Thurston site, where only 6% of the high confidence trees (one out of 16) and 0% of the medium confidence trees (0 out of 20) returned positive ROD test results. The cause of death for these ‘ōhi‘a trees remains undetermined. Unexplained ‘ōhi‘a mortality in Hawai‘i Volcanoes National Park was observed for some time from ground-based observations (Davis, 1947), and within Thurston specifically, there were repeated ROD sampling campaigns dating back to 2015 with very few confirmed cases (two out of 91 total sampled trees). There is no broader pattern of mortality in this area affecting other tree or shrub species that might point to volcanic gas emissions or some other environmental condition, but unexplained tree mortality is more widespread in adjacent lower elevation and drier environments in the park, likely due to environmental and pathogenic causes. Previous studies of ‘ōhi‘a mortality unrelated to ROD, including the 1970s ‘ōhi‘a dieback, found that substrate age and type along with elevation and rainfall were related to spatial patterns of mortality as part of a natural canopy development sequence [17,35,36,37]. Fire, insects, and drought are other known stressors that can contribute to ‘ōhi‘a mortality [36,38,39,40].
For the other three sites in this study, high confidence trees (n = 50) exhibited 98% positive detection rates, and medium confidence trees (n = 117) exhibited 89% positive detection rates (Table 2). The disparity in positive detection rates between Thurston and the other three sites is of great interest. It highlights the difficulty in determining the cause of ‘ōhi‘a mortality from remotely sensed imagery alone, even when using multispectral or hyperspectral data [23,24], especially since symptoms of ROD can be confused with symptoms of drought [21]. Other fungal pathogens affecting forests worldwide, including ash dieback, myrtle rust, and oak wilt, were successfully detected via multispectral and hyperspectral imagery, though misclassification with drought can occur, and early detection remains a challenge [41,42,43,44].
Our results show that helicopter surveys using consumer-grade RGB cameras are an effective and rapid means of detecting ‘ōhi‘a mortality at a landscape level (1000 s of ha) across lowland, montane, and subalpine Hawaiian forests but cannot be definitively used to determine cause of death. High-resolution RGB imagery was used in other studies to identify forest tree species [45,46], and detect bark beetle damage in fir trees in Russia [47] without requiring the considerable calibration and processing required for more sophisticated sensors [48]. Although our image analysis for this study was based on photo interpretation by trained human analysts, we are developing a convolutional neural network (CNN) to automate and improve this process [49]. This should greatly reduce the time and the labor needed to detect suspect trees and allow us to provide coordinates of suspect points to field crews within hours of a flight rather than the 8–36 days reported here.
The rapid temporal crown changes associated with ROD provides one means to confidently identify ROD affected trees from a time series of high-resolution visible imagery. However, in order to properly capture the mortality phenomenon, appropriate imaging return intervals on the order of weeks or months, rather than years, may be needed. In this case, satellite imagery may be effectively employed to provide the needed temporal resolution to detect rapid changes as in the U.S. Forest Service’s Operational Remote Sensing program for detecting forest disturbances across the conterminous United States [50]. Sentinel-2, World-View, and other satellite systems are extensively used to monitor forest health around the world [51,52,53,54], and CubeSat satellites such as the Planet Labs constellation now generate near-daily three meter spatial resolution imagery. Planet Labs data are used to capture forest flowering events [55] and disturbance events from fires to tornados [56,57], but sub-meter spatial resolution imagery is still needed to confidently monitor individual trees, and persistent cloud cover can be an issue. A revealing example of this is in East Kaua‘i, where there are multi-year gaps in the availability of cloud-free World-View satellite imagery. In March 2021, a 22,260 ha helicopter imaging survey was completed for selected priority areas on Kaua‘i, including over some of these cloudy areas. In total, 395 suspect trees were identified as a result of those flights, but only 11 were considered high confidence, and these were generally located in areas of known ROD infection. Continued monitoring of high-value forests yet to be impacted by ROD is critical for limiting further spread, and the helicopter-based imaging platform contributes to that effort.
The helicopter imaging system also allowed us to greatly expand our areas of survey. For example, early sUAS operations in the LFR covered an area of 60 ha, while the May 2020 helicopter survey covered > 2600 ha (Figure 5). In densely forested areas with limited visibility on the ground and few options for take-off and landing, sUAS operations can be very challenging [58]. The helicopter system allowed us to obtain aerial imagery over much larger areas with a spatial resolution equivalent to what we can obtain with sUAS platforms and also allowed us to collect imagery in areas that were chronically cloudy and challenging to image acquisition using satellite platforms. Within the near future, with more capable platforms and changes to the regulatory framework for beyond visual line of sight operations [59,60], we anticipate replacing the manned helicopter imaging system with a UAS platform. Until that time, in Hawai‘i and other places with rugged and remote terrain and persistent cloud cover, helicopter-based imaging systems can support a variety of conservation and land management needs over landscape scales [61,62,63]. An added benefit of this system is improved safety margins for aerial survey teams. In the past, such surveys would occur with a team of one to three onboard spotters. This system eliminates or greatly reduces the risk to these staff.

4.2. Ungulates, Fence Lines, and Spatial Patterns of ROD-Related ‘Ōhi‘a Mortality

The strong fence line pattern observed across the four sites included in this study may be the result of the increased wounding that ungulates sometimes inflict on ‘ōhi‘a trees. Ranched cattle in rotational grazing systems in Hawai‘i with supplemental water, feed, and mineral blocks have their nutritional needs met and only rarely strip ‘ōhi‘a bark (Riley De Mattos, personal communication). Feral cattle without those supplements are more likely to engage in bark stripping, creating wounds on ‘ōhi‘a trees and pathways for ROD infection. Feral pigs, with their larger population numbers and rooting, rubbing, and browsing behaviors [64,65], may be even more important as wounding agents for the spread of ROD.
The ‘Ōla‘a site in particular showed the importance of fence lines and their continued maintenance for limiting the spread of ROD. In the 2019 survey, only a small number of suspect trees were identified within the ‘Ōla‘a Koa Unit (0.02 suspect trees/ha), while in the August 2020 survey, the density of suspect trees was >100 times higher (2.78 suspect trees/ha). This was even higher than what we observed in the unfenced area (1.81 suspect trees/ha) during this same survey period. The Koa Unit fence line was damaged and breached by feral cattle between the 2019 and the 2020 surveys, which allowed feral pigs to ingress and establish in the unit. Based on the size of the population discovered in 2020, managers suspect limited pig ingress also occurred prior to 2019, though the exact date is unknown (Jon Faford, personal communication). The other fenced units included in the expanded 2020 survey to the north and the west of the Koa Unit had intact fence lines and contained very few suspect trees, somewhat similar to the densities of the Koa Unit in 2019 (Figure 6). No positive cases of ROD were confirmed within these areas to date, although positive samples were collected from trees just outside of the fence lines. In the Kahuku site, a strong fence line signal became increasingly apparent over time (Figure 7 and Figure 9).
Our results show forested areas with confirmed ROD cases and ungulates present can experience ‘ōhi‘a mortality densities up to 69 times higher than neighboring ungulate-free areas. This is supported by previous work showing that fencing was a highly significant factor in predicting C. lukuohia detections from laboratory samples collected across Hawai‘i island [66]. While the specific mechanism(s) relating ungulate activity and ‘ōhi‘a mortality are beyond the scope of this study, additional research in this area is needed. For example, different ungulate species likely cause different types of wounds, and feral ungulates likely behave differently than domesticated animals. Better understanding these differences as well as other possible ROD vectors, including localized wind events and ambrosia beetle activity [67], will enhance our ability to protect remaining ‘ōhi‘a forest stands. Regardless of the specific mechanisms involved, excluding ungulates from forested areas appears to be one of the few management practices available for land managers beyond tree felling [68] that can clearly and significantly lessen the impacts of ROD in Hawai‘i.

5. Conclusions

With respect to areas that are at risk of experiencing ROD, which encompasses the full range of ‘ōhi‘a across the Hawaiian islands [66], repeat visible-wavelength high resolution remote sensing provides an effective and efficient means by which to monitor forested areas. Early and accurate detection and diagnosis of ROD, which this integrated monitoring program can provide, is key to minimizing effects across the landscape by increasing options for management. Our results show that this imagery and the associated rating system for identifying candidate suspect ROD trees provides a sensitive measure of ‘ōhi‘a mortality at the individual tree level, although it lacks the capacity to confidently discriminate the cause of mortality. Helicopter imaging platforms currently have an advantage over sUAS platforms in terms of spatial coverage over remote areas, but that advantage may become less important as more capable sUAS become available and the regulatory framework for beyond visual line of sight flight operations improves. The spatial patterns of ‘ōhi‘a mortality observed across all four sites included in this study showed significant differences in areas with and without ungulates, suggesting that ungulate exclusion is an effective management tool to lessen the impacts in ROD in forested areas in Hawai‘i.

Author Contributions

Conceptualization, R.L.P., T.S., D.B., R.F.H. and L.M.K.; methodology, R.L.P. and T.S.; validation, L.M.K., E.B., K.K. and D.D.; formal analysis, R.L.P., T.S., E.B. and K.K.; investigation, R.L.P. and D.B.; resources, R.L.P., D.B., R.F.H. and L.M.K.; data curation, T.S. and E.B.; writing—original draft preparation, R.L.P. and T.S.; writing—review and editing, R.L.P., T.S., D.B., R.F.H. and L.M.K.; visualization, R.L.P. and T.S.; supervision, R.L.P.; project administration, R.L.P.; funding acquisition, R.L.P., D.B., R.F.H. and L.M.K. All authors have read and agreed to the published version of the manuscript.

Funding

This research was funded by the Hawaii Department of Land and Natural Resources and used instrumentation purchased via grants from the National Science Foundation, No. (1839095 and 1828799). Collaborative research between the National Park Service and the University of Hawai‘i was conducted through the Hawai‘i-Pacific Islands Cooperative Ecosystem Studies Unit, Agreement Number P17AC01498.

Data Availability Statement

The data presented in this study are available on request from the corresponding author.

Acknowledgments

We thank the ROD Science Group, Hawai‘i Volcanoes National Park ROD team, and Big Island Invasive Species Committee for sample collection and Kyson Dunn, Nainoa Goo, Kalena Shiroma, Robert Hamnett, and Eddie Bufil for fieldwork that contributed to the results of the study. We thank Dwayne Montoya Aiona, Bill Buckley, Bill Stormont, Russell Iyo, and David Okita for their invaluable technical assistance. We thank Sharon Dansereau for reviewing the manuscript and providing valuable suggestions. Mention of trademark, proprietary product, or vendor does not constitute a guarantee or warranty of the product by the U.S. Dept. of Agriculture and does not imply its approval the exclusion of other products or vendors that also may be suitable.

Conflicts of Interest

The authors declare no conflict of interest.

References

  1. Charnley, S.; Carothers, C.; Satterfield, T.; Levine, A.; Poe, M.R.; Norman, K.; Donatuto, J.; Breslow, S.J.; Mascia, M.B.; Levin, P.S.; et al. Evaluating the best available social science for natural resource management decision-making. Environ. Sci. Policy 2017, 73, 80–88. [Google Scholar] [CrossRef]
  2. Esmail, B.A.; Geneletti, D. Multi-criteria decision analysis for nature conservation: A review of 20 years of applications. Methods Ecol. Evol. 2018, 9, 42–53. [Google Scholar] [CrossRef] [Green Version]
  3. Soliku, O.; Schraml, U. Making sense of protected area conflicts and management approaches: A review of causes, contexts and conflict management strategies. Biol. Conserv. 2018, 222, 136–145. [Google Scholar] [CrossRef]
  4. Yousefpour, R.; Temperli, C.; Jacobsen, J.B.; Thorsen, B.J.; Meilby, H.; Lexer, M.J.; Lindner, M.; Bugmann, H.; Borges, J.G.; Palma, J.H.N.; et al. A framework for modeling adaptive forest management and decision making under climate change. Ecol. Soc. 2017, 22, 40. [Google Scholar] [CrossRef]
  5. Chuvieco, E.; Aguado, I.; Salas, J.; García, M.; Yebra, M.; Oliva, P. Satellite remote sensing contributions to wildland fire science and management. Curr. For. Rep. 2020, 6, 81–96. [Google Scholar] [CrossRef]
  6. Feng, Y.; Negrón-Juárez, R.I.; Chambers, J.Q. Remote sensing and statistical analysis of the effects of hurricane María on the forests of Puerto Rico. Remote Sens. Environ. 2020, 247, 111940. [Google Scholar] [CrossRef]
  7. Pontius, J.; Schaberg, P.; Hanavan, R. Remote sensing for early, detailed, and accurate detection of forest disturbance and decline for protection of biodiversity. In Remote Sensing of Plant Biodiversity; Springer: Cham, Switzerland, 2020; pp. 121–154. [Google Scholar]
  8. Senf, C.; Seidl, R.; Hostert, P. Remote sensing of forest insect disturbances: Current state and future directions. Int. J. Appl. Earth Obs. Geoinf. 2017, 60, 49–60. [Google Scholar] [CrossRef] [Green Version]
  9. Lechner, A.M.; Foody, G.M.; Boyd, D.S. Applications in remote sensing to forest ecology and management. One Earth 2020, 2, 405–412. [Google Scholar] [CrossRef]
  10. Sharma, L.K.; Gupta, R.; Pandey, P.C. Future aspects and potential of the remote sensing technology to meet the natural resource needs. In Advances in Remote Sensing for Natural Resource Monitoring; John Wiley & Sons, Ltd.: Hoboken, NJ, USA, 2021; pp. 445–464. ISBN 978-1-119-61601-6. [Google Scholar]
  11. Waser, L.T.; Ginzler, C.; Rehush, N. Wall-to-wall tree type mapping from countrywide airborne remote sensing surveys. Remote Sens. 2017, 9, 766. [Google Scholar] [CrossRef] [Green Version]
  12. Coleman, T.W.; Graves, A.D.; Heath, Z.; Flowers, R.W.; Hanavan, R.P.; Cluck, D.R.; Ryerson, D. Accuracy of aerial detection surveys for mapping insect and disease disturbances in the United States. For. Ecol. Manag. 2018, 430, 321–336. [Google Scholar] [CrossRef]
  13. Sylvain, J.-D.; Drolet, G.; Brown, N. Mapping dead forest cover using a deep convolutional neural network and digital aerial photography. ISPRS J. Photogramm. Remote Sens. 2019, 156, 14–26. [Google Scholar] [CrossRef]
  14. Hughes, M.A.; Juzwik, J.; Harrington, T.C.; Keith, L.M. Pathogenicity, symptom development, and colonization of metrosideros polymorpha by Ceratocystis Lukuohia. Plant. Dis. 2020, 104, 2233–2241. [Google Scholar] [CrossRef]
  15. Keith, L.M.; Hughes, R.F.; Sugiyama, L.S.; Heller, W.P.; Bushe, B.C.; Friday, J.B. First report of Ceratocystis wilt on Ohia (Metrosideros polymorpha). Plant Disease 2015, 99, 1276. [Google Scholar] [CrossRef] [Green Version]
  16. Friday, J.B.; Herbert, D.A. Metrosideros Polymorpha (‘ōhi‘a), ver 3.2. In Species Profiles for Pacific Island Agroforestry; Elevitch, C.R., Ed.; Permanent Agricultural Resources (PAR): Holualoa, Hawaii, 2006; Available online: http://www.traditionaltree.org (accessed on 2 August 2021).
  17. Akashi, Y.; Mueller-Dombois, D. A landscape perspective of the Hawaiian rain forest Dieback. J. Veg. Sci. 1995, 6, 449–464. [Google Scholar] [CrossRef]
  18. Camp, R.J.; LaPointe, D.A.; Hart, P.J.; Sedgwick, D.E.; Canale, L.K. Large-scale tree mortality from rapid ohia death negatively influences avifauna in Lower Puna, Hawaii Island, USA. Condor 2019, 121, duz007. [Google Scholar] [CrossRef]
  19. Barnes, I.; Fourie, A.; Wingfield, M.J.; Harrington, T.C.; McNew, D.L.; Sugiyama, L.S.; Luiz, B.C.; Heller, W.P.; Keith, L.M. New Ceratocystis species associated with rapid death of Metrosideros Olymorpha in Hawaii. Persoonia Mol. Phylogeny Evol. Fungi 2018, 40, 154–181. [Google Scholar] [CrossRef] [Green Version]
  20. Mortenson, L.A.; Flint Hughes, R.; Friday, J.B.; Keith, L.M.; Barbosa, J.M.; Friday, N.J.; Liu, Z.; Sowards, T.G. Assessing spatial distribution, stand impacts and rate of Ceratocystis fimbriata induced ohia (Metrosideros polymorpha) mortality in a tropical wet forest, Hawaii Island, USA. For. Ecol. Manag. 2016, 377, 83–92. [Google Scholar] [CrossRef] [Green Version]
  21. Perroy, R.L.; Hughes, M.; Keith, L.M.; Collier, E.; Sullivan, T.; Low, G. Examining the utility of visible near-infrared and optical remote sensing for the early detection of Rapid Ohia Death. Remote Sens. 2020, 12, 1846. [Google Scholar] [CrossRef]
  22. Brill, E.; Hughes, M.A.; Heller, W.P.; Keith, L.M. First report of Ceratocystis lukuohia on Metrosideros olymorpha on the Island of Kauai, Hawaii. Plant Dis. 2019, 103, 2961. [Google Scholar] [CrossRef]
  23. Asner, G.P.; Martin, R.E.; Keith, L.M.; Heller, W.P.; Hughes, M.A.; Vaughn, N.R.; Hughes, R.F.; Balzotti, C. A spectral mapping signature for the Rapid Ohia Death (ROD) pathogen in Hawaiian forests. Remote Sens. 2018, 10, 404. [Google Scholar] [CrossRef] [Green Version]
  24. Vaughn, N.R.; Asner, G.P.; Brodrick, P.G.; Martin, R.E.; Heckler, J.W.; Knapp, D.E.; Hughes, R.F. An approach for high-resolution mapping of Hawaiian Metrosideros forest mortality using laser-guided imaging spectroscopy. Remote Sens. 2018, 10, 502. [Google Scholar] [CrossRef] [Green Version]
  25. Potter, K.M.; Conkling, B.L. Large-Scale Patterns of Insect and Disease Activity in the Conterminous United States, Alaska and Hawaii from the National Insect and Disease Survey, 2015; US Department of Agriculture, Forest Service, Research: Asheville, NC, USA, 2017. [Google Scholar]
  26. Weller, S.G.; Sakai, A.K.; Clark, M.; Lorence, D.H.; Flynn, T.; Kishida, W.; Tangalin, N.; Wood, K. The effects of introduced ungulates on native and alien plant species in an island ecosystem: Implications for change in a diverse mesic forest in the Hawaiian Islands. For. Ecol. Manag. 2018, 409, 518–526. [Google Scholar] [CrossRef]
  27. Spear, D.; Chown, S.L. Non-indigenous ungulates as a threat to biodiversity. J. Zool. 2009, 279, 1–17. [Google Scholar] [CrossRef]
  28. Hughes, R.F.; Asner, G.P.; Baldwin, J.A.; Mascaro, J.; Bufil, L.K.K.; Knapp, D.E. Estimating aboveground carbon density across forest landscapes of Hawaii: Combining FIA plot-derived estimates and airborne LiDAR. For. Ecol. Manag. 2018, 424, 323–337. [Google Scholar] [CrossRef]
  29. Inman-Narahari, F.; Ostertag, R.; Cordell, S.; Giardina, C.P.; Nelson-Kaula, K.; Sack, L. Seedling recruitment factors in low-diversity Hawaiian wet forest: Towards global comparisons among tropical forests. Ecosphere 2013, 4, 1–19. [Google Scholar] [CrossRef]
  30. Pratt, L.W.; Abbott, L.L. Rare Plants within Managed Units of ’Ola’a Forest, Hawaii Volcanoes National Park; Cooperative National Park Resources Studies Unit Technical Report 115; Department of Botany, University of Hawaii at Manoa: Honolulu, HI, USA, 1997. [Google Scholar]
  31. Giambelluca, T.W.; Shuai, X.; Barnes, M.L.; Alliss, R.J.; Longman, R.J.; Miura, T.; Chen, Q.; Frazier, A.G.; Mudd, R.G.; Cuo, L. Evapotranspiration of Hawaii. Final Rep. Submitt. US Army Corps Eng. Dist. Comm. Water Resour. Manag. State Hawaii 2014, 13, 766. [Google Scholar]
  32. Giambelluca, T.W.; Chen, Q.; Frazier, A.G.; Price, J.P.; Chen, Y.-L.; Chu, P.-S.; Eischeid, J.K.; Delparte, D.M. Online rainfall atlas of Hawaii. Bull. Am. Meteorol. Soc. 2013, 94, 313–316. [Google Scholar] [CrossRef]
  33. Wolfe, E.W.; Wise, W.S.; Dalrymple, G.B. The Geology and Petrology of Mauna Kea Volcano, Hawaii; A Study of Postshield Volcanism; U.S. Geological Survey Professional Paper; U.S. Government Publishing Office: Washington, DC, USA, 1997; Volume 1557.
  34. Heller, W.P.; Keith, L.M. Real-time PCR assays to detect and distinguish the rapid Ohia death pathogens Ceratocystis Lukuohia and C. huliohia. Phytopathology 2018, 108, 1395–1401. [Google Scholar] [CrossRef] [Green Version]
  35. Davis, C. Notes on Forest Insect Conditions, Hawaii National Park for the Year 1946; Mimeo. Report; US Department of Interior, National Park Service: Washington, DC, USA, 1947; 7p.
  36. Hodges, C.S.; Adee, K.T.; Stein, J.D.; Wood, H.B.; Doty, R.D. Decline of Ohia (Metrosideros polymorpha) in Hawaii: A review. In General Technical Report PSW-86; U.S. Department of Agriculture, Forest Service, Pacific Southwest Forest and Range Experiment Station: Berkeley, CA, USA, 1986; Volume 86, 22p. [Google Scholar] [CrossRef]
  37. Mertelmeyer, L.; Jacobi, J.D.; Mueller-Dombois, D.; Brinck, K.; Boehmer, H.J.; Ward, D. Regeneration of Metrosideros Polymorpha forests in Hawaii after landscape-level canopy dieback. J. Veg. Sci. 2019, 30, 146–155. [Google Scholar] [CrossRef] [Green Version]
  38. Barton, K.E.; Jones, C.; Edwards, K.F.; Shiels, A.B.; Knight, T. Local adaptation constrains drought tolerance in a tropical foundation tree. J. Ecol. 2020, 108, 1540–1552. [Google Scholar] [CrossRef]
  39. Tunison, J.T.; Loh, R.L.; Leialoha, J.A. Fire Effects in the Submontane Seasonal Zone, Hawaii Volcanoes National Park; Cooperative National Park Resources Studies Unit Technical Report 97; Department of Botany, University of Hawaii at Manoa: Honolulu, HI, USA, 1995. [Google Scholar]
  40. Westerband, A.C.; Kagawa-Viviani, A.K.; Bogner, K.K.; Beilman, D.W.; Knight, T.M.; Barton, K.E. Seedling drought tolerance and functional traits vary in response to the timing of water availability in a keystone Hawaiian tree species. Plant. Ecol. 2019, 220, 321–344. [Google Scholar] [CrossRef]
  41. Chan, A.H.Y.; Barnes, C.; Swinfield, T.; Coomes, D.A. Monitoring ash dieback (Hymenoscyphus fraxineus) in British forests using hyperspectral remote sensing. Remote Sens. Ecol. Conserv. 2021, 7, 306–320. [Google Scholar] [CrossRef]
  42. Fallon, B.; Yang, A.; Lapadat, C.; Armour, I.; Juzwik, J.; Montgomery, R.A.; Cavender-Bares, J. Spectral differentiation of oak wilt from foliar fungal disease and drought is correlated with physiological changes. Tree Physiol. 2020, 40, 377–390. [Google Scholar] [CrossRef] [PubMed]
  43. Heim, R.H.J.; Wright, I.J.; Scarth, P.; Carnegie, A.J.; Taylor, D.; Oldeland, J. Multispectral, aerial disease detection for myrtle rust (Austropuccinia psidii) on a lemon myrtle plantation. Drones 2019, 3, 25. [Google Scholar] [CrossRef] [Green Version]
  44. Sandino, J.; Pegg, G.; Gonzalez, F.; Smith, G. Aerial mapping of forests affected by pathogens using UAVs, hyperspectral sensors, and artificial intelligence. Sensors 2018, 18, 944. [Google Scholar] [CrossRef] [Green Version]
  45. Natesan, S.; Armenakis, C.; Vepakomma, U. Resnet-based tree species classification using UAV images. In Proceedings of the ISPRS Geospatial Week 2019, Enschede, The Netherlands, 10–14 June 2019; Volume 7. [Google Scholar]
  46. Schiefer, F.; Kattenborn, T.; Frick, A.; Frey, J.; Schall, P.; Koch, B.; Schmidtlein, S. Mapping forest tree species in high resolution UAV-based RGB-imagery by means of convolutional neural networks. ISPRS J. Photogramm. Remote Sens. 2020, 170, 205–215. [Google Scholar] [CrossRef]
  47. Safonova, A.; Tabik, S.; Alcaraz-Segura, D.; Rubtsov, A.; Maglinets, Y.; Herrera, F. Detection of fir trees (Abies sibirica) damaged by the bark beetle in unmanned aerial vehicle images with deep learning. Remote Sens. 2019, 11, 643. [Google Scholar] [CrossRef] [Green Version]
  48. Komárek, J. The perspective of unmanned aerial systems in forest management: Do we really need such details? Appl. Veg. Sci. 2020, 23, 718–721. [Google Scholar] [CrossRef]
  49. Kattenborn, T.; Leitloff, J.; Schiefer, F.; Hinz, S. Review on Convolutional Neural Networks (CNN) in vegetation remote sensing. ISPRS J. Photogramm. Remote Sens. 2021, 173, 24–49. [Google Scholar] [CrossRef]
  50. Housman, I.W.; Chastain, R.A.; Finco, M.V. An evaluation of forest health insect and disease survey data and satellite-based remote sensing forest change detection methods: Case studies in the United States. Remote Sens. 2018, 10, 1184. [Google Scholar] [CrossRef] [Green Version]
  51. Haghighian, F.; Yousefi, S.; Keesstra, S. Identifying tree health using sentinel-2 images: A case study on Tortrix viridana, L. Infected oak trees in Western Iran. Geocarto Int. 2020, 1, 1–11. [Google Scholar] [CrossRef]
  52. Lastovicka, J.; Svec, P.; Paluba, D.; Kobliuk, N.; Svoboda, J.; Hladky, R.; Stych, P. Sentinel-2 data in an evaluation of the impact of the disturbances on forest vegetation. Remote Sens. 2020, 12, 1914. [Google Scholar] [CrossRef]
  53. Lottering, R.; Mutanga, O. Optimising the spatial resolution of worldview-2 pan-sharpened imagery for predicting levels of Gonipterus Scutellatus defoliation in KwaZulu-Natal, South Africa. ISPRS J. Photogramm. Remote Sens. 2016, 112, 13–22. [Google Scholar] [CrossRef]
  54. Wagner, F.H.; Sanchez, A.; Tarabalka, Y.; Lotte, R.G.; Ferreira, M.P.; Aidar, M.P.M.; Gloor, E.; Phillips, O.L.; Aragão, L.E.O.C. Using the U-net convolutional network to map forest types and disturbance in the Atlantic rainforest with very high resolution images. Remote Sens. Ecol. Conserv. 2019, 5, 360–375. [Google Scholar] [CrossRef] [Green Version]
  55. Dixon, D.J.; Callow, J.N.; Duncan, J.M.A.; Setterfield, S.A.; Pauli, N. Satellite prediction of forest flowering phenology. Remote Sens. Environ. 2021, 255, 112197. [Google Scholar] [CrossRef]
  56. Michael, Y.; Lensky, I.M.; Brenner, S.; Tchetchik, A.; Tessler, N.; Helman, D. Economic assessment of fire damage to urban forest in the wildland–urban interface using planet satellites constellation images. Remote Sens. 2018, 10, 1479. [Google Scholar] [CrossRef] [Green Version]
  57. Wegmueller, S.A.; Townsend, P.A. Astrape: A system for mapping severe abiotic forest disturbances using high spatial resolution satellite imagery and unsupervised classification. Remote Sens. 2021, 13, 1634. [Google Scholar] [CrossRef]
  58. Duffy, J.P.; Cunliffe, A.M.; DeBell, L.; Sandbrook, C.; Wich, S.A.; Shutler, J.D.; Myers-Smith, I.H.; Varela, M.R.; Anderson, K. Location, location, location: Considerations when using lightweight drones in challenging environments. Remote Sens. Ecol. Conserv. 2018, 4, 7–19. [Google Scholar] [CrossRef]
  59. Güldenring, J.; Gorczak, P.; Eckermann, F.; Patchou, M.; Tiemann, J.; Kurtz, F.; Wietfeld, C. Reliable long-range multi-link communication for unmanned search and rescue aircraft systems in beyond visual line of sight operation. Drones 2020, 4, 16. [Google Scholar] [CrossRef]
  60. McCrink, M.H.; Gregory, J.W. Design and development of a high-speed UAS for beyond visual line-of-sight operations. J. Intell. Robot. Syst. 2021, 101, 31. [Google Scholar] [CrossRef]
  61. Baker, S.C.; Chuter, A.; Munks, S.A.; Koch, A.J. Retention of large, old trees in alternatives to clearcutting with a comparison of ground- and helicopter-based assessments. For. Ecol. Manag. 2020, 475, 118390. [Google Scholar] [CrossRef]
  62. Gentle, M.; Finch, N.; Speed, J.; Pople, A.; Gentle, M.; Finch, N.; Speed, J.; Pople, A. A comparison of unmanned aerial vehicles (drones) and manned helicopters for monitoring macropod populations. Wildl. Res. 2018, 45, 586–594. [Google Scholar] [CrossRef]
  63. Kelaher, B.P.; Peddemors, V.M.; Hoade, B.; Colefax, A.P.; Butcher, P.A. Comparison of sampling precision for nearshore marine wildlife using unmanned and manned aerial surveys. J. Unmanned Veh. Syst. 2019, 8, 30–43. [Google Scholar] [CrossRef]
  64. Campbell, T.A.; Long, D.B. Feral swine damage and damage management in forested ecosystems. For. Ecol. Manag. 2009, 257, 2319–2326. [Google Scholar] [CrossRef] [Green Version]
  65. Murphy, M.J.; Inman-Narahari, F.; Ostertag, R.; Litton, C.M. Invasive feral pigs impact native tree ferns and woody seedlings in Hawaiian Forest. Biol. Invasions 2014, 16, 63–71. [Google Scholar] [CrossRef]
  66. Fortini, L.B.; Kaiser, L.R.; Keith, L.M.; Price, J.; Hughes, R.F.; Jacobi, J.D.; Friday, J.B. The evolving threat of Rapid Ohia Death (ROD) to Hawaii’s native ecosystems and rare plant species. For. Ecol. Manag. 2019, 448, 376–385. [Google Scholar] [CrossRef]
  67. Roy, K.; Jaenecke, K.A.; Peck, R.W. Ambrosia Beetle (Coleoptera: Curculionidae) communities and frass production in Ohia (Myrtales: Myrtaceae) infected with ceratocystis (Microascales: Ceratocystidaceae) fungi responsible for Rapid Ohia Death. Environ. Entomol. 2020, 49, 1345–1354. [Google Scholar] [CrossRef]
  68. Roy, K.; Granthon, C.; Peck, R.W.; Atkinson, C.T. Effectiveness of Rapid Ohia Death Management Strategies at a Focal Disease Outbreak on Hawaii Island; HCSU Technical Report Series 99; University of Hawai‘i at Manoa: Honolulu, HI, USA, 2021. [Google Scholar]
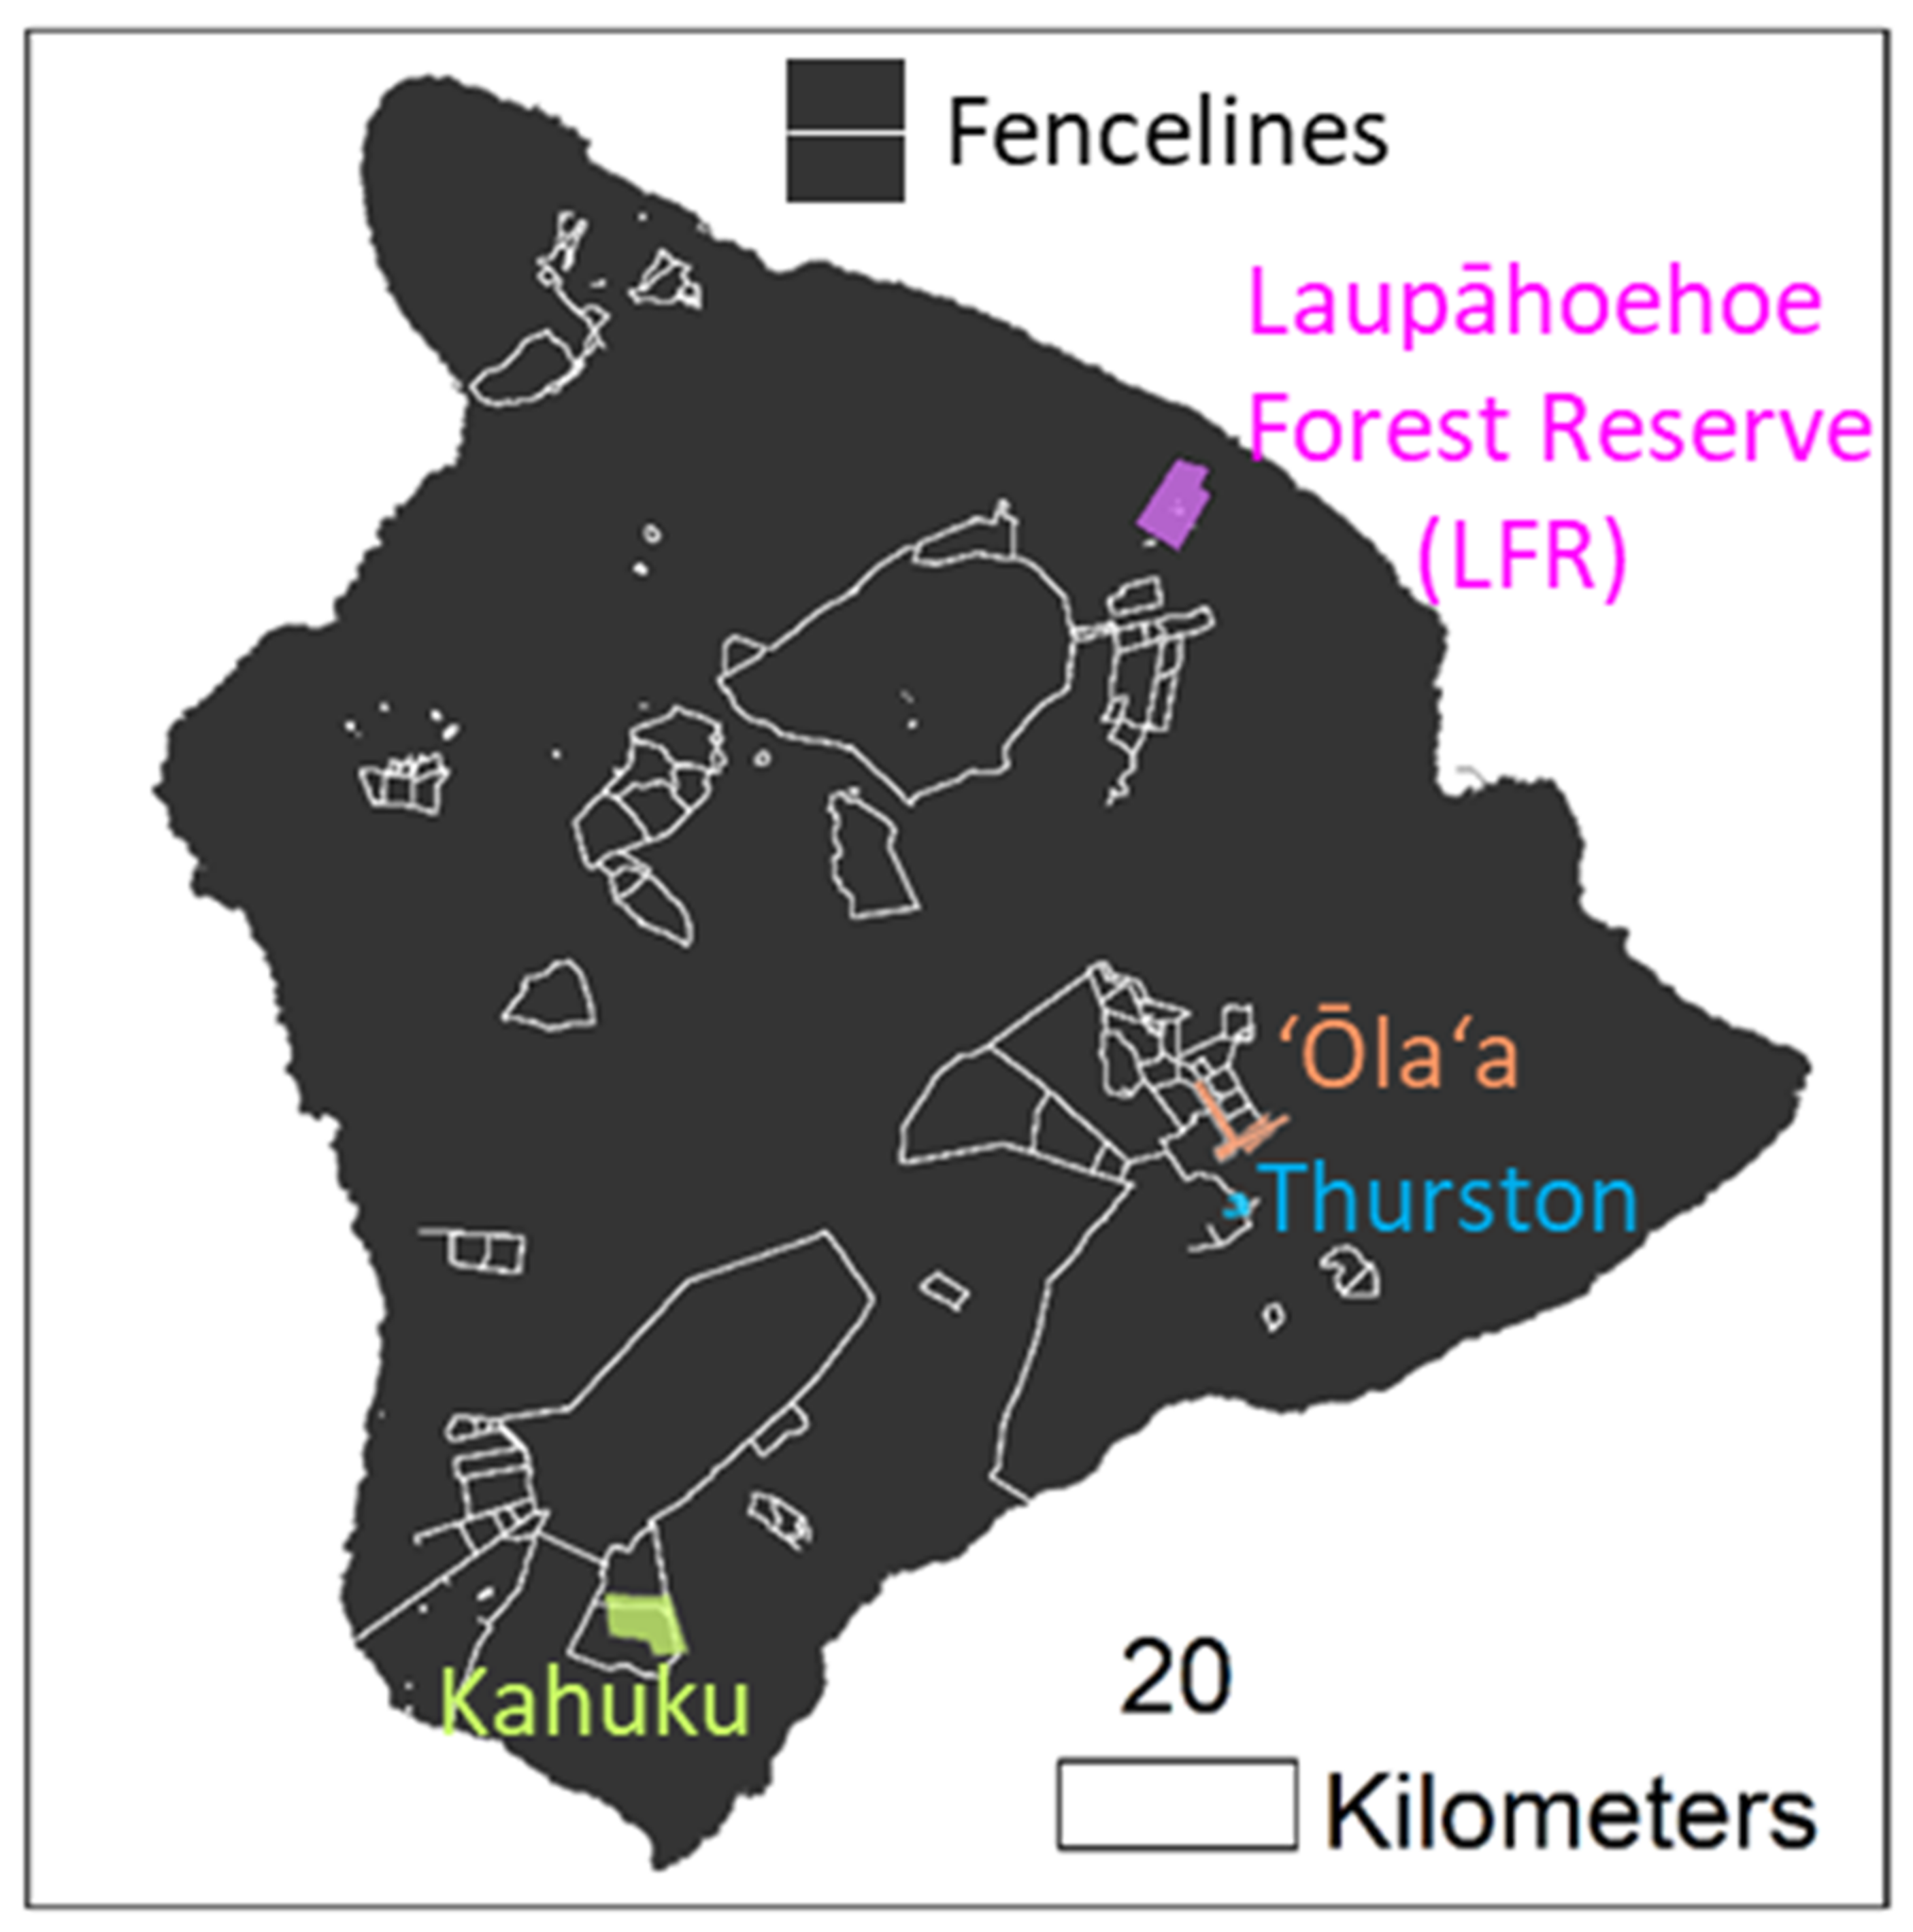
Figure 1. Study site locations on Hawai‘i island and fence lines.
Forests 12 01035 g001
Figure 2. Timeline of sUAS and helicopter imagery included in this study for the four sites.
Forests 12 01035 g002
Figure 3. (Top left and right panel) Custom imaging payload developed for Hughes 500 helicopter mapping operations in Hawai‘i. (Bottom left) sUAS platform used for mapping operations.
Forests 12 01035 g003
Figure 4. (Top) Examples of late-stage ROD canopy conditions as observed from aerial imagery, (Middle) Factors used to determine ROD confidence rating scores (Bottom).
Forests 12 01035 g004
Figure 5. (Left) Time-series sequence of suspect trees for the LFR. (Right) Sampled trees and corresponding laboratory results; non-sampled suspect trees appear as semi-transparent background points.
Forests 12 01035 g005
Figure 6. (Left) Time-series sequence of suspect trees for the ‘Ōla‘a tract of Hawai‘i Volcanoes National Park. (Right) Sampled trees and corresponding laboratory results; non-sampled suspect trees appear as semi-transparent background points.
Forests 12 01035 g006
Figure 7. (Left) Time-series sequence of suspect trees for a portion of the Kahuku Unit of Hawai‘i Volcanoes National Park. (Right) Sampled trees and corresponding laboratory results; non-sampled suspect trees appear as semi-transparent background points.
Forests 12 01035 g007
Figure 8. (Left) Suspect trees for the Thurston tract of Hawai‘i Volcanoes National Park. (Right) Sampled trees and corresponding laboratory results; non-sampled suspect trees appear as semi-transparent background points.
Forests 12 01035 g008
Figure 9. Observed ‘ōhi‘a mortality densities for fenced and unfenced areas for the four study sites.
Forests 12 01035 g009
Table 1. Environmental parameters of the four study sites [31,32,33].
LFR‘Ōla‘aThurstonKahuku
Elevation (m)730–13501150–13501100–1150700–1250
Mean Annual Rainfall (mm)2800–47002800–43002400–29001100–1650
Substrate Age (years)5000–64,0005000–11,000500–30001500–5000
VegetationHawai‘i Montane RainforestHawai‘i Lowland/
Hawai‘i Montane Rainforest
Hawai‘i Montane-Subalpine Mesic ForestHawai‘i Lowland Mesic Forest
Mean Annual Air Temperature13 °C15 °C15.5 °C18 °C
Mean Annual Relative Humidity0.800.850.850.86
Average Windspeed (m/s)2.82.53.03.8
Table 2. Laboratory results for suspect trees sampled across the four study sites grouped by confidence ratings.
LFR (n = 99)Ola’a (n = 56)Thurston (n = 36)Kahuku (n = 55)
ResultsLowMediumHighMediumHighMediumHighLowMediumHigh
C. lukuohia1643152428014315
C. huliohia0000000161
ND1960402015331
% Positive46%88%100%86%100%0%6%63%93%83%
Publisher’s Note: MDPI stays neutral with regard to jurisdictional claims in published maps and institutional affiliations.