Article

Changes in Soil Microbial Community Structure Following Different Tree Species Functional Traits Afforestation

1
College of Chemistry, Chemical Engineering and Resource Utilization, Northeast Forestry University, Harbin 150040, China
2
Key Laboratory of Sustainable Forest Ecosystem Management-Ministry of Education, Forest School, Northeast Forestry University, Harbin 150040, China
3
Savannah River Ecology Laboratory, University of Georgia, PO Drawer E, Aiken, SC 29802, USA
4
Warnell School of Forestry and Natural Resources, University of Georgia, 180 E. Green St., Athens, GA 30602-2152, USA
*
Author to whom correspondence should be addressed.
Forests 2021, 12(8), 1018; https://doi.org/10.3390/f12081018
Submission received: 19 June 2021 / Revised: 19 July 2021 / Accepted: 27 July 2021 / Published: 30 July 2021
(This article belongs to the Section Forest Soil)

Abstract

:
The soil microbial community structure is critical to the cycling of carbon and nitrogen in forest soils. As afforestation practices increasingly promote different functional traits of tree species, it has become critical to understand how they influence soil microbial community structures, which directly influence soil biogeochemical processes. We used fungi ITS and bacteria 16S rDNA to investigate soil microbial community structures in three monoculture plantations consisting of a non-native evergreen conifer (Pinus sibirica), a native deciduous conifer (Larix gmelinii), and a native deciduous angiosperm (Betula platyphylla) and compared them with two 1:1 mixed-species plantations (P. sibirica and L. gmelinii, P. sibirica and B. platyphylla). The fungal community structure of the conifer–angiosperm mixed plantation was similar to that of the non-native evergreen conifer, and the bacterial community structure was similar to that of the angiosperm monoculture plantation. Fungal communities were strongly related to tree species, but bacterial communities were strongly related to soil nitrogen. The co-occurrence networks were more robust in the mixed plantations, and the microbial structures associated with soil carbon and nitrogen were significantly increased. Our results provide a comparative study of the soil microbial ecology in response to afforestation of species with different functional traits and enhance the understanding of factors controlling the soil microbial community structure.

1. Introduction

Soil microorganisms play important roles in global biogeochemical cycles, but their communities can be negatively influenced by environmental changes such as climate warming, nitrogen deposition, and the loss of biodiversity [1,2]. Understanding the factors controlling the microbial community structure can potentially mitigate the consequences of ecological disturbances [3] or inform strategies for forest management to influence ecosystem processes [4]. This will also contribute information to soil science and provide recommendations for achieving the United Nations’ goal of moving from exploitation to the sustainable use of the earth’s resources [5]. Recent methodological developments have facilitated the determination of soil microbial diversity, which has provided a more comprehensive understanding of factors controlling the microbial community structure [6]. While it is clear that tree species and a variety of abiotic factors can have a large influence on soil microbial community structure [7], general patterns of how tree functional characteristics (e.g., phyla, leaf habit) influence the forest soil microbial community structure, as well as soil carbon and nitrogen cycling, remain relatively unexplored [8]. Indeed, general principles of microbial community assembly may be more difficult to establish than previously realized because fungal and bacterial components may respond differently to biotic and abiotic factors, including critical interactions between the components themselves.
Fungal community structure appears to be largely determined by the dominant tree species. Some ectomycorrhizal fungal communities may form symbiotic relationships with hundreds of hosts, while others are restricted to an individual tree genus [9,10]. Consequently, the abundance of fungal species in conifer and broad-leaved forests in Estonia increased with tree species abundance [11]. However, the primary control on fungal community structure is not always clear and can be confounded by other factors. For example, both tree and fungal diversities were low in sandy soil and relatively high in rich clay soil in the western Amazon [12]. Overall, our understanding of factors influencing soil fungal community structure remains insufficient [13], especially compared to our understanding of factors influencing the bacterial community structure.
Bacterial community structure appears to be largely determined by abiotic factors. Recent studies have documented soil pH [14], aridity [15], and geographical factors controlling the bacterial community structure [16,17,18,19]. Across large spatial scales, bacterial communities are strongly influenced by soil pH [20], soil nitrogen, and carbon [21]; however, they do not appear to be strongly influenced by plant species [22]. The bacterial community structures influenced by the environment may be determined by the preference of the bacterial community for niches with higher nutrient contents and organic matter quality [23]. Acidobacteria represented 20% of all bacteria, and their relative abundance in acidic forest soil rich in organic matter exceeded 60% [14]. An increase in studies examining spatial processes in microbial ecology indicates that ecological processes affecting bacterial communities are largely controlled by abiotic factors [24]. For example, pH was the most important driver of bacterial community composition in several studies on forest soils. Since bacteria inhabit small environments, transient changes in some physicochemical factors (e.g., soil moisture, temperature) affect their dispersal and community structure [25,26].
Despite substantial evidence that fungal community structure is largely influenced by biotic factors and that bacterial community structure is largely influenced by abiotic factors, the interaction between fungi and bacteria can also influence the overall microbial community structure [27]. For example, fungi release acidic substances in the process of decomposition, and only bacteria that can grow and utilize C in fungal filaments persist in the microbial community [28,29,30]. Changes in the functional traits of vegetation accompanied by changes in the microclimate (shading, protection and transpiration of soil water), litter (both aboveground and roots), and the production of root exudate [31] may also influence interactions between fungi and bacteria and result in different community structures [7].
Network analysis can be a powerful tool for understanding interactions among the components of microbial communities [32]. Briefly, network analysis provides insight into positive or negative correlations among community components [33] such as network connectedness (degree) and complexity (clustering coefficient). Network analysis may also reveal the potential implications of the microbial community on ecosystem processes. For example, changes in network structure could lead to an alteration in soil nutrient cycling [34]. The microbial network structure can indicate decomposition [35], denitrification Therefore, microbial community structure in a co-occurrence network can be used as an indicator of ecosystem functional response [32]. Afforestation is increasing, but the impact of different tree species traits on the microbial community structure has rarely been reported.
In this study, we used a combination of monoculture and mixed-species stands, which represent a range of functional types (i.e., evergreen conifer, deciduous conifer, and deciduous angiosperm), to explore how tree species, soil characteristics, and the interaction of microbial community components influence the microbiome. This approach allows us to separate the influence of different tree species and soil characteristics in order to explore the potential assembly mechanisms that determine soil fungal and bacterial community structures. We hypothesized that (i) tree species (i.e., a biotic factor) exert the strongest control on fungal community assemblage, whereas soil characteristics (i.e., an abiotic factor) exert the strongest controls on bacterial community assemblage; (ii) the microbial community in mixed-species plantations would form novel networks compared to that in monocultures; and (iii) microbial community structures associated with soil carbon and nitrogen would change with functional traits of tree species.

2. Materials and Methods

2.1. Study Sites and Experimental Design

The study site is located in northern Greater Khingan Range, Inner Mongolia, China (51°44′46″ N, 51°44′46″ E), a region in the cold temperate zone, with the mean annual air temperature and precipitation at −5.31 °C and 437.4 mm, respectively. Due to the cold climate, the ecosystem exhibits low tree diversity, with only a few tree species (e.g., Larix gmelinii, Pinus sylvestris, Picea koraiensis Nakai, Betula platyphylla). Pinus sibirica has been used for afforestation in the area since 2000 for its high economic value.
Our study site contains several 20-year-old monoculture and mixed-species plantations, with no anthropogenic disturbance (i.e., harvesting, fire, etc.) in the last 5 years. Monoculture plantations were comprised of an evergreen conifer (Pinus sibirica, P), a deciduous conifer (Larix gmelinii, L.), or a deciduous angiosperm (Betula platyphylla, B). The mixed-species plantations included P. sibirica mixed with L. gemelnii (PL), and P. sibirica mixed with B. platyphylla (PB). Within each of the five plantation types described above, we established three 120 m2 (30 m × 40 m) plots and a 200 m buffer zone between them, for a total of 15 plots. Although the plantations were established on similar soil in 2000, we expected that two decades of forest growth and different above and belowground inputs from different species and their mixtures would have changed soil characteristics [36], which may influence the soil microbial community.

2.2. Determining Soil Physicochemical Parameters

In each plot, soil was sampled from the top 0–10 cm soil layers in 30 randomly selected locations in June 2018; oversampling a particular location (e.g., tree roots) was avoided. After visible root and plant residues were removed, the 30 samples were combined to form a single composite sample from each plot, and then divided into two sub-samples. One sub-sample was air-dried and sieved through a 2 mm mesh for chemical analysis, and the other sub-sample was stored in an ice box, transferred to the laboratory, and stored at −80 °C for DNA extraction. Soil pH was measured using a pH meter (1:2.5 w/v). Soil organic carbon (SOC) and total nitrogen (TN) were determined using an Elemental Analyzer (Multi N/C 2100 s, Analytik Jena, Germany). Total phosphorus was determined by colorimetry using the ammonium molybdate method after treatment with H2SO4-H2O2 [37].

2.3. DNA Extraction and Sequencing

DNA was extracted from 5 g freeze-dried soil using the MoBIO PowerSoil DNA Isolation Kit (Carlsbad, CA, USA). The V3V4 region of the bacterial 16S rRNA was amplified using primers 515F and 806R [38]; for fungi, the fungal internal transcribed spacer (ITS) region was amplified using primers ITS3-F GCATCGATGAAGAACGCAGC and ITS4-R TCCTCCGCTTATTGATATGC [39,40]. PCR was conducted on 20 ng/uL of template DNA, employing an initial denaturation of 5 min at 94 °C; followed by (30 cycles for 16S and 30 cycles for ITS) 30 s at 94 °C, 30 s at 52 °C, and 30 s at 72 °C; followed by 10 min final elongations at 72 °C. Amplicon sizes were determined using an Agilent Bioanalyzer 2100 system (~550 bp: 16S and ~325–425 bp: ITS), and libraries were sequenced on an IlluminaHiseq2500 platform and 250 bp paired-end reads were generated.

2.4. Bioinformatic and Statistical Analyses of Sequencing Data

Quality control was performed on paired-end raw reads using Trimmomatic (V 0.33, USADELL lab, USA). Clean reads were joined using FLASH (V 1.2.11, Johns Hopkins University, USA) and quality control was performed using Mothur (V 1.35.1, University of Michigan, USA). Chimeras were removed with Usearch (V10). Resulting sequences were clustered into Operational Taxonomic Units (OTU) at 97% identity. Species annotation information was obtained by comparing representative sequences of each OTU with the Silva and UNITE databases. Fungi functional traits were identified based on FunGuild.

2.5. Data Analysis and Statistics

We performed an analysis of similarities (ANOSIM) to test the effect of plantation type on fungal and bacterial communities. The structure of the microbial community was analyzed by non-metric multidimensional scaling (NMDS) based on Bray, with the relative abundance of the dominant species at genes level. We analyzed relative abundance >1% phylum in fungal and bacterial communities, and the variation in species abundance using one-way ANOVA with α = 0.05 and Fisher’s LSD to perform mean comparisons. Redundancy analysis (RDA) identified relationships between environmental variables and taxon. All statistical analyses were conducted in the “vegan” [41] and “ggplot2” [42] packages of the R software (Core Team, Auckland, NZL) [43].
The microbial co-occurrence networks of microbial communities in mixed-species plantations were analyzed following the method of Wu et al. [44]. Briefly, we combined P, L, and B to represent the monoculture plantation (P-L-B); P, L, and PL to represent the coniferous mixed forest plantation (P-L-PL); and P, B, and PB to represent the mixed coniferous and broad-leaved forest plantation (P-B-PB) (Table S1). To reduce the complexity of the network and facilitate the identification of core taxon, we selected OTU relative abundance for analysis [32]. All possible OTU pairs used to calculate Spearman’s rank correlations and the p-values were based on the false discovery rate (FDR). Only Spearman’s rank with a strong positive correlation (ρ > 0.8), a strong negative (ρ < −0.8), and an FDR q-value < 0.001 [32,45] were identified as having significant co-occurrence relationships. The soil carbon and nitrogen co-occurrence relationship was identified to be positive at p > 0.6, negative at p < −0.6, and with an FDR q-value < 0.05. Networks were visualized using Cytoscape (V 3.7.2, NIGMS, USA), and network topology parameters were obtained by Network Analyzer.

3. Results

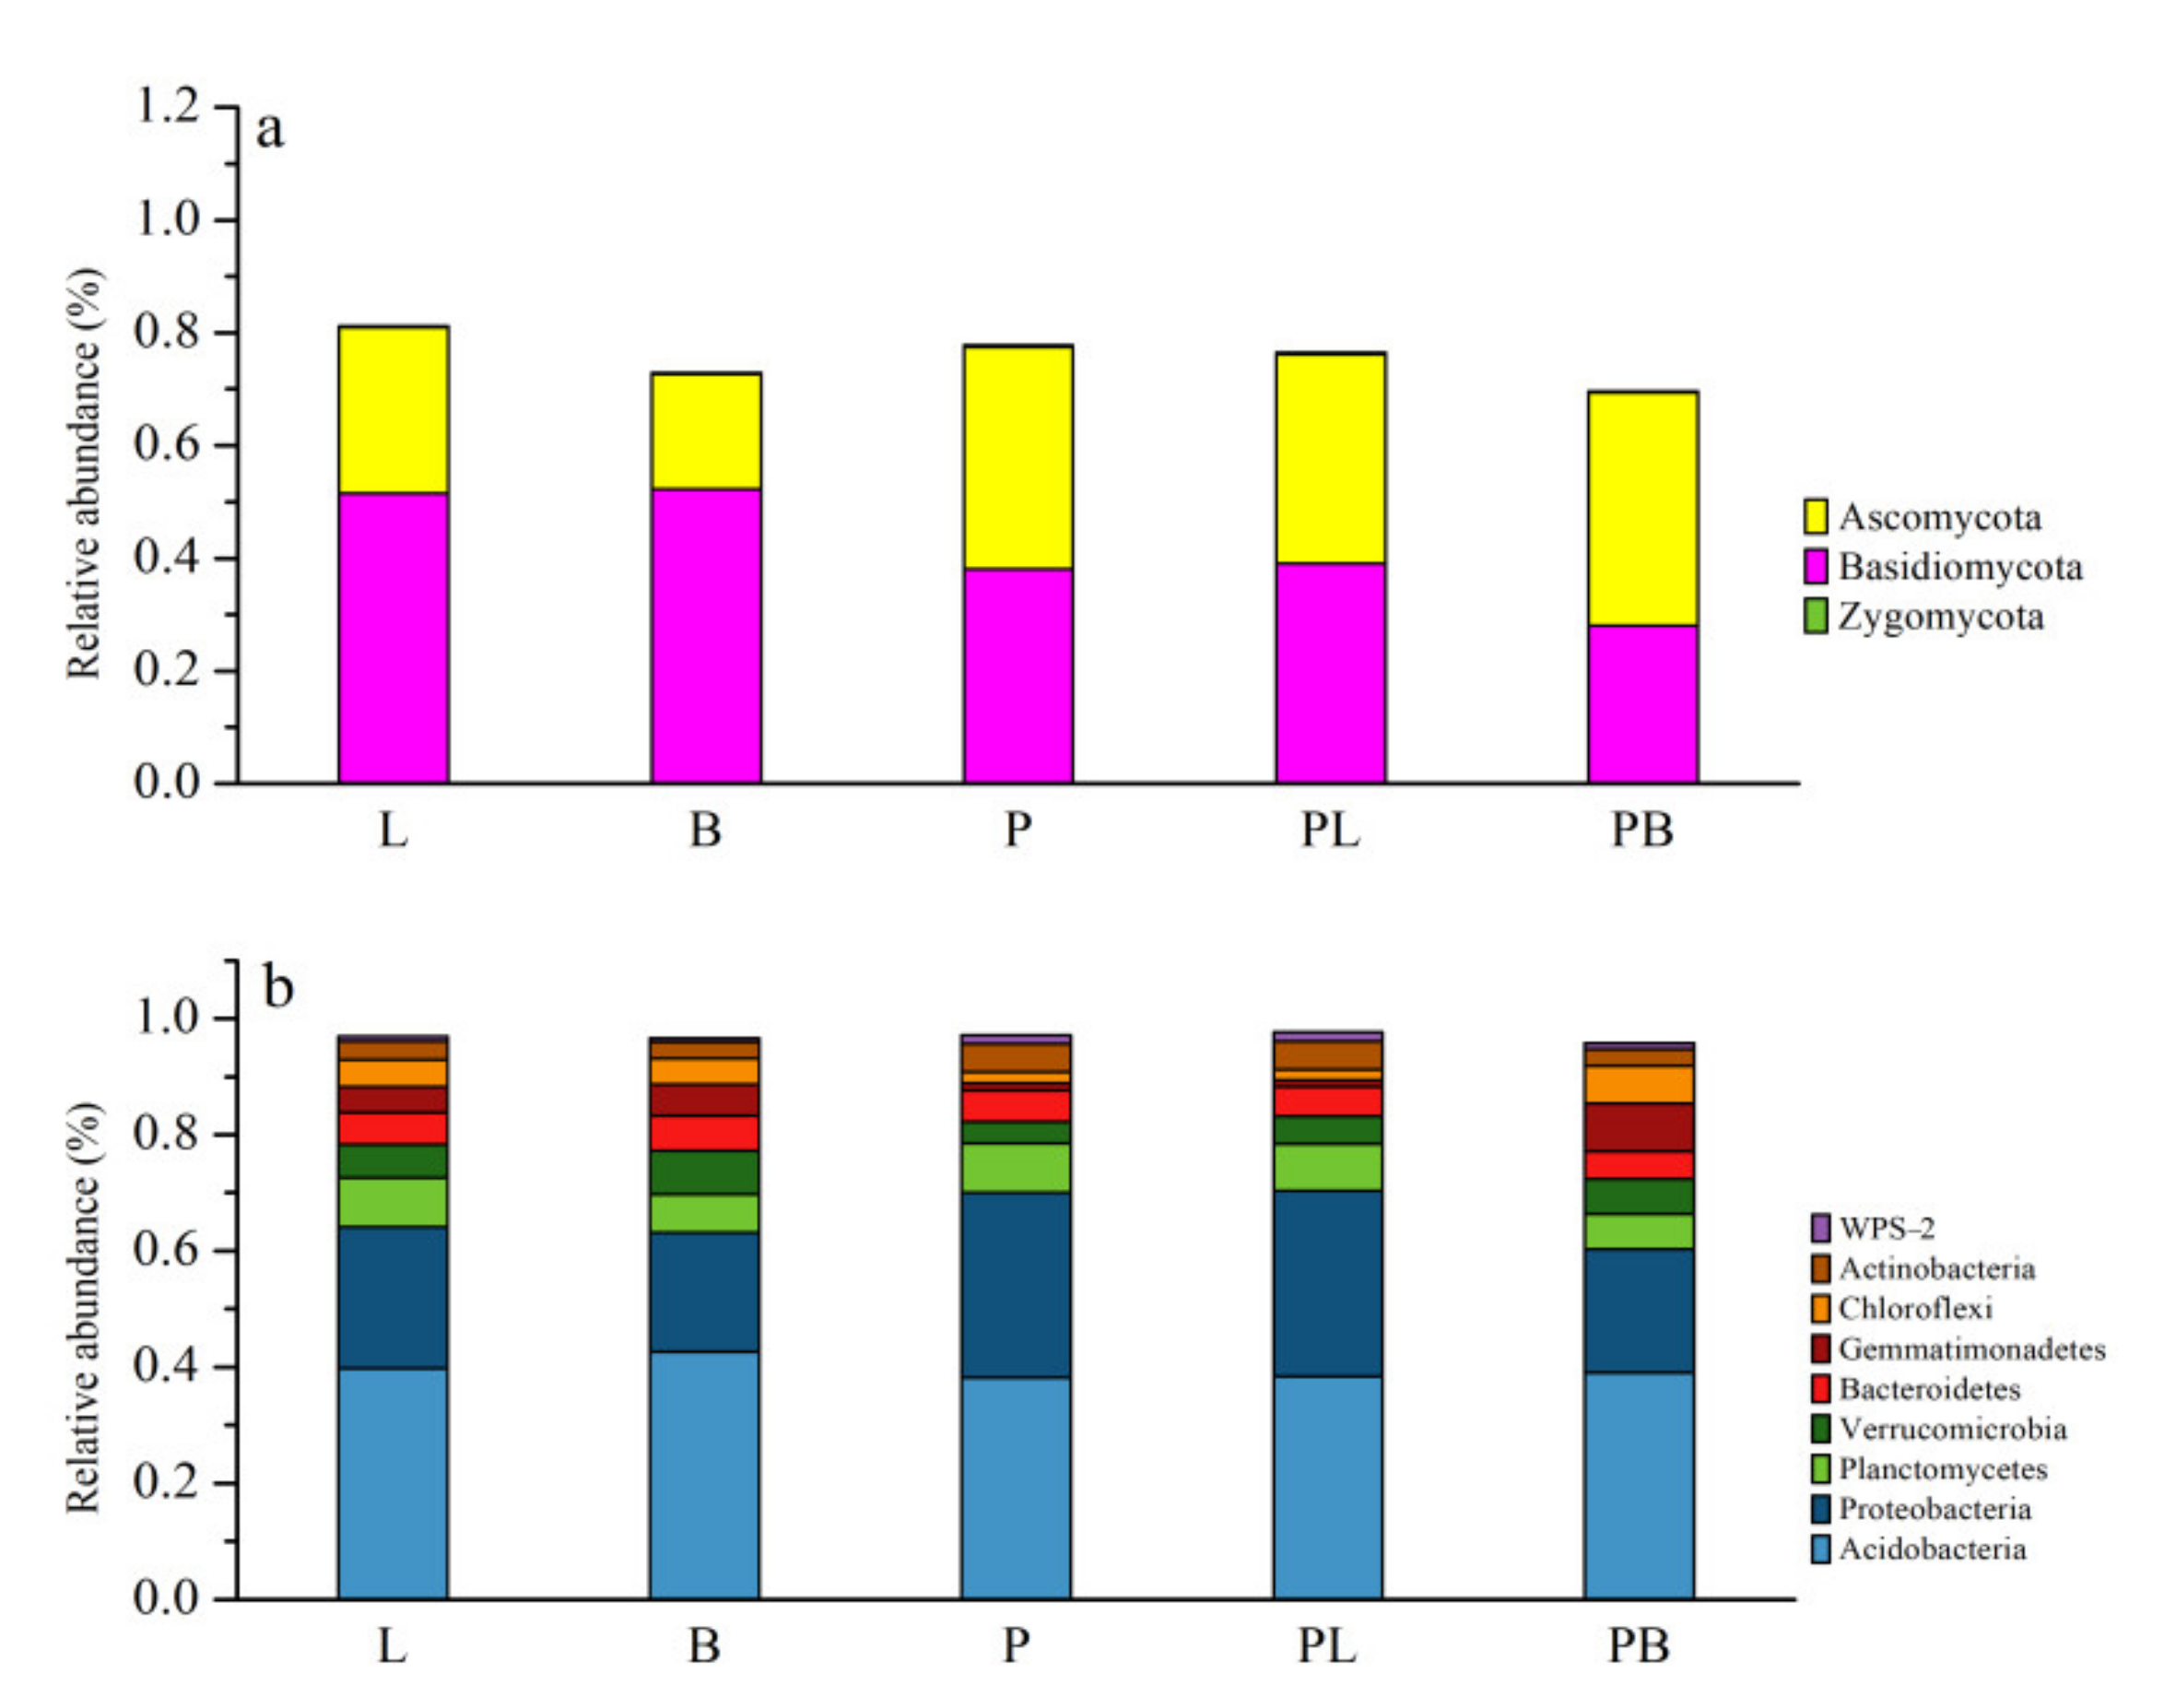
3.1. Change in Soil Microbial Community Structure

We observed a significant difference in the soil fungal community among monoculture plantations (ANOSIM R = 0.613, p = 0.024), and between monoculture and mixed-species plantations (ANOSIM R = 0.508, p = 0.002) (Table S2). The fungal community structure in mixed-species plantations resembled a mixture of fungal communities from monoculture plantations, but this depended on the plantation mixture. For example, the P and L monoculture plantations exhibited some overlap in fungal communities, and the PL mixed-species plantation exhibited a fungal community that clustered between that of P and L. Although the P and B monoculture plantations did not exhibit any overlap in fungal communities, and the PB mixed-species plantation did not overlap with either monoculture, it was much more closely clustered toward the P as compared to the B monoculture plantation (Figure 1a).
We observed a significant difference in the bacterial community structure among monoculture plantations (ANOSIM R = 0.473, p = 0.003), and between monoculture and mixed-species plantations (ANOSIM R = 0.508, p = 0.002). Bacterial communities were unique among monoculture plantations and did not exhibit overlap. For instance, the bacterial community of the PL mixed-species plantation overlapped with that of P, but not with that of L. The PB bacterial communities were unique, and the bacterial community of the PB mixed-species plantation did not overlap with the bacterial community of either monoculture plantation; however, it was more closely clustered toward that of B (Figure 1b).

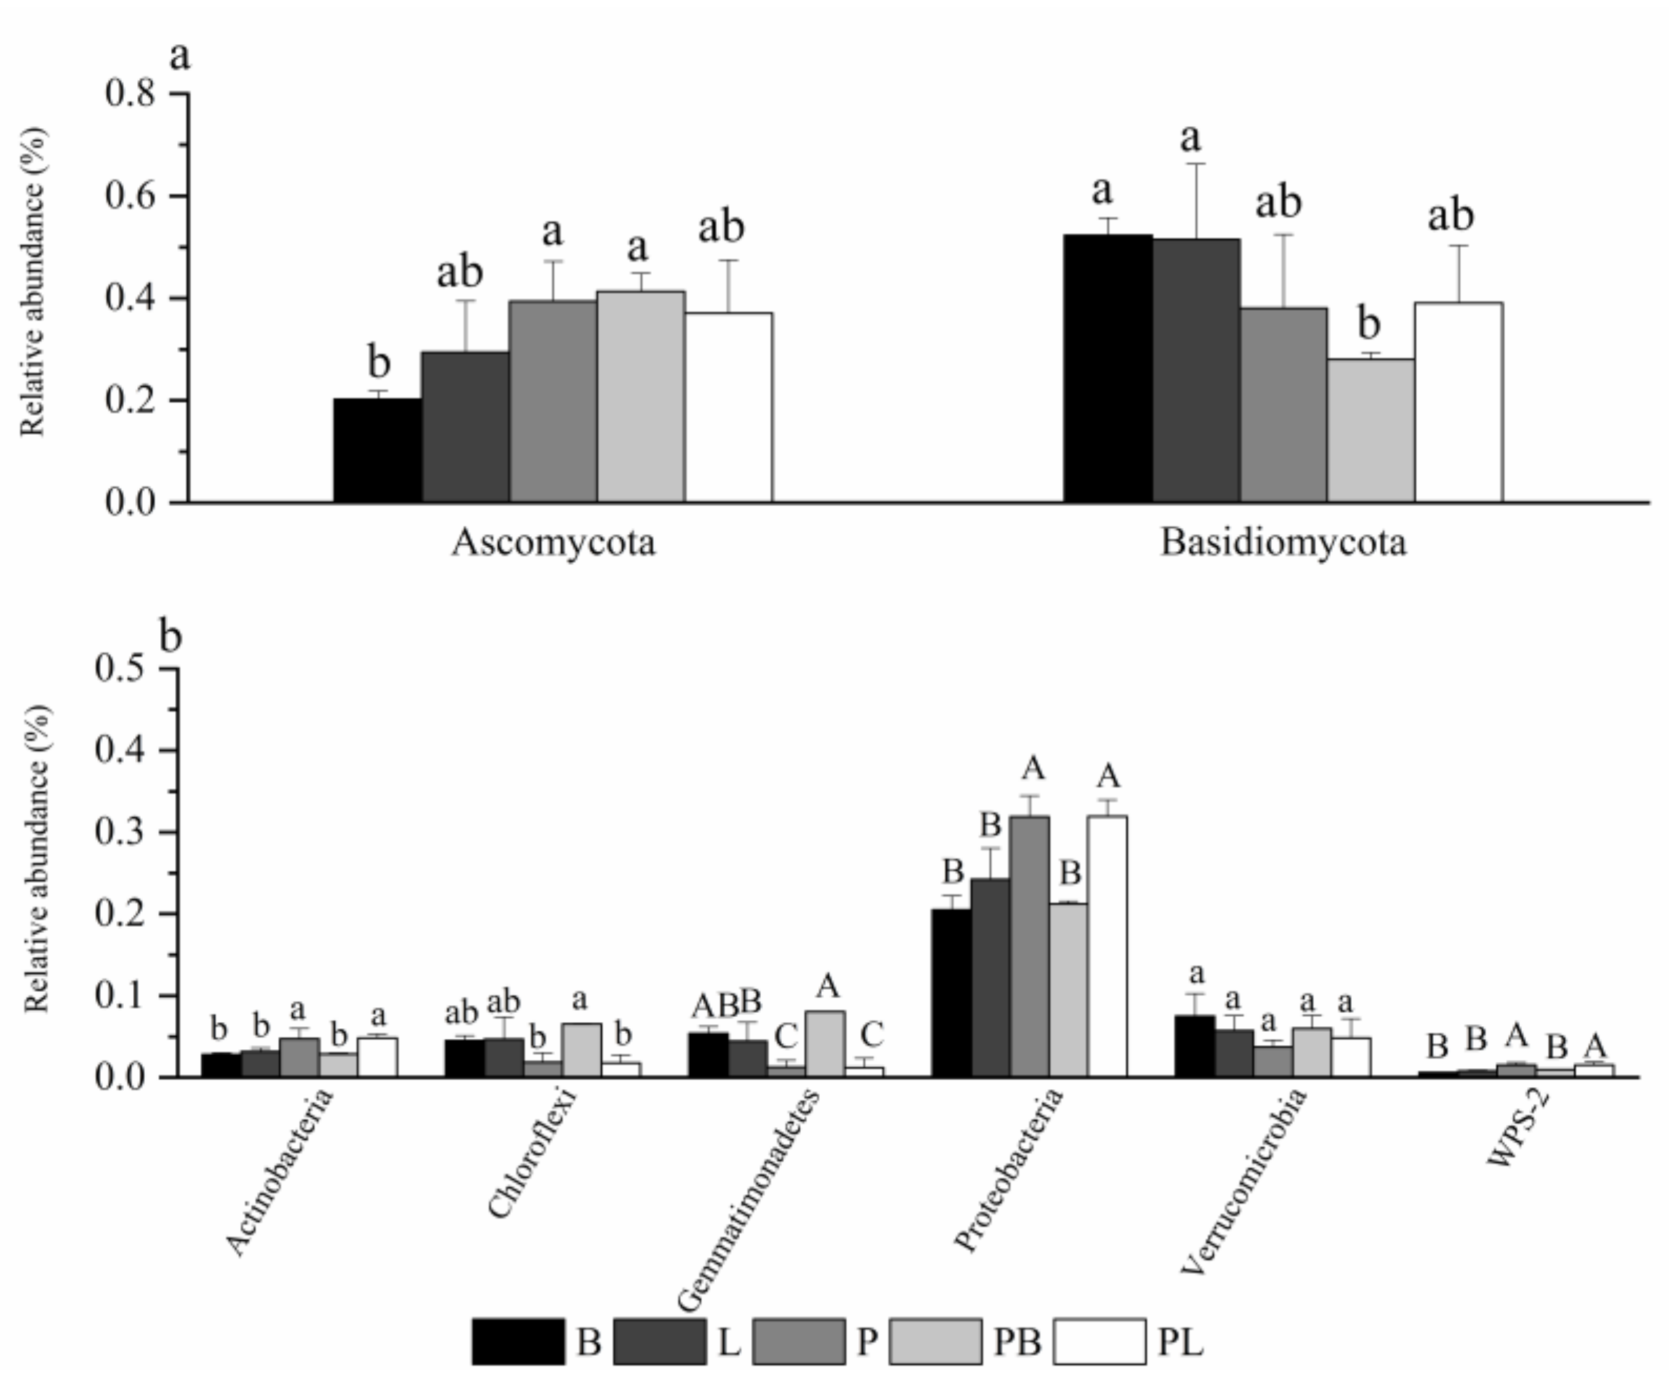
3.2. Change in Soil Microbial Community Species

The primary difference in soil microbial community structure was not from the change of dominant species, but the change of the relative abundance of species (Figure 2). In fungal communities, the relative abundance of Basidiomycota decreased from monoculture B to PB mixed-species plantations, whereas Ascomycota abundance increased (Figure 3a). In bacterial communities, the relative abundance of several key taxa such as actinobacteria, proteobacteria, and WPS-2 increased from monoculture L to mixed-species plantation PL, and decreased from monoculture P to mixed-species plantation PB. Chloroflexi and Gemmatimonadetes relative abundance increased from monoculture P to mixed-species plantation PB, and decreased from monoculture L to mixed-species plantation PL. Verrucomicrobia abundance did not significantly change from monoculture to mixed-species plantations (Figure 3b).

3.3. The Relationship between Physicochemical Parameters and the Soil Microbial Community

Edaphic variables accounted for 41.28% of the total variation in the fungal community, with axis 1 of the redundancy analysis (RDA) accounting for 24.23% and axis 2 accounting for 22.12% (Figure 4a). The most important factor regulating soil fungal community composition was the tree species (R2 = 0.36, p = 0.001). Ascomycota was positively correlated with P; however, Basidiomycota was not. Edaphic variables in bacterial communities accounted for 33.17% of variance, with axis 1 accounting for 59.76% and axis 2 accounting for 4.83% (Figure 4b). The most important factors were TN (R2 = 0.71, p = 0.004). Proteobacteria, Actinobacteria, and WPS-2 were positively correlated with TN, while Chloroflexi and Gemmatimonadetes were negatively correlated with TN.

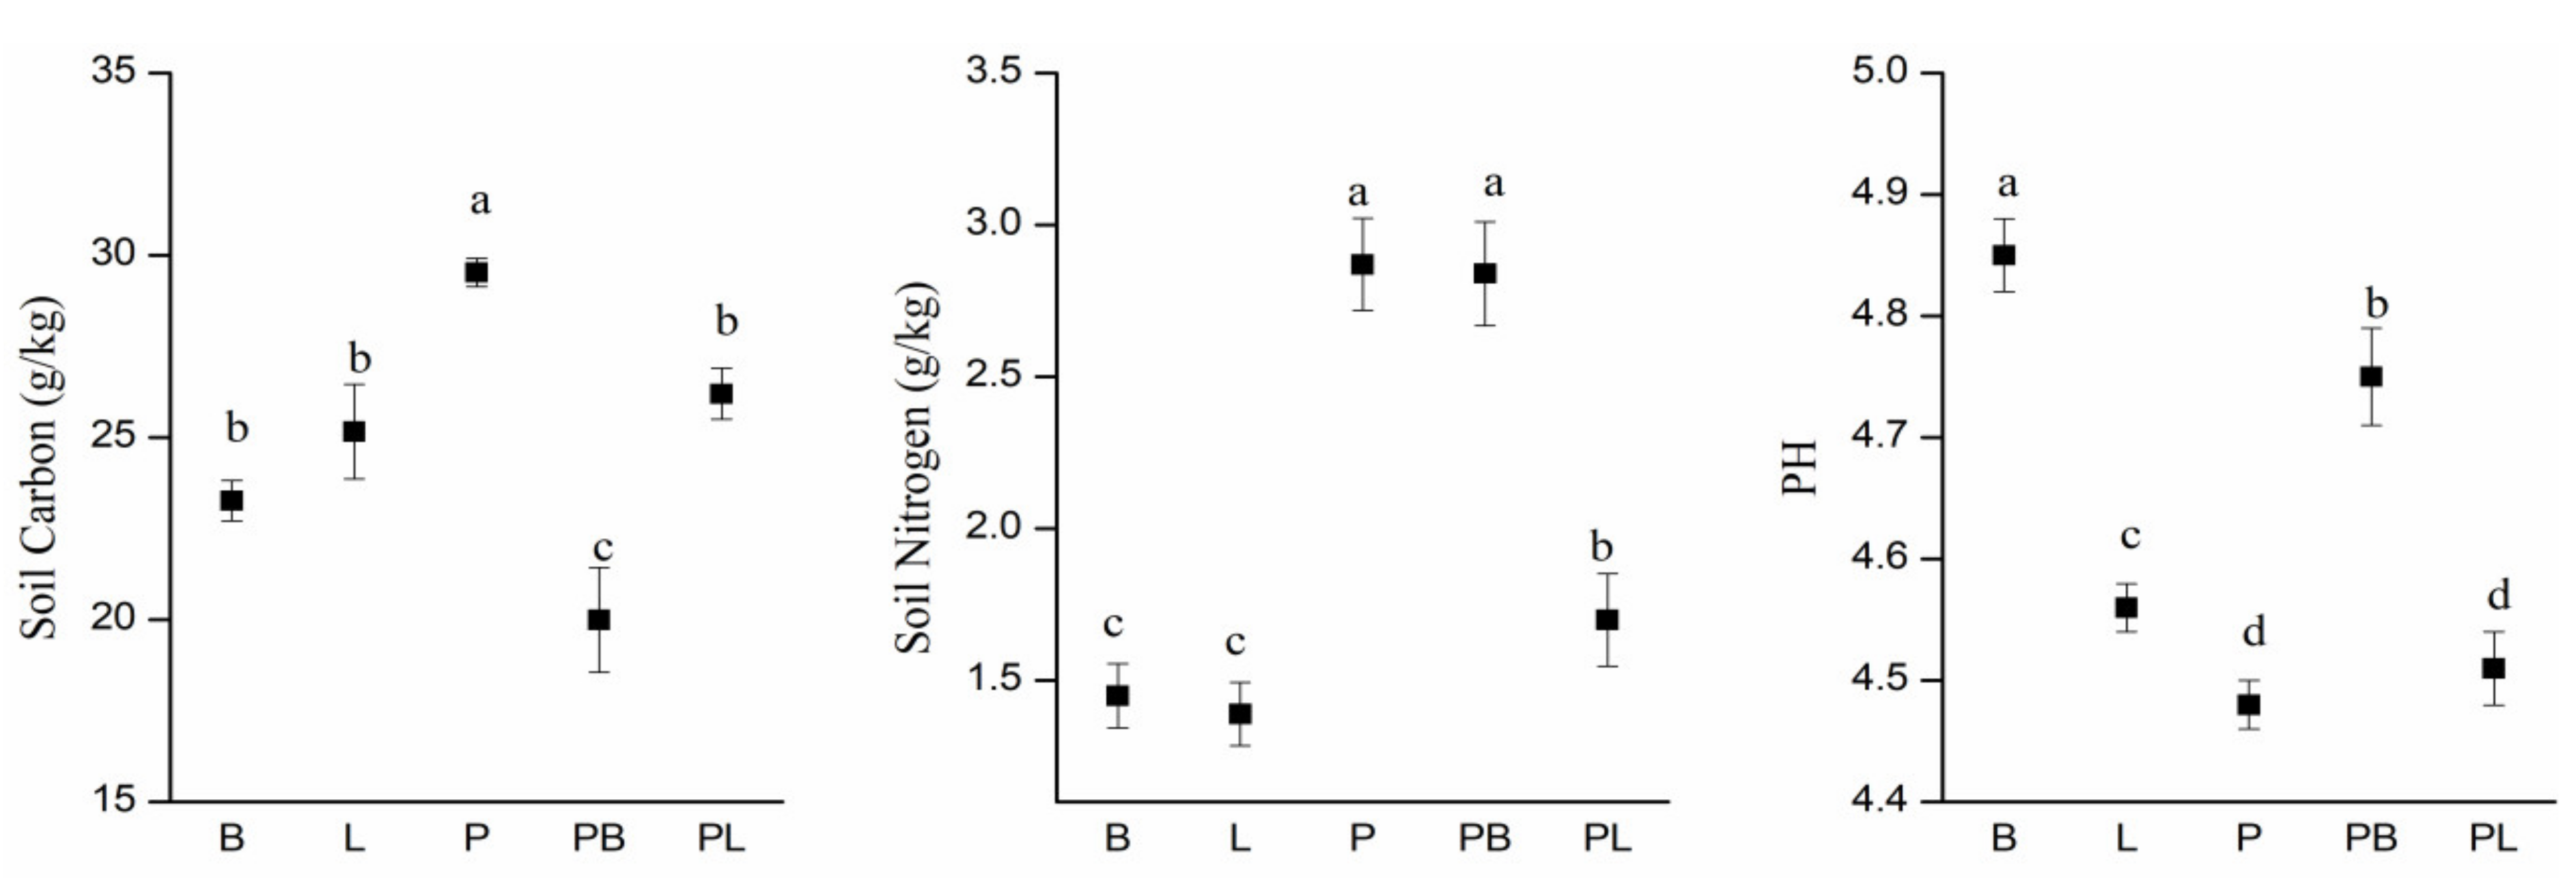
3.4. Soil Physicochemical Features

The soil physicochemical features were significantly changed in both mixed-species plantations after 20 years. Compared with results in L, TOC (p = 0.001) was increased by 11.33% in the PL mixed-species plantation; compared with results in B, it decreased by 16.8% in the PB mixed-species plantation. The TN (p = 0.001) of the PB and PL plantations were 17.2% and 12.7% higher than that of B and L. The soil pH values in both mixed-species plantations were significantly decreased compared to those in monoculture plantation soil (Figure 5).

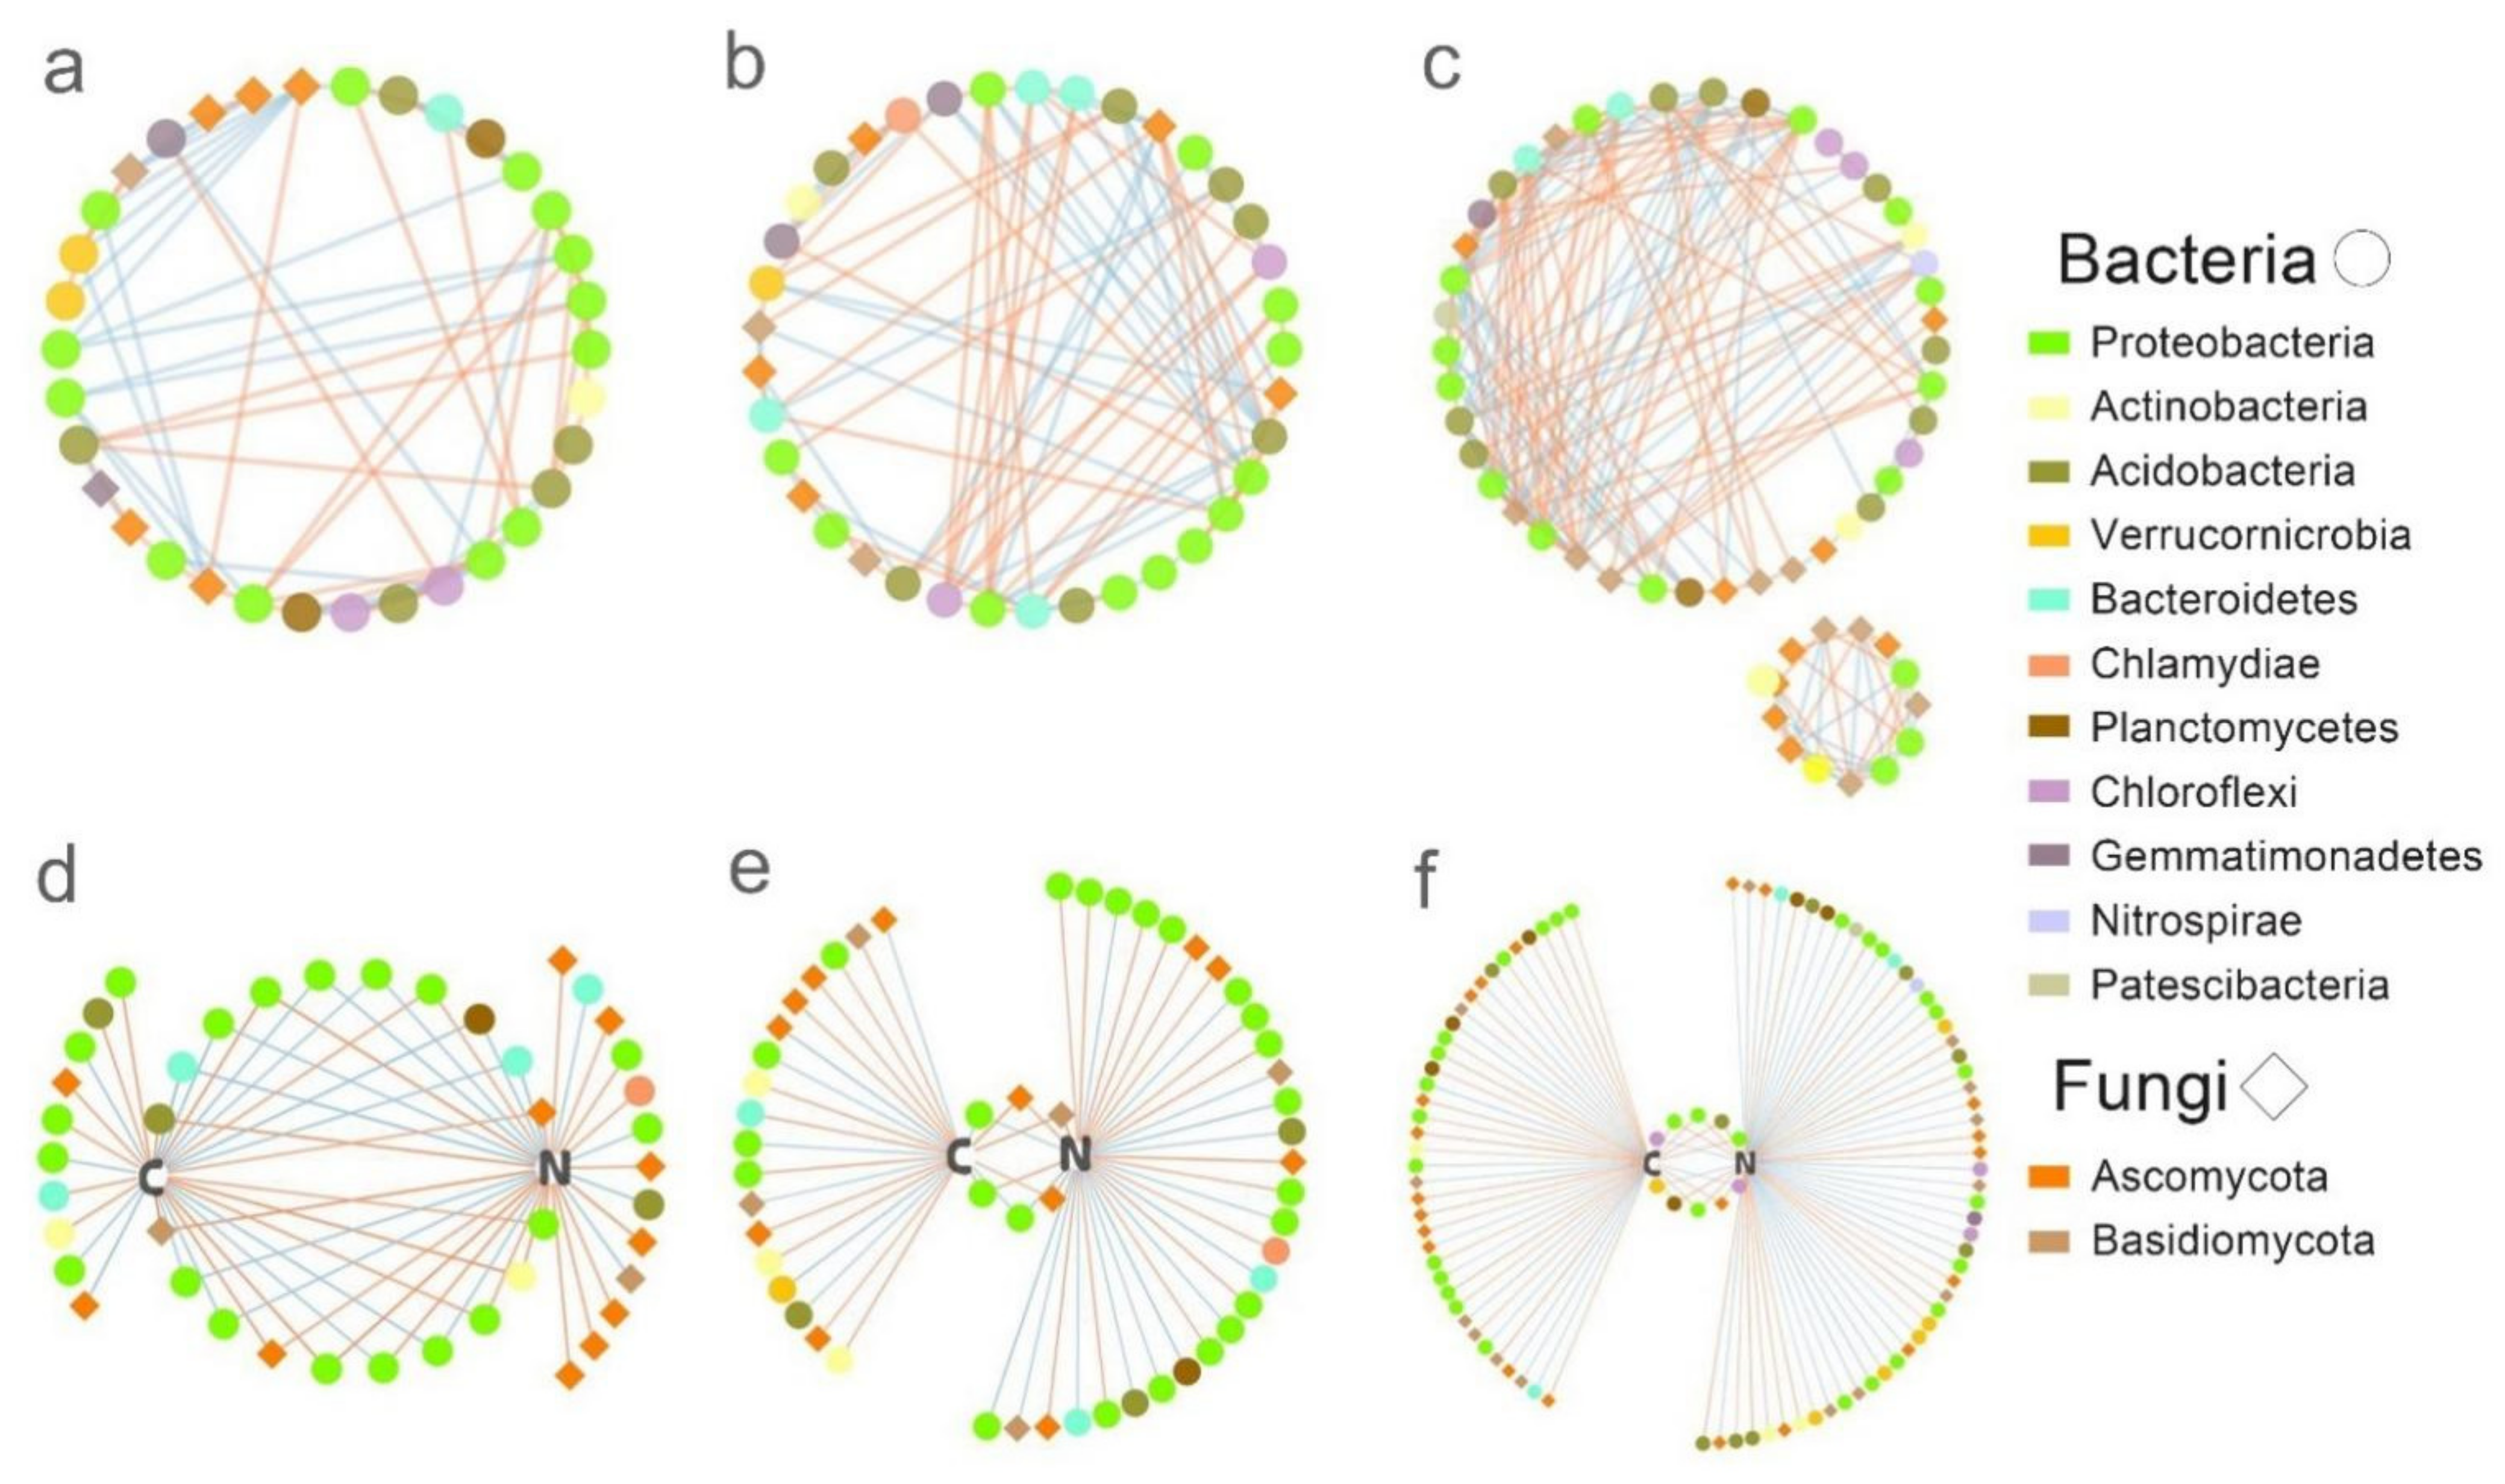
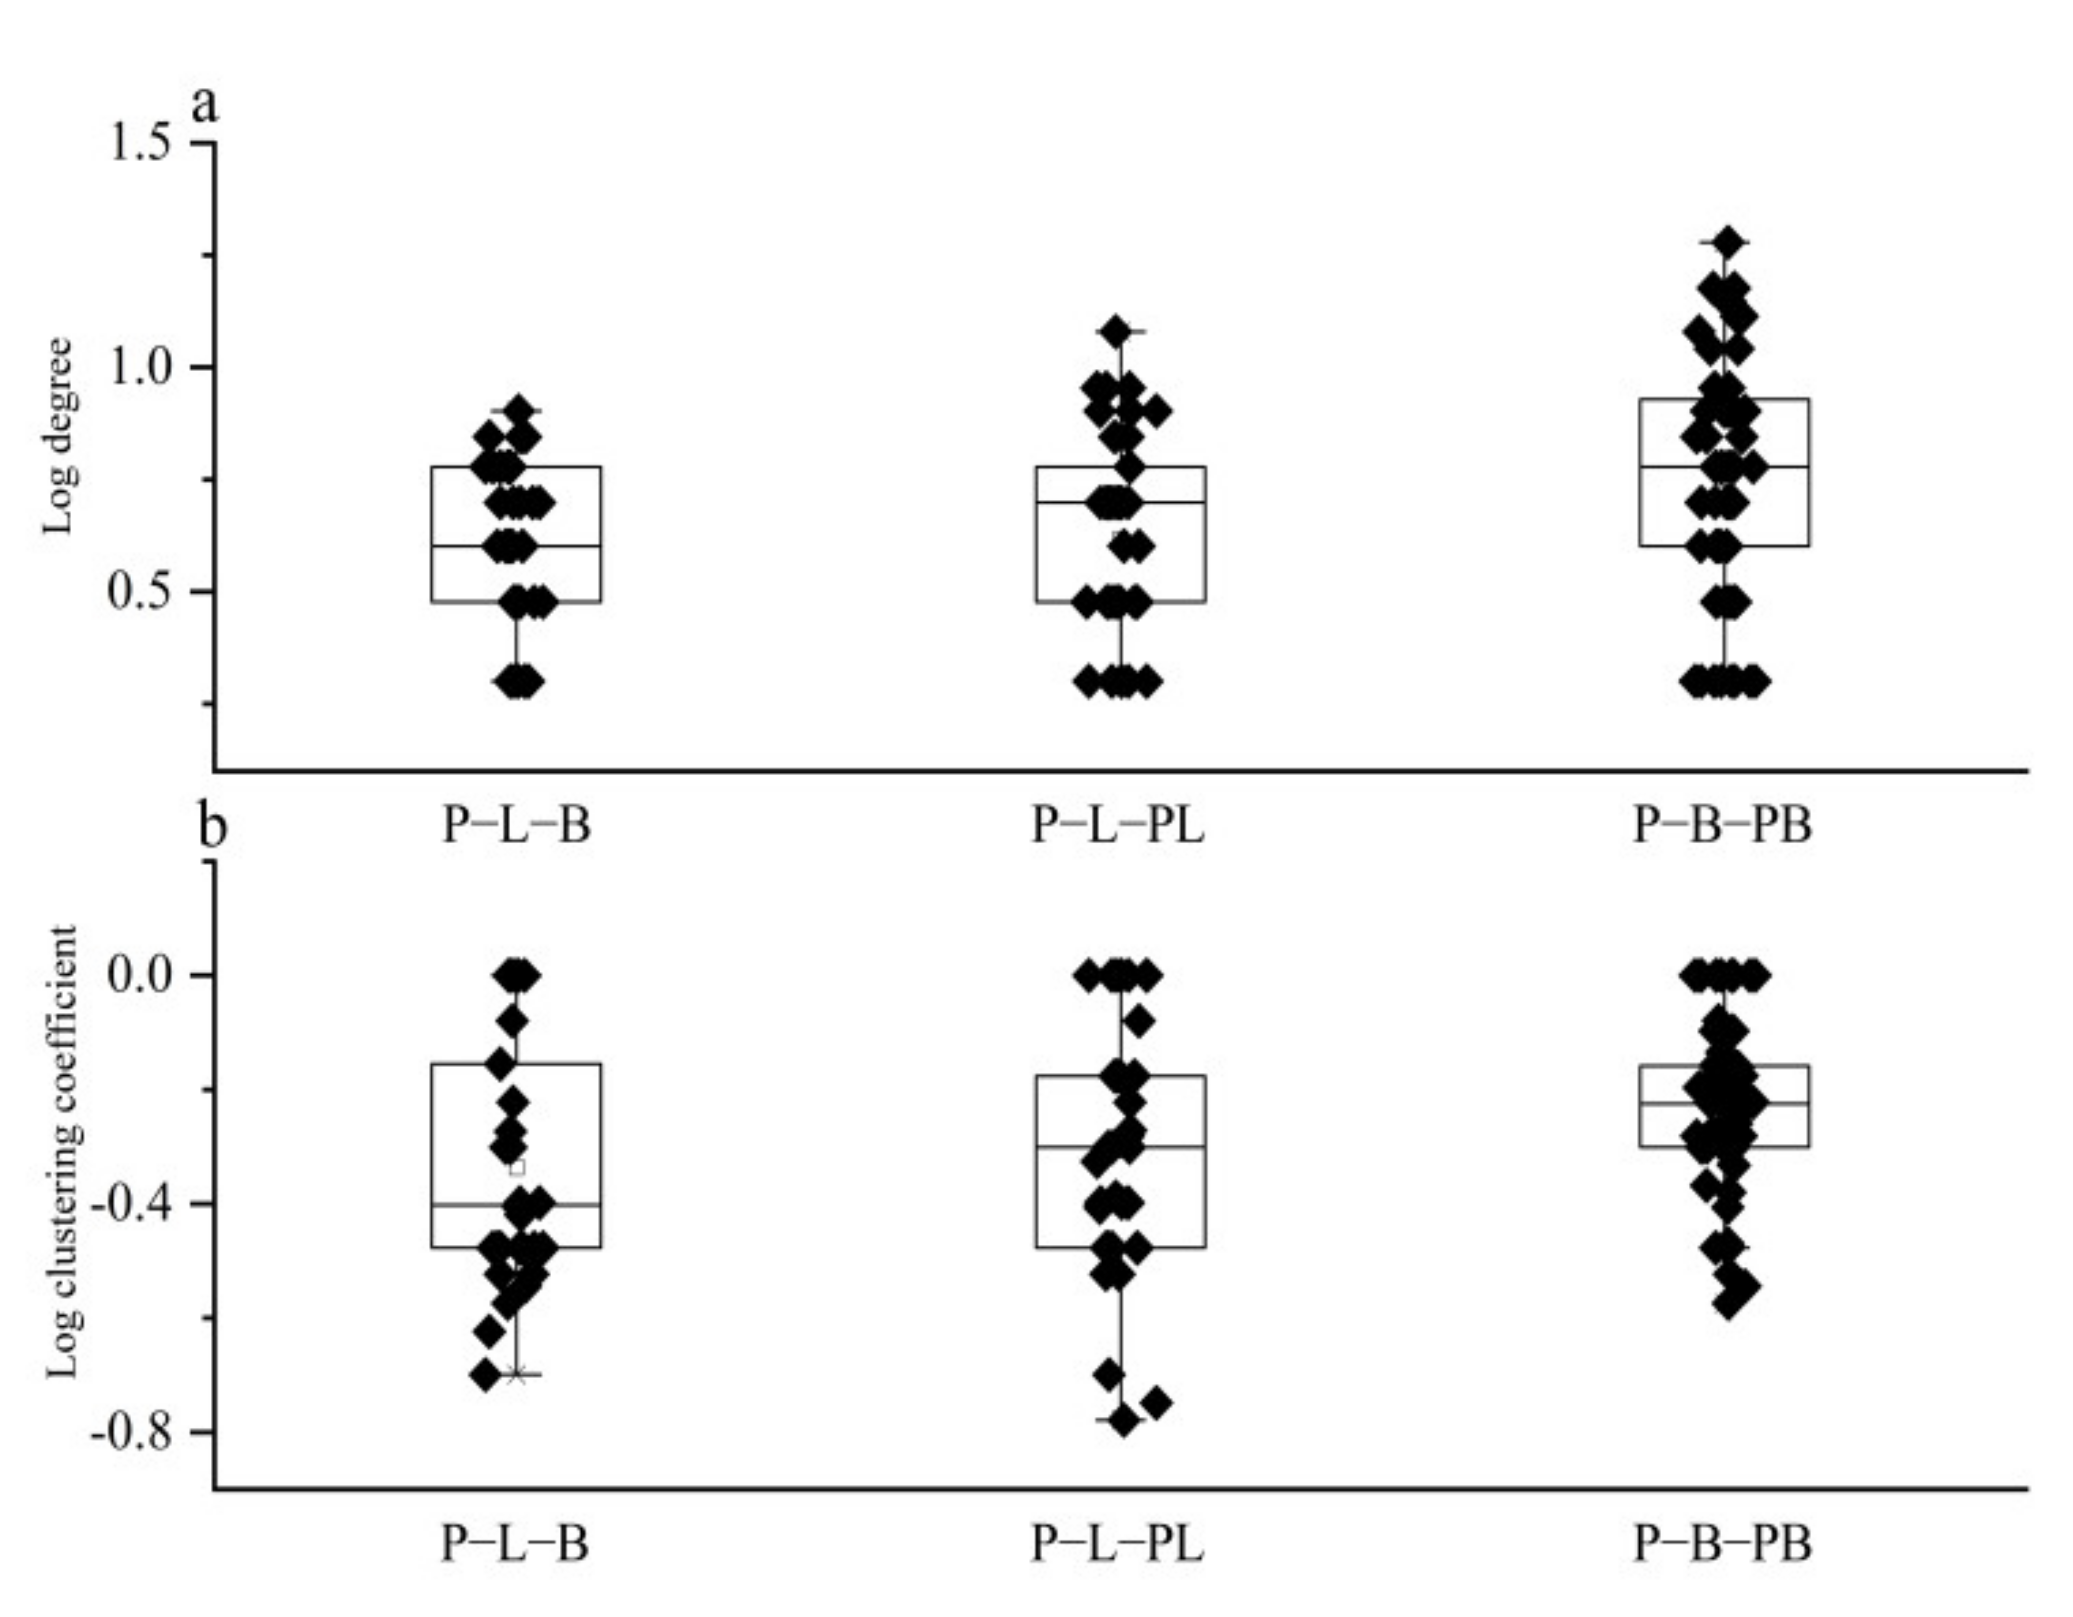
3.5. Microbial and Soil Function Co-Occurrence Network Analysis

We used significant correlations to construct three co-occurrence networks (i.e., P-L-B, P-B-PB, and P-L-PL) and observed the difference between monoculture and mixed species plantations on the microbial and soil C and N co-occurrence networks. The number of nodes in the mixed-species plantation network was higher than in any monoculture plantation, but this was primarily due to bacterial and not fungal dynamics. For example, bacterial nodes increased in the mixed-species plantations relative to monocultures, whereas fungal nodes exhibited little difference, and the number of edges in the mixed-species plantation was higher than in any monoculture plantation. Bacteria were more connected than fungi and contained more edges. Fungi–fungi had the least number of edges. The number of fungi–bacteria and bacteria–bacteria edges increased in the mixed-species plantation compared to those in the monoculture plantations (Table S3). We analyzed the connectedness and complexity of three networks and found that P-B-PB (Figure 6c) had the highest average network connectedness (degree) (Figure 7a) and complexity (clustering coefficient) (Figure 7b), followed by P-L-PL and P-L-B.
There were 53 and 99 nodes in the P-L-PL (Figure 6e) and the P-B-PB (Figure 6f) soil carbon and nitrogen co-occurrence network, respectively, and 43 nodes in the monoculture plantation (Figure 6d) (Table 1). In the P-L-PL network, the nodes that positively and negatively correlated with soil carbon content were essentially the same, while in the P-B-PB network, the nodes that positively correlated were twice as many as those that were negatively correlated. More nodes were negatively correlated with soil nitrogen than positively correlated. The number of nodes associated with both soil carbon and nitrogen decreased significantly from the mixed-species plantations to the monoculture plantation; meanwhile, network density and network centralization decreased. Among the three networks, Ascomycota was positively correlated with soil carbon and Bacteroidetes was negatively correlated. Ascomycota and Actinobacteria were positively correlated with soil nitrogen, while Verrucomicrobia was negatively correlated.

4. Discussion

4.1. Influence of Mixed-Tree Species on Microbial Community Structure

Our results indicate that the microbial community structure of mixed-species plantations from the same functional traits (PL) was comprised mainly of fungal and bacterial components that exhibited high abundance in the monoculture plantations. The fungal community structure of the mixed-species plantation comprised of trees from different functional traits (PB) more closely resembled that of the coniferous monoculture plantation (P), while the bacterial community structure more closely resembled that of the angiosperm monoculture plantation (B). Tree species was the most important factor affecting the fungal community structure, and soil nitrogen was the most important factor affecting the bacterial community structure, which supported the first hypothesis.
That the fungal community structure was most strongly influenced by tree species is likely due to mycorrhizal fungal communities associated with tree roots. Ectomycorrhizal fungi form symbiotic relationships with most temperate tree species, accounting for 80% of the fungal community [46], and some tree species have broad hosts. For example, the evergreen conifer Douglas-fir has more than 2000 known ectomycorrhizal fungal species associations [47], while other species such as the deciduous angiosperm alder are associated with only 50 known ectomycorrhizal fungal species [48]. A global meta-analysis revealed that tree species explained 34% of structural variation in fungal communities [49]. The other reason is the greater dependence of fungi on plant products [50], being a major mediator of decomposition and nutrient cycling, and possibly also affecting the coexistence of species by altering nutrient utilization. This may explain our finding that the relative abundance of ectomycorrhizal fungi was reduced in both mixed-species forests relative to monocultures, and that the mixed-species plantation comprised of two conifers (PL) exhibited lower ectomycorrhizal fungal abundance than the mixed-species plantation comprised of a conifer and an angiosperm (PB). The opposite was true for saprotrophic fungi, with both types of mixed-species plantations exhibiting higher abundance than monocultures, and mixed forests comprised of two conifers (PL) exhibiting higher abundance than mixed forests comprised of a conifer and angiosperm (PB; Figure S1). Thus, tree species is an important factor affecting the beta-diversity of the fungal community structure [12]. Especially in plantations, the effect of tree species is stronger than abiotic factors in shaping fungal diversity [51].
Compared to fungi, bacteria are universal; we found that the bacterial community structure in the coniferous mixed plantation was similar to one of the conifer plantations, and the bacterial community structure in the conifer–angiosperm mixed plantation was similar to the angiosperm plantation. Moreover, we found that the main factor affecting bacterial community structure was soil nitrogen content. Dukunde [52] found that the bacterial community structure in angiosperm mixed forests was more similar to one of them. As bacterial Nitrogen fixation is responsible for more than 90% of the nitrogen input process [53], the variation in bacterial community may not be strictly due to tree species, but rather because this species is the dominant species in the soil nitrogen cycle in mixed forests; therefore, although the community structure is similar to a particular species, the main factor controlling the community structure is soil nitrogen. Since soil bacterial communities are more influenced by stochastic processes than deterministic changes [54], and soil pH and MTP [19] are the main factors influencing the bacterial community structure in large-scale research studies, these factors have little variation at local scales. Hence, we believe that although tree species may contribute to differences in the structure of bacterial communities, stochastic processes (such as soil fertility) may be more relevant [55].

4.2. Influence of Mixed-Tree Species on Microbial Co-Occurrence Network

The relationship between soil nutrition and microbial communities is highly dynamic and changes with tree species. To develop a predictive understanding of soil function, it is critical to understand how microbial communities are involved in different plantations. This study shows that tree functional traits had a significant effect on soil microbial co-occurrence networks; it changed the network topological properties, which supports the second hypothesis. Mixed-species plantation networks contained more nodes, edges, and exhibited higher average network connectedness and complexity, especially the conifer–angiosperm plantation. Nodes and edges increased, indicating that networks in mixed-species plantations were more complicated than in monoculture plantations. Previous studies have reported that microbial co-occurrence networks in a natural broad-leaved forest were more complex and robust than those in monoculture plantations [56]. Our results suggest that stability was higher in mixed-species than in monoculture plantations. Positive and negative correlations between fungal and bacterial components increased in mixed-species plantations as compared to those in monoculture plantations. This may indicate that vegetation not only provides resources for microbes, but also intensifies their competition [57]; however, as available resources increased, members may respond synergistically to habitat change, resulting in positive feedback and co-oscillations [58], as well as a higher clustering coefficient of network complexity. Our results indicated that network complexity is mainly caused by the fungi–bacterial and bacterial–bacterial interactions, although the soil bacterial community exhibited weak stress resistance, but strong resilience [59]. In the mixed-species plantations, especially the coniferous-angiosperm mixed plantation, the overall microbial network is more robust than the network of the monoculture plantations. The bacterial community structure was mainly affected by the soil nitrogen content, suggesting that nitrogen availability will affect the complexity and stability of the microbial co-occurrence network.
The overall microbial phyla associated with soil carbon and nitrogen were significantly increased in mixed species plantations, especially bacteria, while fungi were relatively constant. For fungi, it was a change in the relative abundance; Ascomycota positively correlated with soil carbon and nitrogen content. Ascomycota has been associated with cellulose decomposition [60] and was particularly abundant in the soil of PL as a result of the lignocellulose degradation rate in mixed litter being significantly higher than in the monoculture [61]. In contrast, bacterial variation was significantly lower; more specifically, the phyla associated with soil carbon content were two in the conifer mixed plantation and increased to ten in the coniferous-angiosperm mixed plantation, which was associated with soil nitrogen content that was increased from two to five. Proteobacteria, Actinobacteria, and Acidobacteria are three of the most abundant phyla in forest soils [62,63,64] and are responsible for most bacterial transcription [23,65]. Studies have shown that bacteria accumulate more cellulosic-C in coniferous forest litter than fungi, and that most of these bacteria belong to Acidobacteria and Proteobacteria [66,67], while other groups such as Gemmatimonadetes [68] and Chlorofexi [69] that are enriched in lower nutritional conditions may decline. The RDA results indicated that total nitrogen was the key factor causing changes in bacterial community structure, and that higher soil nitrogen content in the mixed conifer–angiosperm mixed plantation altered community function and metabolic potential as well as decomposition rates.

4.3. Influence of Mixed-Tree Species on Soil Physicochemical

In this study, we used coniferous and angiosperm trees from forest plantations to assess the association between soil microbial communities and soil chemistry. Because this work was performed in plantations, we could attribute the changes in soil physicochemical properties to the presence of tree species rather than environmental conditions.
Vegetation is the key factor that enables an understanding of the fate of the soils, and this has been demonstrated in agriculture (different cover crops) [70] and forestry (different types of mixed forests) studies. Our results show that after 20 years of tree growth in plantations, soil pH, carbon, and nitrogen concentration differed between the five plantations, and tree functional traits were associated with changes in the physicochemical properties of soil underlying mixed-species plantations, which supported the third hypothesis. The conifer–angiosperm mixed plantation was associated with faster litter decay relative to the coniferous mixed plantation, which increased soil N concentration [71,72]. Higher soil pH and carbon concentration in the coniferous mixed plantation could also be related to slower rates of litter decay, which is typical of coniferous-dominated stands.

5. Conclusions

Our results showed that fungal community structure was mainly influenced by tree species, whereas bacterial community structure was mainly influenced by soil nitrogen. The soil microbial co-occurrence relationship varied with different types of mixed-species plantations. The mixed-plantation co-occurrence networks were more robust. Our results are robust in that all of our plantations are the same age and from the same site, thereby eliminating variation due to stand development, climate, and soil parent material. An improved understanding of the factors influencing the microbial community structure can be applied to forest management ecosystem processes and ecosystem services. Future work should aim to assess the relative stability of the microbial community structure following natural (e.g., windthrow or wildfire) and artificial disturbances (e.g., forest thinning or harvesting).

Supplementary Materials

The following are available online at https://www.mdpi.com/article/10.3390/f12081018/s1, Table S1: Microbiological Co-occurrent Network Analysis Group, Table S2: ANOSIM analysis results, based on the rank of the distance between monoculture groups and all groups. Table S3: Number of nodes and edges in bacterial-fungal co-occurrence network. +, represents positive correlation; -, represents negative correlation, Figure S1: The abundance of fungi functional identified based on FunGuild database.

Author Contributions

Conceptualization, Y.G., X.W. and D.P.A.; investigation, Y.G., L.Y. and Z.J.; methodology, Y.G., Z.M. and X.C.; data creation and formal analysis, Y.G. and X.W.; software and visualization, Y.G. and X.W.; writing—original draft, Y.G. and X.W.; writing—review and editing, Y.G., X.W. and D.P.A.; funding acquisition, X.W. and X.C. All authors have read and agreed to the published version of the manuscript.

Funding

This research was supported by National Natural Science Foundation of China (31670476), National Key R&D Program (2018YFC0507003) of China, Applied technology research and Development Program of Heilongjiang Province (GA20B401), the Fundamental Research Funds for the Central Universities (2572019BA15 and 2572019CP09), and Heilongjiang Touyan Innovation Team Program Technology Development Team for High-efficient Silviculture of Forest Resources.

Acknowledgments

We thank the Alongshan forestry administration and all the members involved in sampling.

Conflicts of Interest

The authors declare no conflict of interest.

References

  1. Vitousek, P.M.; Abei, J.; Howarth, R.W.; Likens, G.E. Human alteration of the global nitrogen cycle: Sources and consequences. Nat. Sci. Sociétés 1997, 5, 85. [Google Scholar] [CrossRef] [Green Version]
  2. IPCC. Intergovernmental Panel on Climate Change 2007:Climate Change 2007: The Physical Science Basis; IPCC: Geneva, Switzerland, 2007. [Google Scholar]
  3. Fierer, N. Embracing the unknown: Disentangling the complexities of the soil microbiome. Nat. Rev. Microbiol. 2017, 15, 579–590. [Google Scholar] [CrossRef] [PubMed]
  4. Maron, P.-A.; Mougel, C.; Ranjard, L. Soil microbial diversity: Methodological strategy, spatial overview and functional interest. Comptes Rendus Biol. 2011, 334, 403–411. [Google Scholar] [CrossRef] [PubMed]
  5. Keesstra, S.; Mol, G.; de Leeuw, J.; Okx, J.; Molenaar, C.; de Cleen, M.; Visser, S. Soil-Related Sustainable Development Goals: Four Concepts to Make Land Degradation Neutrality and Restoration Work. Land 2018, 7, 133. [Google Scholar] [CrossRef] [Green Version]
  6. Tyson, G.W.; Chapman, J.; Hugenholtz, P.; Allen, E.E.; Ram, R.J.; Richardson, P.M.; Solovyev, V.V.; Rubin, E.M.; Rokhsar, D.S.; Banfield, J.F. Community structure and metabolism through reconstruction of microbial genomes from the environment. Nature 2004, 428, 37–43. [Google Scholar] [CrossRef]
  7. Prescott, C.E.; Grayston, S.J. Tree species influence on microbial communities in litter and soil: Current knowledge and research needs. For. Ecol. Manag. 2013, 309, 19–27. [Google Scholar] [CrossRef]
  8. Dawud, S.M.; Raulund-Rasmussen, K.; Ratcliffe, S.; Domisch, T.; Finér, L.; Joly, F.X.; Hättenschwiler, S.; Vesterdal, L.; Ostertag, R. Tree species functional group is a more important driver of soil properties than tree species diversity across major European forest types. Funct. Ecol. 2017, 31, 1153–1162. [Google Scholar] [CrossRef]
  9. Leff, J.W.; Bardgett, R.D.; Wilkinson, A.; Jackson, B.G.; Pritchard, W.J.; De Long, J.R.; Oakley, S.; Mason, K.E.; Ostle, N.J.; Johnson, D.; et al. Predicting the structure of soil communities from plant community taxonomy, phylogeny, and traits. ISME J. 2018, 12, 1794–1805. [Google Scholar] [CrossRef] [Green Version]
  10. Chen, Y.-L.; Xu, T.-L.; Veresoglou, S.D.; Hu, H.-W.; Hao, Z.-P.; Hu, Y.-J.; Liu, L.; Deng, Y.; Rillig, M.C.; Chen, B.-D. Plant diversity represents the prevalent determinant of soil fungal community structure across temperate grasslands in northern China. Soil Biol. Biochem. 2017, 110, 12–21. [Google Scholar] [CrossRef]
  11. Tedersoo, L.; Bahram, M.; Cajthaml, T.; Polme, S.; Hiiesalu, I.; Anslan, S.; Harend, H.; Buegger, F.; Pritsch, K.; Koricheva, J.; et al. Tree diversity and species identity effects on soil fungi, protists and animals are context dependent. ISME J. 2016, 10, 346–362. [Google Scholar] [CrossRef] [Green Version]
  12. Peay, K.G.; Baraloto, C.; Fine, P.V.A. Strong coupling of plant and fungal community structure across western Amazonian rainforests. ISME J. 2013, 7, 1852–1861. [Google Scholar] [CrossRef]
  13. Whittaker, R.J. Island species-energy theory. J. Biogeogr. 2006, 33, 11–12. [Google Scholar] [CrossRef]
  14. Lauber, C.L.; Hamady, M.; Knight, R.; Fierer, N. Pyrosequencing-Based Assessment of Soil pH as a Predictor of Soil Bacterial Community Structure at the Continental Scale. Appl. Environ. Microbiol. 2009, 75, 5111–5120. [Google Scholar] [CrossRef] [Green Version]
  15. Wang, X.; Sharp, C.E.; Jones, G.M.; Grasby, S.E.; Brady, A.L.; Dunfield, P.F. Stable-Isotope Probing Identifies Uncultured Planctomycetes as Primary Degraders of a Complex Heteropolysaccharide in Soil. Appl. Environ. Microbiol. 2015, 81, 4607–4615. [Google Scholar] [CrossRef] [Green Version]
  16. Dunbar, J.; Barns, S.M.; Ticknor, L.O.; Kuske, C.R. Empirical and theoretical bacterial diversity in four Arizona soils. Appl. Environ. Microbiol. 2002, 68, 3035–3045. [Google Scholar] [CrossRef] [Green Version]
  17. Staley, J.T.; Anna-Louise, R. Biodiversity of Microbial Life: Foundation of Earth’s Biosphere; Wiley-Liss: New York, NY, USA, 2003. [Google Scholar]
  18. Tringe, S.G.; von Mering, C.; Kobayashi, A.; Salamov, A.A.; Chen, K.; Chang, H.W.; Podar, M.; Short, J.M.; Mathur, E.J.; Detter, J.C.; et al. Comparative metagenomics of microbial communities. Science 2005, 308, 554–557. [Google Scholar] [CrossRef] [Green Version]
  19. Hanson, C.A.; Fuhrman, J.A.; Horner-Devine, M.C.; Martiny, J.B.H. Beyond biogeographic patterns: Processes shaping the microbial landscape. Nat. Rev. Microbiol. 2012, 10, 497–506. [Google Scholar] [CrossRef] [PubMed]
  20. Bahram, M.; Hildebrand, F.; Forslund, S.K.; Anderson, J.L.; Soudzilovskaia, N.A.; Bodegom, P.M.; Bengtsson-Palme, J.; Anslan, S.; Coelho, L.P.; Harend, H.; et al. Structure and function of the global topsoil microbiome. Nature 2018, 560, 233–237. [Google Scholar] [CrossRef] [PubMed]
  21. Trivedi, P.; Delgado-Baquerizo, M.; Trivedi, C.; Hu, H.; Anderson, I.C.; Jeffries, T.C.; Zhou, J.; Singh, B.K. Microbial regulation of the soil carbon cycle: Evidence from gene–enzyme relationships. ISME J. 2016, 10, 2593–2604. [Google Scholar] [CrossRef] [PubMed] [Green Version]
  22. Walther, G.-R.; Post, E.; Convey, P.; Menzel, A.; Parmesan, C.; Beebee, T.J.C.; Fromentin, J.-M.; Hoegh-Guldberg, O.; Bairlein, F. Ecological responses to recent climate change. Nature 2002, 416, 389–395. [Google Scholar] [CrossRef]
  23. Baldrian, P.; Kolařík, M.; Štursová, M.; Kopecký, J.; Valášková, V.; Větrovský, T.; Žifčáková, L.; Šnajdr, J.; Rídl, J.; Vlček, Č.; et al. Active and total microbial communities in forest soil are largely different and highly stratified during decomposition. ISME J. 2011, 6, 248–258. [Google Scholar] [CrossRef] [Green Version]
  24. Martiny, J.B.H.; Bohannan, B.J.M.; Brown, J.H.; Colwell, R.K.; Fuhrman, J.A.; Green, J.L.; Horner-Devine, M.C.; Kane, M.; Krumins, J.A.; Kuske, C.R.; et al. Microbial biogeography: Putting microorganisms on the map. Nat. Rev. Microbiol. 2006, 4, 102–112. [Google Scholar] [CrossRef]
  25. Llado, S.; Lopez-Mondejar, R.; Baldrian, P. Forest Soil Bacteria: Diversity, Involvement in Ecosystem Processes, and Response to Global Change. Microbiol. Mol. Biol. Rev. 2017, 81. [Google Scholar] [CrossRef] [Green Version]
  26. Prescott, C.E.; Vesterdal, L. Tree species effects on soils in temperate and boreal forests: Emerging themes and research needs. For. Ecol. Manag. 2013, 309, 1–3. [Google Scholar] [CrossRef]
  27. Landi, P.; Minoarivelo, H.O.; Brannstrom, A.; Hui, C.; Dieckmann, U. Complexity and stability of ecological networks: A review of the theory. Popul. Ecol. 2018, 60, 319–345. [Google Scholar] [CrossRef]
  28. Folman, L.B.; Gunnewiek, P.J.A.K.; Boddy, L.; de Boer, W. Impact of white-rot fungi on numbers and community composition of bacteria colonizing beech wood from forest soil. Fems. Microbiol. Ecol. 2008, 63, 181–191. [Google Scholar] [CrossRef] [PubMed] [Green Version]
  29. Valaskova, V.; de Boer, W.; Gunnewiek, P.J.A.K.; Pospisek, M.; Baldrian, P. Phylogenetic composition and properties of bacteria coexisting with the fungus Hypholoma fasciculare in decaying wood. ISME J. 2009, 3, 1218–1221. [Google Scholar] [CrossRef] [PubMed] [Green Version]
  30. Rinta-Kanto, J.M.; Sinkko, H.; Rajala, T.; Al-Soud, W.A.; Sorensen, S.J.; Tamminen, M.V.; Timonen, S. Natural decay process affects the abundance and community structure of Bacteria and Archaea in Picea abies logs. Fems. Microbiol. Ecol. 2016, 92, fiw087. [Google Scholar] [CrossRef] [Green Version]
  31. Yang, L.; Wang, X.; Mao, Z.; Jiang, Z.; Gao, Y.; Chen, X.; Aubrey, D.P. Root Exudation Rates Decrease with Increasing Latitude in Some Tree Species. Forests 2020, 11, 1045. [Google Scholar] [CrossRef]
  32. Barberan, A.; Bates, S.T.; Casamayor, E.O.; Fierer, N. Using network analysis to explore co-occurrence patterns in soil microbial communities. ISME J. 2012, 6, 343–351. [Google Scholar] [CrossRef] [Green Version]
  33. Faust, K.; Raes, J. Microbial interactions: From networks to models. Nat. Rev. Microbiol. 2012, 10, 538–550. [Google Scholar] [CrossRef] [PubMed]
  34. Tylianakis, J.M.; Laliberte, E.; Nielsen, A.; Bascompte, J. Conservation of species interaction networks. Biol. Conserv. 2010, 143, 2270–2279. [Google Scholar] [CrossRef]
  35. Banerjee, S.; Kirkby, C.A.; Schmutter, D.; Bissett, A.; Kirkegaard, J.A.; Richardson, A.E. Network analysis reveals functional redundancy and keystone taxa amongst bacterial and fungal communities during organic matter decomposition in an arable soil. Soil Biol. Biochem. 2016, 97, 188–198. [Google Scholar] [CrossRef]
  36. Laganiere, J.; Angers, D.A.; Pare, D. Carbon accumulation in agricultural soils after afforestation: A meta-analysis. Glob. Chang. Biol. 2010, 16, 439–453. [Google Scholar] [CrossRef]
  37. Murphy, J.; Riley, J.P. A Sigle-Solution Metnod for The Determination of Soluble Phosphate in Sea Water. J. Mar. Biol. Assoc. UK 1958, 1, 9–14. [Google Scholar] [CrossRef] [Green Version]
  38. Caporaso, J.G.; Lauber, C.L.; Walters, W.A.; Berg-Lyons, D.; Huntley, J.; Fierer, N.; Owens, S.M.; Betley, J.; Fraser, L.; Bauer, M.; et al. Ultra-high-throughput microbial community analysis on the Illumina HiSeq and MiSeq platforms. ISME J. 2012, 6, 1621–1624. [Google Scholar] [CrossRef] [Green Version]
  39. Prober, S.M.; Leff, J.W.; Bates, S.T.; Borer, E.T.; Firn, J.; Harpole, W.S.; Lind, E.M.; Seabloom, E.W.; Adler, P.B.; Bakker, J.D.; et al. Plant diversity predicts beta but not alpha diversity of soil microbes across grasslands worldwide. Ecol. Lett. 2015, 18, 85–95. [Google Scholar] [CrossRef] [PubMed]
  40. Qiao, M.; Qi, W.; Liu, H.; Bai, Y.; Qu, J. Formation of oxygenated polycyclic aromatic hydrocarbons from polycyclic aromatic hydrocarbons during aerobic activated sludge treatment and their removal process. Chem. Eng. J. 2016, 302, 50–57. [Google Scholar] [CrossRef]
  41. Oksanen, J.; Blanchet, F.G.; Friendly, M.; Kindt, R.; Legendre, P.; McGlinn, D.; Minchin, P.R.; O’Hara, R.B.; Simpson, G.L.; Solymos, P.; et al. Vegan: Community Ecology Package; Iowa State University: Ames, IA, USA, 2018. [Google Scholar]
  42. Wickham, H. ggplot2: Elegant Graphics for Data Analysis; Springer: New York, NY, USA, 2016. [Google Scholar]
  43. Core Team, R. R: A Language and Environment for Statistical Computing; R Foundation for Statistical Computing: Vienna, Austria, 2019. [Google Scholar]
  44. Wu, D.; Zhang, M.; Peng, M.; Sui, X.; Li, W.; Sun, G. Variations in Soil Functional Fungal Community Structure Associated With Pure and Mixed Plantations in Typical Temperate Forests of China. Front. Microbiol. 2019, 10, 1636. [Google Scholar] [CrossRef] [PubMed] [Green Version]
  45. Chao, Y.; Liu, W.; Chen, Y.; Chen, W.; Zhao, L.; Ding, Q.; Wang, S.; Tang, Y.-T.; Zhang, T.; Qiu, R.-L. Structure, Variation, and Co-occurrence of Soil Microbial Communities in Abandoned Sites of a Rare Earth Elements Mine. Environ. Sci. Technol. 2016, 50, 11481–11490. [Google Scholar] [CrossRef]
  46. Wallander, H. External mycorrhizal mycelia–the importance of quantification in natural ecosystems. New Phytol. 2006, 171, 240–242. [Google Scholar] [CrossRef]
  47. Molina, R.; Massicotte, H.; Trappe, J.M. Specificity Phenomena in Mycorrhizal Symbioses: Community-Ecological Consequences and Practical Applications; Springer: Berlin, Germany, 1992; pp. 357–423. [Google Scholar]
  48. Pritsch, K.; Munch, J.C.; Buscot, F. Morphological and anatomical characterization of black alder Alnus glutinosa (L.) Gaertn. ectomycorrhizas. Mycorrhiza 1997, 7, 201–216. [Google Scholar] [CrossRef]
  49. Tedersoo, L.; Bahram, M.; Toots, M.; Diedhiou, A.G.; Henkel, T.W.; Kjoller, R.; Morris, M.H.; Nara, K.; Nouhra, E.; Peay, K.G.; et al. Towards global patterns in the diversity and community structure of ectomycorrhizal fungi. Mol. Ecol. 2012, 21, 4160–4170. [Google Scholar] [CrossRef] [PubMed]
  50. Millard, P.; Singh, B.K. Does grassland vegetation drive soil microbial diversity? Nutr. Cycl. Agroecosyst. 2010, 88, 147–158. [Google Scholar] [CrossRef]
  51. Sasse, J.; Martinoia, E.; Northen, T. Feed Your Friends: Do Plant Exudates Shape the Root Microbiome? Trends Plant Sci. 2018, 23, 25–41. [Google Scholar] [CrossRef] [PubMed] [Green Version]
  52. Dukunde, A.; Schneider, D.; Schmidt, M.; Veldkamp, E.; Daniel, R. Tree Species Shape Soil Bacterial Community Structure and Function in Temperate Deciduous Forests. Front. Microbiol. 2019, 10, e17000. [Google Scholar] [CrossRef]
  53. Berthrong, S.T.; Yeager, C.M.; Gallegos-Graves, L.; Steven, B.; Eichorst, S.A.; Jackson, R.B.; Kuske, C.R. Nitrogen Fertilization Has a Stronger Effect on Soil Nitrogen-Fixing Bacterial Communities than Elevated Atmospheric CO2. Appl. Environ. Microbiol. 2014, 80, 3103–3112. [Google Scholar] [CrossRef] [Green Version]
  54. Zhang, X.; Johnston, E.R.; Liu, W.; Li, L.; Han, X. Environmental changes affect the assembly of soil bacterial community primarily by mediating stochastic processes. Glob. Chang. Biol. 2016, 22, 198–207. [Google Scholar] [CrossRef] [PubMed]
  55. Siciliano, S.D.; Palmer, A.S.; Winsley, T.; Lamb, E.; Bissett, A.; Brown, M.V.; van Dorst, J.; Ji, M.; Ferrari, B.C.; Grogan, P.; et al. Soil fertility is associated with fungal and bacterial richness, whereas pH is associated with community composition in polar soil microbial communities. Soil Biol. Biochem. 2014, 78, 10–20. [Google Scholar] [CrossRef]
  56. Nakayama, M.; Imamura, S.; Taniguchi, T.; Tateno, R. Does conversion from natural forest to plantation affect fungal and bacterial biodiversity, community structure, and co-occurrence networks in the organic horizon and mineral soil? For. Ecol. Manag. 2019, 446, 238–250. [Google Scholar] [CrossRef]
  57. Mau, R.L.; Liu, C.M.; Aziz, M.; Schwartz, E.; Dijkstra, P.; Marks, J.C.; Price, L.B.; Keim, P.; Hungate, B.A. Linking soil bacterial biodiversity and soil carbon stability. ISME J. 2015, 9, 1477–1480. [Google Scholar] [CrossRef]
  58. Coyte, K.Z.; Schluter, J.; Foster, K.R. The ecology of the microbiome: Networks, competition, and stability. Science 2015, 350, 663–666. [Google Scholar] [CrossRef]
  59. De Vries, F.T.; Griffiths, R.I.; Bailey, M.; Craig, H.; Girlanda, M.; Gweon, H.S.; Hallin, S.; Kaisermann, A.; Keith, A.M.; Kretzschmar, M.; et al. Soil bacterial networks are less stable under drought than fungal networks. Nat. Commun. 2018, 9, 3033. [Google Scholar] [CrossRef] [PubMed] [Green Version]
  60. Fabian, J.; Zlatanovic, S.; Mutz, M.; Premke, K. Fungal-bacterial dynamics and their contribution to terrigenous carbon turnover in relation to organic matter quality. ISME J. 2017, 11, 415–425. [Google Scholar] [CrossRef] [PubMed] [Green Version]
  61. Wang, W.; Zhang, Q.; Sun, X.; Chen, D.; Insam, H.; Koide, R.T.; Zhang, S. Effects of mixed-species litter on bacterial and fungal lignocellulose degradation functions during litter decomposition. Soil Biol. Biochem. 2020, 141, 107690. [Google Scholar] [CrossRef]
  62. Lipson, D.A. Relationships between temperature responses and bacterial community structure along seasonal and altitudinal gradients. Fems. Microbiol. Ecol. 2007, 59, 418–427. [Google Scholar] [CrossRef]
  63. Kuffner, M.; Hai, B.; Rattei, T.; Melodelima, C.; Schloter, M.; Zechmeister-Boltenstern, S.; Jandl, R.; Schindlbacher, A.; Sessitsch, A. Effects of season and experimental warming on the bacterial community in a temperate mountain forest soil assessed by 16S rRNA gene pyrosequencing. Fems. Microbiol. Ecol. 2012, 82, 551–562. [Google Scholar] [CrossRef]
  64. Kurth, F.; Zeitler, K.; Feldhahn, L.; Neu, T.R.; Weber, T.; Kristufek, V.; Wubet, T.; Herrmann, S.; Buscot, F.; Tarkka, M.T. Detection and quantification of a mycorrhization helper bacterium and a mycorrhizal fungus in plant-soil microcosms at different levels of complexity. BMC Microbiol. 2013, 13, 205. [Google Scholar] [CrossRef] [PubMed]
  65. Zifcakova, L.; Vetrovsky, T.; Howe, A.; Baldrian, P. Microbial activity in forest soil reflects the changes in ecosystem properties between summer and winter. Environ. Microbiol. 2016, 18, 288–301. [Google Scholar] [CrossRef]
  66. Eichorst, S.A.; Kuske, C.R. Identification of Cellulose-Responsive Bacterial and Fungal Communities in Geographically and Edaphically Different Soils by Using Stable Isotope Probing. Appl. Environ. Microbiol. 2012, 78, 2316–2327. [Google Scholar] [CrossRef] [Green Version]
  67. Brown, M.E.; Chang, M.C.Y. Exploring bacterial lignin degradation. Curr. Opin. Chem. Biol. 2014, 19, 1–7. [Google Scholar] [CrossRef]
  68. DeBruyn, J.M.; Nixon, L.T.; Fawaz, M.N.; Johnson, A.M.; Radosevich, M. Global Biogeography and Quantitative Seasonal Dynamics of Gemmatimonadetes in Soil. Appl. Environ. Microbiol. 2011, 77, 6295–6300. [Google Scholar] [CrossRef] [Green Version]
  69. Maestre, F.T.; Delgado-Baquerizo, M.; Jeffries, T.C.; Eldridge, D.J.; Ochoa, V.; Gozalo, B.; Luis Quero, J.; Garcia-Gomez, M.; Gallardo, A.; Ulrich, W.; et al. Increasing aridity reduces soil microbial diversity and abundance in global drylands. Proc. Natl. Acad. Sci. USA 2015, 112, 15684–15689. [Google Scholar] [CrossRef] [Green Version]
  70. Novara, A.; Cerda, A.; Barone, E.; Gristina, L. Cover crop management and water conservation in vineyard and olive orchards. Soil Tillage Res. 2021, 208. [Google Scholar] [CrossRef]
  71. Yates, C.F.; Guo, J.; Bell, T.H.; Fleishman, S.M.; Bock, H.W.; Trexler, R.V.; Eissenstat, D.M.; Centinari, M. Tree—Induced alterations to soil properties and rhizoplane—Associated bacteria following 23 years in a common garden. Plant Soil 2021, 461, 591–602. [Google Scholar] [CrossRef]
  72. Aponte, C.; Garcia, L.V.; Maranon, T. Tree species effects on nutrient cycling and soil biota: A feedback mechanism favouring species coexistence. For. Ecol. Manag. 2013, 309, 36–46. [Google Scholar] [CrossRef] [Green Version]
Figure 1. Non−metric multidimensional scaling (NMDS) based on the Bray−Curtis analysis of the community structure of fungi (a) and bacteria (b) in monoculture and mixed forests soil. Colors of symbols represent forest types. B, Betula platyphylla; L, Larix gmelinii; P, Pinus sibirica; PB, P. sibirica and B. platyphylla; PL, P. sibirica and L. gmelinii.
Forests 12 01018 g001
Figure 2. Relative abundance of fungal (a) and bacterial species (b). The transverse coordinate is the sample name and the longitudinal coordinate is the relative abundance. The figure shows species with a relative abundance of more than 1% in fungal and bacterial communities. Details are described in Figure 1.
Forests 12 01018 g002
Figure 3. Relative abundance changes of fungi (a) and bacteria (b) sensitive species in five plantation types. Different lowercase letters represent significant differences, p < 0.05. Capital letters indicate extremely significant differences, p < 0.001. Details are described in Figure 1.
Forests 12 01018 g003
Figure 4. Redundancy analysis of fungi (ITS) (a) and bacteria 16S rRNA (b). Data were calculated by mean relative abundance > 0.1%; families and color according to phyla.
Forests 12 01018 g004
Figure 5. Variations of soil physicochemical features among monocultures and mixed-species plantations. Different lowercase letters represent significant differences, p < 0.05.
Forests 12 01018 g005
Figure 6. Co-occurring network of microorganism communities in Monoculture, PL, and PB based on correlation analysis. The connections stand for strong (Spearman’s p > 0.8 and p < −0.8) and significant (p < 0.001) correlations. (a), P-L-B; (b), P-L-PL; (c), P-B-PB. The connections stand for strong (Spearman’s p > 0.6 and p < −0.6) and significant (p < 0.05) correlations in co-occurring networks of soil carbon and nitrogen content. (d), P-L-B; (e), P-L-PL; (f), P-B-PB. Edges colored by positive (orange) and negative (blue) correlations.
Forests 12 01018 g006
Figure 7. Node connectedness and complexity of microbial networks. (a), degree; (b), log clustering coefficient. Each box represents the interquartile range, the line in each box represents the median, top and bottom of the boxes represent first and third quartiles, and whiskers represent the range of 1.5 interquartile range. Dots represent single observations.
Forests 12 01018 g007
Table 1. Number of nodes and edges in bacterial and soil function network. +, represents positive correlation; −, represents negative correlation.
P-L-BP-L-PLP-B-PB
Nodes435399
Bacterial nodes303662
Fungal nodes131735
Edges3359117
C+ C− note9;414;1533;19
N+ N−6;47;1115;22
C and N20610
Network density0.0640.0400.022
Network centralization0.7180.6310.611
Publisher’s Note: MDPI stays neutral with regard to jurisdictional claims in published maps and institutional affiliations.

