Article

Influence of Scots Pine (Pinus sylvestris L.) Veneers Quality on Selected Properties of Layered Composite for Flooring Materials

Institute of Wood Sciences and Furniture, Warsaw University of Life Sciences-SGGW, Nowoursynowska 166, 02-787 Warsaw, Poland
*
Author to whom correspondence should be addressed.
Forests 2021, 12(8), 1017; https://doi.org/10.3390/f12081017
Submission received: 25 May 2021 / Revised: 19 July 2021 / Accepted: 20 July 2021 / Published: 30 July 2021
(This article belongs to the Section Wood Science and Forest Products)

Abstract

:
The article concerns the quality issues in wood industry, and especially the advisability of removing defects from veneers. The research purpose of the study was to analyse the influence of the layered structure of plywood base layer made of low-quality wood on selected mechanical properties of floor composites. The utilitarian purpose is to analyse the possibility of producing floors from low-quality materials reducing waste. Four quality classes of Scots pine veneers (Pinus sylvestris L.) were taken into account: A, B, C, D, from the highest class-A without defects to the lowest class-D characterized by a lot of knots (including broken and falling out ones) and cracks. The base layer of the floors was made of these wood quality classes. The value of the modulus of elasticity in elastic deformation, modulus of elasticity in the dynamic and fatigue tests, stiffness and static bending strength were investigated. The test results showed that, as expected, the samples made of class A had the highest values of the measured parameters (static bending strength, static and dynamic modulus of elasticity, and stiffness). However, the values of the tested parameters for the remaining classes B, C, and D did not significantly differ. It was concluded from the research that the change of the plywood base layer conditions regarding the quality of veneers does not significantly affect the physical and mechanical properties of composites. Hence, it is possible to use wood of lower quality classes for production without verification of which class they belong to, which will significantly reduce the production costs.

1. Introduction

The research of flooring materials is focused mainly on the determination of the properties of floor top (face) surfaces, often as a separate layer without a base layer. Little has changed in this regard over the years. These tests mainly concern the condition, hardness [1,2], and strength [3] of the surface, as well as the gluability [4], colour stability, or top layer material modification: in-situ polymerization of active monomers [5] or thermal effect [6]. Attempts to increase the durability of floors by combining wood with other materials also have a long history [7]. Other studies are focused on finishing papers, that are, on the flooring [8].
If the physical and mechanical properties, mainly elastic properties of floors are tested. These are tests mainly of sports floors in order to determine their resistance to stresses that change over time. Standard empirical studies can be enriched with finite element method (FEM) digital models. The comparison of empirical studies of the height of the vertical rebound of the ball from the floor surface with numerical modelling showed the possibility of using the numerical analysis of dynamic parameters in the design of sports floor structures [9]. Research related to dynamic modulus of elasticity showed that it is feasible to evaluate the bending properties using the dynamic modulus of elasticity [10].
Very low material efficiency is known in the wood industry. It results, on the one hand, from the properties of the wood itself, and, on the other hand, from the production technology of the products. Material efficiency is tested only at the stage of production of wood products after eliminating defects in the raw material. This seems to be too late. Action should be taken to increase the efficiency of the production from log materials. Hence, in some production processes, wood material should be used, regardless of its quality. This will also reduce the problems with recycling, upcycling and is in the area of the recycled economy which is related to the new and most important EU strategy [11,12,13,14,15,16]. The studies focus on a sustainable product policy framework, key product value chains, less waste, more value, making circularity work for people, regions, and cities, crosscutting actions, and leading efforts at a global level.
The popular belief is that structural defects decrease base layer strength parameters no matter what it is made of, be it wood or wood-based materials [17]. Defects are removed during production. If the base layer is manufactured from rotary cut veneers, knots play a key role in the strength parameters. It is assumed that the knots decrease the modulus of elasticity (MOE), modulus of rupture (MOR), and tensile strength [18]. Research shows that the effect of knots on the physical and mechanical properties of composites is similar to the effect of holes [19]. The influence of knots and holes is most often verified with the Brinell hardness measurement as the most reliable [20,21]. However, certain factors should be taken into account in the measurements, such as the relaxation of the ball trace [22]. Based on the Brinell hardness tests it was shown that it is possible to use veneers with defects (empty spots) with a diameter of up to 20 mm to produce composites of three and more layers of wood (counting from the face layer) [23]. However, it is worth checking whether the entire material can be used without analysing its quality. Research on the impact of the quality of basic materials on the final product was studied for example for LVL (Laminated Veneer Lumber). However, in the finished product, the quality classes were mixed. It has been noticed that the insertion to the outer of LVL of veneer higher quality (defect free) and higher density provides the required mechanical properties. The increase in the number of low-quality veneer places in the central zone affects the decrease in its strength parameters [24].
The research purpose of the study was to analyse the influence of the layered structure of the plywood base layer made of low-quality wood on selected mechanical properties of floor composites. The utilitarian purpose was to analyse the possibility of producing floors from low-quality materials reducing waste. The floors were made of a given quality class, i.e., the quality classes of materials were not mixed for a given variant.

2. Materials and Methods

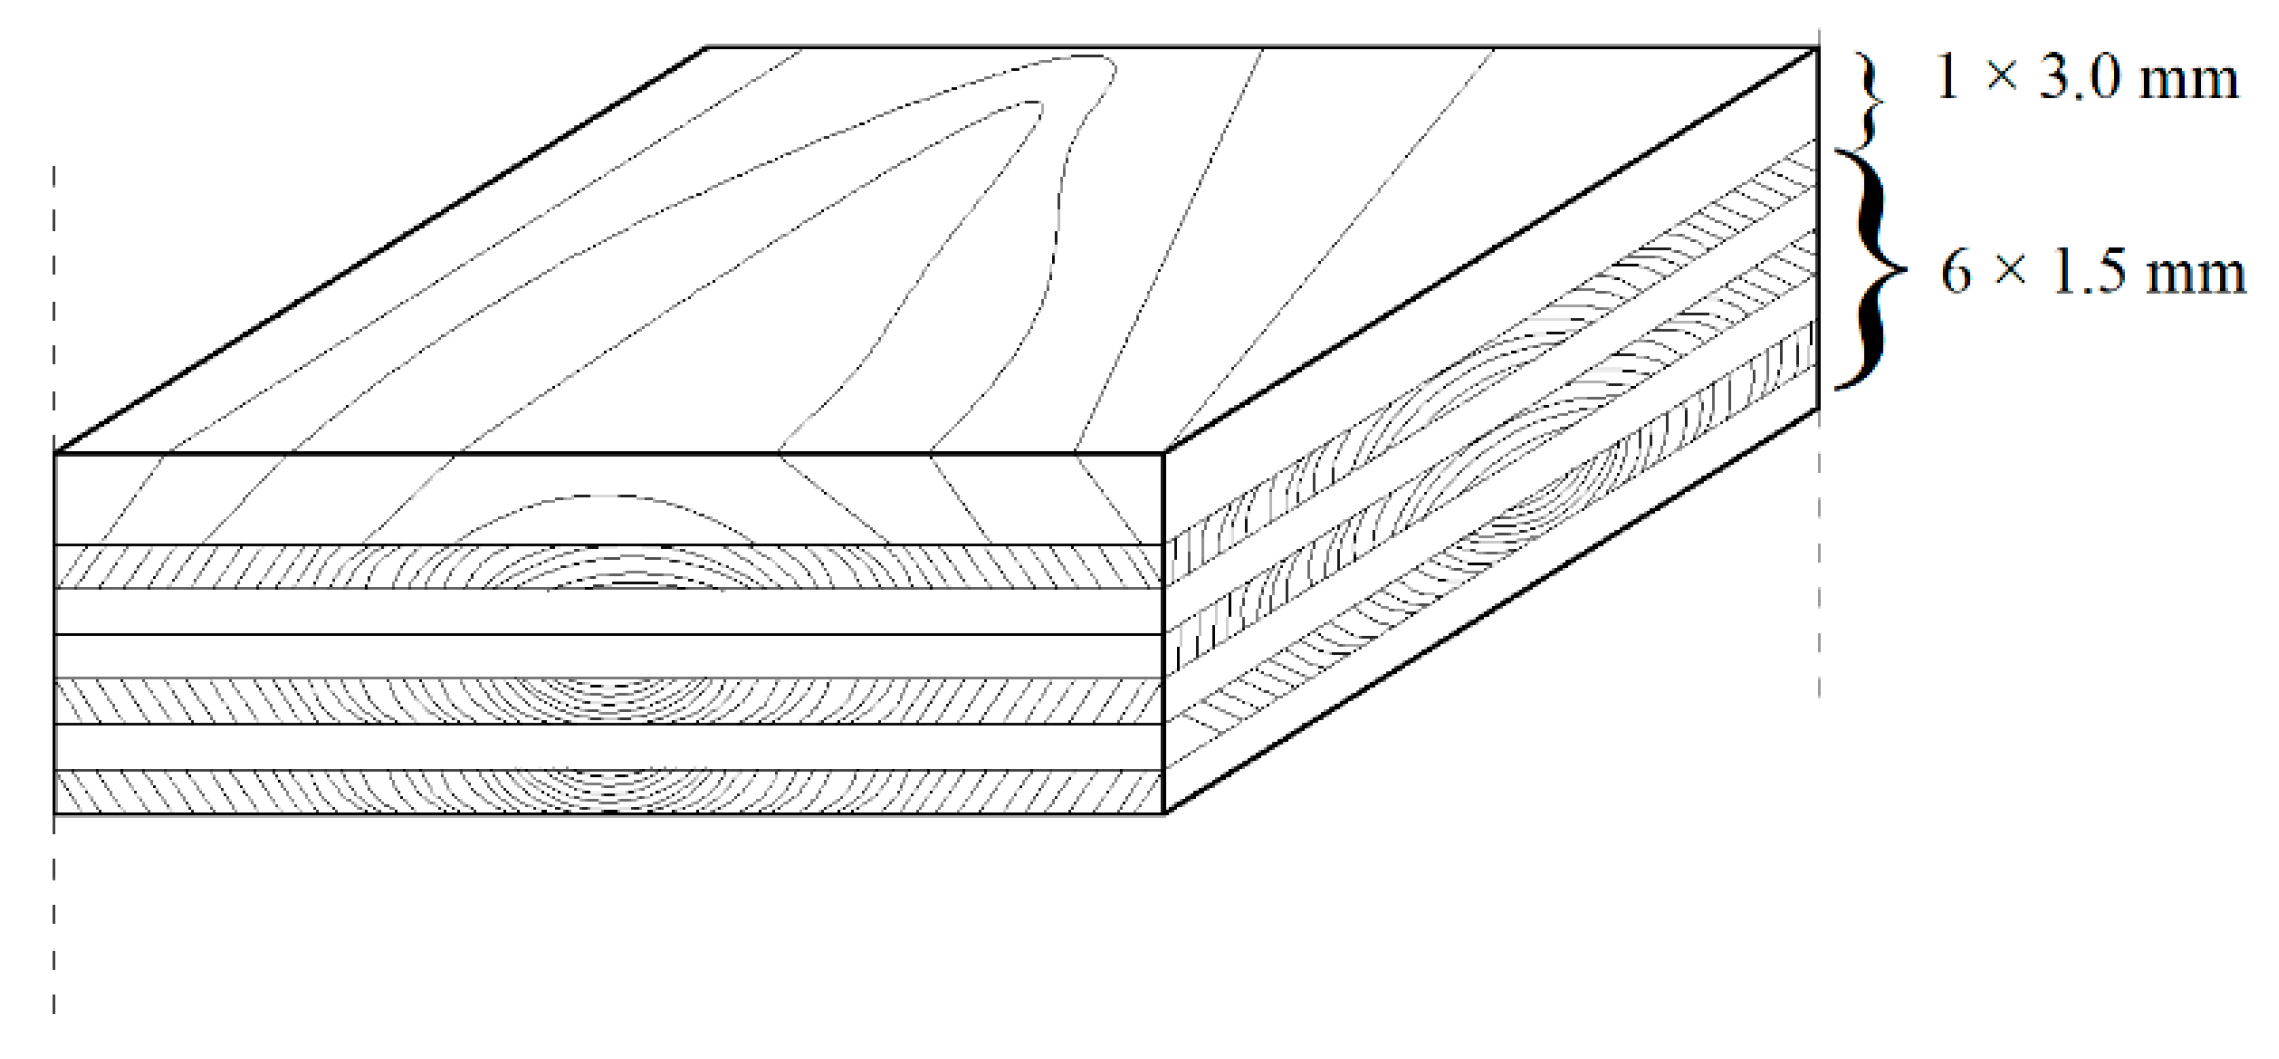
2.1. Experimental Materials and Samples

The structure of the layered composite panel material consists of two basic elements, namely the face part as the top layer and the base part as the substructure, and the composite layers are joined by an adhesive.
The material used for the face layer was made of oak slats (Quercus robur L.) of high-quality class with a thickness of 3 mm ± 0.2 mm. Figure 1 shows oak staves supplied by the Barlinek Group enterprise, used for the facing layer of the layered floor as a solid surface material. The Barlinek Group is one of the world’s leading manufacturers of layered wood floors, with potential production of 12 M m² per annum. Additional to the Barlinek floorboard, the group also produces certified flooring for sporting facilities and skirting boards [25].
The base layer was made of Scots pine veneers (Pinus sylvestris L.) that were available in the raw material warehouse at enterprise premises, obtained by the rotary cutting method, of various quality classes, cut circumferentially, 1.5 mm thick, glued in a cross pattern in six layers plywood, as shown in Table 1.
The quality of the pine wood veneer has been divided into 4 quality classes (Table 1) in accordance with standard EN 1927-2:2008 [26]. As the base material was made of pine veneers in 4 different quality classes, the quality of the material was assessed visually (brokerage). Such an assessment is burdened with an error resulting from subjective analysis. The veneers marked A were of the highest quality class, the veneer leaves did not contain knots or other defects such as cracks. The veneers marked with the B and C symbols had the features of middle quality class. There were a few small knots and small cracks. The number and size of knots and cracks increased. The veneers marked D contained a lot of knots (including broken and falling out ones) and cracks, which made it possible to recognize that they were veneers of low-quality parameters.
Urea-formaldehyde adhesive (Silekol® M-2, Pfleiderer Group SA, International) was used to bond the composite elements. The pressing parameters were set at (the process parameters were recommended by the plywood manufacturer the Drewspan company in Poland, operating on the market since 1995 [27], and are used in its production):
  • Adhesive application 200 g/m2,
  • Temperature 120 °C,
  • Time 60 s (the resin used contained the addition of 10% of a hardener),
  • Pressure 1.2 MPa.
Ten samples of each quality class were prepared for the individual MOE and MOR tests (except for the fatigue test). After gluing, the composites were air-conditioned in a room with temperature of 22 °C and 50% air humidity. The air conditioning lasted 28 days.
In the next stages of the research, the samples were seasoned in a climatic chamber for 28 days in two types of conditions: 10% and 80% air humidity and 22 °C. The composite samples in the chamber were placed on spacers. At this stage of the research, changes were observed that may occur in the composites under changing weather conditions. The test results were compared with composites seasoned under normal conditions. After the air-conditioning period, composite samples were first tested for structure density on the cross-section. Determining the value of humidity results from our data and official information it was verified that in warm summers (which are most often now), it usually reaches about 50%, but it can reach 80–90% in our European climate, and in winter it drops to as much as 20% in the outside air [28].
After the seasoning period, the glued composites were cut to the dimensions of 175 × 340 mm, thus aligning the edges of the samples after gluing. In the next stage, the surface of the samples was examined. The geometry of the composite surface was tested with a mechanical plotter from the facing side of the composites. The accuracy of the measurement was 0.1 mm. Figure 2 shows the flatness measurement on a CNC (Computer Numerical Control) plotter and a diagram of the sensor path of the machine examining the sample’s geometry. The sample was based on the base points on the plotter from the framework side. Three fixed base points and one adjustable point together formed a virtual reference plane. The fourth adjustable point allowed to adjust the plane to the curvature of the tested composite sample. The differences in the flatness of the samples did not exceed ±3 mm. Construction of the CNC plotter was was developed by the employees of the Institute and ZEPWN company (Poland). ZEPWN has completely built the device [29].
The next step in the verification of the tested composites was to check the density profile. A total of 12 composite samples (50 × 50 mm) were used for the tests, three samples for each of the four quality classes. The measurement of the density profile of the floor composite was performed with the GRECON (Hannoversche Strasse 58, Alfred/Hannover, Germany) device. The GRECON profiler uses X-rays to measure the structure density on the cross-section with sampling every 0.02 mm and the speed of 0.05 mm/s. Figure 3 shows example charts obtained during the examination of the density profile. The research showed the comparability of the density profiles for the samples from the same group.
The test of the modulus of elasticity was carried out on the universal testing machine TiraTest 2300 produced in Germany (TIRA GMBH). Since the device had outdated automation, the drive and control of the electromechanical machine had to be replaced (ZEPWN, Kollataja 8, 05-270 Marki, Poland). In 2014, the machine gained the status of a CNC machine with many possibilities [29].

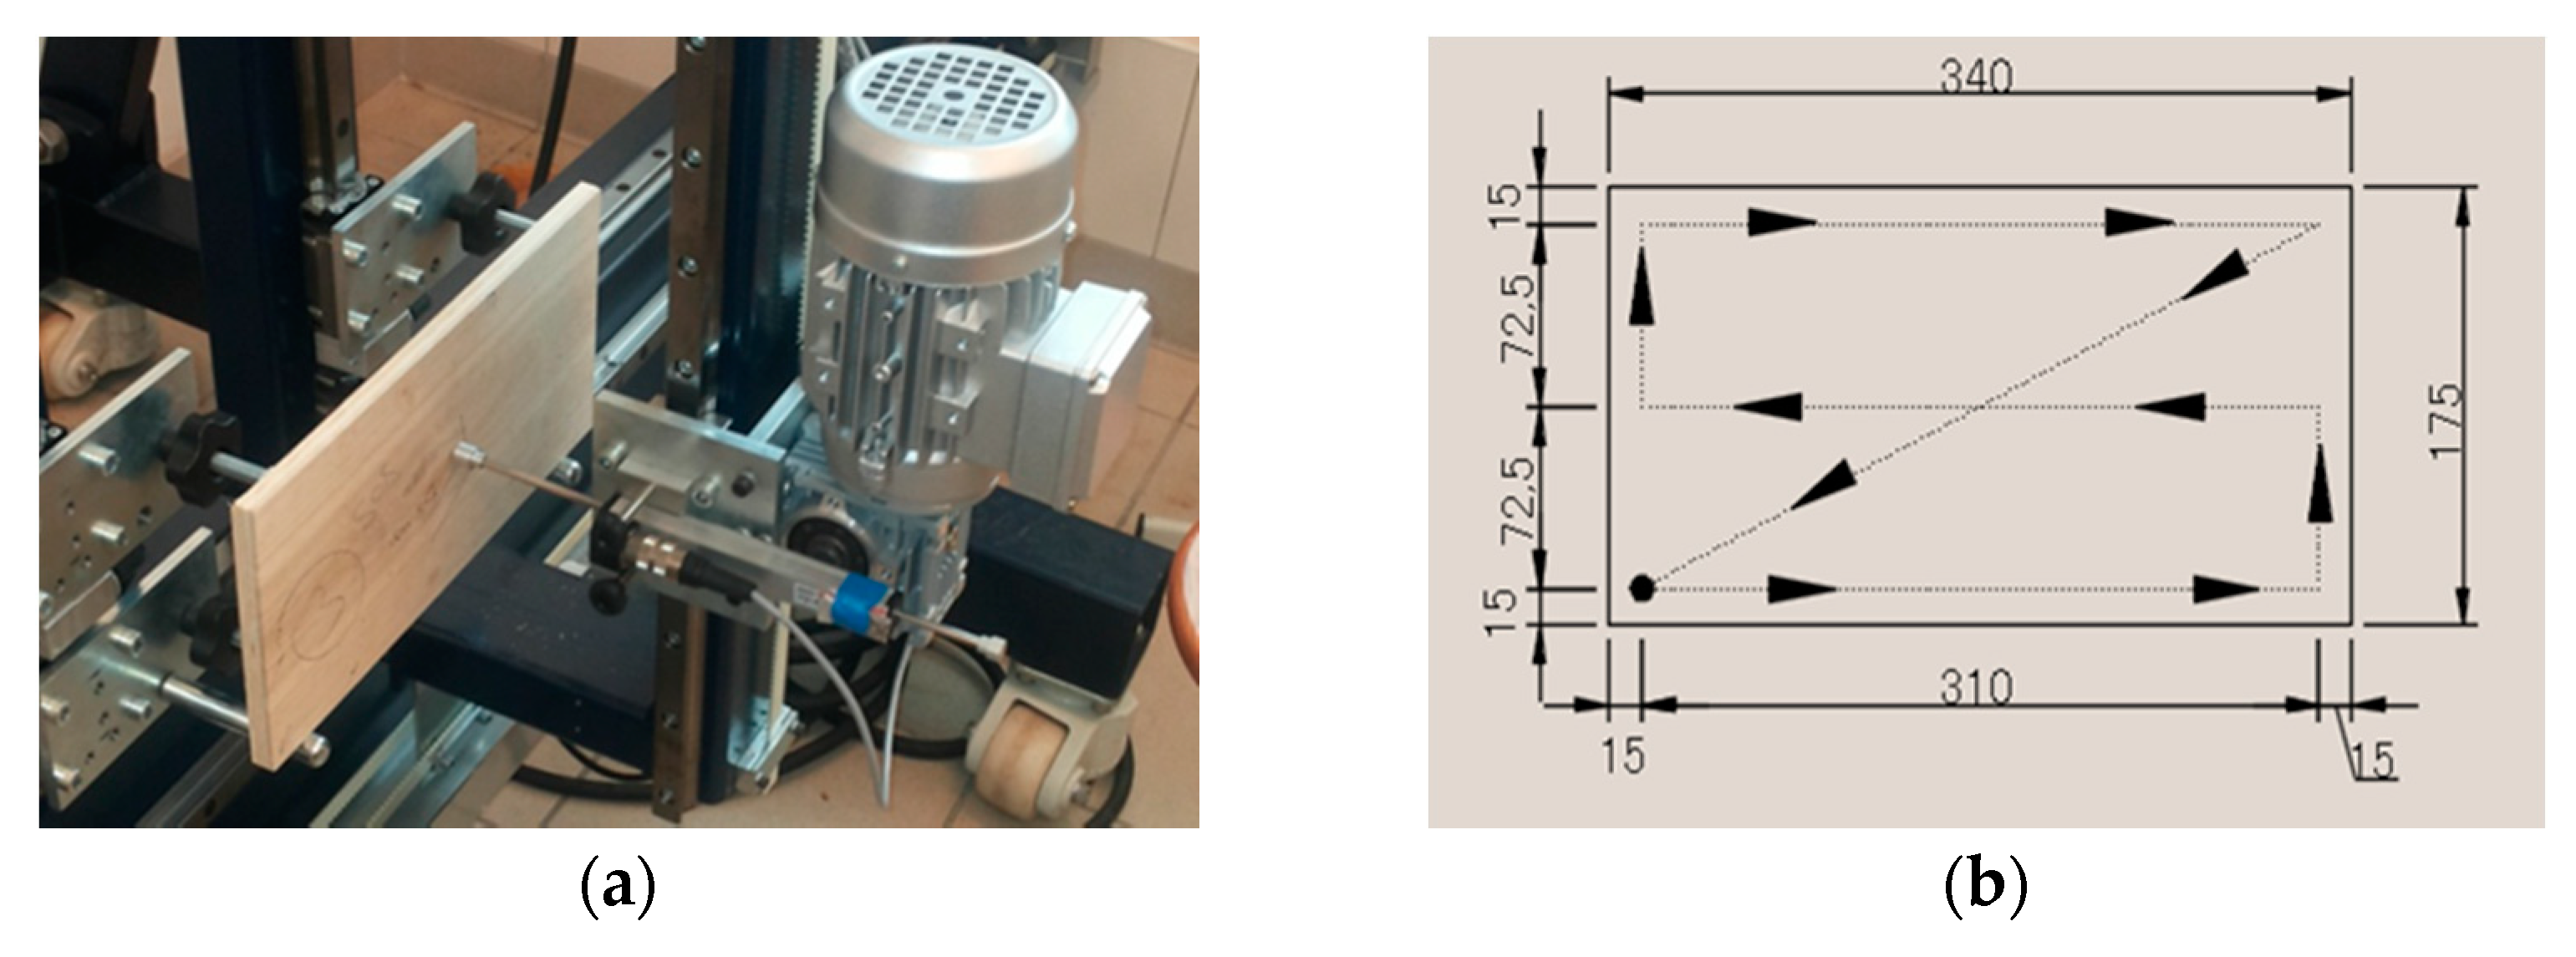
2.2. Experimental Methods

2.2.1. Tests of Static Bending

The test of the modulus of elasticity was carried out in a three-point test based on the EN 310:1993 [30]. The scheme of testing the modulus of elasticity in the three-point test is presented in Figure 4.
The samples were placed on supports with a spacing of 310 mm and were subjected to a force of 2 kN. The modulus of elasticity in static bending was calculated on the basis of the formula:
E m = L 1 3 ( F 2 F 1 ) 4 b t 3 ( a 2 a 1 )  
where: Em [MPa]—modulus of elasticity, L [mm]—distance between support centres, F2 [N]—40% of maximal force, F1 [N]—10% of maximal force, b [mm]—sample width, t [mm]—sample thickness, a2a1 [mm]—deflection arrow increment measured in the middle of the sample length (corresponding to F2F1).
The static bending strength was determined from the formula:
f g = 3 F m a x L 1 2 b t 2
where: fg [N/mm2]—static bending strength, Fmax [N]—maximal force, L1 [mm]—distance between support centres, b [mm]—sample width, t [mm]—sample thickness.

2.2.2. Tests of Dynamic Bending

The study of dynamic bending properties was aimed at checking the tested composites for their usability in extreme load conditions, especially dynamic ones, such as flooring in sports facilities. The test consisted of applying a force to the sample at a maximum speed of lifting and lowering of the traverse of the machine, i.e., 9 mm/s. The measuring sensor placed under the sample examined the deflection arrow of the tested composite under the influence of the given force (Figure 3). All prepared composite samples were tested. The measurement was carried out in accordance with the principle of Hoock’s law [31].

2.2.3. Tests of Fatigue in Bending

One composite sample from each of the four quality classes was used for fatigue testing. The material was tested by applying dynamic unloading to the sample in the amount of 50 cycles with the traverse operating speed set at 9 mm/s. A total of four composite samples were tested. The results were analysed on the 1st and every 10th cycle of the fatigue test. Variable loads cause wood fatigue, which results in wood failure at stresses lower than immediate strength.

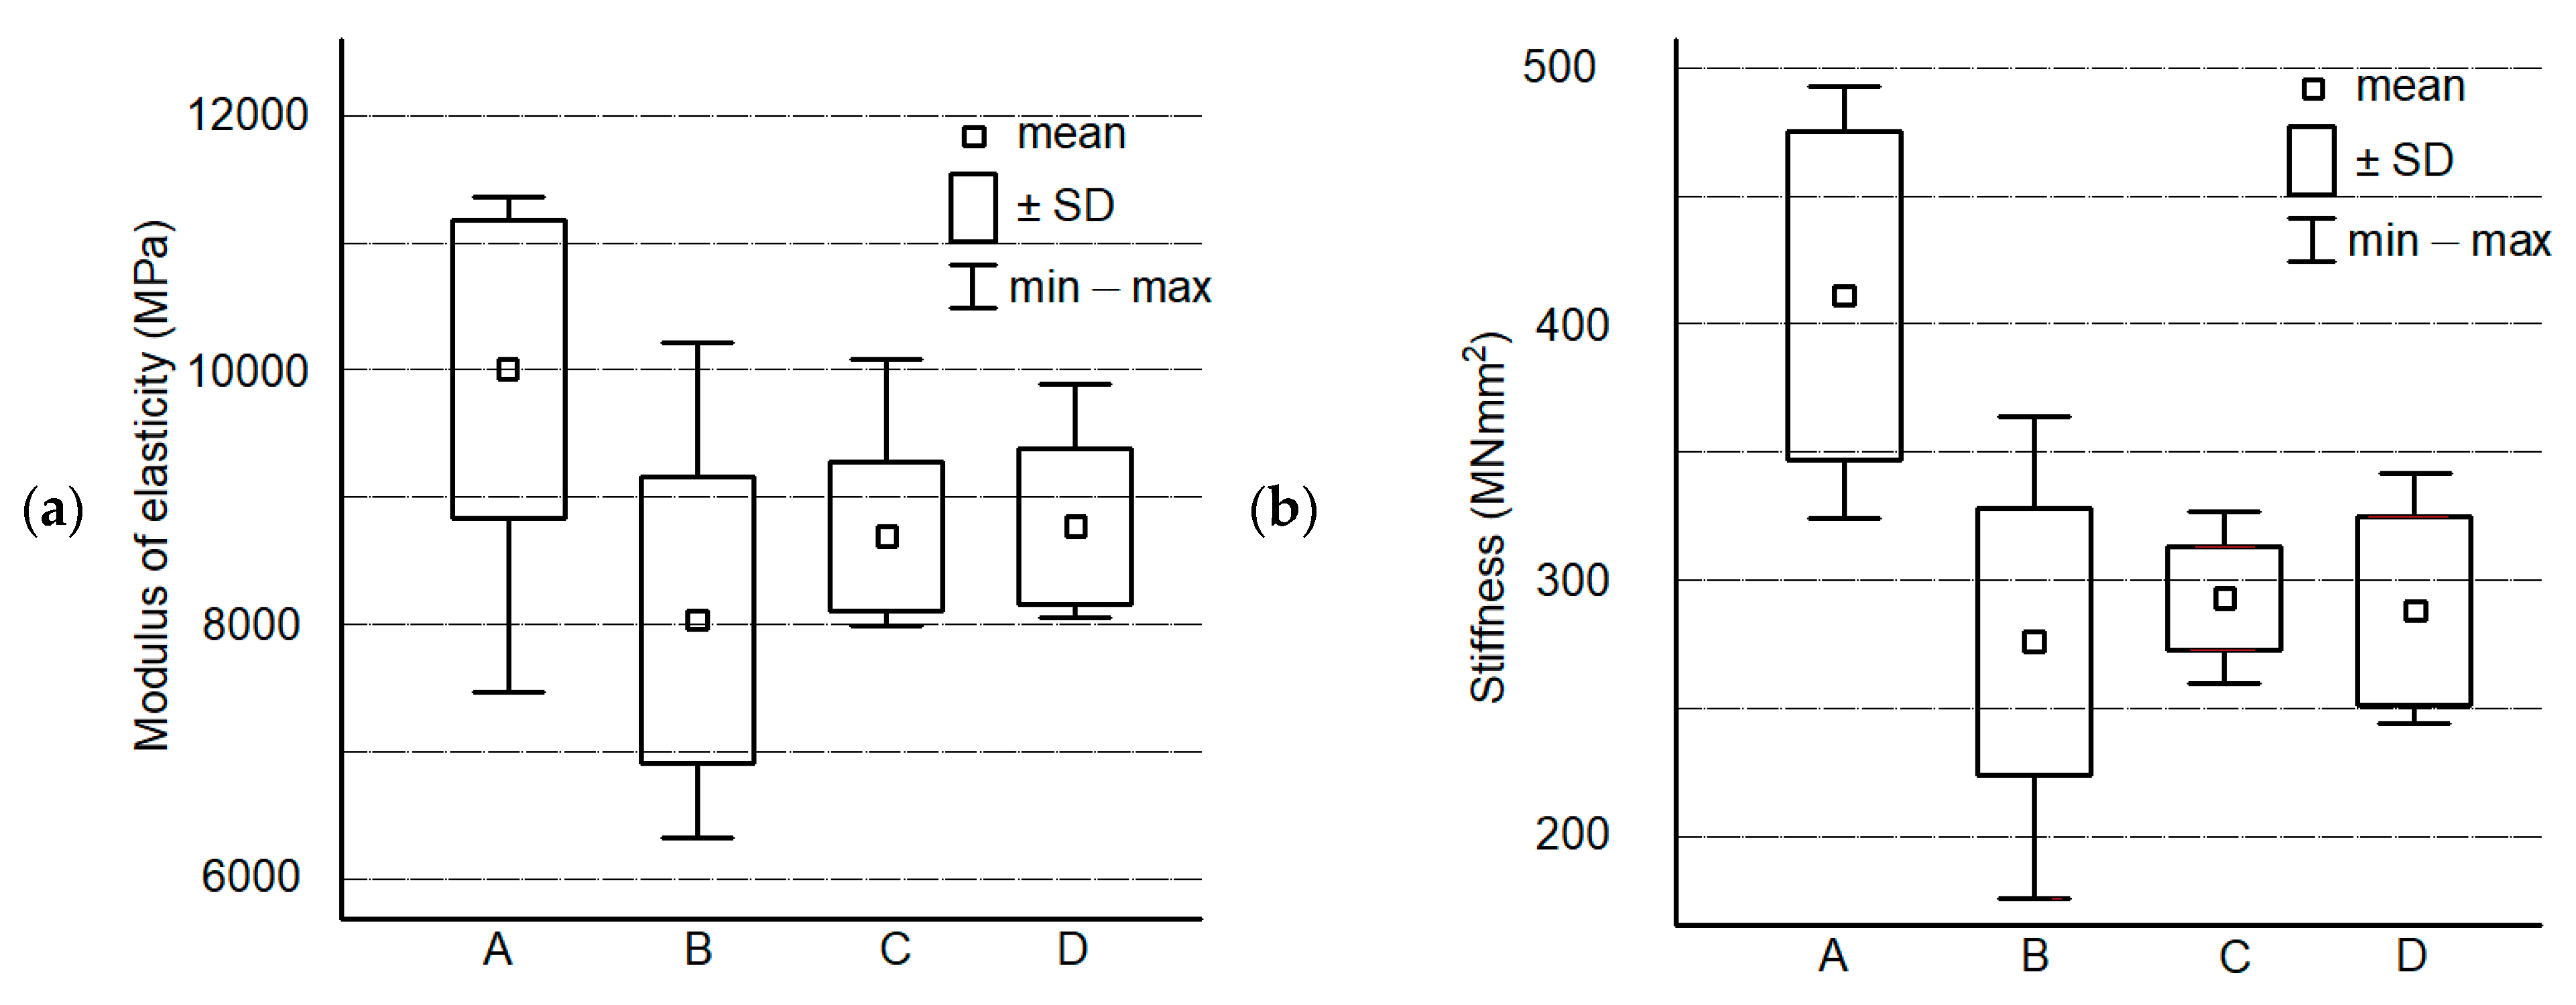
2.2.4. Tests of Stiffness

Stiffness is the ability of an element, joint or structured, to resist deformation due to an external load. Material stiffness depends on its shape, elastic properties, type of loads and boundary conditions. One of the methods of determining the dynamic stiffness is discussed in the ISO 9052-1 standard [32]. However, this standard presents a different methodology and loads. Therefore, in order to be able to compare the results, the stiffness of composites under static and dynamic loading conditions was determined on the basis of the formula:
k = E m * b * t 3 12
where: k [MNmm2]—rigidity, Em [MPa]—modulus of elasticity, b [mm]—sample width, t [mm]—sample thickness.

3. Results

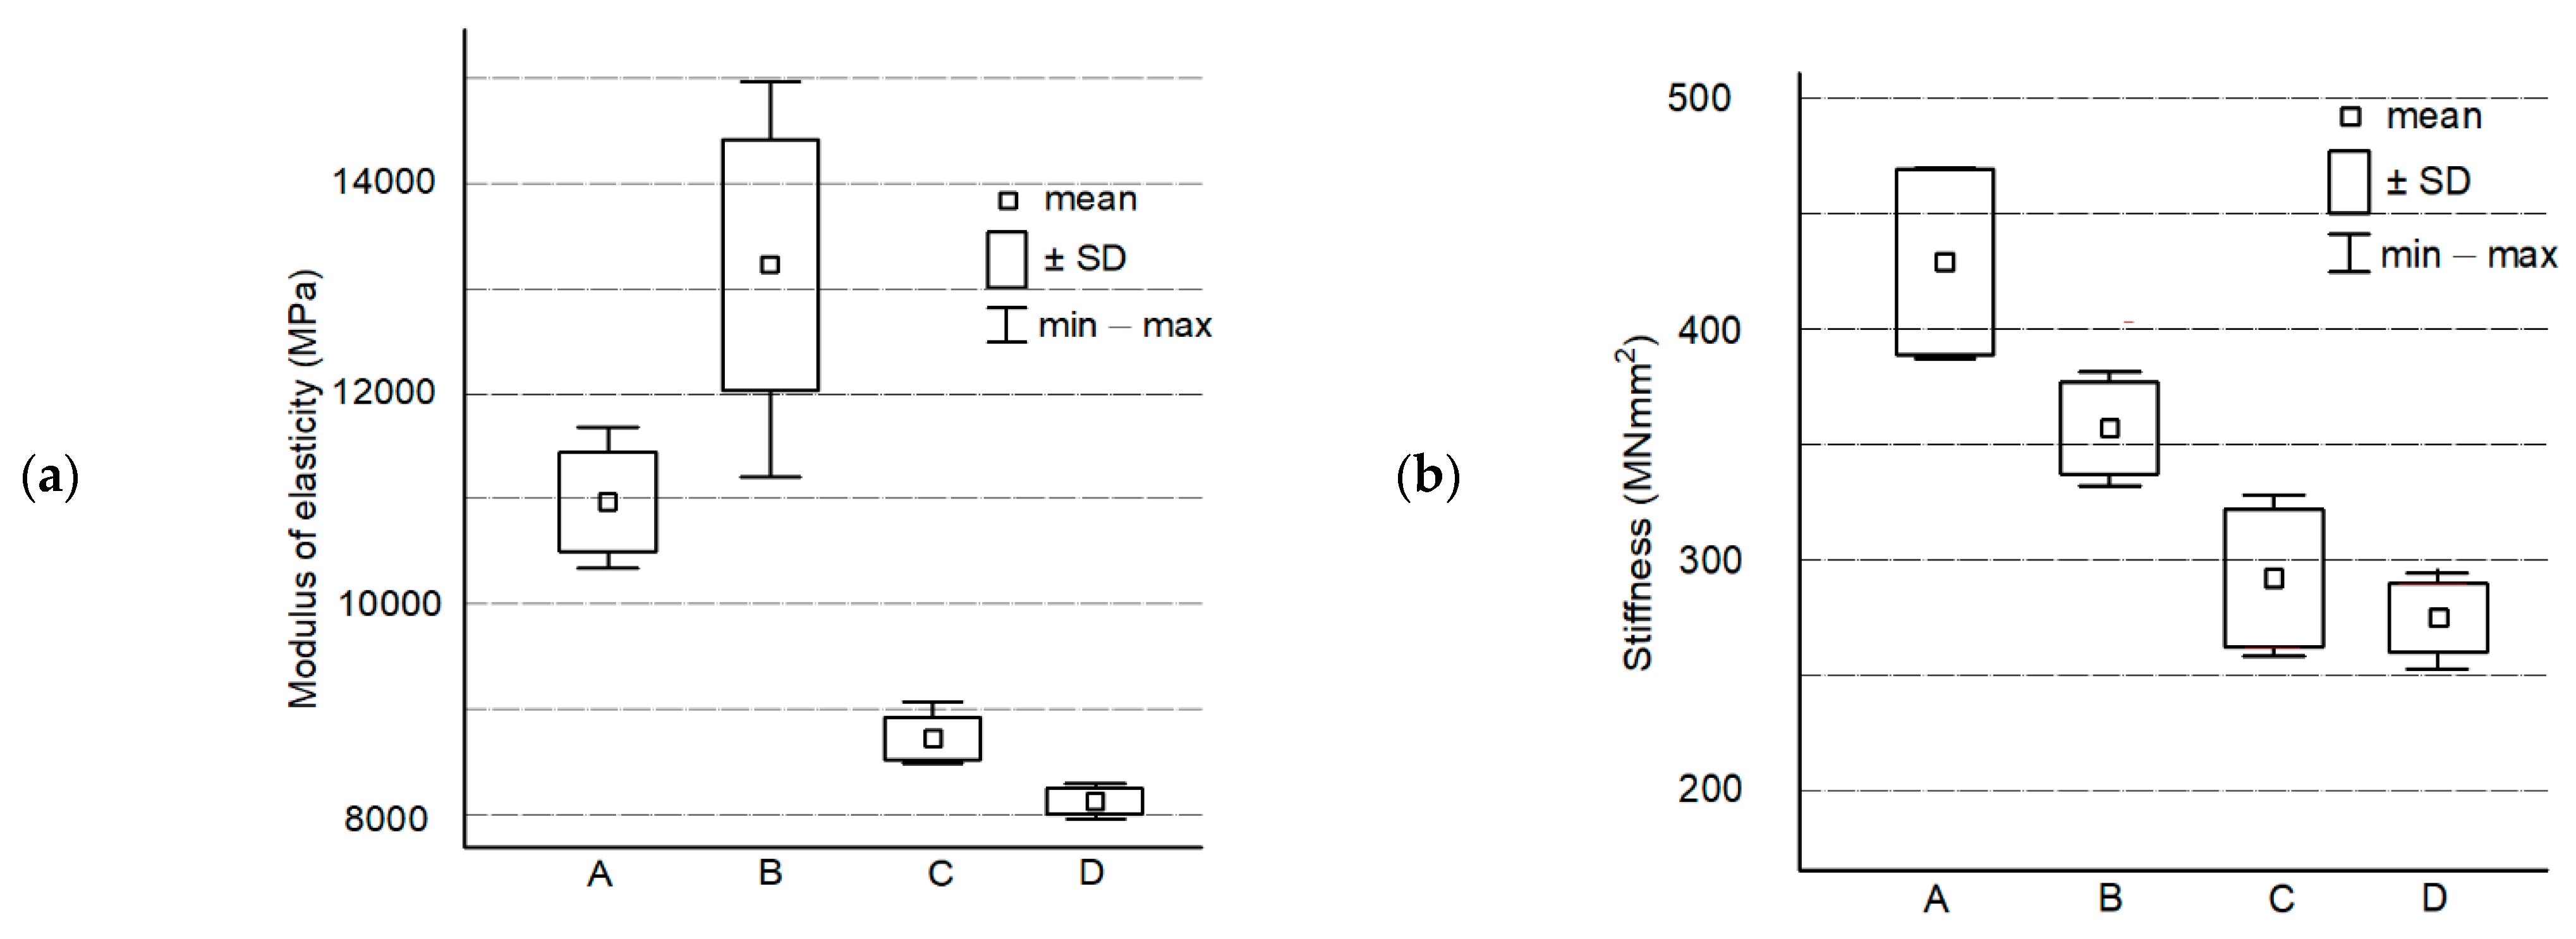
3.1. Test of Static Bending

When analysing the mean value of the elasticity modulus (the samples of 22 °C and 50% air humidity), it was found that there is a large scattering of results for all tested samples (Figure 5a). Peripheral cutting as a chipless cutting process causes cracking of the veneers on the knife side. The highest value in relation to all batches was achieved by samples with the A symbol, which were made of highest quality veneers, which is no surprise. The base layer material obtained from low-quality wood (C and D class), which additionally has technological defects in its production, shows values compared to class B. Composites with symbols C and D achieved a similar value of the modulus of elasticity. Samples with the symbol B had the lowest results in the study of the modulus of elasticity, despite the fact that they were made of higher quality veneers than samples C and D. This is due to the subjective, visual assessment of the quality of the veneers.
The stiffness of the tested samples is comparable for the groups with the symbol B, C and D presented in Figure 5b. The dominant group were A samples, which is obvious as they were made of higher quality veneers than the rest glued in a cross pattern. The other quality classes show comparable results.

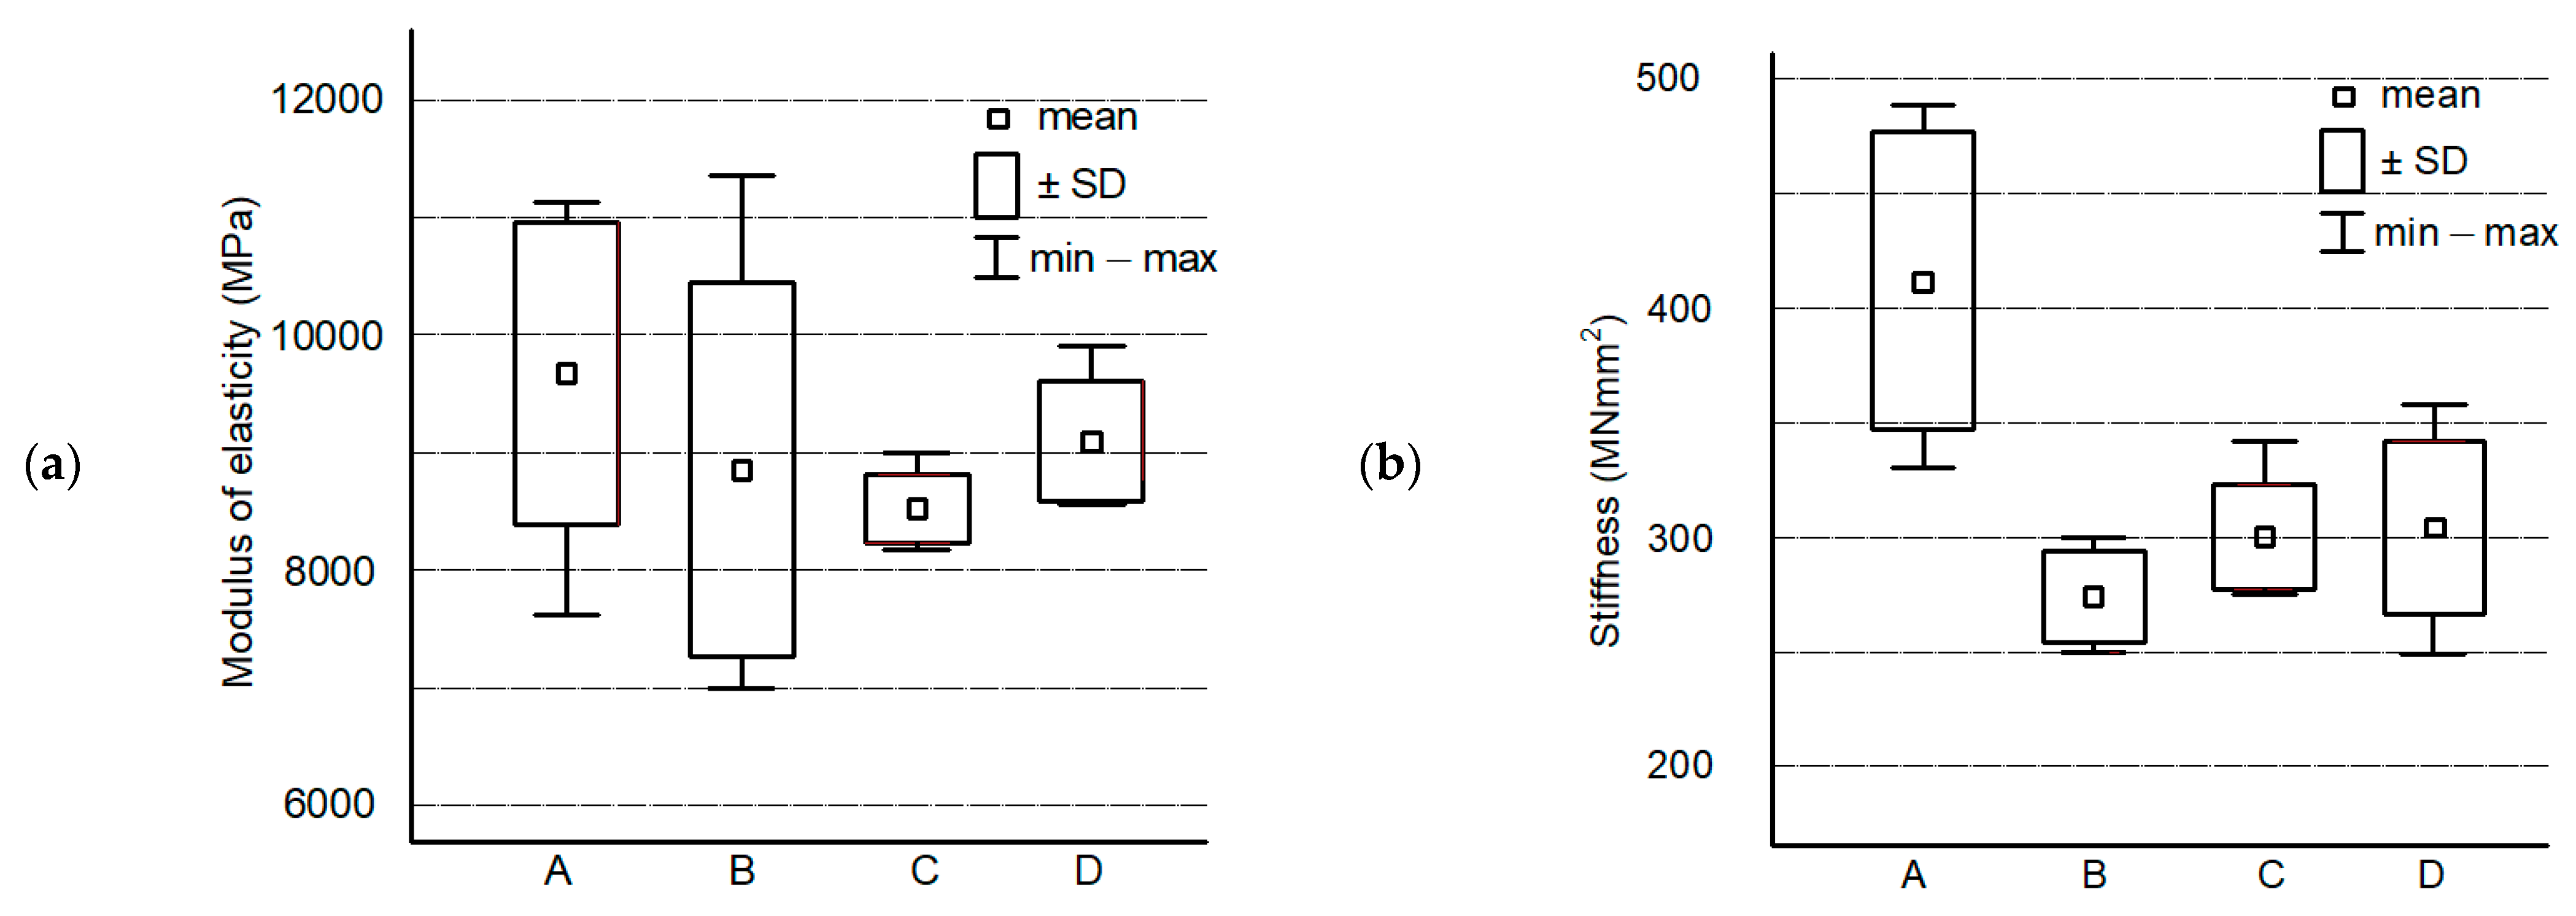
3.2. Test of Dynamic Bending

A summary of the results of the modulus of elasticity in dynamic bending is presented in Figure 6a. When analysing the results of the modulus of elasticity, it was found that all mean values for test samples B, C, and D showed comparable results. However, it should be remembered that the base layer was made of very low-quality peripherally cut pine wood of D class.
The graph in Figure 6b shows the values of dynamic bending stiffness.

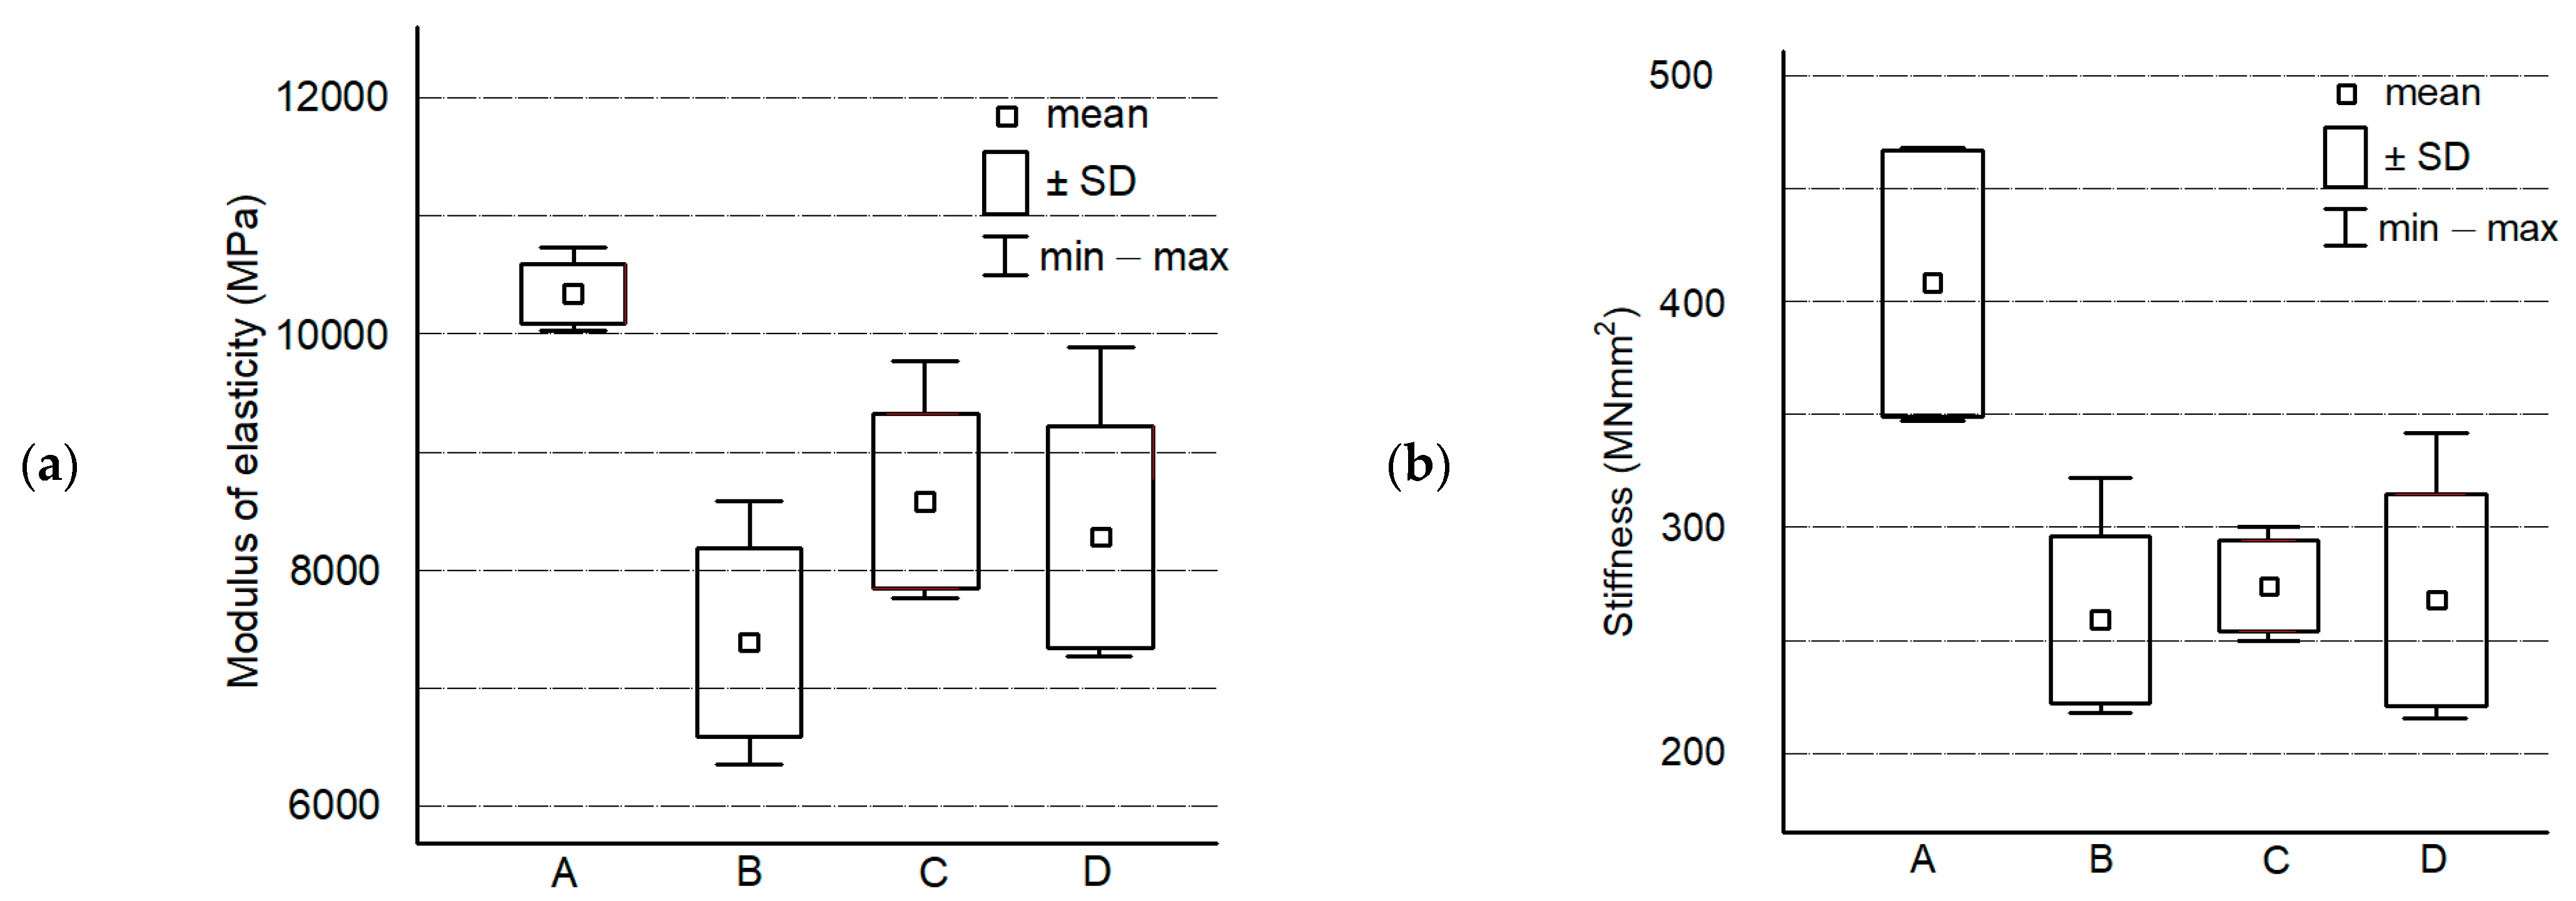
3.3. Test of Fatigue in Bending

Fatigue tests often bring surprising results. Material testing may show completely different property results from other types of testing. The value of the modulus of elasticity in such tests can be especially surprising. Figure 7a shows the graph of the dynamic elasticity modulus in the fatigue test of average scores up to 50 cycles. The studies were of an illustrative nature and were performed on random samples; however, the obtained values are representative.
The results of comparing the stiffness in the fatigue test for individual test cycles are shown in Figure 7b. The results show that the stiffness of composites of C and D material quality remain at a similar level. The results obtained for stiffness are more ordered than those obtained for the modulus of elasticity. This is due to the definition of both parameters.

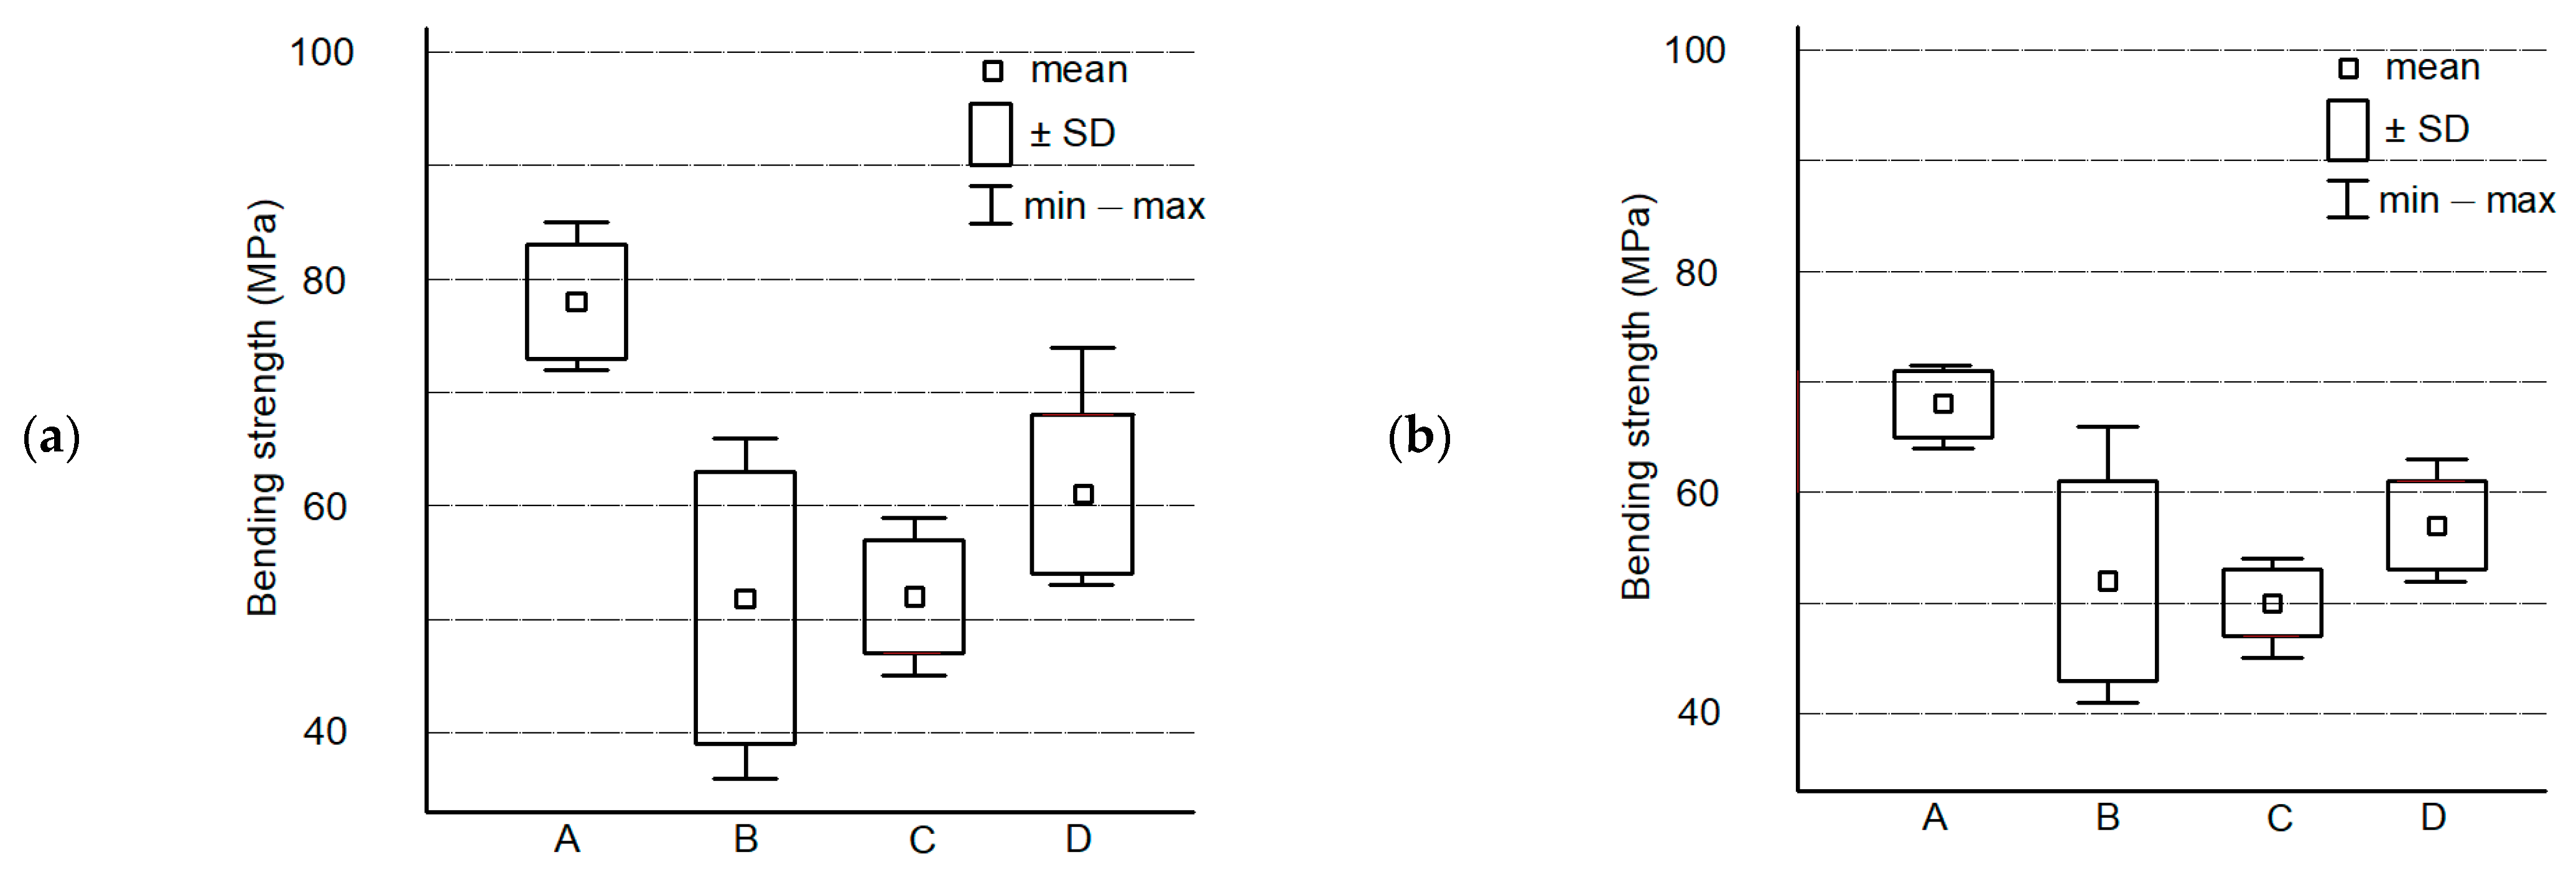
3.4. Tests of Static Bending Strength of Air-Conditioned Composites

Figure 8a shows a comparison of the results of the elasticity modulus of air-conditioned composites in dry conditions (the samples of 22 °C and 10% air humidity). The group of samples with the symbol A obtained the highest mean value. The remaining samples analysed obtained similar results.
The results of comparing the stiffness in the static bending strength of air-conditioned composite test for individual test cycles are shown in Figure 8b. The results show that the stiffness of composites remains at a similar level, irrespective of the sequence of cycle. The results of the research are very repetitive. Regardless of the lower quality classes of veneers, the values of the test results are comparable. Of course, this does not apply to the highest quality veneers.
The Figure 9a shows a comparison of the results of the modulus of elasticity of air-conditioned composites under humid conditions (the samples of 22 °C and 80% air humidity). The group of samples with the symbol A obtained the highest mean value. The results of the rest of the quality classes are similar.
The results of comparing the stiffness in the fatigue test for individual test cycles are shown in Figure 9b. The results show that the stiffness of composites remains at a similar level, regardless of the sequence of cycle.

3.5. The Static Bending Strength

Figure 10a shows the average values of the static bending strength of air-conditioned composites in dry conditions, i.e., T = 22 ° C, 10% air humidity. By analysing the results, it was found that sample A had significantly higher values than the other tested composites. Again, the other quality classes do not differ much.
Figure 10b shows the average values for the tested composites in humid conditions. When analysing the results of static bending strength, it can be seen that the highest value was shown in samples with the symbol A. As usual, the other quality classes do not differ much.

4. Conclusions

Four quality classes of Scots pine veneers (Pinus sylvestris L.) were taken into account: A, B, C, D, from the highest class—A without defects to the lowest class, and D characterized by a lot of knots (including broken and falling out ones) and cracks. The base layer of the floors was made of these wood quality classes. The value of the modulus of elasticity in elastic deformation, modulus of elasticity in the dynamic and fatigue tests, stiffness and static bending strength were investigated. The test results showed that, as expected, the samples made of class A had the highest values of the measured parameters (static bending strength, static and dynamic modulus of elasticity and stiffness). However, the values of the tested parameters for the remaining classes B, C, and D did not significantly differ. Hence, the question arises, why make a preliminary selection of materials if each material is valuable? This means that although the higher quality class of the veneers used for the production of the base of layered composites increases their mechanical properties, wood of any quality class can be used. Chip-cut lamellas can be replaced by chipless veneers, increasing material efficiency. Composites with a base in the form of cross-veneers (plywood like) are less susceptible to deformation compared to commercial composites with an inner layer in the form of arranged lamellas. In the industrial reality, there will be no material of one quality class. The quality grades will be mixed up. Therefore, the final product made of mixed quality classes will meet technical requirements. It is known that when testing natural materials, such as wood and its derivatives, the test results have a large variety of volumes. The presented research results indicate the direction and manner of using the whole wood as it is, because the tree and then the harvested wood is a living material, i.e., difficult to predict. Therefore, they should be used in the most rational manner possible. Of course, the future utilization of the floor is important. Any product may prove appropriate for a given purpose.

Author Contributions

P.B., I.B.-K. and P.M. designed the experiments; methodology, P.B. and I.B.-K.; software, I.B.-K.; validation, P.M., P.B. and I.B.-K.; formal analysis, P.M.; investigation, P.M.; resources, P.B.; data curation, P.M. and I.B.-K.; writing—original draft preparation, P.M.; writing—review and editing, P.B. and I.B.-K.; visualization, I.B.-K.; supervision, P.B.; project administration, P.B.; funding acquisition, P.B. All authors have read and agreed to the published version of the manuscript.

Funding

This research was funded by the National Centre for Research and Development and the Warsaw University of Life Sciences-SGGW, grant number No BIOSTRATEG2/298950/1/NCBR/2016.

Acknowledgments

The authors are grateful for the support of the National Centre for Research and Development, Poland, under “Environment, agriculture and forestry”–BIOSTRATEG strategic R&D program, agreement No BIOSTRATEG2/298950/1/NCBR/2016 (because entrepreneurs took part in the project, some of the information was confidential).

Conflicts of Interest

The authors declare no conflict of interest.

References

  1. Heräjärvi, H. Variation of basic density and Brinell hardness within mature Finnish Betula pendula and B. pubescens stems. Wood Fiber Sci. 2004, 36, 216–227. [Google Scholar]
  2. Holmberg, H. Influence of grain angle on Brinell hardness of Scots pine (Pinus sylvestris L.). Holz Roh-Und Werkst. 2000, 58, 91–95. [Google Scholar] [CrossRef]
  3. Wang, S.Y.; Wang, H.L. Effects of moisture content and specific gravity on static bending properties and hardness of six wood species. J. Wood Sci. 1999, 45, 127–133. [Google Scholar] [CrossRef]
  4. Boruszewski, P.J.; Borysiuk, P.; Mamiński, M.Ł.; Grześkiewicz, M. Gluability of thermally modified beech (Fagus silvatica L.) and birch (Betula pubescens Ehrh.) wood. Wood Mater. Sci. Eng. 2011, 6, 185–189. [Google Scholar] [CrossRef]
  5. Xiaoyan, Y.; Dandan, X.; Yan, S.; Yuran, G.; Jilong, F.; Xiaohan, D.; Zaixin, H.; Xiaoying, D.; Yufeng, D.; Yongfeng, L. Preparation of Wood-Based Panel Composites with Poplar Veneer as the Surface Layer Modified by In-Situ Polymerization of Active Monomers. Forests 2020, 11, 893. [Google Scholar] [CrossRef]
  6. Kozakiewicz, P.; Drożdżek, M.; Laskowska, A.; Grześkiewicz, M.; Bytner, O.; Radomski, A.; Zawadzki, J. Effects of thermal modification on selected physical properties of sapwood and heartwood of black poplar (Populus nigra L.). BioResources 2019, 14, 8391–8404. [Google Scholar]
  7. Latorraca De Figueiredo, J.V.; Texeira, D.E.; Batista, D.C. Overlay of Eucaluptus urophylla cemented-bonded particleboard for application as flooring panels. For. Prod. J. 2009, 59, 65–69. [Google Scholar]
  8. Amor, B.A.; Cluotier, A.; Beauregard, R. Determination of physical and mechanical properties of finishing papers used for wood-based composite products. Wood Fiber Sci. 2009, 41, 117–126. [Google Scholar]
  9. Makowski, A.; Noskowiak, A. Empirical verification of a digital model of a basket ball to assess elastic properties of sports floors. Ann. Wars. Univ. Life Sci. SGGW For. Wood Technol. 2016, 95, 227–230. [Google Scholar]
  10. LEE, C.-H.; Chung, M.-J.; Lin, C.-H.; Yang, T.-H. Effects of layered structure on the physical and mechanical properties of laminated moso bamboo (Phyllosachys eduilis) flooring. Constr. Build. Mater. 2012, 28, 31–35. [Google Scholar] [CrossRef]
  11. European Commission; Communication from the Commission to the European Parliament; The Council; The European Economic and Social Committee; The Committee of the Regions. Sustainable Europe Investment Plan. European Green Deal Investment Plan; European Commission: Brussels, Belgium, 2020; Available online: https://eur-lex.europa.eu/legal-content/EN/TXT/HTML/?uri=CELEX:52020DC0021&from=EN (accessed on 11 April 2021).
  12. European Commission; ANNEX to the Communication from the Commission to the European Parliament; The European Council; The Council; The European Economic and Social Committee; The Committee of the Regions. The European Green Deal; European Commission: Brussels, Belgium, 2019; Available online: https://ec.europa.eu/info/sites/default/files/european-green-deal-communication-annex-roadmap_en.pdf (accessed on 11 April 2021).
  13. European Commission. Circular Economy Action Plan. For a cleaner and more competitive Europe. In New_Circular_Economy_Action_Plan; European Commission: Brussels, Belgium, 2020; Available online: https://ec.europa.eu/environment/strategy/circular-economy-action-plan_en (accessed on 11 April 2021).
  14. Silva, V.U.; Nascimento, M.F.; Oliveira, P.R.; Panzera, T.H.; Rezende, M.O.; Silva, D.A.L.; Borges de Moura Aquino, V.; Lahr, F.A.R.; Christoforo, A.L. Circular vs. linear economy of building materials: A case study for particleboards made of recycled wood and biopolymer vs. conventional particleboards. Constr. Build. Mater. 2021, 285, 122906. [Google Scholar] [CrossRef]
  15. Luttenberger, L.R. Waste management challenges in transition to circular economy—Case of Croatia. J. Clean. Prod. 2020, 256, 120495. [Google Scholar] [CrossRef]
  16. International Advisory Council on Global Bioeconomy. Expending the sustainable bioeconomy—Vision and way forward. In Communique of the Global Bioeconomy Summit; International Advisory Council on Global Bioeconomy: Berlin, Germany, 2020. [Google Scholar]
  17. Kretschmann, D.E. Mechanical properties of wood. In Wood Handbook—Wood as an Engineering Material, Centennial ed.; Ross, R.J., Ed.; U.S. Department of Agriculture, Forest Service, Forest Products Laboratory: Madison, WI, USA, 2010; pp. 100–145. [Google Scholar]
  18. Phillips, G.E.; Bodig, J.; Goodman, J.R. Flow grain analogy. Wood Sci. 1981, 14, 55–64. [Google Scholar]
  19. Guindos, P.; Guaita, M. A three-dimensional wood material model to simulate the behaviour of wood with any type of knot at the macro-scale. Wood Sci. Technol. 2013, 47, 585–599. [Google Scholar] [CrossRef]
  20. Schwab, E. Die Härte von Laubhölzern für die Parkettherstellung [The hardness of hardwoods for parquet production]. Holz Als Roh-Und Werkst. 1990, 48, 47–51. (In German) [Google Scholar] [CrossRef]
  21. Hirata, S.; Ohta, M.; Honma, Y. Hardness distribution on wood surface. J. Wood Sci. 2001, 47, 1–7. [Google Scholar] [CrossRef]
  22. Borysiuk, P.; Burawska-Kupniewska, I.; Auriga, R.; Kowaluk, G.; Kozakiewicz, P.; Zbiec, M. Influence of layered structure of composite timber floor boards on their hardness. Drv. Ind. 2019, 70, 399–406. [Google Scholar] [CrossRef]
  23. Doyle, J.; Walker, J.C.F. Indentation hardness of wood. Wood Fiber Sci. 1984, 17, 369–376. [Google Scholar]
  24. Byczek, M.; Borysiuk, P. Impact of the quality on the properties of the LVL. Ann. Wars. Univ. Life Sci. SGGW For. Wood Technol. 2017, 99, 132–142. [Google Scholar]
  25. Barlinek. Available online: https://www.barlinek.co.uk/ (accessed on 11 April 2021).
  26. iTeh Standards. EN 1927-2:2008. Qualitative Classification of Softwood Round Timber—Part 2: Pines; iTeh Standards: Toronto, ON, Canada, 2008. [Google Scholar]
  27. Drewspan. Available online: https://www.drewspan.com.pl/index/index/lang/en (accessed on 11 April 2021).
  28. Jaka Jest Optymalna Temperatura i Wilgotność w Domu? Available online: https://goodair.pl/blog/temperatura-i-wilgotnosc-w-domu (accessed on 11 April 2021).
  29. Modernizacja Maszyny Wytrzymałościowej. Available online: http://cms.zepwn.com.pl/Karta_maszyny_wytrzymalosciowe_2016_02_22.pdf (accessed on 11 April 2021).
  30. BSI. EN 310: 1993. Wood-Based Panels—Determination of Modulus of Elasticity in Bending and of Bending Strength; BSI: London, UK, 1993. [Google Scholar]
  31. Kokociński, W. Wood-Measurements of Physical and Mechanical Properties; PRODRUK: Poznań, Poland, 2004; p. 201. ISBN 83-88518-75-5. (In Polish) [Google Scholar]
  32. ISO. ISO 9052-1. Determination of Dynamic Stiffness. Part 1—Materials Used Under Floating Floors in Dwellings; ISO: Geneva, Switzerland, 1989. [Google Scholar]
Figure 1. Structure of the composite panel.
Forests 12 01017 g001
Figure 2. Flatness measurement: (a) CNC plotter; (b) Diagram of the sensor path.
Forests 12 01017 g002
Figure 3. Density profile of 3 samples of quality C (C-1, C-2, C-3—number of the sample) after air conditioning under conditions of 22 °C and 50% air humidity.
Forests 12 01017 g003
Figure 4. Arrangement of the bending device: l1—310 mm, l2—340 mm.
Forests 12 01017 g004
Figure 5. Results of static bending after air conditioning under conditions of 22 °C and 50% air humidity: (a) MOE; (b) stiffness.
Forests 12 01017 g005
Figure 6. Results of dynamic bending after air conditioning under conditions of 22 °C and 50% air humidity: (a) MOE; (b) stiffness.
Forests 12 01017 g006
Figure 7. Results of fatigue in bending after air conditioning under conditions of 22 °C and 50% air humidity: (a) MOE; (b) stiffness.
Forests 12 01017 g007
Figure 8. Results of fatigue in bending after air conditioning under conditions of 22 °C and 10% air humidity: (a) MOE; (b) stiffness.
Forests 12 01017 g008
Figure 9. Results of fatigue in bending after air conditioning under conditions of 22 °C and 80% air humidity: (a) MOE; (b) stiffness.
Forests 12 01017 g009
Figure 10. Results of static bending strength at T = 22 °C: (a) MC = 10%; (b) MC = 80%.
Forests 12 01017 g010
Table 1. Layout of individual layers.
LayerWood SpeciesNumber of ElementsQuality Class
ABCD
Thickness (mm)
FaceOak13.0 3.0 3.0 3.0
BasePine61.5 1.5 1.5 1.5
Publisher’s Note: MDPI stays neutral with regard to jurisdictional claims in published maps and institutional affiliations.

