Article

Allometry and Post-Drought Growth Resilience of Pedunculate Oak (Quercus robur L.) Varieties

Institute of Lowland Forestry and Environment, University of Novi Sad, Antona Čehova 13d, 21 000 Novi Sad, Serbia
*
Author to whom correspondence should be addressed.
Forests 2021, 12(7), 930; https://doi.org/10.3390/f12070930
Submission received: 11 June 2021 / Revised: 12 July 2021 / Accepted: 13 July 2021 / Published: 16 July 2021
(This article belongs to the Special Issue Radial-Growth and Wood Anatomical Responses to Climate Change)

Abstract

:
This paper presents an analysis of the radial growth, tree dimensions, and allometry of three phenological pedunculate oak (Quercus robur L.; QURO) varieties (early (E-QURO), typical (T-QURO), and late (L-QURO)), from a common garden experiment. We focused on the resistance and resilience of each variety to drought events, which occurred in 2012 and 2017, as well as their recovery potential during juvenile and mature growth phases, with the goal of clarifying how QURO drought sensitivity is influenced by tree phenology and growth stage. Our results indicate that E-QURO is more drought resistant, while T-QURO and L-QURO exhibit greater recovery potential after a drought event. Hence, typical and late QURO varieties are better prepared to withstand climate change. We also noted differences in the physical dimensions and the allometry of the studied QURO varieties. On average, 21-year-old QURO specimens from the analyzed stand are 9.35 m tall, have a crown width (CW) of 8.05 m, and a diameter at breast height (DBH) of 23.71 cm. Although T-QURO varieties had the greatest DBH and CW, they were shorter than E- and L-QURO, which are similar in height. T-QURO is also shorter relative to DBH, while L-QURO has a wider crown relative to tree height (TH). Intra-variety variations are higher than variations among half-sib (open-pollinated) families of each variety. Moreover, the adopted regression model provided a better fit to the CW/DBH ratio than to TH/DBH and CW/TH.

1. Introduction

The selection of tree specimens with traits appropriate to the local environment is an important aspect of “climate-smart” forest management [1,2,3,4]. Due to its high intra-species and intra-provenance variations [5], pedunculate oak (Quercus robur L.; QURO) provides a valuable gene pool for the selection of superior, climate-resistant genetic material. In European-scale provenance trials, QURO radial growth performances showed a high level of heredity [5]. Furthermore, phenological varieties in a common garden experiment kept the phenological dynamics of the mother tree, with more than a month’s difference between the leafing and flowering phenological phases [6] of the early and late varieties. Empirical evidence further indicates that wood anatomical characteristics are inherited from mother trees [7] and influence the water use efficiency (WUE) [8], which is crucial for tree fitness. These phenomena provide a sustainability in heredity of superior traits across an appropriately managed QURO forest gene pool.
QURO radial growth variations are also affected by climate conditions [9,10] and site characteristics [11,12]. Hence, intra-site comparisons can provide valuable evidence regarding historical environmental conditions. Recent drought events (21st century) have caused dieback in most European oak forests, which are also adversely affected by pest attacks [13,14]. As QURO is highly water-sensitive, both above-ground (e.g., precipitation and snow) and below-ground (underground water level and soil moisture) water sources equally affect its radial increment and sensitivity to drought conditions [12].
Ecologically and economically, QURO is one of the most important oak species in European [15] and Serbian forests [16]. However, it has been adversely affected by intensive changes in climate in the last two decades [5,17]. According to EUFORGEN [18], QURO is the second most widespread oak species in European forests, following Quercus petrea ((Mattuschka) Liebl.). QURO exhibits significant variations in various traits across its distribution range. For example, four phenologically different varieties [6] and more than 30 varieties that differ in morpho-anatomical characteristics [19] were isolated from two provenances growing on a 32,400 ha plot in Serbia [16].
QURO also exhibits significant phenological diversity within its distribution range across Europe [20], with the same phenological deviations detected in QURO populations found in the Serbian lowland region [21,22]. The studied phenological varieties exhibited a slight variation in the onset of the flowering phenophase (early: 17 April, late: 15 May). These findings suggest that crosses between late and early QURO varieties cannot occur in natural populations in Serbia [6], which would otherwise serve as an important source of genetic diversity. The same phenological variations were noted among five remote natural populations in Serbia, as well as among trees belonging to the same population [23]. Across Eastern Europe, pedunculate oak phenophases were studied intensively in the 19th century. A number of studies have shown that phenological forms differ in habitat preferences and susceptibility to spring defoliation and summer drought [24,25,26,27]. In some regions in Europe, phenological dynamics are considered during the selection of plant material for plantings [27]. Some studies from Eastern Europe have shown that the current problems with oak stand dieback might result from the inappropriate selection of oak varieties for the given habitat conditions [27]. Phenological variations are observed across the distribution range of pedunculate oak [25,26,28] and have a significant impact on tree growth performance [29].
Intensive phenological observations in the last decades of the 20th century have noted differences between the early and the late QURO varieties at different levels [22,25,30]. According to Utkina and Rubtsow [30], late QURO exhibits superior resistance to spring frost and insect damage and produces better-quality wood than earlier phenological varieties. Findings reported for QURO growing in Serbia concur with these observations [22]. Late QURO varieties growing in temperate climate zones are also more tolerant to the leaf defoliator Corythucha arcuata Say (Hemiptera: Tingidae). The first leaves of the late variety emerge after this insect’s development of the first and the most intensive generation [21,22]. Likewise, oak powdery mildew (Erisiphe alphitoides) is an important disease in oak forests [31] that tends to have a strong impact on early oaks. Likewise Phytophthora caused an oak decline across Europe, but its impacts differed significantly among populations [32,33].

Aim

The phenologically different varieties growing in the Serbian lowland region [6] have also been shown to differ with regard to pathogen resistance, wood quality, phenology, morphology, chemical characteristics, etc. [21,22,23,30]. As wood is one of the most important forestry outputs and because lowland oak forests are extremely sensitive to intensive climate changes [17], the intra-variety differences of oak could be of great importance for “climate-smart” lowland forest management [4]. Hence, the present study focuses on three phenologically different (early, typical, and late) pedunculate oak varieties from one uniform experimental trial to define their (i) radial growth performance; (ii) early wood (EW) and late wood (LW) increment; (iii) response to drought events; and (iv) aboveground biometry and its allometric relationships.

2. Materials and Methods

2.1. Site Description

The experimental trial that is the focus of our investigation is located in the lowland region of Serbia (southeastern Europe), close to the town of Sremska Mitrovica (45°0′19.076′′ N; 19°36′51.137′′ E) and within the Sava River catchment area. The plot is located at 85 m a.s.l., with a slope of <2%. The stand conditions and terrain characteristics are uniform. According to the SoilGrids (https://soilgrids.org, accessed on 15 May 2021) database, which is based on the World Reference Base classification, the soil in the area can be characterized as a gleysol. As the plot is located ~10 km away from the river, it is not directly influenced by the anomalies in discharge. However, climate conditions significantly affect the analyzed trees.

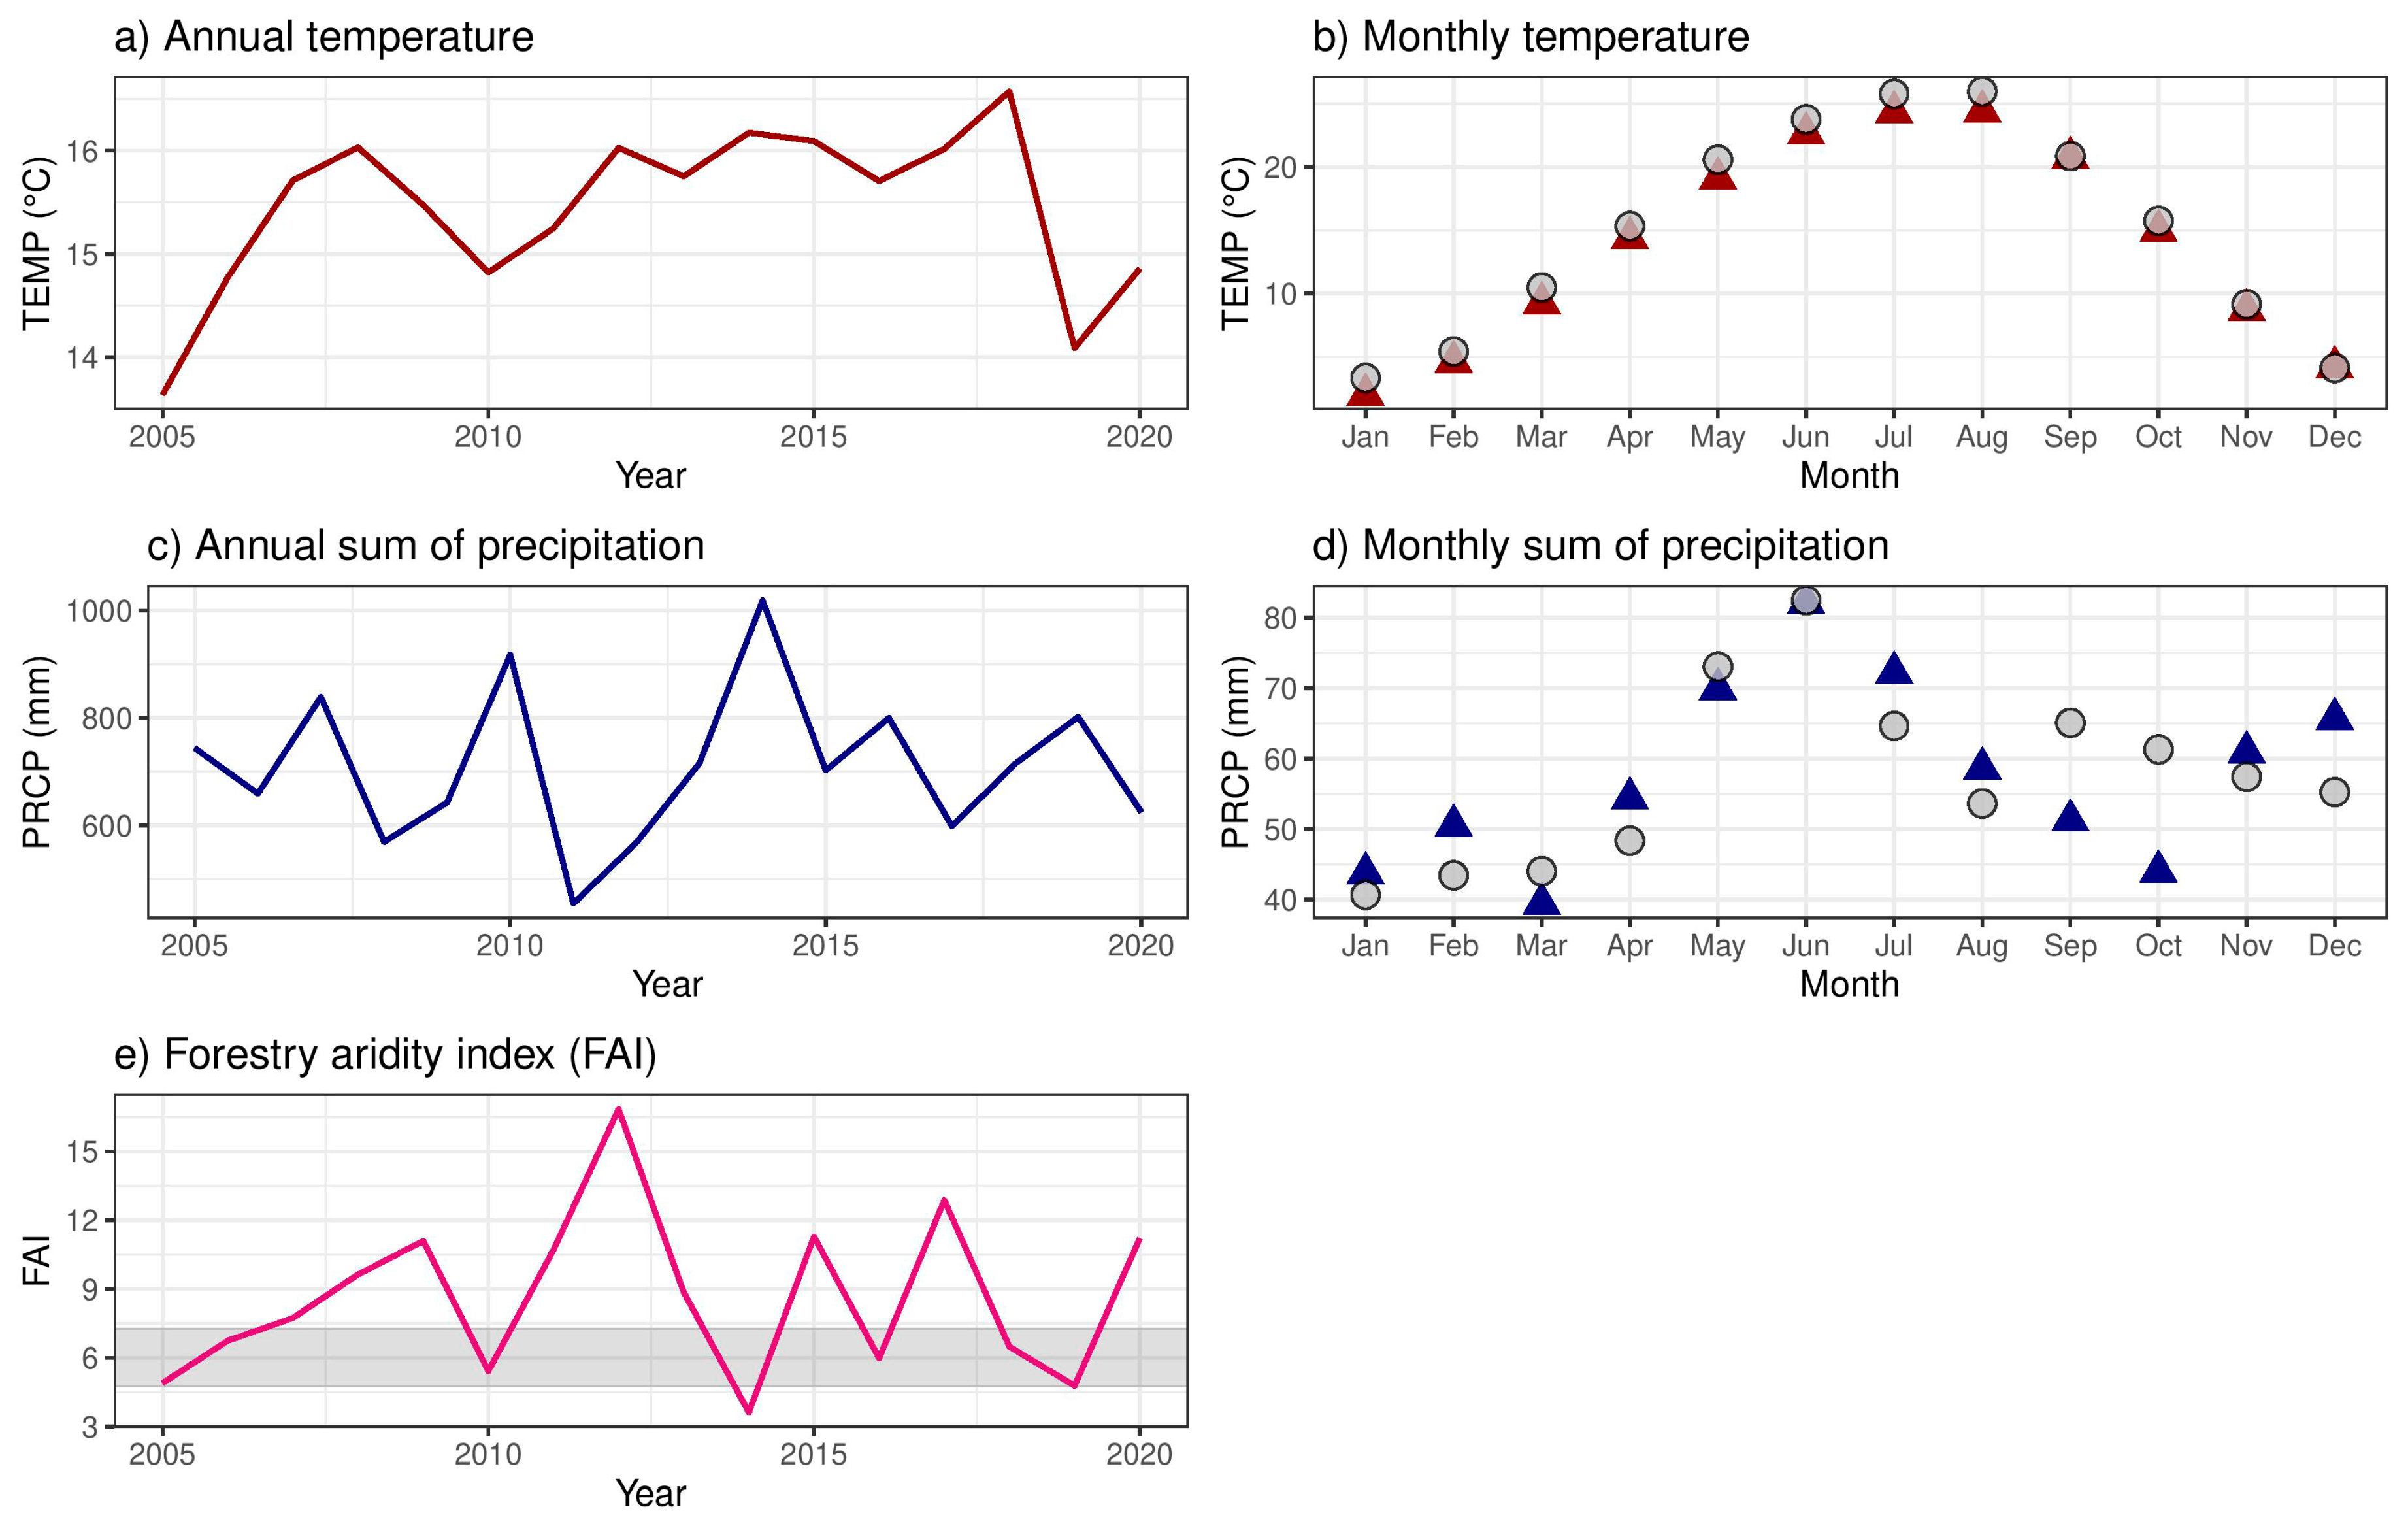
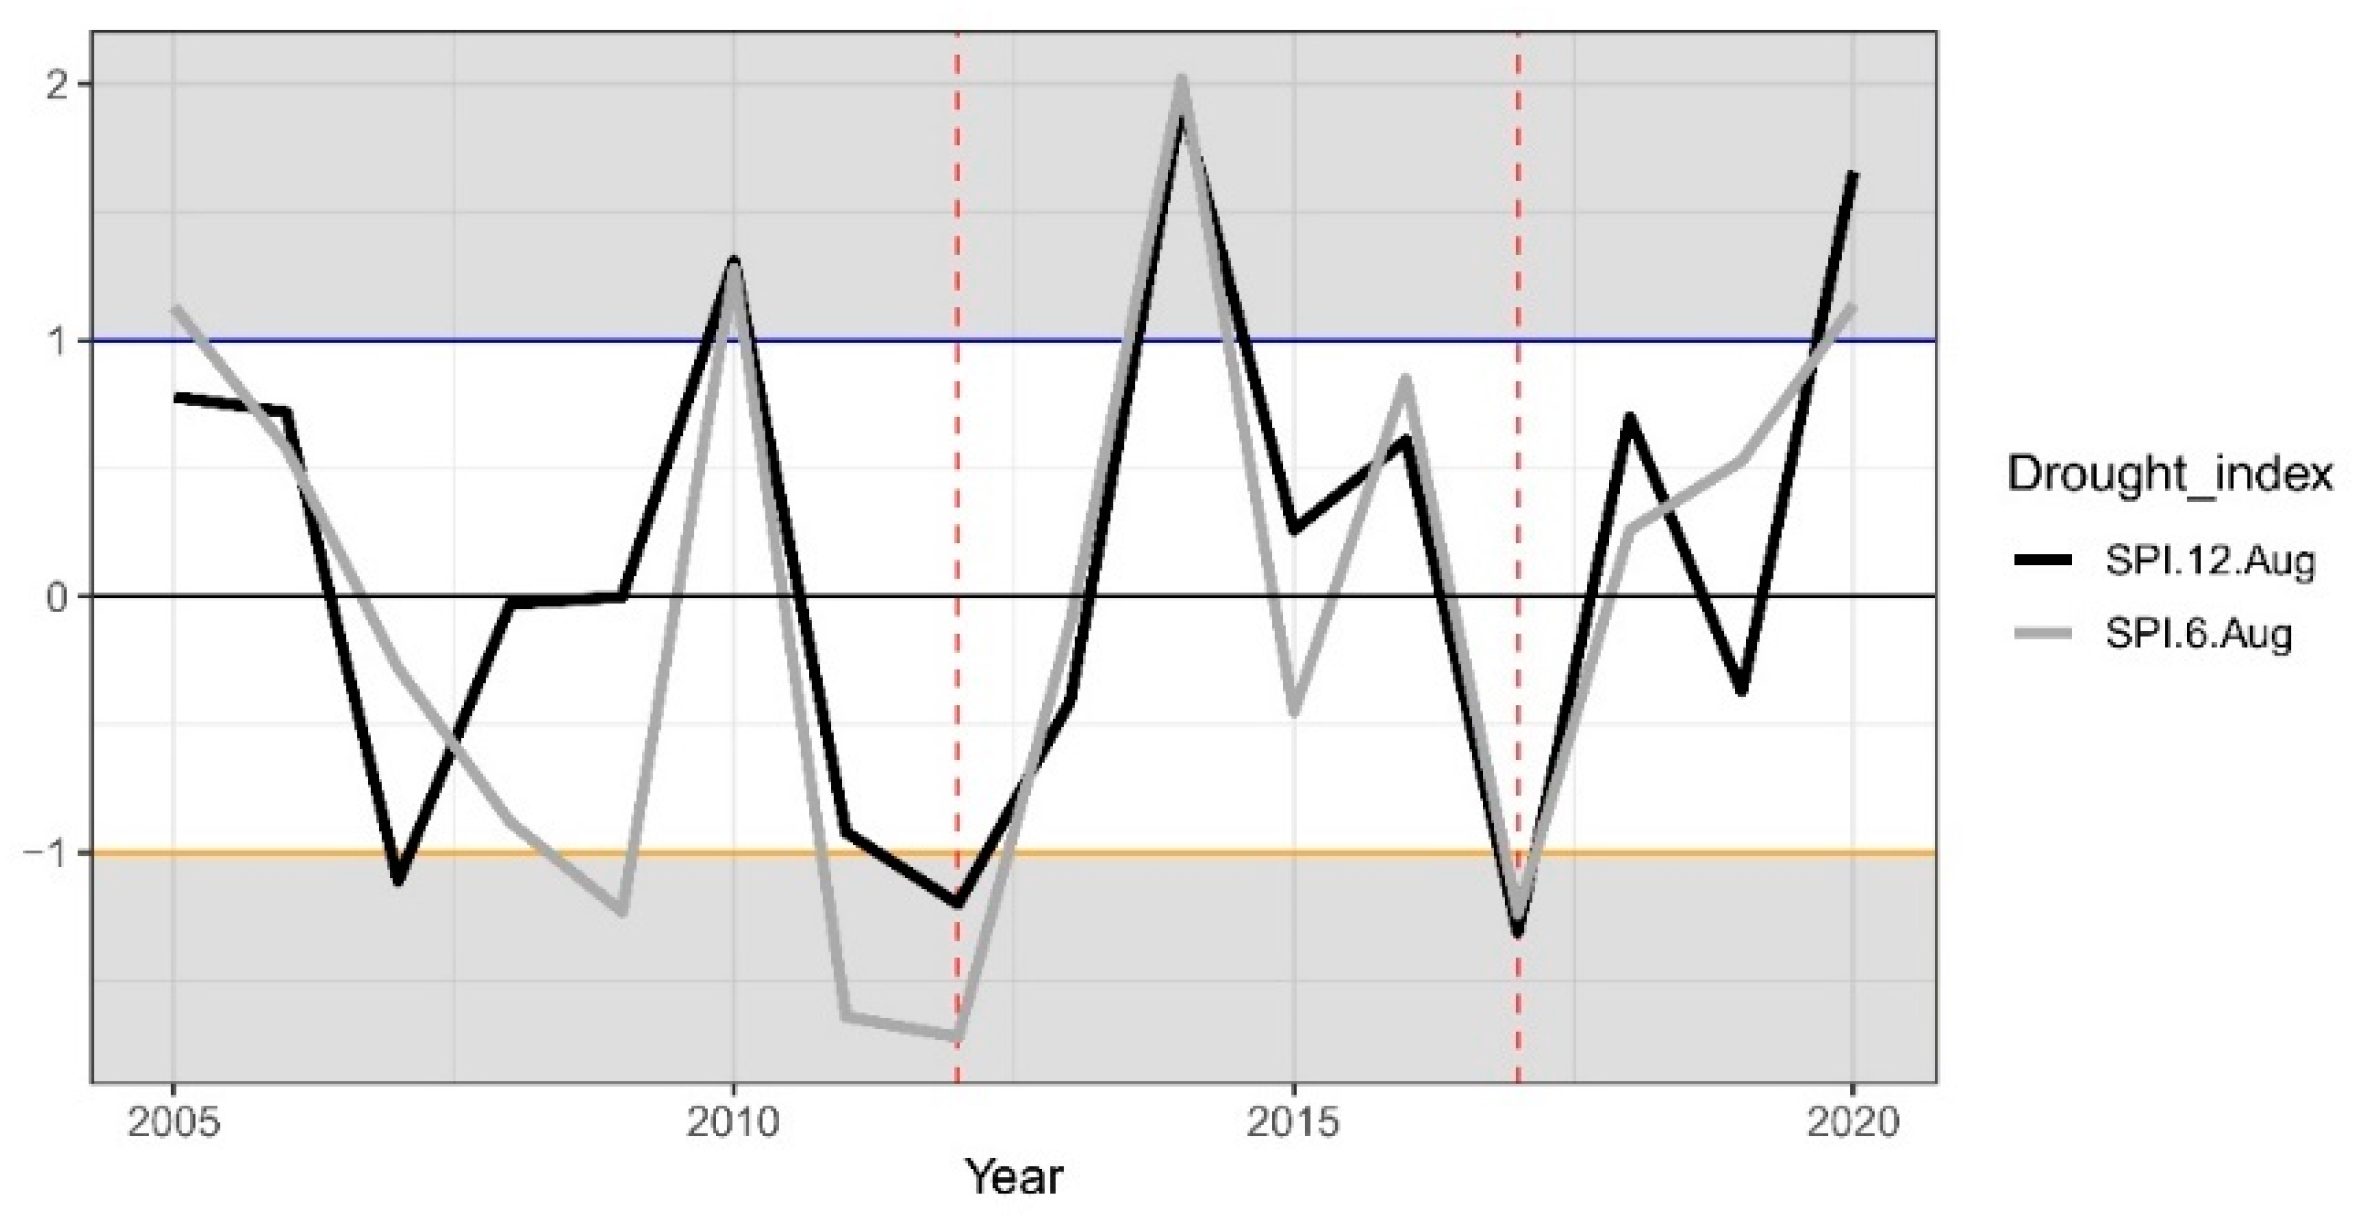
2.1.1. Climate Conditions and Drought Events

Climate data for this study (spanning the 1950−2020 period) were sourced from the FORESEE database [34]. The obtained data were interpreted on annual and monthly timescales. Average temperature (TEMP; °C), sum of precipitation (PRCP; mm m−2), and the forest aridity index (FAI) served as climate indicators. Average temperature was interpreted at an annual scale (TEMP) and as averages for spring (March to May, TEMPMAM) and summer (June to August, TEMPJJA). Likewise, precipitation was interpreted as the annual sum of precipitation (PRCP) and calculated separately for spring (March to May, PRCPMAM) and summer (June to August. PRCPJJA). All meteorological data were interpreted as averages with standard deviations (SD).
Drought events were interpreted using the Standardized Precipitation Index (SPI) [35] for the 2005−2020 period. In the analyses, 6- and 12-month August SPIs were adopted as indicators of annual drought (SPI.12.Aug) and drought during the intensive vegetation period (SPI.6.Aug).

2.1.2. Trial Setup

During the second half of the 20th century, intensive phenotyping observations were made in different types of flooded and non-flooded QURO forests within the Danube and Sava River catchment areas, which are located in the northern lowland region of Serbia [6]. Based on those findings, 871 representatives of phenotypically determinate 21-year-old QURO specimens exhibiting excellent performance and fitness were included in our dataset. In this phenologically controlled trial, significant variations (up to 28 days) in leafing and flowering among early and late QURO varieties were noted [6].
Within the analyzed QURO gene pool, four QURO phenological varieties were determined and denoted as (i) early (Quercus robur var. praecox; E-QURO); (ii) typical (Q. robur var. typica; T-QURO); (iii) late (Q. robur var. tardiflora; L-QURO); and (iv) extremely late (Q. robur var. tardissima). Extremely late QURO is rare and its characteristics are not comparable with those of other analyzed QURO varieties, and thus was excluded from our study. A trial involving selected phenologically different QURO specimens was established in 2000 by Vojvodinašume Public Enterprise in collaboration with the Institute of Lowland Forestry and Environment (Novi Sad, Serbia). All of the planted one year-old QURO seedlings that were included in the trial originated from open-pollinated (half-sib) families taken from superior mother trees (plus trees) growing in natural forests across Serbia. During the 21-year period, only basic forest management techniques were implemented on the plot, namely dry tree removal and the clearing of lower branches. Planted QUROs were also phenologically checked. All selected QURO specimens were planted in a 6 m × 8 m raster and should be interpreted as individual trees in this study. Phenological varieties were organized in three blocks to form a single plot.

2.2. Dendrochronological and Biometric Analyses

Wood cores and biometric data were taken during the summer of 2020. Two cores per tree were taken (west and east orientation) at an angle of 90° at breast height (~1.3 m), for a total of 120 cores from 60 trees (20 trees per variety). Only healthy, symmetrical QURO specimens free from any visible anomalies were included in the sample. To minimalize the influence of any variations in site conditions (soil properties, terrain, etc.), the sample was randomized and the representative trees were selected evenly across the entire plot, excluding trees located at the perimeter. After sampling, the collected wood cores were air-dried, fixed to wooden mounts, and sanded until tree rings were clearly visible. The prepared cores were scanned, and tree ring width (TRW), early wood width (EW), and late wood width (LW) were measured with an accuracy of 0.01 mm using CDendro 9.5 and CooRecorder 9.5 software (Cybis Elektronik & Data AB).
Biometric analyses (tree dimension measurements and allometric relations) were performed on all representative E-QURO, T-QURO, and L-QURO specimens, thus involving 871 trees. Tree dimension measurements included tree height (TH) and crown width (CW), both expressed in meters, as well as diameter at breast height (DBH; 1.3 m), expressed in centimeters, and tree trunk height (TTH) were uniform and counted at 2.4 m. We measured two radii at an angle of 90° to the trunk of CW and DBH and their averages were interpreted in further analysis. Trees with DBH < 5 cm and damaged trunks or asymmetric or damaged crowns were excluded from the sample. Allometry analyses included TH/DBH, CW/DBH, and CW/TH ratios.

2.3. Statistical Analyses

Radial growth was interpreted using the cumulative basal area increment (BAI; cm2), TRW, EW, LW, and their detrended values, i.e., tree-ring width index (TRWi), early wood index (EWi), and late wood index (LWi), respectively. In line with the approach adopted by Fritts [36], single detrending was adopted to remove the age trend using a modified negative exponential curve. Smoothed BAI, TRW, and TRWi chronologies were obtained from a generalized additive model (GAM) smoother using the equation (y ~ s(x)). Intra- and inter-variety deviations in BAI, TRW, EW, and LW were interpreted using principal component analysis (PCA). The juvenile and mature tree growth phases were defined by applying the optimal segmentation model following radial growth chronology trends [37].
Variations in drought response across QURO varieties were interpreted using the resistance, resilience, and recovery indices [38,39,40]. For this purpose, drought years were defined with respect to SPI values. The influence of variety and half-sib families were interpreted using two factorial analysis of variance (ANOVA) to the unbalanced samples. The responses of different varieties to drought events were interpreted using the ANOVA honestly significant difference (HSD) Tukey post-hoc test, with p < 0.05 signifying statistical significance. Resistance, resilience, and recovery were calculated using the following equations:
Resistance = X event   year mean   X 2   pre - event   years
Resiliance = X post   event   year mean   X 2   pre - event   years
Recovery = X post   event   year X event   year
where X denotes the TRW value and 2012 and 2017 are considered drought event years.
Tree biometry data were interpreted via descriptive statistics, while significance of difference was tested using two-way ANOVA with variety and half-sib as dependent variables and p < 0.05 indicating statistical significance. Allometry findings were interpreted by conducting ordinary least squares (OLS) linear regression analysis using the equation below:
y = a + b × x + s e
where parameters a and b denote intercept and regression slope, respectively, and se represents standard error of the regression model.
All data processing was performed using R [41]. Chronology data were detrended using the “dplR” package [42]. The findings were presented graphically using the “ggplot2” package [43], while the “Car” package was used to calculate the descriptive statistics and conduct ANOVA with Tukey post-hoc test.

3. Results

3.1. Climate Conditions, Stand Characteristics, and Drought Events

According to the World Climate Classification [44], climate at the study site is temperate continental to modified continental. August and January are the warmest and coldest months, respectively. Over the 70-year period from 1950 to 2020, TEMP and PRCP were 14.47 °C and 684.0 mm m−2, respectively (Table 1). During spring (TEMPMAM) and summer (TEMPJJA), the average temperatures were 14.75 °C and 24.47 °C, respectively, whereas the sums of precipitation during spring (PRCPMAM) and summer (PRCPJJA) were 165.1 and 207.8 mm m−2, respectively.
As shown in Table 1, obvious differences were noted when data for the 1950−2020 period were compared to those for the 2005−2020 period, especially with respect to the two selected drought years (2012 and 2017). In the last 15 years (2005–2020), annual, spring, and summer temperatures have been 0.88 (TEMP), 0.82 (TEMPMAM), and 0.95 °C (TEMPJJA) higher, respectively, than the 70-year averages. The two drought years (2012 and 2017) were particularly warm, with averages of 15.92 and 15.97 °C annually, 16.01 and 16.33 °C in spring, and 27.82 and 27.44 °C in summer. Similarly, we observed slightly lower precipitation during the more recent period, and particularly strong reductions during the two drought periods, especially in the summer especially during summer months in 2012 (57.3 mm m−2), and 2017 (107.7 mm m−2) when compared with the average annual sum of precipitation for 1950–2020 (207.9 mm m−2).
The warmest years in last 15 years were 2018, 2014, and 2012 (16.5, 16.13, and 15.92 °C); the coldest were 2005, 2019, and 2010 (13.55, 14.05, and 14.77 °C; Figure 1a). The highest precipitation was observed in 2014, 2010, 2007, and 2016 (1019.1, 917.9, 839.0, and 800 mm m−2; Figure 1c). On a monthly level (Figure 1b,d), higher temperatures were noted for all 12 months over the past 30 years (1990–2020) than occurred over the earlier period 1950–1980. We also found lower precipitation amounts during winter and summer months as compared to spring (March and May) and autumn months (September and October). Overall, more precipitation occurred during the last 30 years (1990–2020) than during the earlier 30-year period.
For the 2005−2020 period, optimal oak growth conditions were noted only for 2005, 2006, 2010, 2016, 2018, and 2019 (4.75–6.00, indicated by the shaded area in Figure 1e), according to the Bjerknes’s scale [45]. It is also worth noting that, the FAI values (16.81 and 12.88, respectively) in 2012 and 2017 were more than 200% higher than the optimal oak stand aridity due to the extreme droughts in these years, and thus, were extremely stressful and not conducive to QURO growth.
Several extremely wet and dry years were noted throughout the 2005−2020 period (Figure 2). Based on 6- and 12-month accumulation periods, 2010, 2014, and 2019 were more humid years (SPI ≥ 1), whereas 2012 and 2017 were more arid years (SPI ≤ −1). According to the drought indices, 2007 and 2009 could also be considered as drought years. However, because both the annual drought indices and those based on vegetation periods were the lowest for 2012 and 2017, these years are defined as the representative cases with regard to the growth performance of different oak varieties during drought. Likewise, in 2012 and 2017 were noted as different tree growth phases (juvenile and mature), which are included in this study.

3.2. Radial Growth Performance

Significant differences in radial growth performance were noted among QURO varieties and across the analyzed timespan (Figure 3a–c). Firstly, varieties differed with respect to the number of tree rings at breast height, with 14, 13, and 12 years recorded for T-QURO, L-QURO, and E-QURO, respectively.
The highest TRW peaks (exceeding 15 mm year−1 in some trees) were observed in 2015 for all varieties (Figure 3a,b). The measured and detrended chronologies indicate that L-QURO had a faster radial increment during the first decade (2005–2015) of the chronology. Noted higher radial increment of L-QURO makes a difference in cumulative BAI on Figure 3c, where L-QURO had the greatest radial growth during the last third of the cumulative BAI chronology. Similar decreasing trends are seen in 2010–2013 and 2016–2019 and are likely the results of the extreme droughts in 2012 and 2017.
The decrease in the radial increment after ~10th year of growth could be attributed to the end of the juvenile growth phase, which is the most productive phase in a tree’s life. Based only on the radial growth dynamics in the juvenile growth phase, L-QURO can be distinguished from T-QURO and E-QURO. The faster growth observed in L-QURO during its first years is important for its survival and competitiveness, as well as for faster nursery production of oak seedlings.
Inter-variety differences were examined by subjecting the data for the 2010–2019 period to PCA analysis, which revealed stronger deviations in BAI and TRW (Figure 4a,b) relative to EW and LW (Figure 4c,d). Based on the BAI and TRW chronologies, more pronounced differences were noted between L-QURO and E-QURO relative to T-QURO.

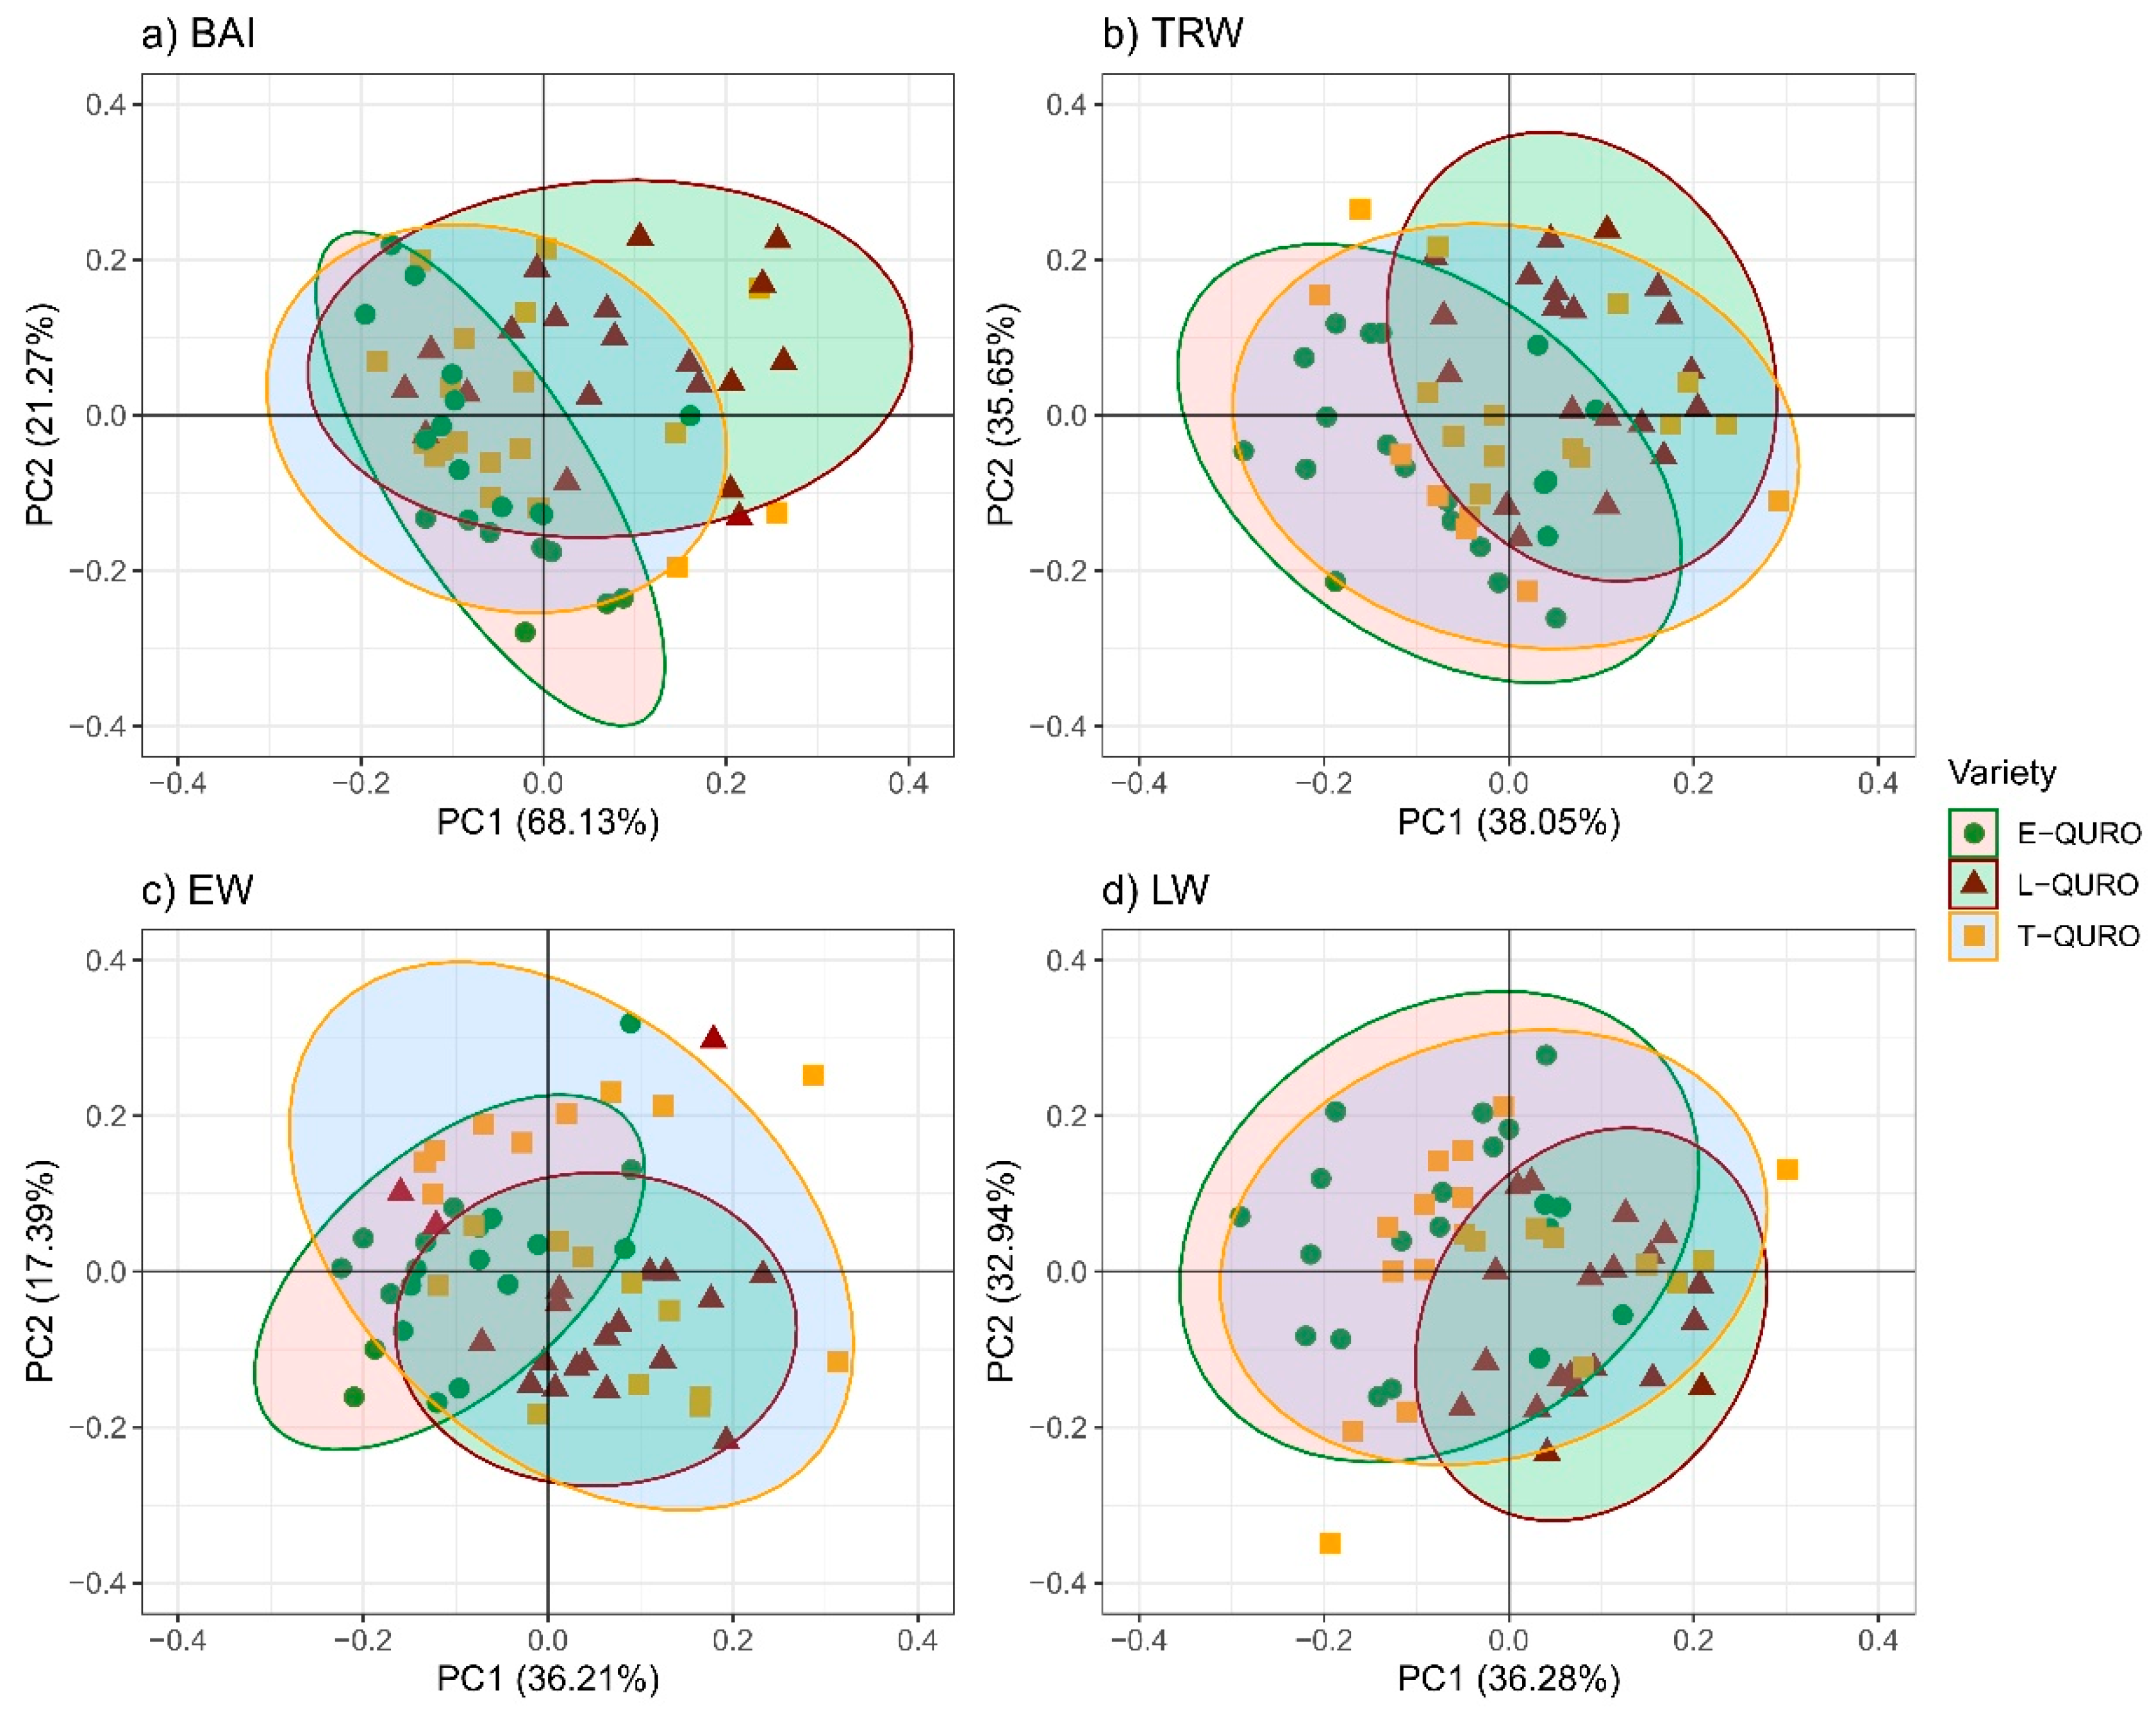
3.3. Early and Late Wood Characteristics

Throughout the studied period, detrended EW and LW chronologies (Figure 3d–f) showed some differences among analyzed QURO varieties. Although their patterns were similar, EW > LW was observed for L-QURO during its juvenile growth phase. Deviations between the EWi and LWi chronologies were less pronounced in T-QURO and E-QURO. The strongest EWi/LWi deviations were observed in L-QURO.
According to the PCA results, EW and LW inter-variety differences were lower than those noted for TRW and BAI (Figure 4). As shown in Figure 4c,d, the PC1 values for EW and LW were nearly identical at 36.21% and 36.28%, while the PC2 values were significantly different (32.94% vs. 17.39%). It was not possible to define a clear pattern in the ratios between early wood and late wood among phenological varieties.

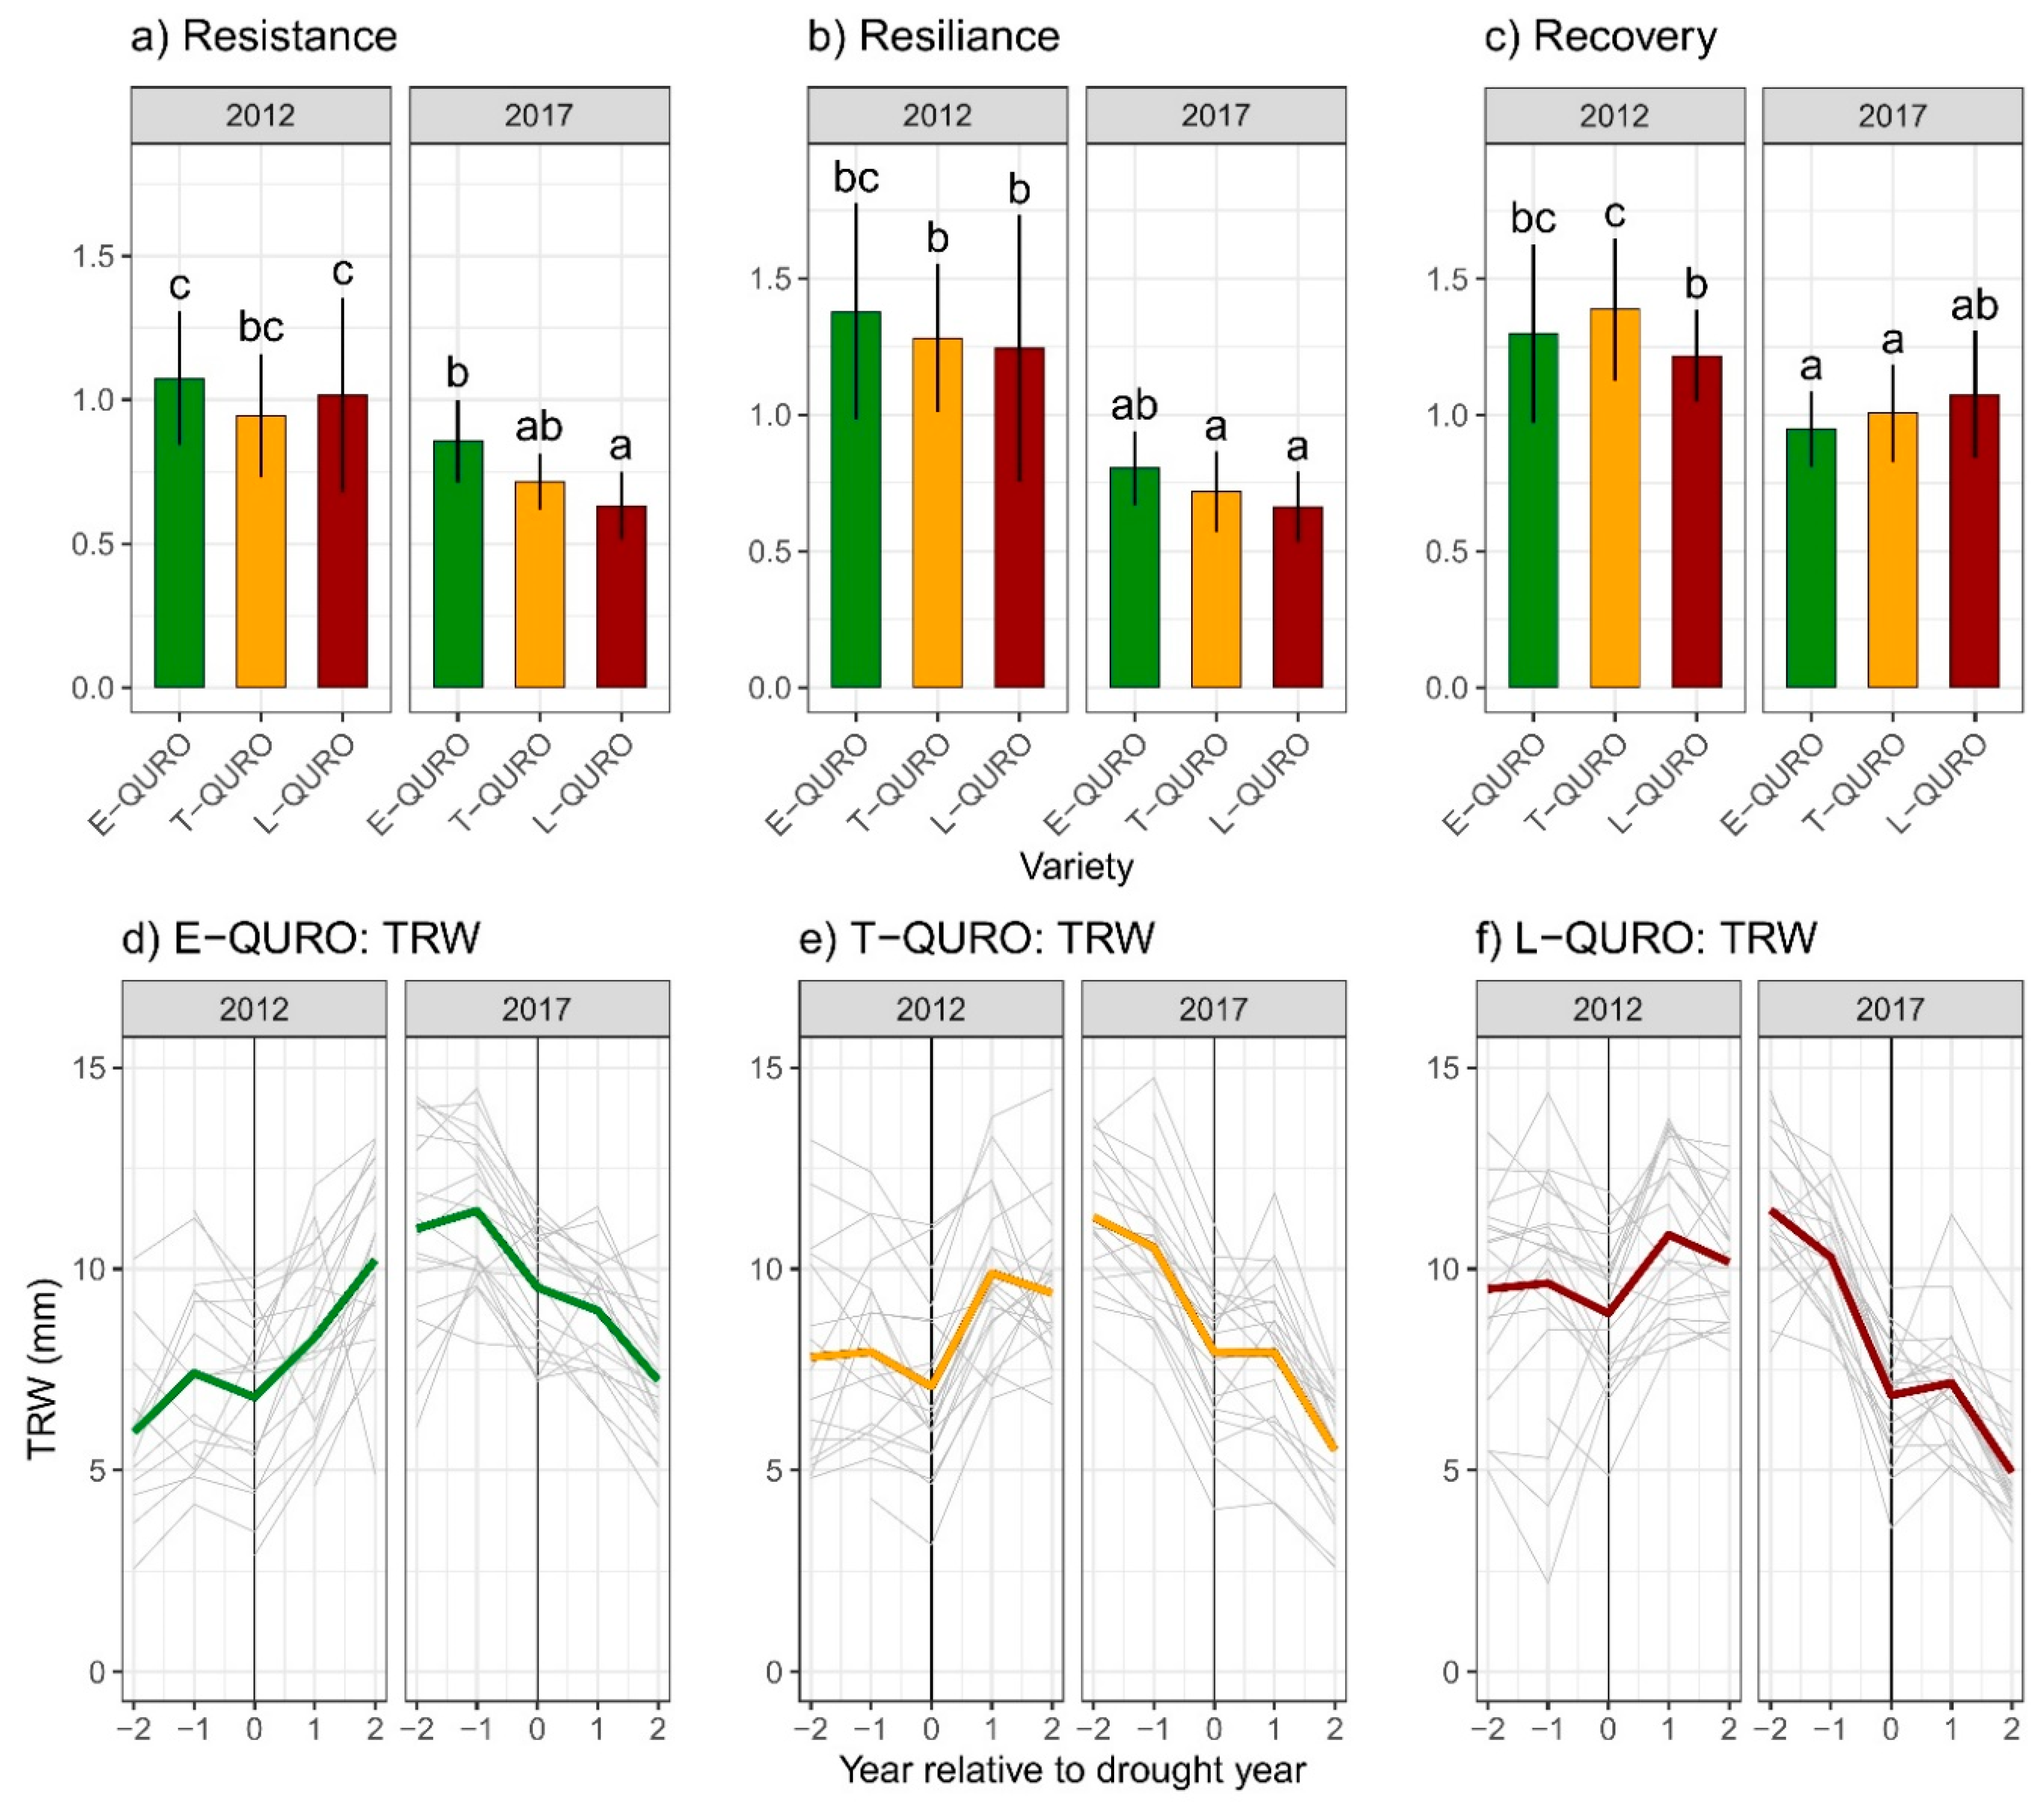
3.4. Drought Resistance, Resilience, and Recovery Potential

The responses of QURO varieties to drought events (with 2012 and 2017 as test cases) were interpreted via resistance, resilience, and recovery potential based on the drought indices and TRW data. The first drought event (2012) occurred during the QURO juvenile growth phase, whereas the second drought event (2017) occurred during the mature (adult and reproductive) growth phase.
Phenological variety and tree growth phase were significant factors in determining the drought sensitivity of QURO radial growth (Figure 5a–c). Higher resistance and better recovery after drought were observed in 2012, which corresponds to the juvenile tree growth phase. Nonetheless, TRW for all QURO varieties declined significantly in both years but increased in the subsequent years (Figure 5d–f).
Likewise, statistically significant intra-variety variations during both drought events were noted with regard to resistance, resilience, and recovery (Figure 5a–c). Although E-QURO exhibited the greatest resistance and resilience, these responses were significantly different from those of T- and L-QURO only in 2017.
Recovery values also differed across varieties and between drought events (Figure 5c). In 2012, T-QURO exhibited the greatest recovery, followed by L-QURO and finally E-QURO. During 2017, which coincided with the mature growth phase, lower recovery performances were detected, with L-QURO demonstrating the best recovery in radial growth but lower resistance and resilience relative to the other two varieties.

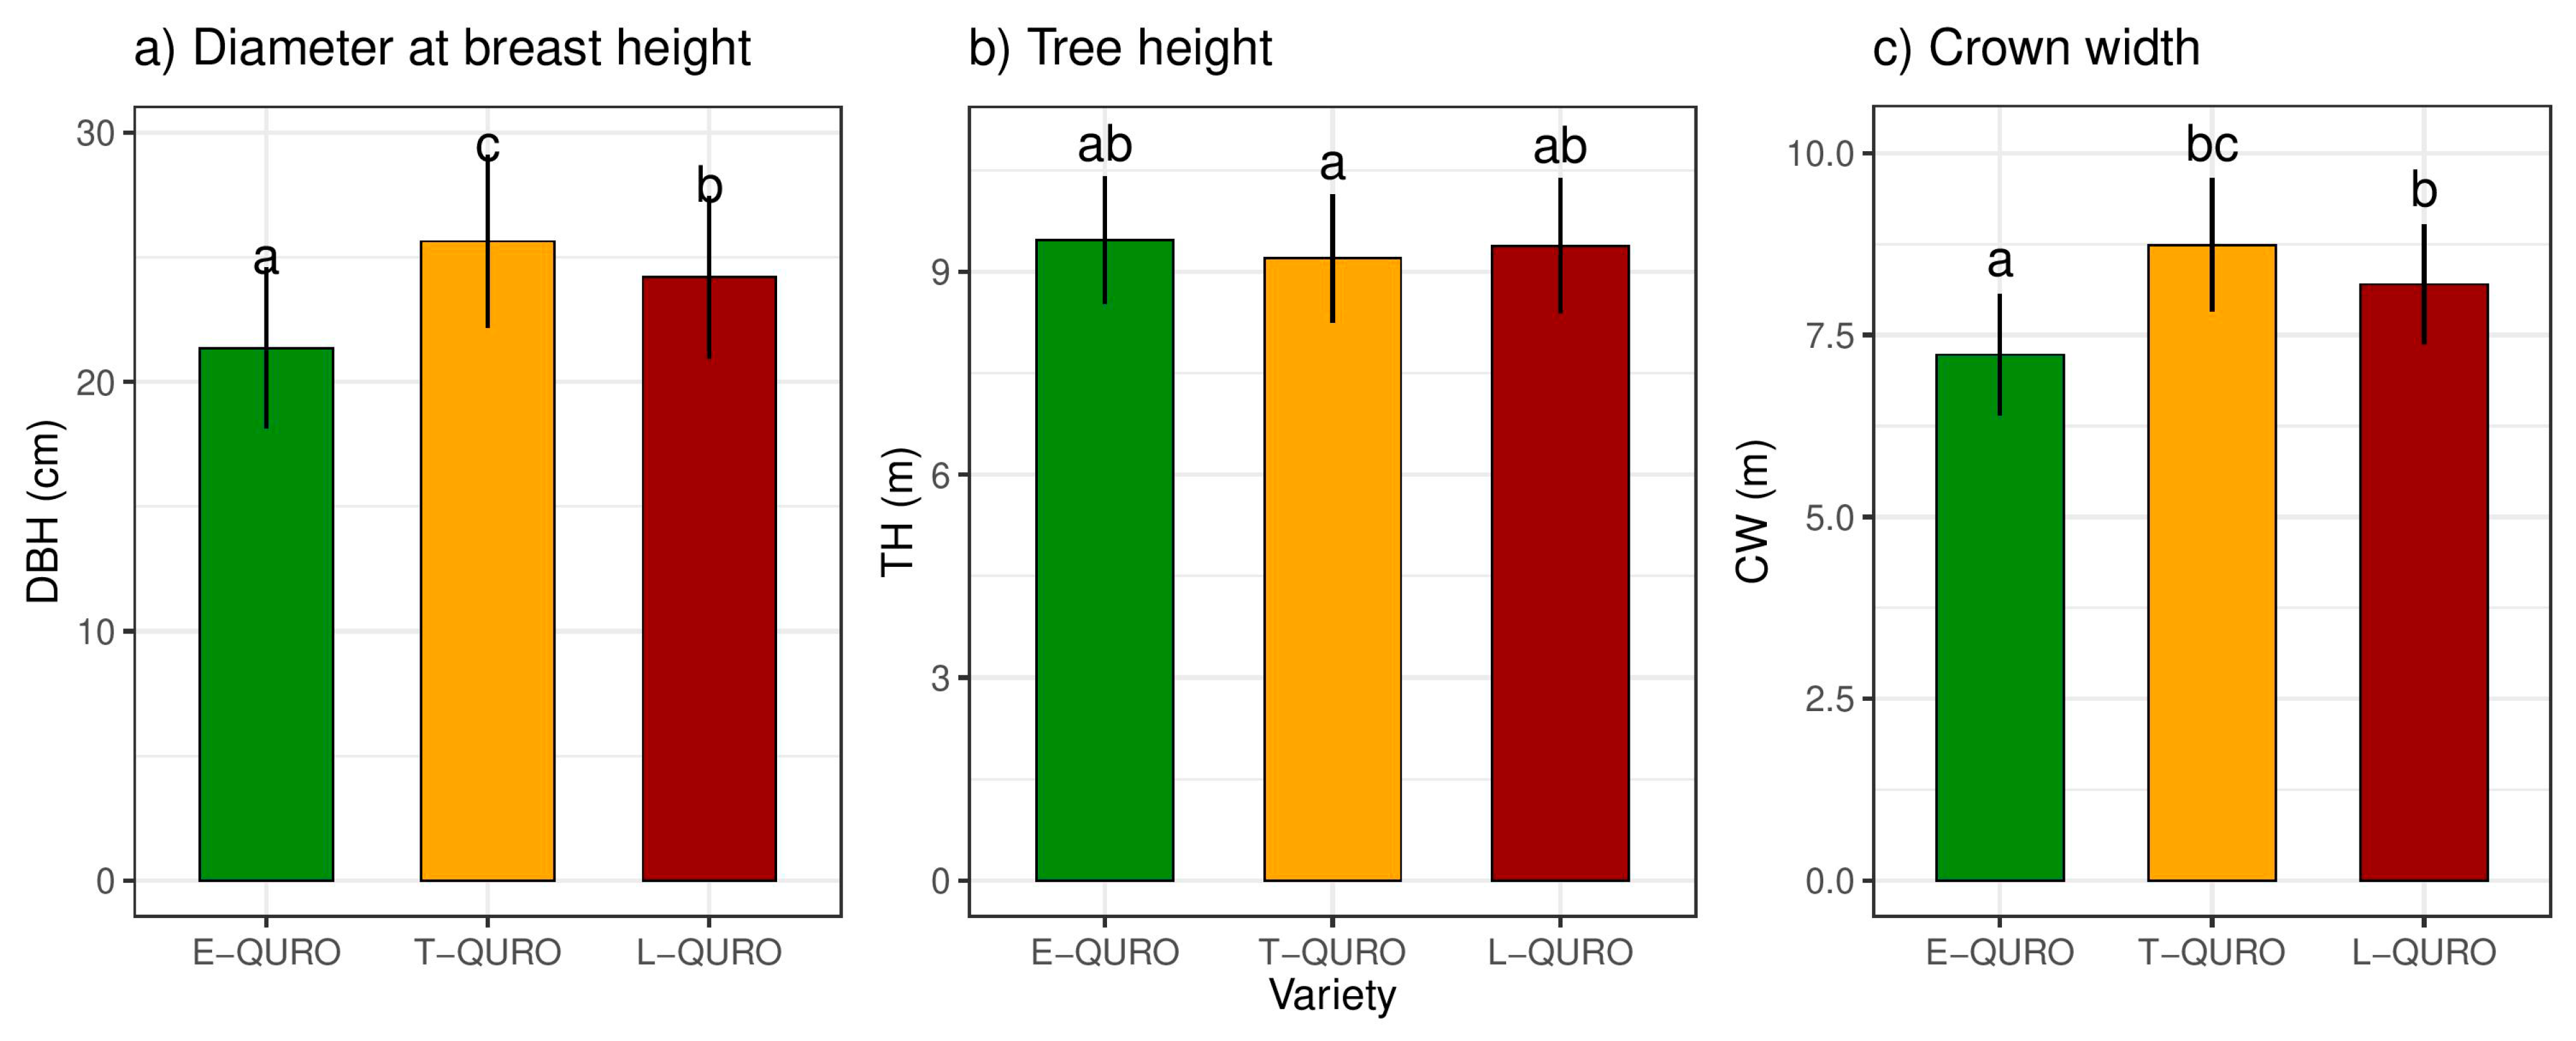
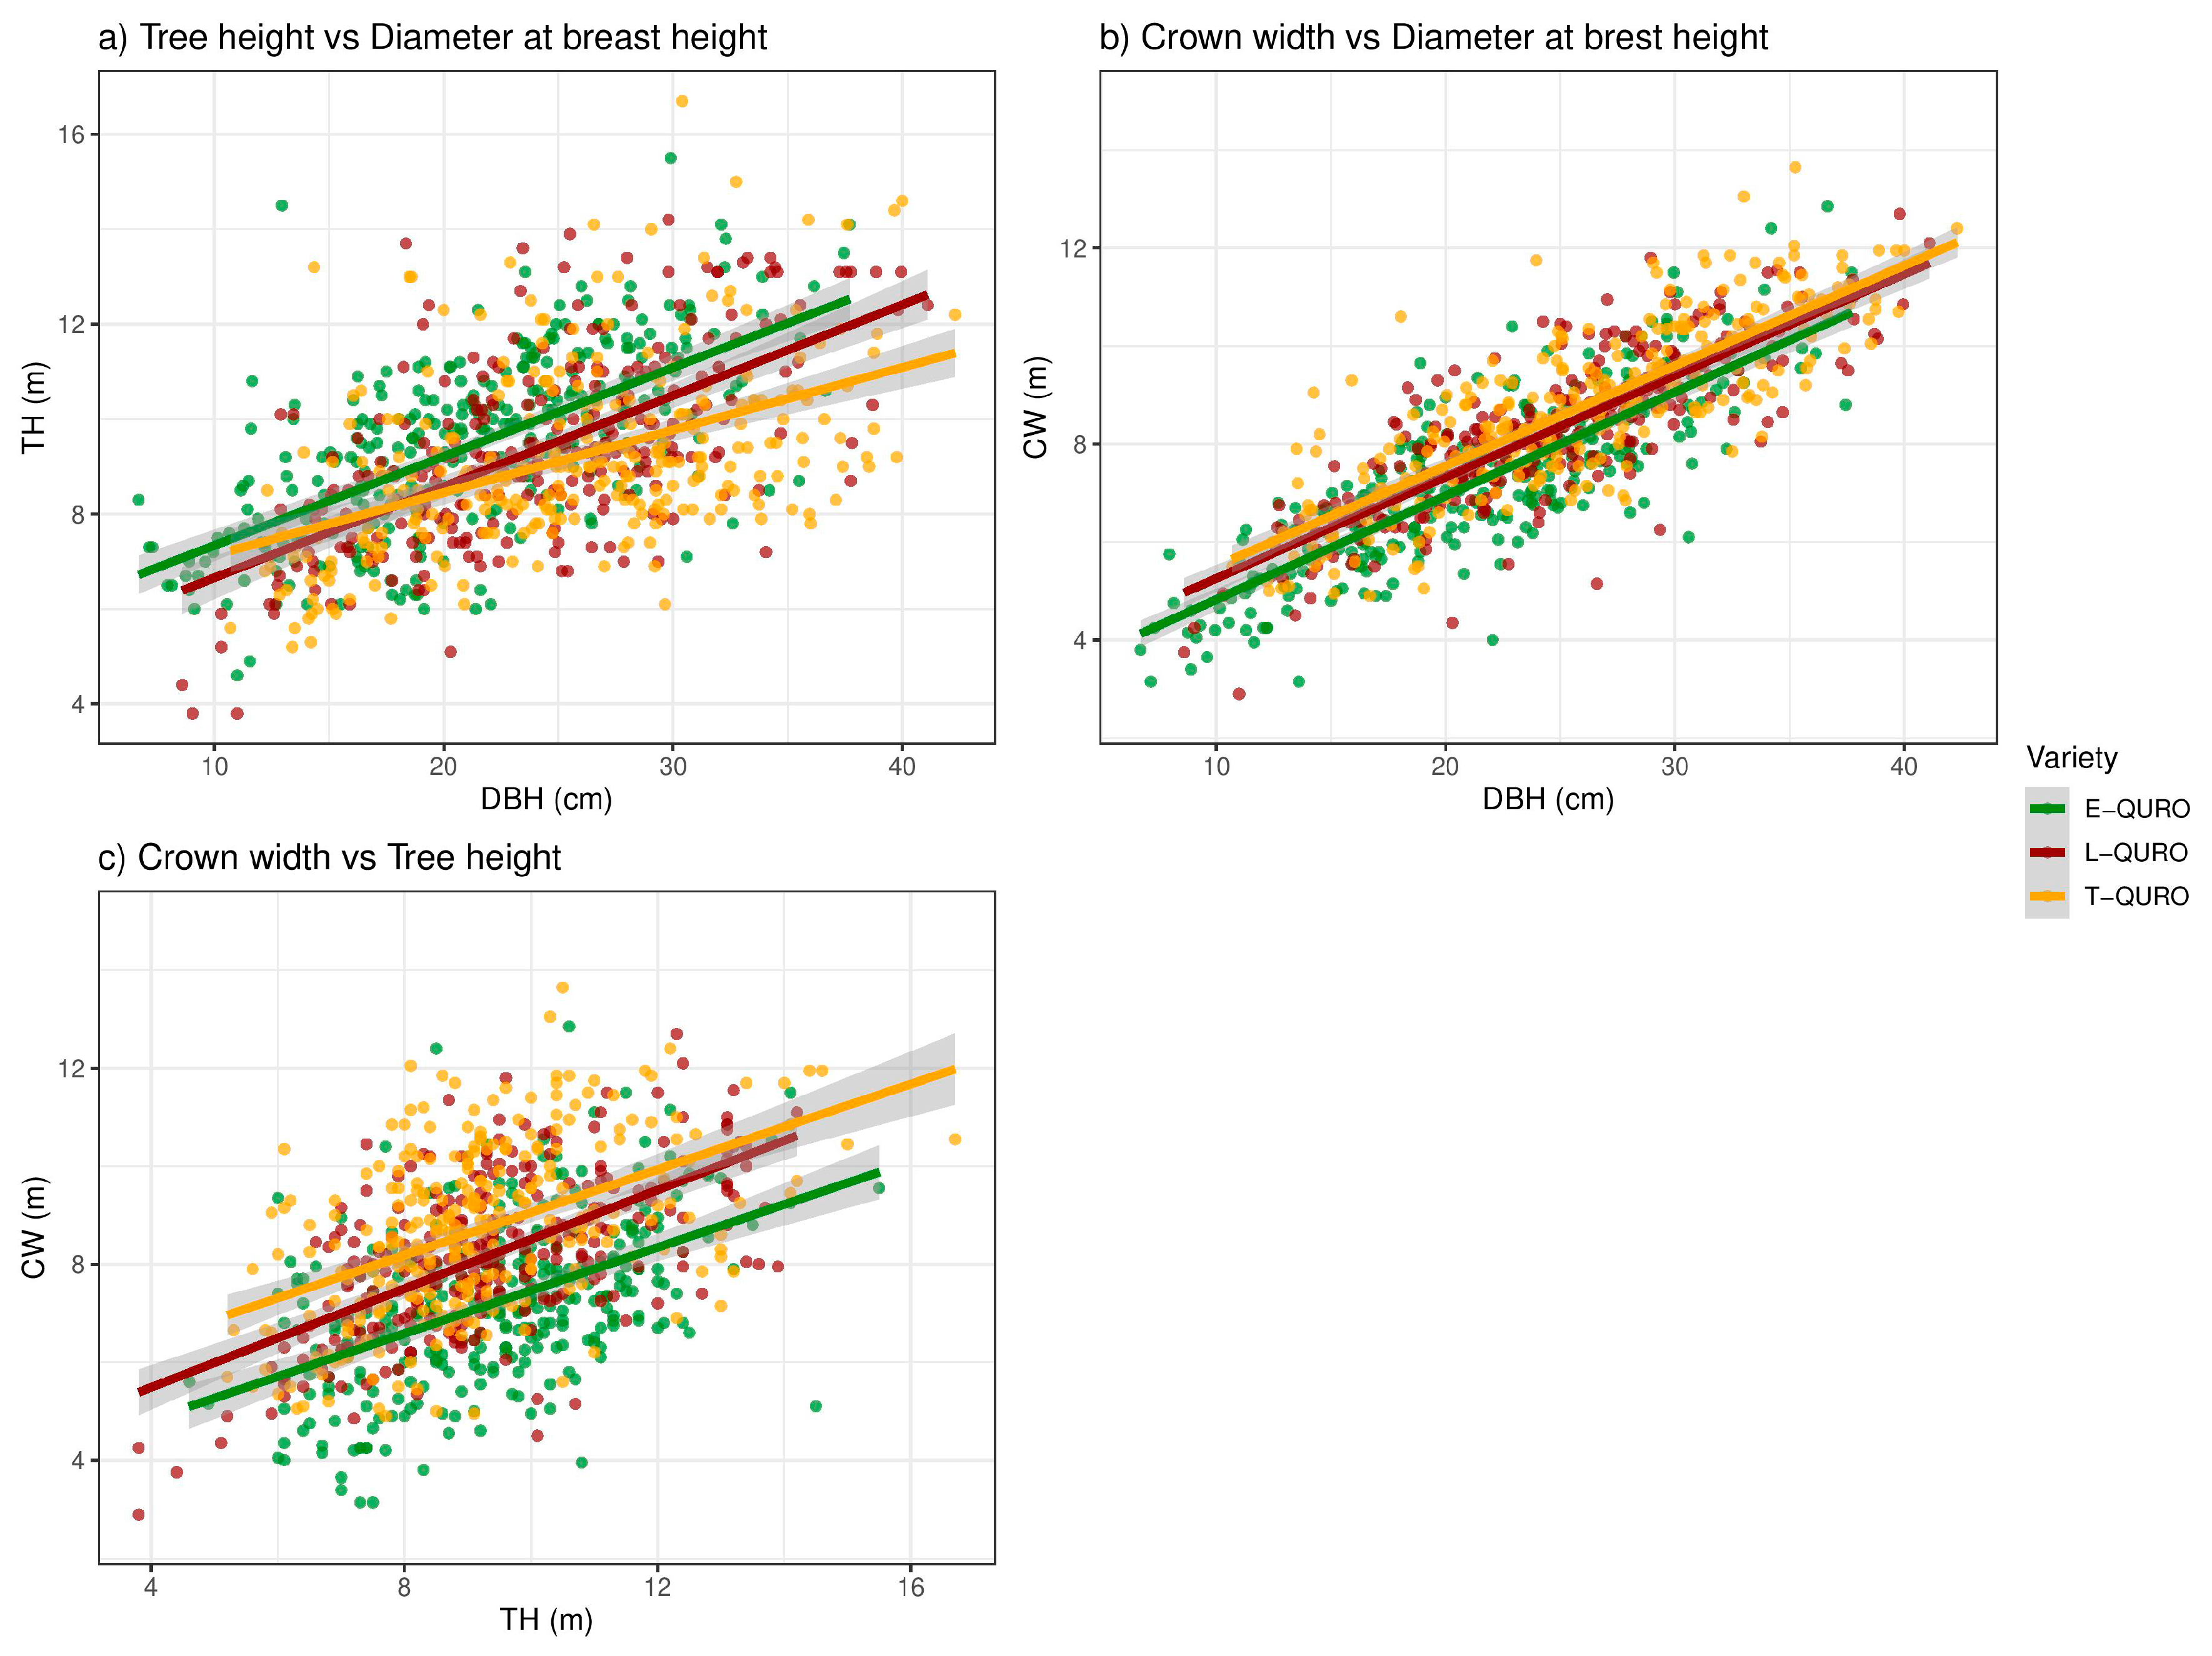
3.5. Tree Dimensions and Allometry

On average, 21-year-old QURO specimens from the analyzed stand were 9.35 m tall and had crown widths of 8.05 m and DBH of 23.71 cm; however, significant variations were observed among QURO varieties. In total, 24, 25, and 27 half-sib families of early, typical, and late QURO varieties were included in this study. Based on two-way ANOVA, half-sib families have a lower influence on DBH, TH, and CW deviations among QURO varieties (Table 2). On the other hand, varieties as well as varieties x half-sib statistically significantly separated all QUROs’ DBH, TH, and CW. Otherwise, half-sib samples did not exhibit statistically significant deviations. Based on F-test results, varieties are more strongly differentiated in terms of DBH (F 261.40) than TH (F 2.48) or CW (25.89). However, half-sib has the strongest effect on DBH (F 26.24), followed by TH (F 2.91), and finally CW (F 1.98). Variety x half-sib interaction exerts the strongest influence on CW (F 51.60) followed by TH (F 48.47).
The greatest trunk diameter at breast height was measured for T-QURO (25.63 cm), followed by L-QURO (24.20 cm), and E-QURO (21.35 cm), with each variety forming a statistically significant homogenous group according to Tukey’s HSD rank test results (Figure 6). The same pattern was noted for CW, but not for tree height. E-QURO (9.46 m) and L-QURO (9.38 m) performed better than T-QURO (9.19 m) in terms of height increment. Analyzed varieties vary by 1.50 m in CW in favour of T-QURO, which had wider average crown radii (8.73 m) than did E-QURO (7.23 m).
Tree dimension proportions (allometric relations) for each QURO variety are shown in Figure 7, while the OLS linear regression findings are summarized in Table 3. We analyzed three allometric pairs (TH/DBH, CW/DBH, and CW/TH) to explain tree dimension proportions. In contrast to measured tree dimensions, allometric proportions vary less among QURO varieties though some important differences were observed. As shown in Figure 6 and confirmed via regression model outputs (mostly Adj. r2), the model provided a better fit for CW/DBH relative to TH/DBH and CW/TH.
All analyzed allometric relationships were highly statistically significant (p < 0.001). Fisher test (F-test) results ranged from 80.4 (CW/TH; T-QURO) to 629.1 (CW/DBH; E-QURO). Then, adjusted coefficient of determination (Adj. r2) values for the regression model were similar across the varieties and ranged from weak (CW/TH 0.22; T-QURO) to strong (CW/DBH 0.67; E-QURO). The model also provided a better fit to the CW and DBH data relative to the TH/DBH and CW/TH pairs. No patterns were observed among QURO varieties with regard to Adj. r2 strength. Although T-QURO’s TH/DBH and CW/DBH allometric pairs showed weaker fitting, this pattern was not observed in the CW/TH allometric relationship. However, differences between L-QURO and E-QURO lowered the strength of their relationships with the Adj. r2 of T-QURO.
Regression line slope (parameter b) defines the allometry of the analyzed tree dimension parameters. Among QURO varieties, stronger variations were noted with respect to CW/TH (0.43–0.50) and, to a lesser extent, to TH/DBH (0.13–0.19). The b coefficient was nearly identical for CW/DBH among all three analyzed QURO varieties, ranging from 0.19 to 0.22. T-QURO was shorter relative to DBH, while L-QURO had a wider crown relative to tree height. All three QURO varieties had an identical relationship between crown width and DBH.

4. Discussion

4.1. Intra-Variety Deviations in Radial Growth Dynamics

The study findings reveal variations among QURO phenological varieties as well as across time. Differences in radial growth can be attributed to high QURO genetic diversity [21] across the species’ distribution range [18]. In the provenance trial conducted by Bert and colleagues, spatial arrangement (i.e., provenance-separated QURO populations) was shown to contribute to significant deviations in radial growth and resistance to extreme climate conditions [46]. These authors observed different radial growth in two provenance trials, but also the same pattern across provenances. The southern and xeromorphic QURO provenances are better adapted to the changes expected in climate conditions over the next decades.
The sensitivity of QURO to stand conditions has been demonstrated in previous studies [9,12,13,47], as well as in the current study. Nonetheless, clear spatial patterns among QURO populations across Europe cannot easily be defined based on wood properties alone. Above- and belowground environmental factors and the genetic potential for biomass production also influence QURO radial growth. An earlier study noted that soil water availability and above-ground water sources (e.g., precipitation, soil water, ice, etc.) equally affect radial growth [12]. The same authors observed that soil properties significantly influence radial growth and the tree’s sensitivity to drought. Radial growth is also influenced by site-specific geomorphological elements. For instance, rivers are significant modifiers of QURO radial growth performance, as flooded QURO populations exhibit greater radial increments as compared to non-flooded forests [9]. Similarly, micro-site stand conditions have been shown to shape the radial growth of Scots pine in temperate climate zones [48].
If many phenological QURO varieties were selected, the relationship between phenology and radial growth would not be fully understood. On the European level, studies showed that sessile oak vegetation dynamics and their adaptive mechanism were confirmed [49]. A study by Puchałka et al. [25] confirmed a link at the anatomical level between QURO phenology and tree-ring formation dynamics. Following the cambial phenology of 12 QUROs, the study found higher cambial activity up to the middle of April, and EW development until the end of May [25].

4.2. Drought Sensitivity of Different QURO Varieties during Juvenile and Mature Tree Growth Phases

Tree performance varies throughout the life cycle [50]. In particular, significantly different growth dynamics are observed in juvenile and mature trees, thus affecting wood properties [37]. Younger trees grow faster, exhibit more variable radial growth, and have smaller vessels with thinner walls than more mature trees. As a result, younger trees have a lower wood density [37,51] and a different physiological response than older trees [52]. The length of the transition period from the juvenile to the mature growth phase can vary considerably (by up to few decades) depending on the species-specific characteristics and stand conditions [51,52]. In the climate conditions at the study site, QURO transitions from juvenile to mature tree grow phase around the 10th year [19].
Since our common garden experiment was established, two extreme drought events were recorded. The first extreme drought occurred in 2012, which coincided with QURO’s juvenile growth phase. The second was recorded in 2017, after the analyzed trees had reached the mature growth phase (according to the radial increment dynamics). All QURO specimens exhibited better performance, resistance, resilience, and recovery potential during the juvenile growth phase than during the mature phase. These findings are in line with the results reported by McGowran et al. [52], who confirmed that trees exhibit superior morpho-physiological performance during the juvenile growth phase as compared to the mature growth phase. Because the analyzed QUROs exhibit good resistance, resilience, and recovery characteristics, these varieties should be considered when establishing “climate-smart” forests [53].
However, the responses of the analyzed phenological varieties to drought events varied. E-QURO had a greater resistance and resilience but slightly lower recovery potential, which could be attributed to vegetation dynamics and climate synchronization. Under optimal climate conditions, early QURO finishes its intensive growth phase near the end of April [25]. Later varieties can therefore experience optimal conditions that are up to one month shorter. We also found that trees that were growing in stressed conditions showed better recovery potential than trees growing under optimal conditions. This is because they have already been adapting to stress—a situation known as stress priming [54,55]—and have therefore already adapted the hydraulic anatomy of their wood tissue to more stressful conditions [56].
Because the flowering phenophases of early and late QURO varieties do not coincide [6], their crossing in natural populations is not possible. These two varieties therefore show significant genetic deviations from one another. Vessel properties, which define plant hydraulic capacity and shape species-specific responses to drought events [57], provide a high level of heredity [7]. Hence, L-QURO’s better resistance and resilience should be considered as a genotypic characteristic rather than a response to the surrounding environment.

4.3. QURO Inter-Variety Deviations in Tree Dimensions and Allometry

Tree dimensions and their proportions (i.e., allometry) are influenced by the surrounding environment [58,59], as well as by a tree’s fitness [60] and genetic potential [61]. The differences in tree dimensions among QURO varieties observed in this study are in line with the high variation in the biomass production of QURO across the different provenances [46]. Trunk cambial activity is linked to tree phenology [25].
Tree allometry is more than tree dimension shaped via genetics. If provenance tests showed significant and stronger provenance than site influence of QURO growth [46], surrounded effects could not be ignored in studies. Dai et al. [60] showed that stressors, such as drought, significantly affect tree allometry. Moreover, the same authors emphasize that mentioned relations are not simple and are caused by a lot of surrounded influences/stressors, the same as a tree’s survival potential in stress periods. Light availability [58], stand mixture, and density [59], for instance, also significantly shape tree allometry. As shown by this study and other allometric studies, trunk diameter is recognized as a more reliable variable than crown dimensions [62].
Previous studies have confirmed inter-site variations in QURO tree allometry [63] and radial growth [46], which are closely linked [64]. Because our study focuses on even-aged trees from a unique common garden experiment, the influence of external factors was minimized. Thus, any observed differences can be attributed to genetic differences.

4.4. Perspective of Implications Phenological QURO Varieties for Climate-Resistant Forestry

The ability of oak forests to adapt to climate change is key to their survival [65], especially for populations growing in lowlands and arid regions that are extremely sensitive to upcoming climate conditions. Surrounding environment impacts on tree performances are complex and not completely clear. The phenological diversity of oaks is a valuable resource for the cultivation of more climate-resistant QURO specimens/populations.
According to the established RCP scenarios, climate changes in the near future will cause significant changes in forest dynamics [50]. Trees must be able to adapt to the new conditions, but this can be difficult to do for long-lived tree species like QURO. If endangered QURO forests are to survive, forest managers must focus on adaptation-oriented management strategies. Our study shows that phenological variety exists with regard to the resistance and recovery potential of QURO to drought events. Observed deviations labelled this approach correctly based on phenology dynamics in the context of overcoming problems with intensive climate changes.

5. Conclusions

Coetaneous (21 years) QURO phenological varieties differ from one another with regard to radial growth, biometry, and allometry performances. Their response to drought events varies across both variety and tree growth stage (juvenile and mature). Likewise, oak varieties differ with regard to growth dynamics. Late QURO shows faster radial growth in the first years, whereas typical and early QURO varieties have similar radial growth chronologies. Although early QURO experiences a longer vegetation period (by one month) under optimal conditions, differences between early and latewood are smaller than differences noted between whole tree-ring measurements.
The analyzed QURO varieties exhibit different resistance, resilience, and recovery responses to drought. These responses also differ across growth phases. The early QURO variety shows better resistance, but late and typical varieties exhibit better recovery after drought events. In both juvenile and mature tree growth stages, all QURO varieties show sensitivity. All QURO varieties exhibited better performance during the juvenile growth phase.
In conclusion, the phenotypical differences observed in this common garden experiment should be of great relevance to both forestry practitioners and scientists. The observed differences show that the analyzed gene pool has the potential to produce drought-resistant but highly productive QURO specimens. An understanding of the range of phenotypical variety available may play an important role in helping forest managers shift from “classic” to “climate smart” forest management.

Author Contributions

Conceptualization, S.K., S.O. and D.B.S.; methodology, S.K., S.O. and D.B.S.; software, S.K.; formal analysis, S.K.; investigation, S.K., V.K., L.K. and M.Z.; data curation, S.K., V.K., L.K. and M.Z.; writing—original draft preparation, S.K.; writing—review and editing, all authors; supervision, S.O. All authors have read and agreed to the published version of the manuscript.

Funding

This research was supported by the Science Fund of the Republic of Serbia, PROMIS, #6066697, TreeVita (S.K., S.O., L.K. and D.B.S.), and by Ministry of Education, Science and Technological Development of the Republic of Serbia, grant number 451-03-9/2021-14/ 200197 (V.K., M.Z.).

Data Availability Statement

The data presented in this study are available from the corresponding author upon request.

Acknowledgments

We acknowledge the “Vojvodina šume” public enterprise.

Conflicts of Interest

The authors declare that they have no conflict of interest.

References

  1. Santopuoli, G.; Temperli, C.; Alberdi, I.; Barbeito, I.; Bosela, M.; Bottero, A.; Klopčič, M.; Lesinski, J.; Panzacchi, P.; Tognetti, R. Pan-European sustainable forest management indicators for assessing Climate-Smart Forestry in Europe. Can. J. For. Res. 2021, 51, 999. [Google Scholar] [CrossRef]
  2. Jandl, R.; Ledermann, T.; Kindermann, G.; Freudenschuss, A.; Gschwantner, T.; Weiss, P. Strategies for climate-smart forest management in Austria. Forests 2018, 9, 592. [Google Scholar] [CrossRef] [Green Version]
  3. Williams, M.I.; Dumroese, R.K. Preparing for climate change: Forestry and assisted migration. J. For. 2013, 111, 287–297. [Google Scholar] [CrossRef]
  4. Bowditch, E.; Santopuoli, G.; Binder, F.; del Río, M.; La Porta, N.; Kluvankova, T.; Lesinski, J.; Motta, R.; Pach, M.; Panzacchi, P.; et al. What is Climate-Smart Forestry? A definition from a multinational collaborative process focused on mountain regions of Europe. Ecosyst. Serv. 2020, 43, 101113. [Google Scholar] [CrossRef]
  5. Buras, A.; Sass-Klaassen, U.; Verbeek, I.; Copini, P. Provenance selection and site conditions determine growth performance of pedunculate oak. Dendrochronologia 2020, 61, 125705. [Google Scholar] [CrossRef]
  6. Orlović, S.; Šimunovački, D.; Djorđević, Z.; Pilipović, A.; Radosavljević, N. Očuvanje Genofonda I Proizvodnja Semena Hrasta Lužnjaka (Quercus robur L.). In 250 Godina Ravnog Srema; Vojvodinašume: Petrovaradin, Serbia, 2008; ISBN 978-86-906665-1-5. [Google Scholar]
  7. Ljubojević, M.; Sebolt, A.; Ognjanov, V.; Iezzoni, A. heritability of anatomical characteristics in cherry interspecific hybrids. J. Plant Growth Regul. 2021, 1–18. [Google Scholar] [CrossRef]
  8. Pellizzari, E.; Camarero, J.J.; Gazol, A.; Sangüesa-Barreda, G.; Carrer, M. Wood anatomy and carbon-isotope discrimination support long-term hydraulic deterioration as a major cause of drought-induced dieback. Glob. Chang. Biol. 2016, 22, 2125–2137. [Google Scholar] [CrossRef] [PubMed]
  9. Stojanović, D.B.; Levanič, T.; Matović, B.; Orlović, S. Growth decrease and mortality of oak floodplain forests as a response to change of water regime and climate. Eur. J. For. Res. 2015, 134, 555–567. [Google Scholar] [CrossRef]
  10. Zheng, W.; Gou, X.; Su, J.; Fan, H.; Yu, A.; Liu, W.; Deng, Y.; Manzanedo, R.D.; Fonti, P. Physiological and growth responses to increasing drought of an endangered tree species in Southwest China. Forests 2019, 10, 514. [Google Scholar] [CrossRef] [Green Version]
  11. Lévesque, M.; Walthert, L.; Weber, P. Soil nutrients influence growth response of temperate tree species to drought. J. Ecol. 2016, 104, 377–387. [Google Scholar] [CrossRef]
  12. Kostić, S.; Kesić, L.; Matović, B.; Orlović, S.; Srđan, S.; Stojanović, D.B. Soil properties are significant modifiers of pedunculate oak (Quercus robur L.) radial increment variations and their sensitivity to drought. Dendrochronologia 2021, 67, 125838. [Google Scholar] [CrossRef]
  13. Losseau, J.; Jonard, M.; Vincke, C. Pedunculate oak decline in southern Belgium: A long-term process highlighting the complex interplay among drought, winter frost, biotic attacks, and masting. Can. J. For. Res. 2020, 50, 380–389. [Google Scholar] [CrossRef]
  14. Camarero, J.J.; Colangelo, M.; Gazol, A.; Azorín-Molina, C. Drought and cold spells trigger dieback of temperate oak and beech forests in northern Spain. Dendrochronologia 2021, 66, 125812. [Google Scholar] [CrossRef]
  15. Mölder, A.; Sennhenn-Reulen, H.; Fischer, C.; Rumpf, H.; Schönfelder, E.; Stockmann, J.; Nagel, R.V. Success factors for high-quality oak forest (Quercus robur, Q. petraea) regeneration. For. Ecosyst. 2019, 6. [Google Scholar] [CrossRef] [Green Version]
  16. Banković, S.; Medarević, M.; Pantić, D.; Petrović, N. National Forest Inventory of Republic of Serbia; Orlović, S., Ed.; Ministry of Agriculture, Forestry and Water Management: Belgrade, Serbia, 2008.
  17. Stojanović, D.; Levanič, T.; Matović, B.; Bravo-Oviedo, A. Climate change impact on a mixed lowland oak stand in Serbia. Ann. Silvic. Res. 2015, 39, 94–99. [Google Scholar] [CrossRef]
  18. Euforgen Distribution Map of Pedunculate Oak (Quercus robur). Available online: http://www.euforgen.org (accessed on 15 May 2021).
  19. Josifović, M. Flora SR Serbia; Serbian Academy of Sciences and Arts: Belgrade, Serbia, 1977. [Google Scholar]
  20. Wenden, B.; Mariadassou, M.; Chmielewski, F.M.; Vitasse, Y. Shifts in the temperature-sensitive periods for spring phenology in European beech and pedunculate oak clones across latitudes and over recent decades. Glob. Chang. Biol. 2020, 26, 1808–1819. [Google Scholar] [CrossRef]
  21. Batos, B. Diversity of Pedunculate Oak (Quercus robur L.); Foundation Andrejević: Belgrade, Serbia, 2012; ISBN 1450-801X. [Google Scholar]
  22. Bobinac, M.; Batos, B.; Miljković, D.; Radulović, S. Polycyclism and phenological variability in the common oak (Quercus robur L.). Arch. Biol. Sci. 2012, 64, 97–105. [Google Scholar] [CrossRef]
  23. Batos, B. Population and Individual Variability of Chemical Markers-Flavonoid and Morpho-Anatomical Characteristics of the Pedunculate Oak (Quercus robur L.). Ph.D. Thesis, Unoversity of Novi Sad, Novi Sad, Serbia, 2012. [Google Scholar]
  24. Karazac, J. Kasni (pozni) hrast (Quercus pedunculata var. tardissima Simonkai). Šumarski List. 1898, 22, 41–53. [Google Scholar]
  25. Puchałka, R.; Koprowski, M.; Gričar, J.; Przybylak, R. Does tree-ring formation follow leaf phenology in pedunculate oak (Quercus robur L.)? Eur. J. For. Res. 2017, 136, 259–268. [Google Scholar] [CrossRef] [Green Version]
  26. Wesołowski, T.; Rowiǹski, P. Late leaf development in pedunculate oak (Quercus robur): An antiherbivore defence? Scand. J. For. Res. 2008, 23, 386–394. [Google Scholar] [CrossRef]
  27. Rubtsov, V.V.; Utkina, I.A. Adaptatsionnyye Reaktsii Duba na Defoliatsiyu; GRIF: Angarsk, Russia, 2008. [Google Scholar]
  28. Izdebski, K. Wstępne badania nad ekologią i rozmieszczeniem dębu szypułkowego (Quercus robur L.) w Polsce. Sylwan 1956, 11, 415–506. [Google Scholar]
  29. Koval, I.M.; Kostyashkin, D.C. The influence of climate and recreation on formation of layers of annual wood of early and late forms Quercus robur L. in Kharkiv Greenbelt. Sci. Bull. UNFU 2015, 25, 52–58. [Google Scholar]
  30. Utkina, I.A.; Rubtsov, V.V. Studies of phenological forms of pedunculate oak. Contemp. Probl. Ecol. 2017, 10, 804–811. [Google Scholar] [CrossRef]
  31. Takamatsu, S.; Braun, U.; Limkaisang, S.; Kom-un, S.; Sato, Y.; Cunnington, J.H. Phylogeny and taxonomy of the oak powdery mildew Erysiphe alphitoides sensu lato. Mycol. Res. 2007, 111, 809–826. [Google Scholar] [CrossRef] [PubMed]
  32. Solla, A.; Moreno, G.; Malewski, T.; Jung, T.; Klisz, M.; Tkaczyk, M.; Siebyla, M.; Pérez, A.; Cubera, E.; Hrynyk, H.; et al. Phosphite spray for the control of oak decline induced by Phytophthora in Europe. For. Ecol. Manag. 2021, 2021, 118938. [Google Scholar] [CrossRef]
  33. Oszako, T. Oak declines in Europe’s forest-history, causes and hypothesis. In Recent Advances on Oak Health in Europe; Instytut Badawczy Leśnictwa (Forest Research Institute): Warsaw, Poland, 2000; pp. 11–41. [Google Scholar]
  34. Dobor, L.; Barcza, Z.; Hlásny, T.; Havasi, A.; Horváth, F.; Ittzés, P.; Bartholy, J. Bridging the gap between climate models and impact studies: The Foresee Database. Geosci. Data J. 2015, 2, 1–11. [Google Scholar] [CrossRef]
  35. McKee, T.B.; Doesken, N.J.; Kleist, J. The relationship of drought frequency and duration to time scales. In Proceedings of the 8th Conference on Applied Climatology, Anaheim, CA, USA, 17–22 January 1993. [Google Scholar]
  36. Fritts, H. Tree Rings and Climate; Blackburn Press: Caldwell, ID, USA, 2001. [Google Scholar]
  37. Wang, Y.; Zhang, R.; Zhou, Z. Radial variation of wood anatomical properties determines the demarcation of juvenile-mature wood in Schima superba. Forests 2021, 12, 512. [Google Scholar] [CrossRef]
  38. Schwarz, J.; Skiadaresis, G.; Kohler, M.; Kunz, J.; Schnabel, F.; Vitali, V.; Bauhus, J. Quantifying growth responses of trees to drought—A critique of commonly used resilience indices and recommendations for future studies. Curr. For. Rep. 2020, 6, 185–200. [Google Scholar] [CrossRef]
  39. Vannoppen, A.; Treydte, K.; Boeckx, P.; Kint, V.; Ponette, Q.; Verheyen, K.; Muys, B. Tree species diversity improves beech growth and alters its physiological response to drought. Trees Struct. Funct. 2020, 34, 1059–1073. [Google Scholar] [CrossRef]
  40. Lloret, F.; Keeling, E.G.; Sala, A. Components of tree resilience: Effects of successive low-growth episodes in old ponderosa pine forests. Oikos 2011, 120, 1909–1920. [Google Scholar] [CrossRef]
  41. Team, R.C. R: A Language and Environment for Statistical Computing; R Foundation for Statistical Computing: Vienna, Austria, 2013. [Google Scholar]
  42. Bunn, A.; Korpela, M.; Biondi, F.; Campelo, F.; Merian, P.; Qeadan, F.; Zang, C. Time series analysis in dplR. Process. dplR 2016.
  43. Wickham, H. Ggplot2. Wiley Interdiscip. Rev. Comput. Stat. 2011, 3, 180–185. [Google Scholar] [CrossRef]
  44. Kottek, M.; Grieser, J.; Beck, C.; Rudolf, B.; Rubel, F. World map of the Köppen-Geiger climate classification updated. Meteorol. Z. 2006, 15, 259–263. [Google Scholar] [CrossRef]
  45. Bjerknes, J. Atmospheric teleconnections from the equatorial Pacific. Mon. Weather Rev. 1969, 97, 526–535. [Google Scholar] [CrossRef]
  46. Bert, D.; Lebourgeois, F.; Ponton, S.; Musch, B.; Ducousso, A. Which oak provenances for the 22nd century in Western Europe? Dendroclimatology in common gardens. PLoS ONE 2020, 15, e0234583. [Google Scholar] [CrossRef] [PubMed]
  47. Netsvetov, M.; Sergeyev, M.; Nikulina, V.; Korniyenko, V.; Prokopuk, Y. The climate to growth relationships of pedunculate oak in steppe. Dendrochronologia 2017, 44, 31–38. [Google Scholar] [CrossRef]
  48. Hartl, C.; Düthorn, E.; Tejedor, E.; Kirchhefer, A.J.; Timonen, M.; Holzkämper, S.; Büntgen, U.; Esper, J. Micro-site conditions affect Fennoscandian forest growth. Dendrochronologia 2021, 65, 125787. [Google Scholar] [CrossRef]
  49. Mátyás, C. Adaptive pattern of phenotypic plasticity and inherent growth reveal the potential for assisted transfer in sessile oak (Quercus petraea L.). For. Ecol. Manag. 2021, 482. [Google Scholar] [CrossRef]
  50. McDowell, N.G.; Allen, C.D.; Anderson-Teixeira, K.; Aukema, B.H.; Bond-Lamberty, B.; Chini, L.; Clark, J.S.; Dietze, M.; Grossiord, C.; Hanbury-Brown, A.; et al. Pervasive shifts in forest dynamics in a changing world. Science 2020, 368. [Google Scholar] [CrossRef]
  51. Zhu, J.; Nakano, T.; Hirakawa, Y. Effects of radial growth rate on selected indices for juvenile and mature wood of the Japanese larch. J. Wood Sci. 2000, 46, 417–422. [Google Scholar] [CrossRef]
  52. McGowran, E.; Douglas, G.C.; Parkinson, M. Morphological and physiological markers of juvenility and maturity in shoot cultures of oak (Quercus robur and Q. petraea). Tree Physiol. 1998, 18, 251–257. [Google Scholar] [CrossRef] [Green Version]
  53. Vitasse, Y.; Bottero, A.; Cailleret, M.; Bigler, C.; Fonti, P.; Gessler, A.; Lévesque, M.; Rohner, B.; Weber, P.; Rigling, A.; et al. Contrasting resistance and resilience to extreme drought and late spring frost in five major European tree species. Glob. Chang. Biol. 2019, 25, 3781–3792. [Google Scholar] [CrossRef]
  54. Hilker, M.; Schmulling, T. Stress priming, memory, and signalling in plants. Plant Cell Environ. 2019, 753–761. [Google Scholar] [CrossRef]
  55. Wang, X.; Vignjevic, M.; Liu, F.; Jacobsen, S.; Jiang, D.; Wollenweber, B. Drought priming at vegetative growth stages improves tolerance to drought and heat stresses occurring during grain filling in spring wheat. Plant Growth Regul. 2015, 75, 677–687. [Google Scholar] [CrossRef]
  56. Nardini, A.; Lo Gullo, M.A.; Trifilò, P.; Salleo, S. The challenge of the Mediterranean climate to plant hydraulics: Responses and adaptations. Environ. Exp. Bot. 2014, 103, 68–79. [Google Scholar] [CrossRef]
  57. Venturas, M.D.; Sperry, J.S.; Hacke, U.G. Plant xylem hydraulics: What we understand, current research, and future challenges. J. Integr. Plant Biol. 2017, 59, 356–389. [Google Scholar] [CrossRef] [Green Version]
  58. Kostić, S.; Čukanović, J.; Orlović, S.; Ljubojević, M.; Mladenović, E. Allometric relations of sycamore maple (Acer pseudoplatanus) and its red leaf cultivar (A. pseudoplatanus “Atropurpureum”) in street and park habitats of Novi Sad (Serbia, Europe). J. For. 2019, 117, 114–127. [Google Scholar] [CrossRef]
  59. Pretzsch, H. The effect of tree crown allometry on community dynamics in mixed-species stands versus monocultures. A review and perspectives for modeling and silvicultural regulation. Forests 2019, 10, 810. [Google Scholar] [CrossRef] [Green Version]
  60. Dai, J.; Liu, H.; Wang, Y.; Guo, Q.; Hu, T.; Quine, T.; Green, S.; Hartmann, H.; Xu, C.; Liu, X.; et al. Drought-modulated allometric patterns of trees in semi-arid forests. Commun. Biol. 2020, 3, 1–8. [Google Scholar] [CrossRef] [PubMed]
  61. Hallgrímsson, B.; Katz, D.C.; Aponte, J.D.; Larson, J.R.; Devine, J.; Gonzalez, P.N.; Young, N.M.; Roseman, C.C.; Marcucio, R.S. Integration and the Developmental genetics of allometry. Integr. Comp. Biol. 2019, 59, 1369–1381. [Google Scholar] [CrossRef] [PubMed]
  62. Antin, C.; Pélissier, R.; Vincent, G.; Couteron, P. Crown allometries are less responsive than stem allometry to tree size and habitat variations in an Indian monsoon forest. Trees Struct. Funct. 2013, 27, 1485–1495. [Google Scholar] [CrossRef]
  63. Krejza, J.; Světlík, J.; Bednář, P. Allometric relationship and biomass expansion factors (BEFs) for above- and below-ground biomass prediction and stem volume estimation for ash (Fraxinus excelsior L.) and oak (Quercus robur L.). Trees Struct. Funct. 2017, 31, 1303–1316. [Google Scholar] [CrossRef]
  64. Biondi, F. From dendrochronology to allometry. Forests 2020, 11, 146. [Google Scholar] [CrossRef] [Green Version]
  65. Knight, J.; Harrison, S. The impacts of climate change on terrestrial Earth surface systems. Nat. Clim. Chang. 2013, 3, 24–29. [Google Scholar] [CrossRef]
Figure 1. Temperature, precipitation, and forestry aridity index (FAI) on annual (a,c,e) and monthly (b,d) scales for two 30-year timespans: 1950−1980 (▲) and 1990−2020 (●). The shaded area in (e) represents optimal QURO stand conditions.
Forests 12 00930 g001
Figure 2. A 6- (gray) and 12-month (black) August standardized precipitation indices (SPIs) for the period 2005−2020. The threshold for wet events is indicated by a blue horizontal line; the threshold for dry events is indicated by a yellow horizontal line. The representative drought events are indicated with dashed red lines.
Forests 12 00930 g002
Figure 3. E-QURO, T-QURO, and L-QURO (a) measured and (b) detrended tree-ring widths, (c) basal area increments, and detrended early- and latewood chronologies for (d) E-QURO, (e) T-QURO, and (f) L-QURO.
Forests 12 00930 g003
Figure 4. Principal component analysis (PCA) of (a) basal area increment (BAI); (b) tree-ring width (TRW); (c) early wood (EW); and (d) late wood (LW).
Forests 12 00930 g004
Figure 5. The (a) resistance, (b) resilience, and (c) recovery indices of QURO varieties during the 2012 and 2017 drought events with HSD Tukey post-hoc tests (p < 0.001). Also shown are the 5-year TRW chronologies during the two drought events for (d) E-QURO, (e) T-QURO, and (f) L-QURO.
Forests 12 00930 g005
Figure 6. Diameter at breast height (a), tree height (b), and crown width (c) of early, typical, and late QURO varieties, according to Tukey’s HSD range test results, at p < 0.05.
Forests 12 00930 g006
Figure 7. Allometric relationships between TH/DBH (a), CW/DBH (b), and CW/TH (c) for early, typical, and late QURO varieties as grouping variables, considered by OLS linear regression model, with 95% confidence interval.
Forests 12 00930 g007
Table 1. Climate conditions (average ± SD) at the analyzed site on longer timescales and during two representative drought events (2012 and 2017).
TimespanTEMP
(°C)
TEMPMAM
(°C)
TEMPJJA
(°C)
PRCP
(mm m−2)
PRCPMAM
(mm m−2)
PRCPJJA
(mm m−2)
1950–202014.47 ± 0.9814.75 ± 1.5124.47 ± 1.39684.0 ± 128.5165.1 ± 57.7207.8 ± 73.5
2005–202015.35 ± 0.8815.57 ± 1.2625.42 ± 1.6716.1 ± 145.7197.9 ± 73.3207.9 ± 88.5
201215.9216.0127.82568.0180.457.3
201715.9716.3327.44598.7178.5107.7
Table 2. Two-way ANOVA results for diameter at breast height (DBH), tree height (TH), and crown width (CW), with variety and half-sib as dependent variables.
DBHTHCW
FactorSSFpSSFpSSFp
Variety2179261.349.53 × 10−12 **18.052.480.09 NS147.1025.891.19 × 10−11 **
Half-sib5426.140.26 NS10.572.910.09 NS64.581.980.34 NS
Variety x half-sib13151.301.88 × 10−7 **48.476.670.00 **51.609.094.60 × 10−4 **
Residuals36,063 3142 2456
Note: SS—sum of squares; F—F-test; p—significance level; significance codes: (NS)—non-significant—p > 0.05; (**) p < 0.001.
Table 3. Linear regression model outputs for TH/DBH, CW/DBH, and CW/TH allometric relationships.
RelationshipVarietynabAdj. r2F (p)
TH/DBHE-QURO3105.470.190.41217.8 **
T-QURO2915.820.130.2387.0 **
L-QURO2704.740.190.39174.0 **
CW/DBHE-QURO3102.710.220.67629.1 **
T-QURO2913.450.190.61451.5 **
L-QURO2703.190.210.67560.6 **
CW/THE-QURO3103.070.430.2499.7 **
T-QURO2914.610.450.2280.4 **
L-QURO2703.470.500.38159.9 **
Note: n—sample number; a and b—regression parameters; Adj. r2—coefficient of determination; F (p)—Fisher test with significance level; significance code: (**)—p < 0.001.
Publisher’s Note: MDPI stays neutral with regard to jurisdictional claims in published maps and institutional affiliations.

