Article

Study on the Genetic Structure Based on Geographic Populations of the Endangered Tree Species: Liriodendron chinense

1
Co-Innovation Center for Sustainable Forestry in Southern China, Nanjing Forestry University, Nanjing 210037, China
2
The Key Laboratory of Horticultural Plant Genetic and Improvement of Jiangxi Province, Institute of Biological Resources, Jiangxi Academy of Sciences, Nanchang 330096, China
*
Author to whom correspondence should be addressed.
Peng-Yan Zhou and Li-Xing Hui contributed equal.
Forests 2021, 12(7), 917; https://doi.org/10.3390/f12070917
Submission received: 21 June 2021 / Revised: 9 July 2021 / Accepted: 12 July 2021 / Published: 14 July 2021

Abstract

:
Liriodendron chinense (Hemsley) Sargent is a Class II protected plant in China as natural populations are on the verge of extinction. There is still a lack of systematic research on the genetic resources of its geographic populations. In this study, we used 20 pairs of SSR markers with high polymorphism to analyze a total of 808 L. chinense samples from 22 regions, and 63 Liriodendron tulipifera Linn samples from 2 regions were used as a comparison group. The results revealed a total of 78 alleles in L. chinense, and the average expected heterozygosity (He) was 0.558, showing a low level of genetic diversity. The degree of differentiation of L. chinense was high, with the differentiation coefficient (Fst) as high as 0.302, which is related to the low gene flow (Nm = 0.578). Based on the genetic structure, principal coordinate analysis (PCoA) and phylogenetic analysis of 24 Liriodendron spp. populations, L. chinense and L. tulipifera had obvious differentiation, while the differentiation between L. chinense geographic populations was very large and irregular. Inbreeding appears within the geographic populations, and the level of genetic diversity is very low. In order to protect the genetic diversity of L. chinense, in addition to protecting the existing population as much as possible, artificial cultivation should introduce materials from multiple populations.

1. Introduction

The climate oscillations and topographical changes of the Late Tertiary and Quaternary have profound influences on the geographical distribution and genetic structure of species. During the glacial periods, species retreated to refugium where the conditions were stable and diverse, so that their genetic resources could be preserved [1]. After glacial periods, species migrate and expand from refugiums to other suitable regions. Central China (25°47′~33°20′ N, 103°30′~111°50′ E) was an important glacial refugium for many Tertiary relict species due to the influence of the warm and humid climate in the Sichuan Basin and the Yunnan-Guizhou Plateau [2].
As a primitive group of angiosperms, Magnoliaceae plants are ideal natural resources for studying the origin, distribution and evolution of flowering plants [3,4]. The genus Liriodendron (Magnoliaceae), which is a relict species of the tertiary period, was widely distributed in the northern region of the Northern Hemisphere during the early to mid-Miocene but became extinct in Europe during the Pleistocene. There are only two sister species, Liriodendron tulipifera Linn and Liriodendron chinense (Hemsley) Sargent, of this genus [5], which are typical East Asian and North American intermittent distributions of “species pairs”. These trees are similar in shape and are famous for their rapid growth, valuable wood, and unique leaf shape, so they have important economic and ornamental value [6,7]. L. tulipifera is widely distributed in broad-leaved forests in the eastern United States and southeastern Canada, while L. chinense is scattered in the mountains of southern China and northern Vietnam. Due to its biological characteristics, including a small population, low seed setting rate and low seed germination rate, as well as climate change and human interference, L. chinense has become an endangered species [8].
Because L. chinense is endangered, studies on the conservation biology of L. chinense have been carried out, which mainly focus on the fields of reproductive ecology [9,10,11], population distribution [1,12,13], genetic diversity and genetic differentiation [14,15,16] and other fields. Regarding the geographical distribution of L. chinense, some research suggests that the two modern distribution centers of L. chinense are the area between 108–110° east longitude and 25–31° north latitude, which is called the western subregion, and the area between 116–120° east longitude and 28–31° north latitude, called the eastern subregion [17]; other areas are scattered. There is also a study that interprets the distribution of L. chinense as “one belt and five islands”, referring to a northeast-southwest distribution belt and south-central (1 “island”) and eastern (4 “islands”) areas, for a total of 5 island areas [18]. Although L. chinense presents scattered and intermittent geographical distribution characteristics, research on the genetic structure of its geographic populations is still incomplete from the perspective of population genetics.
Different genetic markers have been used to explore the genetic diversity and genetic structure of this species [19,20,21], but the results are often different. The main reason for these differences is that the markers involved are mostly dominant markers, such as Random Amplified Polymorphic DNA (RAPD), Amplified Fragment Length Polymorphism (AFLP), Inter-Simple Sequence Repeat (ISSR), etc., which may cause the loss of genetic information due to their inability to distinguish heterozygotes; although simple sequence repeats (SSR) that use codominance are also used as markers in research [22,23,24,25], due to the limited number of markers used and the lack of coverage of the geographic populations [14], it is difficult to provide comprehensive information on the characteristics of a given geographic population.
In this study, we collected 22 geographic populations from the main distribution areas of L. chinense. At the same time, two geographic populations of L. tulipifera were used as a comparison group, and 20 pairs of SSR markers were used to study geospatial genetic structure. This was the first time this research had been conducted using a large number of groups. We aimed to comprehensively study the status of genetic resources of L. chinense geographic populations from the perspective of population genetics, including the genetic diversity level and differentiation. Especially exploring the characteristics and reasons for the differentiation of the L. chinense geographic population, we hoped to provide a more reliable basis for formulating measures for the protection and utilization of L. chinense.

2. Materials and Methods

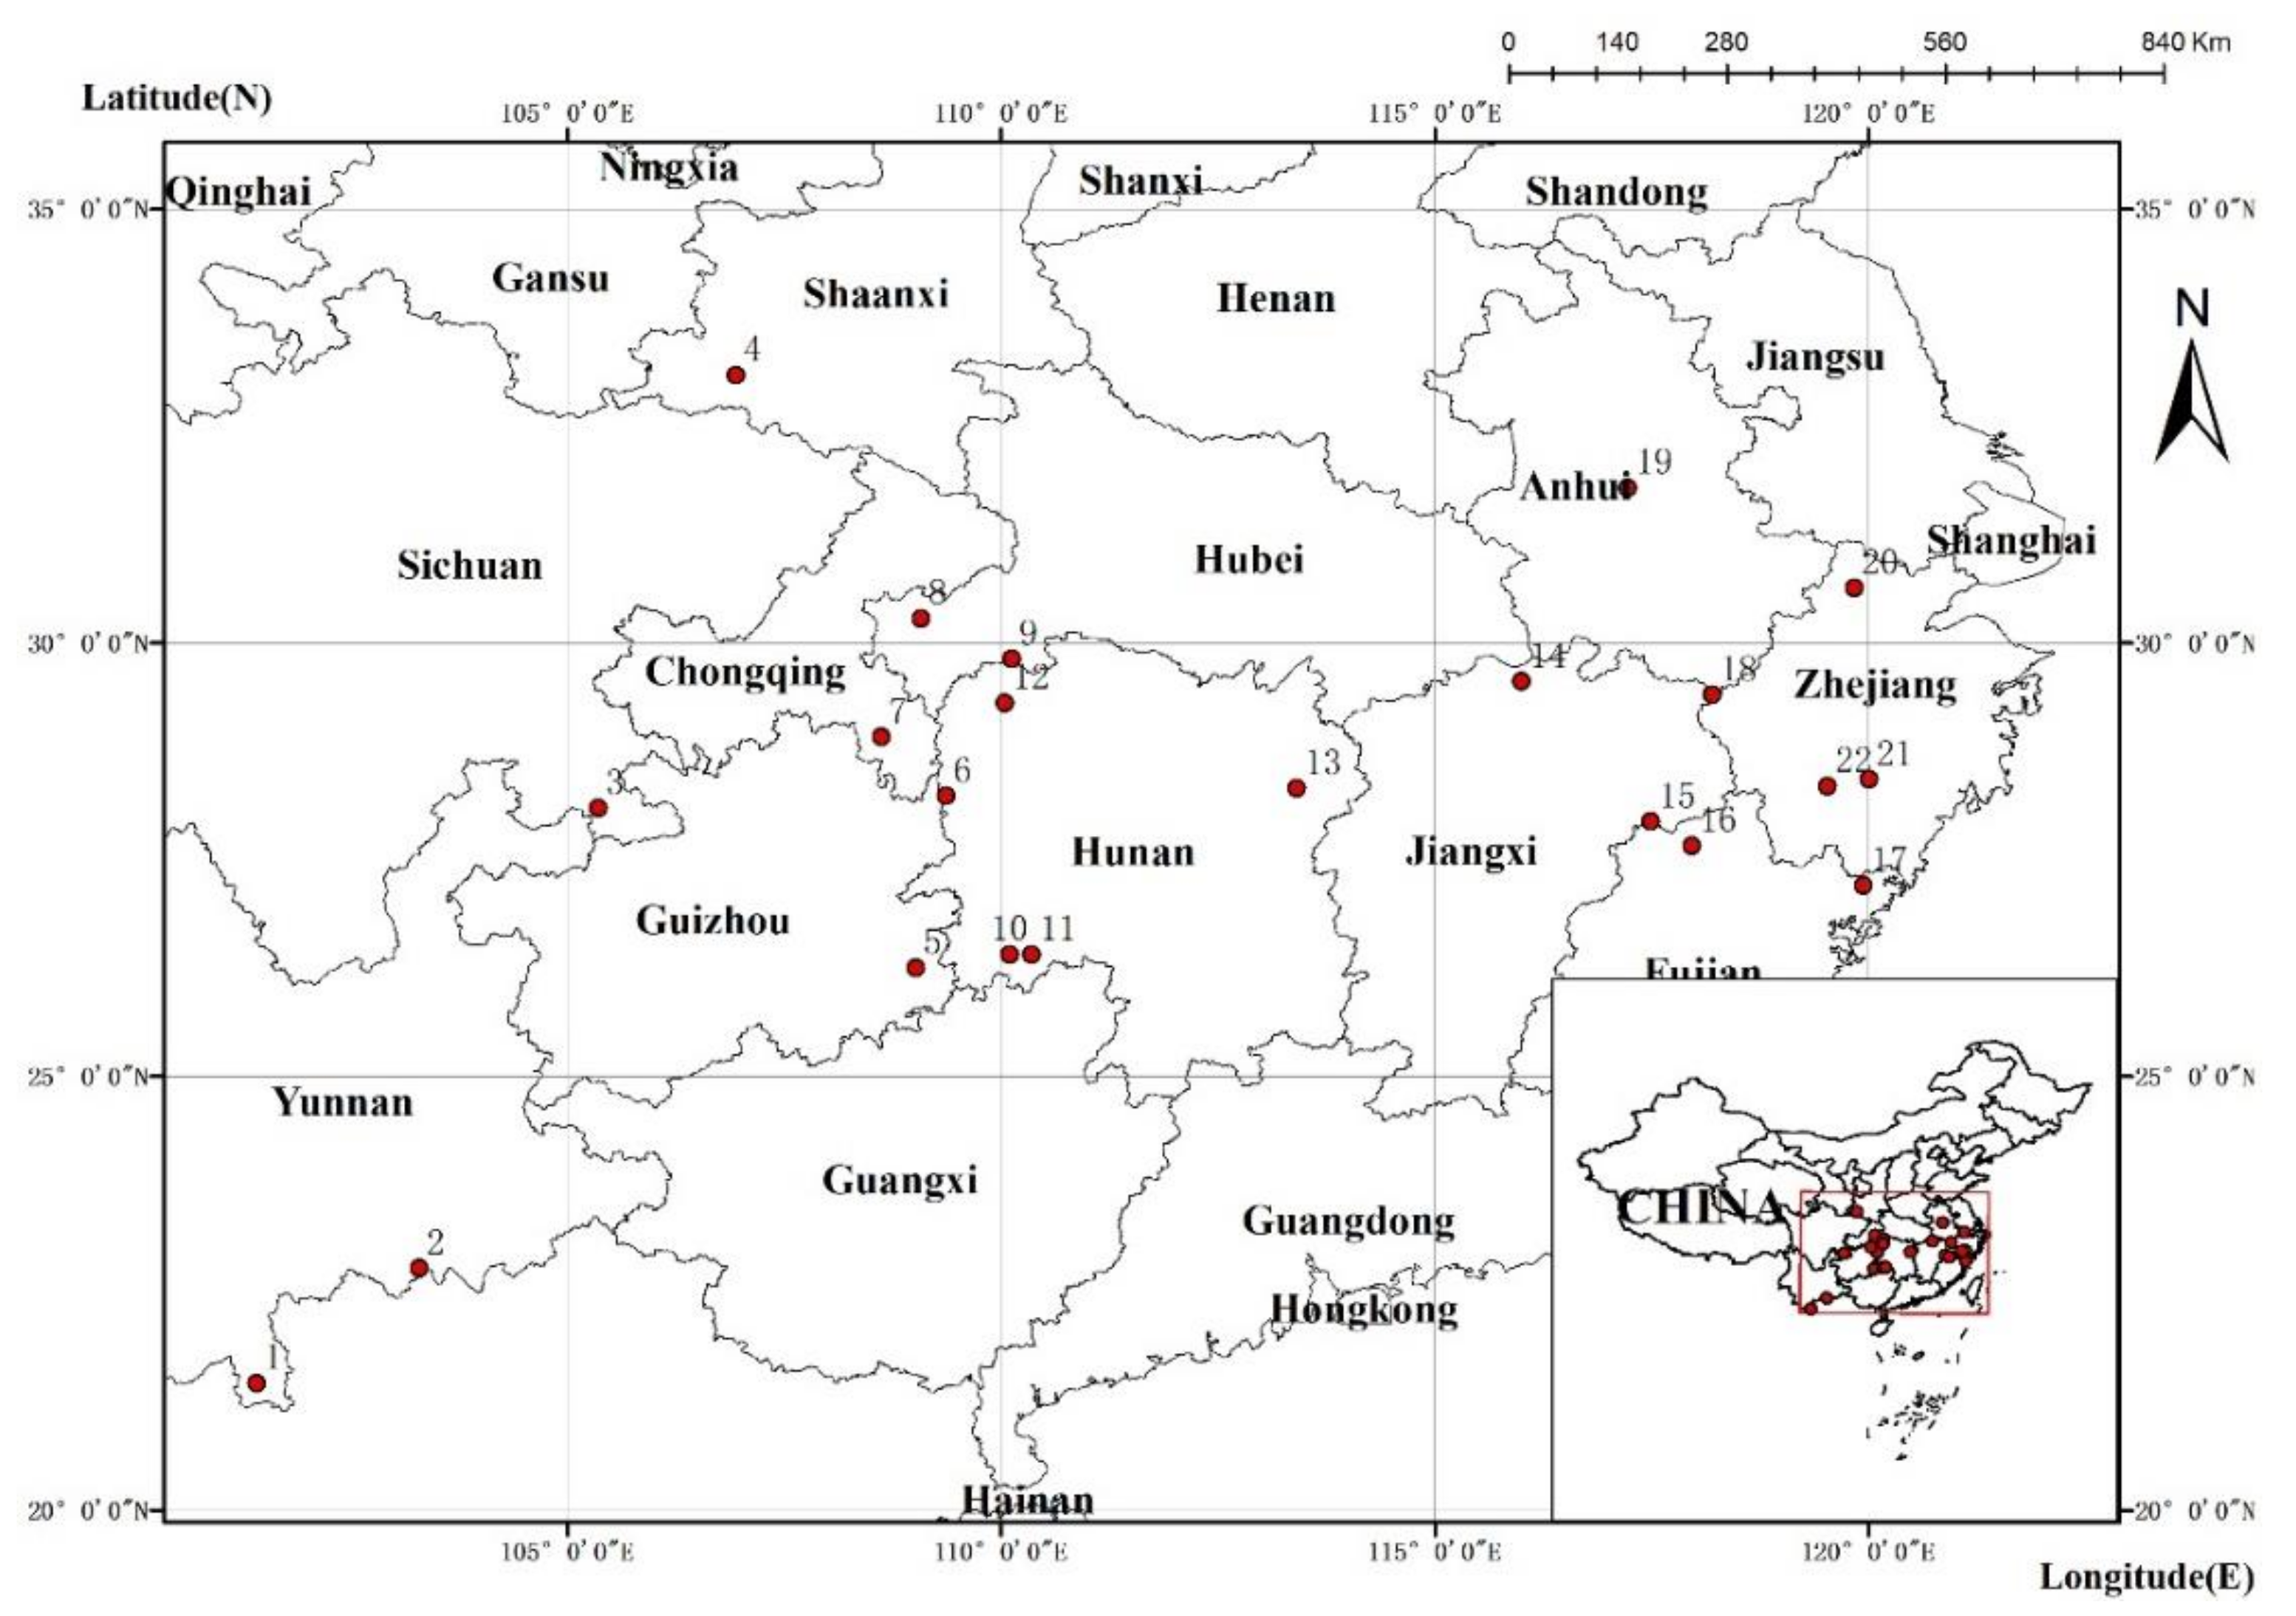
2.1. Plant Materials

From 2005 to 2006, a total of 22 L. chinense populations (Figure 1) were collected from 11 provinces (cities). Since most groups of L. chinense within its natural distribution area were small, there were very few large groups with more than 100 plants [18]. The larger geographic populations of L. chinense included those from Jinping, Yunnan (YJP), Liping, Guizhou (GLP), Monan, Guizhou (GMN) and Anji, Zhejiang (ZAJ) in this study. The remaining natural populations had less than 20 plants, of which 83% were small populations (less than 10 plants). For larger populations, it was necessary to select more than 15 plants (with an interval of more than 50 m apart). In groups of less than 10 plants, the seeds of all plants were mixed after collection. The collected seeds were sown in the germplasm resource nursery of Nanjing Forestry University (31°66′ N, 119°01′ E). Two L. tulipifera geographic populations (Louisiana, USA (LA), Missouri, USA (MO)) came from the provenance test forest of L. tulipifera at HuZhuaShan Forest Farm (112°90′ E, 31°08′ N) in Jingshan County, Hubei Province, China. Both places have a subtropical monsoon climate and a yellow brown soil type.
A total of 871 individuals were collected (Supplementary Materials Table S1), and samples of at least 30 plants were selected from each group (the sample sizes of the Mengla, Yunnan (YML), Hanzhong, Shaanxi (SHZ), Sangzhi, Hunan (HSZ), and Dabieshan, Anhui (ADB) groups were less than 30, so all were collected). The collected young leaves were quickly put into a Ziplock bag, preserved on dry ice, brought back to the laboratory, and stored at −80 °C.

2.2. DNA Extraction

Total genomic DNA was extracted using the hexadecyl trimentyl ammonium bromide (CTAB) method [26]. The DNA concentrations were estimated with a NanoDrop-1000 spectrophotometer (Nano Drop Technologies, Wilmington, DE, USA) and 1% agarose gel electrophoresis was used to check the quality of DNA. Qualified samples were stored in a −20 °C freezer until use.

2.3. EST-SSR Primers and PCR Amplification

From the 162 pairs of primers designed by our laboratory based on the expressed sequence tags (EST) of L. tulipifera in the NCBI database (https://www.ncbi.nlm.nih.gov/ (accessed on 21 June 2021)), 20 pairs of EST-SSR primers with high polymorphism were screened for this study. A list of the EST sequence data sources corresponding to 20 pairs of primers is found in Table S2. The primers were synthesized by Nanjing GenScript Biotechnology Co., Ltd. See Table S2 for details. Polymerase Chain Reaction (PCR) amplification for all EST-SSR markers was carried out using an ABI Veriti 96 PCR system (Thermo Fisher Scientific, MA, USA). The total volume of each single locus PCR was 10 μL, which consisted of 20 ng genomic DNA, 2.5 mM MgCl2, 0.2 mM dNTPs, 1 μL 10 × buffer, 0.2 μM each EST-SSR forward and reverse primer and 0.5 U Taq polymerase (Thermo Scientific). The PCR program involved an initial denaturation step of 4 min at 94 °C, followed by 30 cycles at 94 °C for 15 s, the appropriate annealing temperature for 15 s, and 72 °C for 30 s, an extension cycle of 5 min at 72 °C, and final storage at 4 °C. Fragments resulting from PCR amplifications were separated by electrophoresis on 8% polyacrylamide denaturing gels and visualized with silver nitrate staining. According to the band sizes of the PCR products (representative examples were shown in Supplementary Materials Figures S1–S4), the samples were represented by capital letters A, B, C, etc.

2.4. Analysis of Data

The number of observed alleles (Na), the number of efficient alleles (Ne), the observed heterozygosity (Ho), the expected heterozygosity (He), Nei’s diversity index (H), the genetic differentiation index (Fst), gene flow (Nm), Shannon’s information index (I) and inbreeding coefficient (F) [27] were determined using POPGENE version 1.32 software.
The polymorphism information content (PIC) and linkage disequilibrium (the construction of phylogenetic trees based on the unweight pair-group method with arithmetic means (UPGMA)) were calculated by using PowerMarker version 3.25 software [28]. Allelic richness (AR) was analyzed with FSTAT version 2.9.3 software [29]. Analysis of molecular variance (AMOVA) and principal coordinate analysis (PCoA) was carried out using GenAlEx version 6 software [30].
The population genetic structure was analyzed based on Bayesian clustering using STRUCTURE version 2.3.1 software [31]. For clustering from K = 1 to K = 25 (populations + 1), an admixture ancestry model and correlated allele frequency model were used to perform a Markov chain Monte Carlo simulation algorithm (MCMC) [32]. The length of the burn-in period at the start time was set as 100,000; the MCMC after the length of the burn-in period was set as 100,000, and for each K value, the simulation calculation was repeated 10 times. The method from Evanno [31] was used to determine the optimal K value and was implemented in STRUCTURE HARVESTER web version 0.6.94 [33]. The results were plotted using CLUMPP version 1.1.2 [34] and DISTRUCT version 1.1 [35]. NTSYS version 2.10 software [36] was used to perform Mantel test on the correlation between genetic distance and spatial geographic distance of 24 Liriodendron populations.

3. Results

3.1. Genetic Diversity of Different Geographic Populations

Twenty pairs of primers were used to detect 808 individuals from 22 L. chinense geographic populations. The results are shown in Table 1. A total of 78 alleles were amplified from L. chinense. The number of alleles per SSR locus varied from 2 to 5, with an average of 3.9 alleles per locus. The average Ne, He, and PIC were 2.582, 0.558, and 0.503, respectively, indicating that the 808 samples contained low levels of genetic diversity. Among the 20 pairs of SSR primers, the polymorphism level of LCEST-97 was the lowest, with the Ne, He, and PIC being 1.108, 0.017, and 0.017, respectively, and I had the lowest value of 0.05, while the Ne, He, and PIC at LCEST-61 were 3.772, 0.735, and 0.687, respectively, and I had the highest value of 1.411. The polymorphism level of this site was the highest. These 20 pairs of SSR primers could be effectively amplified in 63 individuals of L. tulipifera, but the polymorphism of the loci was different, and the polymorphism of the LCEST-119 locus was the highest (Table S3).
In general, the genetic diversity of the 22 geographic populations of L. chinense varied greatly. The He fluctuated from 0.177 to 0.539 (Table 2). In terms of the populations, the average genetic diversity of L. chinense (average He = 0.399) was lower than that of L. tulipifera (average He = 0.454). Among them, the Chengbu, Hunan (HCB) population had the highest genetic diversity, with the largest Ne = 2.391, H = 0.532, and He = 0.539. It may be that HCB is located in a refuge in central China and retains a high level of genetic diversity; second was HSZ, which had the largest AR = 2.985. The YML population had the lowest level of genetic diversity, and lowest detected Ne (1.333), H (0.170), and He (0.177). Second, the Zherong, Fujian (FZR) population had the lowest genetic diversity, with the lowest Na = 1.550 and AR = 1.495. One possible reason for these findings might be that YML and FZR are small groups (the number of natural groups was less than 10).
The average F of the 22 L. chinense geographic populations was 0.337. Except for the Lichuan, Hubei (HLC) group (F = −0.093), the rest of the L. chinense populations showed F > 0, indicating that most of the populations were heterozygous. However, the average Ho (0.262) of the 22 L. chinense geographic populations was less than He (0.399), which indicated that mating within the L. chinense geographic population was imbalanced and inbreeding occurred.

3.2. Genetic Differentiation among Geographic Populations

The average Fst of L. chinense was 0.302 (Table 1). The results of AMOVA (Table S4) showed significant genetic differences among geographic populations, which was inferred to result from distribution in island-like populations, and most populations were small. According to Fang [17], the geographic populations of L. chinense were divided into western subregion and eastern subregion; the Nei standard genetic distance between the regions was not large, much smaller than the genetic distance between the two geographic populations of L. tulipifera (Table S5). The results showed that the genetic differentiation of L. chinense and L. tulipifera was obvious.

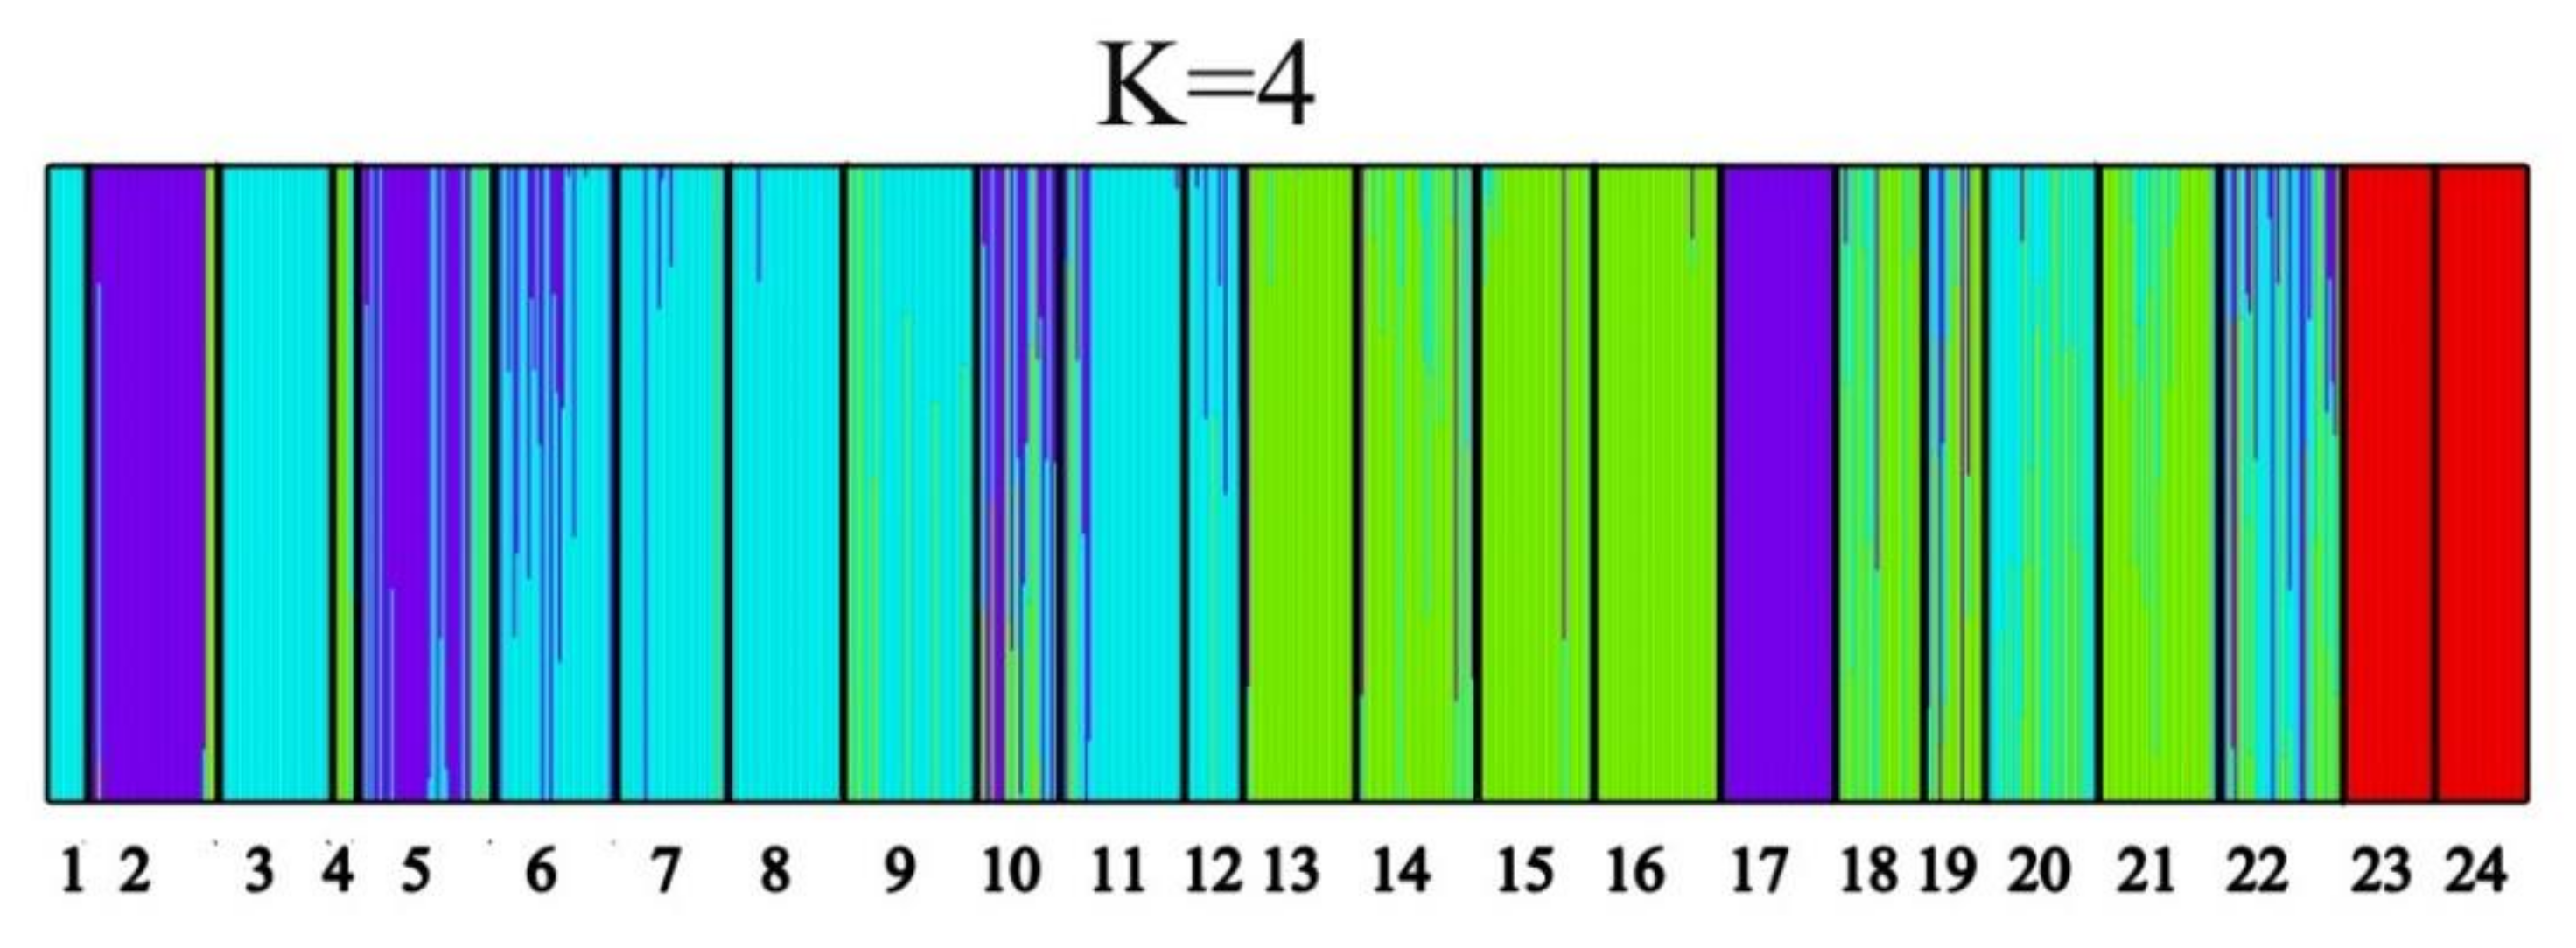
3.3. Genetic Structure of Geospatial
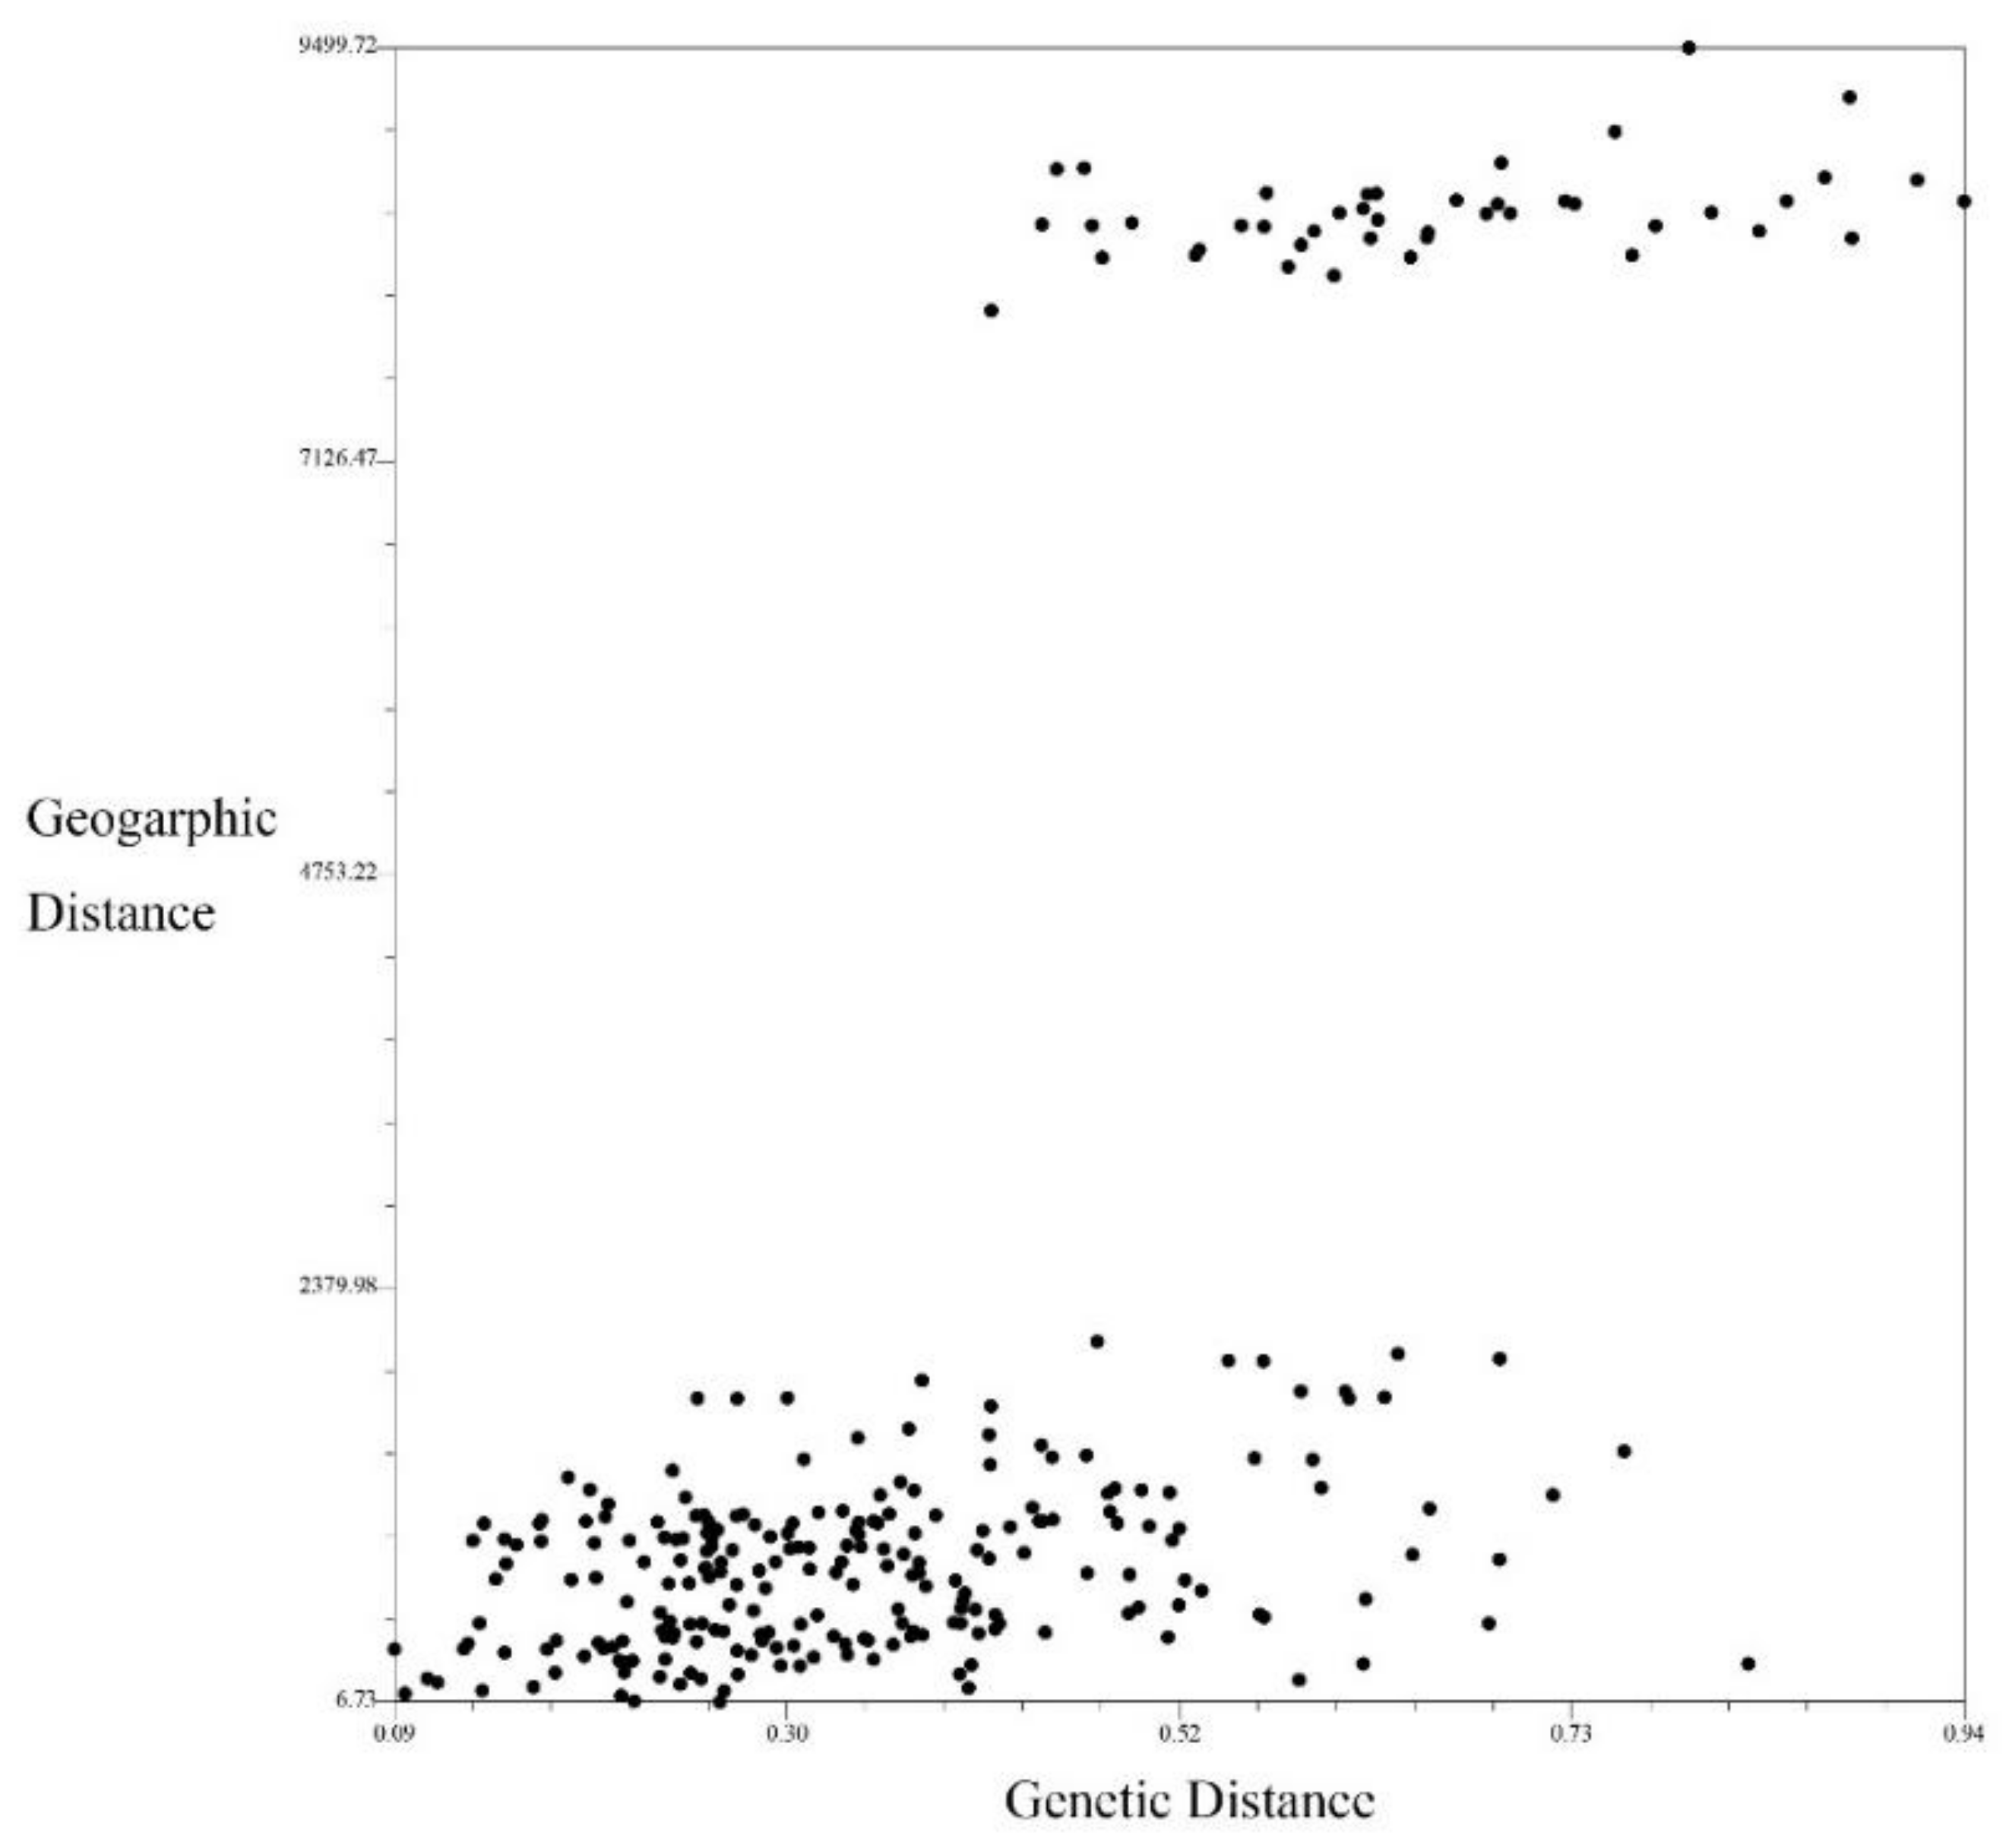
To further study the genetic structure of L. chinense geographic populations, STRUCTURE software was used to analyze the common ancestral relationship of the L. chinense geographic populations based on a Bayesian clustering model. The research results show that when the ΔK value reached the maximum value (Figure S5), the corresponding best K value was 21, which could be divided into 21 groups according to genetic information (Figure S6). The two geographic populations of L. tulipifera (LA, MO) had the same origin, while the diversification among the geographic populations of L. chinense was very large. Only Wuyishan, Jiangxi (JWY) and Wuyishan, Fujian (FWY), ADB and Lishui, Zhejiang (ZLS) had relatively close origins, while the other geographic populations had no consistent genetic information.
When K = 4, ΔK was the second largest value, and its structure map could divide the 24 groups into 4 groups (Figure 2). The L. tulipifera population (LA, MO) was still a single group, while the L. chinense geographic populations could be divided into 3 groups, but the rule between and within groups could not be found, indicating random differentiation.
Similarly, the results of the phylogenetic tree (Figure S7) based on the UPGMA method and PCoA (Figure S8) further illustrated the irregularity of the differentiation and geographical distribution among the geographic populations. Although, the structure and differentiation analysis (STRUCTURE (Figure 2) and UPGMA (Figure S7)) showed that no. 6–7 and no. 10–12 were divided into the same group (the western group), no. 14–16 and no. 19–22 were put into the same group (the eastern group). The results provided some evidence of geographic differentiation between an eastern and a western group of L. chinense.

3.4. Mantel Test

A Mantel test was used on 24 Liriodendron groups to detect the correlation between geographic distance and genetic distance. The results showed that the spatial geographic distance after standardized logarithmic processing had an extremely significant correlation with the Nei standard genetic distance between 24 Liriodendron populations (Figure 3, r = 0.680, p < 0.01).

4. Discussion

4.1. Genetic Diversity of Different Geographic Populations

Genetic diversity can be used to measure the abundance of population variation and the ability of populations to adapt to the environment. The study of genetic diversity will provide a basis for the formulation of strategies for the protection and utilization of genetic resources, which is a prerequisite for the survival and development of populations. The degree of heterozygosity is expected to be proportional to the degree of locus variation, which can reflect the stability and abundance of population alleles. Regarding the study of the genetic diversity of the L. chinense populations, Li et al. [21] and Yang et al. [12] used dominant RAPD and AFLP markers to demonstrate that the genetic diversity levels of L. chinense were He = 0.257 and He = 0.174, respectively. Li et al. [37] used ISSR markers to verify a lower level of genetic diversity of L. chinense (the average Nei’s gene richness was 0.258). However, Li et al. [14] used 14 pairs of SSR markers to reveal that the genetic diversity of the 12 populations of L. chinense was high (average He = 0.612), which was different from the results obtained with the detection of 20 pairs of SSR polymorphic primers in this study (average He = 0.399). It may be that the progeny populations of the natural populations were used in this study, and not all the mother trees were fruit-bearing, so a lower genetic diversity was detected. Interpretation of the results of polyacrylamide gel electrophoresis could also lead to divergence of results. At the same time, the number of geographic populations involved in this study was very large, basically covering the entire distribution area of L. chinense, and these L. chinense geographic populations were mostly small groups (the number of natural populations was less than 10), which was also one of the reasons for the low level of genetic diversity.
At the species level, the genetic diversity of L. chinense was also low (He = 0.558). Compared with the results of other plant genetic diversity studies based on SSR markers, Quercus variabilis BI. (He = 0.707 [38]), Ginkgo biloba L. (He = 0.808 [39]), Quercus wutaishansea Mary (He = 0.754 [40]) and other plants had higher genetic diversity. This was related to the biological characteristics and current status of the distribution of L. chinense. Its scattered and intermittent distribution form and population size were very small. These geographic populations have been damaged to different degrees, resulting in lower genetic diversity. These findings also reflected the current endangered status of L. chinense and explained the importance of protecting its genetic diversity.

4.2. Genetic Differentiation among Geographic Populations

Natural selection is the most important evolutionary force leading to population differentiation, and gene flow is an important factor against selection. Wright believes that when Nm > 1, gene flow can prevent genetic differentiation between populations caused by genetic drift. Compared with other forest trees, the population differentiation level of L. chinense (Fst = 0.302) was much higher than that of Quercus variabilis BI. (Fst = 0.046) [41], Castanopsis fargesii Franch. (Fst = 0.031) [42], Pinus massoniana Lamb. (Fst = 0.072) [43] and other tree species. The differentiation results obtained in this study were similar to those of Li et al. [21] and Li et al. [36] (Fst = 0.3154 and Gst = 0.291, respectively) but higher than those of Li et al. [14] (Fst = 0.1956), who also used SSR markers, which may be related to the large number of groups in this study and many of them being small populations. L. chinense is an ancient relic plant, and its biological characteristics lead to low natural fecundity [44], mostly occurring in small groups [45] on high mountains at an altitude of 600 m to 1500 m. The mountain topography is complex, and the geographical distance between populations is large, so it is difficult to have gene exchange among populations. There was a certain degree of inbreeding, leading to a high degree of genetic differentiation.
The mantel test showed that the spatial geographic distance had an extremely significant correlation with genetic distance between 24 Liriodendron populations. There is a certain geographical gradual change in the genetic variation of L. chinense populations.
The genetic relationship between L. chinense and L. tulipifera could be traced back to the Miocene [17]. At that time, the genus Liriodendron had a diversified morphology and free mating between species. Since the late Miocene, the unified distribution area began splitting and disintegrating, resulting in geographical isolation, and differentiation of the two species from their respective ancestors; the differentiation time of L. chinense was earlier than that of L. tulipifera, and the two have a sister relationship. In terms of genetic relationships, the results of this study indicated that there was obvious genetic differentiation between L. chinense and L. tulipifera, which was consistent with the research results of Zhong et al. [15] and Chen et al. [16].

4.3. Genetic Structure of Geospatial

The distribution of genetic variation at the small scale within populations and the large-scale spatial distribution among populations is one of the important characteristics of the population genetic structure. Whether it was the eastern-western subregion or the distribution pattern of “one belt and five islands”, L. chinense was clustered and distributed in the large-scale spatial, which was largely affected by the climate fluctuations since the Tertiary. However, the accumulation of L. chinense in the mountains of central and eastern China was more closely related to the Quaternary and interglacial periods. Most of the habitats of L. chinense were high-altitude. Since the Tertiary, it had been relatively stable in geology and had not experienced the southward invasion of the Quaternary ice sheet.
The population genetic structure is inseparable from the biological evolution process. Based on the STRUCTURE software, cluster analysis of all individuals was based on the Bayesian model, in which the determination of the best K value is key. Evanno et al. [31] and others believed that it was difficult to obtain the correct K value using LnP(D), and the highest ΔK value was more reliable. In this study, when the ΔK value was the highest, the K value was 21. At this time, in addition to the two geographic populations of L. tulipifera, the L. chinense geographic populations were divided into 20 groups based on genetic composition. Except for the two geographic populations (JWY and FWY) located in different locations on WuYi Mountain, the geographical distance was very close, and there was no obvious differentiation; the population genetic information of ADB and ZLS was also similar, and these populations might have been introduced from the same place. The rest of the groups had different origins, and they were even more divided.
When the value of ΔK was the second highest, L. chinense populations were divided into three groups, and it was difficult to find the regularity of the relationship among L. chinense geographic populations. Li et al. [46] and Luo et al. [47] used RAPD markers to cluster L. chinense populations, but also found it difficult to classify L. chinense geographic populations by region. Although the markers used were different, they also proved that the genetic differentiation among L. chinense geographic populations was extremely large, and there was no rule to follow. The “island-like” distribution of the existing L. chinense populations resulted in mostly small populations, so the degree of inbreeding within the populations was high and the genetic isolation among the geographic populations resulted in random differentiation among the populations.

4.4. Conservation of L. chinense Genetic Resources

The discontinuous distribution pattern, population structure decline and specific requirements of the habitat reflect that L. chinense is an endangered species. The genetic diversity of the L. chinense geographic populations was low, and the degree of differentiation was high. There is little gene exchange between the populations due to geographical isolation, and the genetic basis is gradually narrowing. From the perspective of protection, the genetic diversity of this species must be maintained first, and the existing geographic populations should be protected if possible; second, the genetic diversity of populations should be improved. By promoting gene exchange among the populations, it is possible to introduce L. chinense from different geographic populations into suitable habitats and increase the genetic diversity of the artificial populations.

5. Conclusions

In this article, a large number of populations of L. chinense were used to study genetic diversity and genetic differentiation for the first time. The results found that the level of genetic diversity of L. chinense was relatively low, and a certain degree of inbreeding occurred within the population. L. chinense was clustered and distributed in the large-scale spatial area, which was largely affected by the climate fluctuations since the Tertiary. The distribution status of the existing L. chinense populations resulted in mostly small populations. Geographical isolation and genetic isolation among the geographic populations resulted in random differentiation among the populations, and it is difficult to have gene exchange among populations. This article puts forward the protection strategy of L. chinense from two aspects: on-site protection and introduction protection.

Supplementary Materials

The following are available online at https://www.mdpi.com/article/10.3390/f12070917/s1, Table S1. Geographical distribution of 22 L. chinense geographic populations and two L. tulipifera geographic populations, Table S2. Repeat motif, primer sequence, fragment size, Tm and data sources information for 20 EST-SSR loci, Table S3. Polymorphism information for 20 microsatellite loci amplified in L. tulipifera, Table S4. Analysis of molecular variance (AMOVA) in L. chinense, Table S5. Pairwise genetic distances between three regions of Liriodendron, Figure S1. LCEST-41 SSR amplification products of Chengbu, Hunan (HCB) population, Figure S2. LCEST-41 SSR amplification products of Lichuan, Hubei (HLC) population, Figure S3. LCEST-186 SSR amplification products of Chengbu, Hunan (HCB) population, Figure S4. LCEST-186 SSR amplification products of Lichuan, Hubei (HLC) population, Figure S5. Relationships between the number of clusters (K) and the corresponding ΔK statistics calculated according to ΔK (Evanno et al. 2005) based on STRUCTURE analysis, Figure S6. Population genetic structure based on the Bayesian clustering model among 871 samples at K = 21. Numbers correspond to the population numbers in Table 1, Figure S7. UPGMA tree based on Nei’s genetic distances. Numbers correspond to the population numbers in Table 1, Figure S8. Score plot generated using PCoA.

Author Contributions

Conceptualization, L.-A.X.; methodology, L.-X.H.; formal analysis, P.-Y.Z.; investigation, S.-J.H. and F.-X.Y.; data curation, Z.-X.N.; writing—original draft preparation, P.-Y.Z.; writing—review and editing, P.-Y.Z. All authors have read and agreed to the published version of the manuscript.

Funding

This research was funded by the Cultivation Plan of National S&T Award Reserve Project of Jiangxi Province (20192AEI91010), Key Research and Development projects of Jiangxi Province (20192ACB80011), and the Priority Academic Program Development of Jiangsu Higher Education Institutions (PAPD).

Institutional Review Board Statement

Not applicable.

Informed Consent Statement

Not applicable.

Data Availability Statement

The EST Sequence data comes from NCBI (https://www.ncbi.nlm.nih.gov/ (accessed on 21 June 2021)), accessions can be found in Table S1.

Acknowledgments

We are grateful to Zhang-Rong Wang for his help in sampling in the field and the laboratory work. We thank Ming Qi and Qi Zhou for their assistance with the analysis of experimental data and article writing.

Conflicts of Interest

The authors declare no conflict of interest.

References

  1. Shen, Y.; Cheng, Y.; Li, K.; Li, H. Integrating phylogeographic analysis and geospatial methods to infer historical dispersal routes and glacial refugia of Liriodendron chinense. Forests 2019, 10, 565. [Google Scholar] [CrossRef] [Green Version]
  2. Chen, D.M.; Kang, H.Z.; Liu, C.J. research progress of potential plant refuges in the quaternary ice age in mainland China. Bull. Bot. Res. 2011, 31, 623–632. [Google Scholar]
  3. Kim, S.; Koh, J.; Yoo, M.-J.; Kong, H.Z.; Hu, Y.; Ma, H.; Soltis, P.S.; Soltis, D.E. Expression of floral MADS-box genes in basal angiosperms: Implications for the evolution of floral regulators. Plant J. 2005, 43, 724–744. [Google Scholar] [CrossRef] [PubMed]
  4. Liang, H.Y.; Carlson, J.E.; Leebens-Mack, J.H.; Wall, P.K.; Muller, L.A.; Buzgo, M.; Landherr, L.L.; Hu, Y.; Di Loreto, D.S.; Ilut, D.C.; et al. An EST database for Liriodendron tulipifera L. floral buds: The first EST resource for functional and comparative genomics in Liriodendron. Tree Genet. Genomes 2008, 4, 419–433. [Google Scholar] [CrossRef]
  5. Parks, C.R.; Wendel, J.F. Molecular divergence between Asian and North American species of Liriodendron (Magnoliaceae) with implications for interpretation of fossil floras. Am. J. Bot. 1990, 77, 1243–1256. [Google Scholar] [CrossRef]
  6. Koo, B.W.; Kim, H.Y.; Park, N.; Lee, S.M.; Yeo, H.; Choi, I.G. Organosolv pretreatment of Liriodendron tulipifera and simultaneous saccharification and fermentation for bioethanol production. Biomass Bioenergy 2011, 35, 1833–1840. [Google Scholar] [CrossRef]
  7. Pan, J.; Zhang, C.L.; Shi, M.; Guo, F.; Liu, J.; Li, L.Z.; Ren, Q.; Tao, S.B.; Tang, M.H.; Ye, H.Y.; et al. Ethanol extract of Liriodendron chinense (Hemsl.) Sarg barks attenuates hyperuricemic nephropathy by inhibiting renal fibrosis and inflammation in mice. J. Ethnopharmacol. 2020, 264, 113278. [Google Scholar] [CrossRef] [PubMed]
  8. Zhang, F.Y.; Zhao, Y. Advance of study on Liriodendron. J. Yunnan Agric. Univ. 2005, 20, 697–701. [Google Scholar]
  9. Hao, Z.Y.; Wang, X.; Zong, Y.X.; Wen, S.Y.; Cheng, Y.L.; Li, H.G. Enzymatic activity and functional analysis under multiple abiotic stress conditions of a dehydroascorbate reductase gene derived from Liriodendron Chinense. Environ. Exp. Bot. 2019, 167, 103850. [Google Scholar] [CrossRef]
  10. Zhang, W.W.; Niu, J.F.; Wang, X.K.; Tian, Y.; Yao, F.F.; Feng, Z.Z. Effects of ozone exposure on growth and photosynthesis of the seedlings of Liriodendron chinense (Hemsl.) Sarg, a native tree species of subtropical China. Photosynthetica 2011, 49, 29–36. [Google Scholar] [CrossRef]
  11. Xu, X.; Zhang, H.; Xie, T.; Xu, Y.; Zhao, L.; Tian, W. Effects of climate change on the potentially suitable climatic geographical range of Liriodendron chinense. Forests 2017, 8, 399. [Google Scholar] [CrossRef] [Green Version]
  12. Yang, A.-H.; Wei, N.; Fritsch, P.W.; Yao, X.-H. AFLP genome scanning reveals divergent selection in natural populations of Liriodendron chinense (Magnoliaceae) along a latitudinal transect. Front. Plant Sci. 2016, 7, 698. [Google Scholar] [CrossRef] [Green Version]
  13. Yang, A.; Zhong, Y.; Liu, S.; Liu, L.; Liu, T.; Li, Y.; Yu, F. New insight into the phylogeographic pattern of Liriodendron chinense (Magnoliaceae) revealed by chloroplast DNA: East-west lineage split and genetic mixture within western subtropical China. Peer J. 2019, 7, e6355. [Google Scholar] [CrossRef] [Green Version]
  14. Li, K.; Chen, L.; Feng, Y.; Yao, J.; Li, B.; Xu, M.; Li, H. High genetic diversity but limited gene flow among remnant and fragmented natural populations of Liriodendron chinense Sarg. Biochem. Syst. Ecol. 2014, 54, 230–236. [Google Scholar] [CrossRef]
  15. Zhong, Y.; Yang, A.; Liu, S.; Liu, L.; Li, Y.; Wu, Z.; Yu, F. RAD-Seq Data Point to a Distinct Split in Liriodendron (Magnoliaceae) and Obvious East–West Genetic Divergence in Liriodendron chinense. Forests 2018, 10, 13. [Google Scholar] [CrossRef] [Green Version]
  16. Chen, J.; Hao, Z.; Guang, X.; Zhao, C.; Wang, P.; Xue, L.; Zhu, Q.; Yang, L.; Sheng, Y.; Zhou, Y.; et al. Liriodendron genome sheds light on angiosperm phylogeny and species–pair differentiation. Nat. Plants 2019, 5, 18–25. [Google Scholar] [CrossRef] [Green Version]
  17. Fang, Y.M. Geographical distribution and spatial pattern of Liriodendron chinense. J. Nanjing For. Univ. 1994, 18, 13–18. [Google Scholar]
  18. Hao, R.M.; He, S.A.; Tang, S.J.; Wu, S.P. Natural distribution and characteristics of Liriodendron chinense in China. J. Plant. Resour. Environ. 1995, 4, 1–6. [Google Scholar]
  19. Zhu, Q.-W.; Li, H.-G. [Comparison of genetic diversity among five mating types of Liriodendron revealed by SSR markers]. Yi Chuan Hered. 2010, 32, 183–188. [Google Scholar] [CrossRef]
  20. Yang, A.; Dick, C.W.; Yao, X.; Huang, H. Impacts of biogeographic history and marginal population genetics on species range limits: A case study of Liriodendron chinense. Sci. Rep. 2016, 6, 25632. [Google Scholar] [CrossRef] [Green Version]
  21. Li, J.M.; Zhou, Z.C.; Wu, K.Y.; Jin, G.Q. RAPD markers to study the genetic differentiation of the geographic populations of Liriodendron chinense. For. Sci. 2002, 38, 61–66. [Google Scholar]
  22. Li, B.; Lin, F.; Huang, P.; Guo, W.; Zheng, Y. Development of nuclear SSR and chloroplast genome markers in diverse Liriodendron chinense germplasm based on low-coverage whole genome sequencing. Biol. Res. 2020, 53, 1–12. [Google Scholar] [CrossRef]
  23. Long, X.; Weng, Y.; Liu, S.; Hao, Z.; Sheng, Y.; Guan, L.; Shi, J.; Chen, J.H. Genetic Diversity and Differentiation of Relict Plant Liriodendron Populations Based on 29 Novel EST-SSR Markers. Forests 2019, 10, 334. [Google Scholar] [CrossRef] [Green Version]
  24. Yaghuti, A.A.; Movahedi, A.; Mohammadi, K.; Zhuge, Q.; Li, H.G. Genetic diversity among a collection of L. chinense germplasm analyzed with SSR markers. J. Biochem. Microb. Toxicol. 2017, 1, 102. [Google Scholar]
  25. Yaghuti, A.A.; Movahedi, A.; Mohammadi, K.; Zhuge, Q.; Li, H.G. The genetic diversity of Liriodendron tulipifera germplasm revealed by SSR markers. J. Biochem. Microb. Toxicol. 2018, 2, 1000105. [Google Scholar]
  26. Cota-Sánchez, J.H.; Remarchuk, K.; Ubayasena, K. Ready-to-use DNA extracted with a CTAB method adapted for herbarium specimens and mucilaginous plant tissue. Plant Mol. Biol. Rep. 2006, 24, 161–167. [Google Scholar] [CrossRef]
  27. Nei, M. Definition and estimation of fixation indices. Evolution 1986, 40, 643–645. [Google Scholar] [CrossRef]
  28. Liu, K.J.; Muse, S.V. PowerMarker: An integrated analysis environment for genetic marker analysis. Bioinformatics 2005, 21, 2128–2129. [Google Scholar] [CrossRef] [Green Version]
  29. Goudet, J. FSTAT, a Program to Estimate and Test Gene Diversities and Fixation Indices, Version 2.9.3. 2001. Available online: http://www.unil.ch/popgen/softwares/fstat.htm (accessed on 20 June 2021).
  30. Peakall, R.; Smouse, P.E. Genalex 6: Genetic analysis in Excel. Population genetic software for teaching and research. Mol. Ecol. Notes 2006, 6, 288–295. [Google Scholar] [CrossRef]
  31. Evanno, G.; Regnaut, S.; Goudet, J. Detecting the number of clusters of individuals using the software STRUCTURE: A simulation study. Mol. Ecol. 2005, 14, 2611–2620. [Google Scholar] [CrossRef] [Green Version]
  32. Falush, D.; Stephens, M.; Pritchard, J.K. Inference of population structure using multilocus genotype data: Linked loci and correlated allele frequencies. Genetics 2003, 64, 1567–1587. [Google Scholar] [CrossRef]
  33. Earl, D.A.; von Holdt, B.M. STRUCTURE HARVESTER: A website and program for visualizing STRUCTURE output and implementing the Evanno method. Conserv. Genet. Resour. 2012, 4, 359–361. [Google Scholar] [CrossRef]
  34. Jakobsson, M.; Rosenberg, N.A. CLUMPP: A cluster matching and permutation program for dealing with label switching and multimodality in analysis of population structure. Bioinformatics 2007, 23, 1801–1806. [Google Scholar] [CrossRef] [PubMed] [Green Version]
  35. Rosenberg, N.A. Distruct: A program for the graphical display of population structure. Mol. Ecol. Notes. 2004, 4, 137–138. [Google Scholar] [CrossRef]
  36. Rohlf, F.J. NTSYS-pc: Numerical Taxonomy and Multivariate Analysis System, Version 2.2, 2.1; Department of Ecoloy and Evolution, State University of New York: New York, NY, USA, 2005. [Google Scholar]
  37. Li, L.M.; Shi, X.M.; Jiang, W.X.; Bai, T.D.; Meng, Y.Y.; Tan, F.Y.; Huang, S.X. ISSR Analysis of Genetic Diversity of the Natural Populations of Liriodendron chinense in Guangxi. Guangxi Plant 2017, 37, 22–28. [Google Scholar]
  38. Shi, X.; Wen, Q.; Cao, M.; Guo, X.; Xu, L.A. Genetic diversity and structure of natural Quercus variabilis population in china as revealed by microsatellites markers. Forests 2017, 8, 495. [Google Scholar] [CrossRef] [Green Version]
  39. Zhou, Q.; Mu, K.; Ni, Z.; Liu, X.; Li, Y.; Xu, L.-A. Analysis of genetic diversity of ancient Ginkgo populations using SSR markers. Ind. Crops Prod. 2020, 145, 111942. [Google Scholar] [CrossRef]
  40. Qin, Y.Y.; Han, H.R.; Kang, F.F.; Zhao, Q. Genetic diversity analysis of natural populations of Quercus wutaishansea in Shanxi Province based on SSR markers. J. Beijing For. Univ. 2012, 34, 61–65. [Google Scholar]
  41. Xu, X.L.; Xu, L.A.; Huang, M.R.; Wang, Z.R. Study on genetic diversity of Quercus variabilis natural population by SSR. Heredity 2004, 4, 683–688. [Google Scholar]
  42. Xu, L.A.; Li, X.J.; Pan, H.X.; Zou, P.Y.; Yin, T.M.; Huang, M.R. Study on the genetic structure of Castanopsis fargesii population by SSR. Chin. Bull. Bot. 2001, 43, 409–412. [Google Scholar]
  43. Feng, Y.H.; Li, H.G.; Yang, Z.Q.; Wu, D.S. Study on the genetic structure of natural populations of Pinus massoniana provenance. Guangxi Plant 2016, 36, 1275–1275, 1395. [Google Scholar]
  44. Huang, S.Q.; Guo, Y.H. Variation of pollination and resource limitation in a low seed-set tree, Liriodendron chinense (Magnoliaceae). Bot. J. Linn. Soc. 2002, 140, 31–38. [Google Scholar] [CrossRef] [Green Version]
  45. He, S.A.; Hao, R.M.; Tang, S.J. Study on the Ecological Factors of Liriodendron chinense Endangering. J. Plant. Resour. Environ. 1996, 5, 1–8. [Google Scholar]
  46. Li, J.M. Geographical Genetic Variations and Selection of Superior Provenances of Liriodendron chinense. For. Sci. 2001, 37, 41–49. [Google Scholar]
  47. Luo, G.Z.; Shi, J.S.; Yin, T.M.; Huang, M.R.; Wang, M.X. Analysis of genetic diversity between Liriodendron chinense and Liriodendron tulipifera using RAPD markers. J. Plant Resour. Environ. 2000, 2, 9–13. [Google Scholar]
Figure 1. Locations of the 22 geographic populations of L. Chinense. Numbers correspond to the population numbers in Table S1.
Forests 12 00917 g001
Figure 2. Population genetic structure based on the Bayesian clustering model among 871 samples at K = 4. Numbers correspond to the population numbers in Table S1.
Forests 12 00917 g002
Figure 3. Spatial genetic structure of 24 Liriodendron populations.
Forests 12 00917 g003
Table 1. Polymorphism information for 20 microsatellite loci amplified in L. chinense.
LocusNaNeHePICIFstNm
LCEST-4142.8990.6550.6021.2020.2730.666
LCEST-5341.4420.3070.2920.6500.1661.255
LCEST-5731.8300.4540.3710.7190.2670.687
LCEST-6032.9510.6620.5871.0900.3020.579
LCEST-6153.7720.7350.6871.4110.1651.262
LCEST-6241.6160.3820.3490.7020.2220.875
LCEST-6852.7750.6400.5761.1830.2560.727
LCEST-7552.2310.5520.5051.0320.3720.423
LCEST-8043.5190.7160.6621.3060.2980.588
LCEST-9721.0180.0170.0170.0500.0524.550
LCEST-10341.1690.1450.1380.3180.1251.756
LCEST-10443.4890.7140.6641.3180.3550.453
LCEST-10742.9460.6610.5911.1460.4300.332
LCEST-11932.9030.6560.5821.0830.1961.023
LCEST-13143.0190.6690.6161.2320.2590.715
LCEST-16942.6890.6290.5531.0560.4020.372
LCEST-18142.9100.6570.5841.1130.3620.442
LCEST-18442.7630.6390.5641.0590.3610.442
LCEST-18653.3980.7060.6491.2900.2200.889
LCEST-19532.3040.5660.4780.9200.5200.231
Mean3.92.5820.5580.5030.9940.3020.578
Na: Observed number of alleles, Ne: Effective number of alleles, He: Expected heterozygosity, PIC: Polymorphism information content, I: Shannon’s information index, Fst: Genetic differentiation index, Nm: Gene flow.
Table 2. Mean values of genetic diversity for 20 microsatellite loci in 22 L. chinense geographic populations and 2 L. tulipifera geographic populations.
SpeciesPopulation CodeNaNeHHoHeARF
L. chinense (Hemsl.) Sarg.YML1.6001.3330.1700.1000.1771.5550.434
YJP2.1501.3620.2260.1250.2291.9000.453
SXY2.6001.9100.3720.3200.3772.2860.150
SHZ2.6501.8620.4020.2220.4252.6500.477
GLP3.0502.0460.4290.2800.4342.6680.354
GMN2.5501.7450.3320.2230.3362.2070.337
CYY3.1502.1780.4800.3100.4862.8490.362
HLC2.8002.0250.4260.4710.4312.497−0.093
HHF2.8001.9080.4090.2170.4132.5420.476
HSN2.7502.0660.4300.1830.4372.6170.581
HCB3.1502.3910.5320.3840.5392.8840.288
HSZ3.2502.2510.5080.2950.5212.9850.433
HLY2.5501.7680.3430.2900.3472.2130.164
JLS2.7001.8700.3750.2230.3792.3650.412
JWY2.5501.8930.3990.2410.4042.3770.403
FWY2.3001.7020.3450.2780.3502.0640.206
FZR1.5501.3620.1940.1790.1961.4950.090
AHS3.2502.1650.4710.2940.4782.9380.386
ADB2.9502.0670.4720.2130.4842.7660.561
ZAJ3.2002.1410.4810.2850.4872.7960.415
ZLS2.7001.9070.4070.3300.4122.4560.198
ZSY3.3001.9870.4370.3010.4422.8900.318
mean2.7071.9060.3930.2620.3992.4550.337
L. tulipifera L.LA3.2502.2790.4730.3630.4812.9140.245
MO3.0002.2030.4200.3580.4272.7440.161
mean3.1252.2410.4460.3600.4542.8290.203
Ho: observed heterozygosity, H: Nei’s diversity index, AR: allelic richness, F: inbreeding coefficient.
Publisher’s Note: MDPI stays neutral with regard to jurisdictional claims in published maps and institutional affiliations.

