
Assessing Wood and Soil Carbon Losses from a Forest-Peat Fire in the Boreo-Nemoral Zone


Abstract
:1. Introduction
2. Materials and Methods
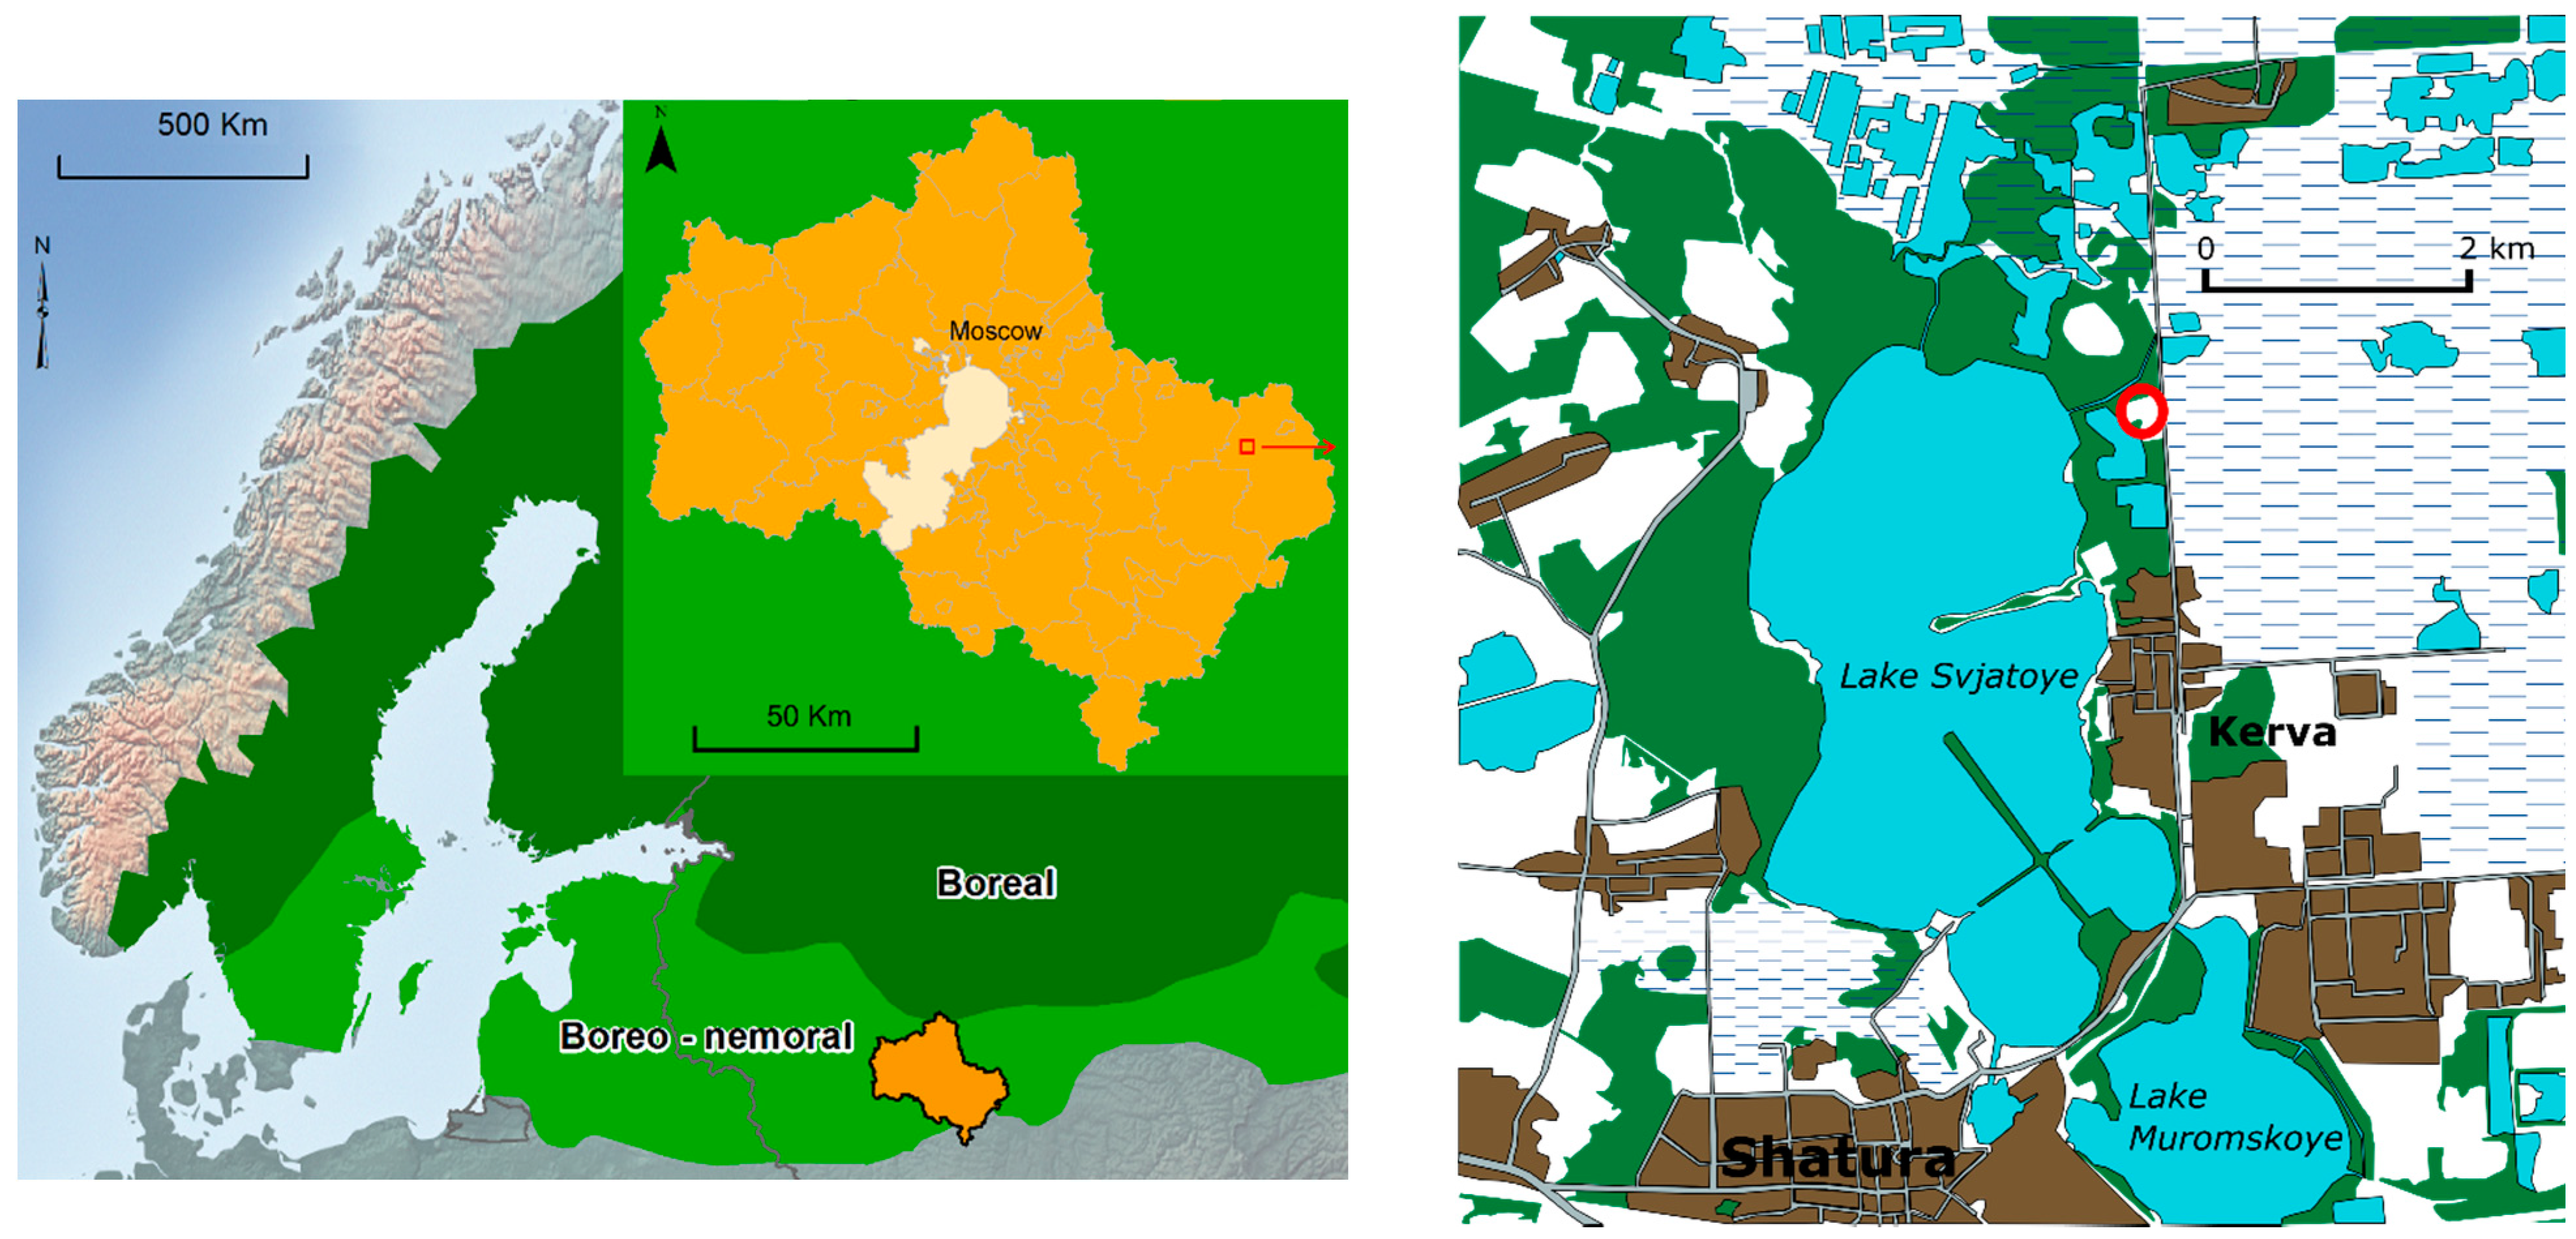
2.1. Study Area
2.2. Reconstruction of Forest Vegetation
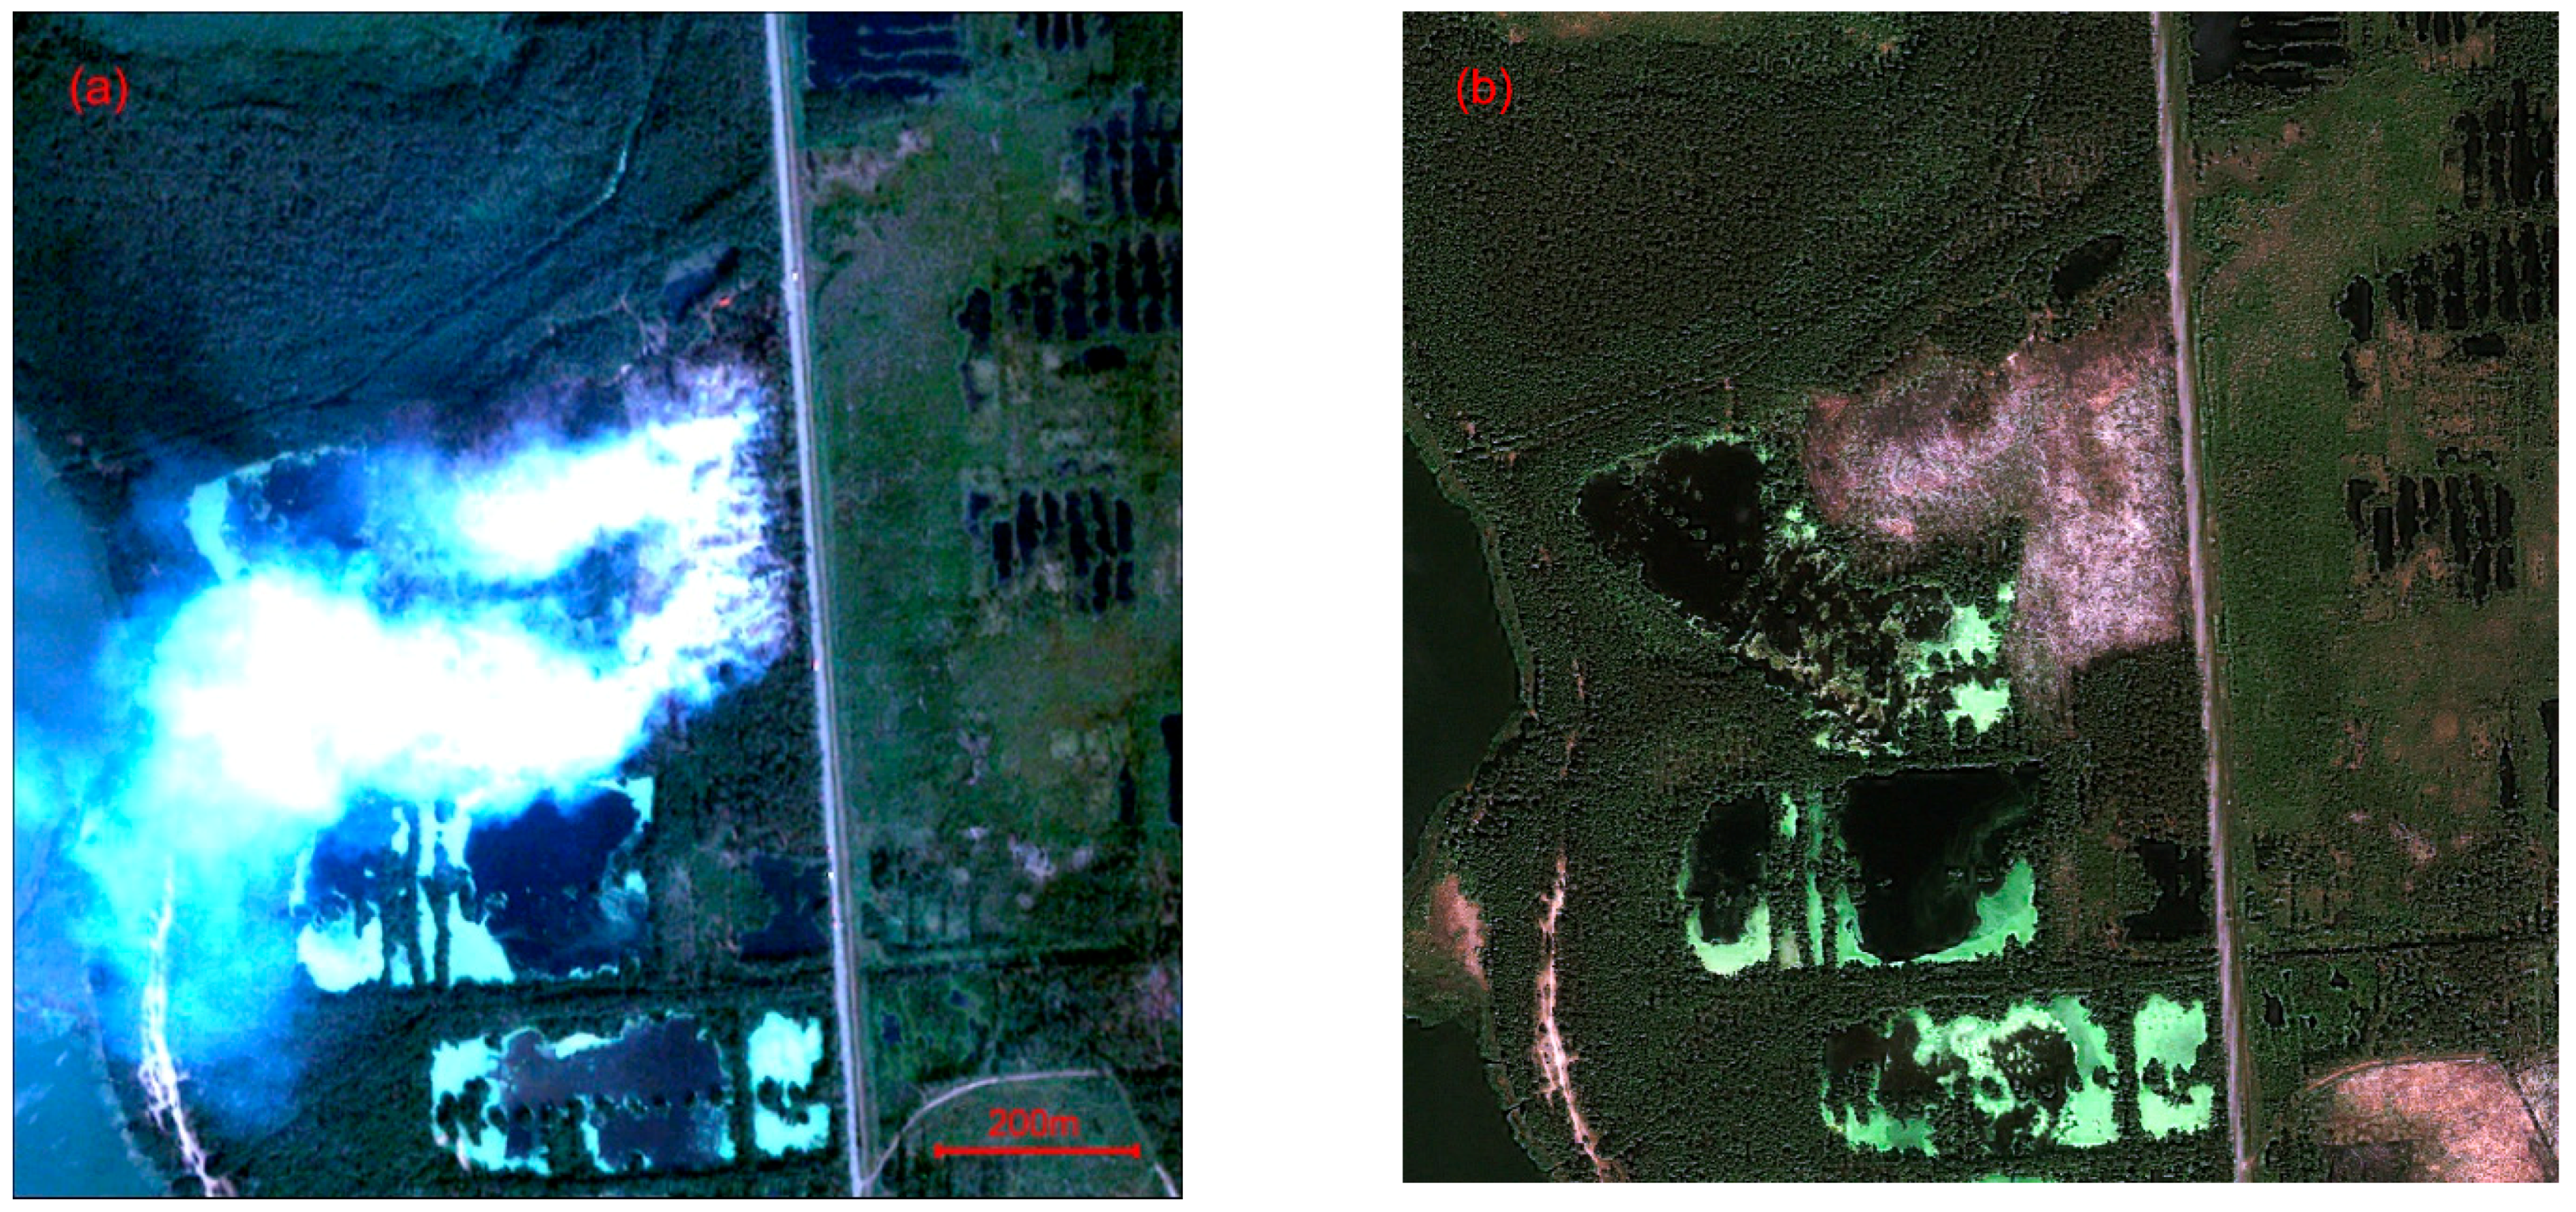
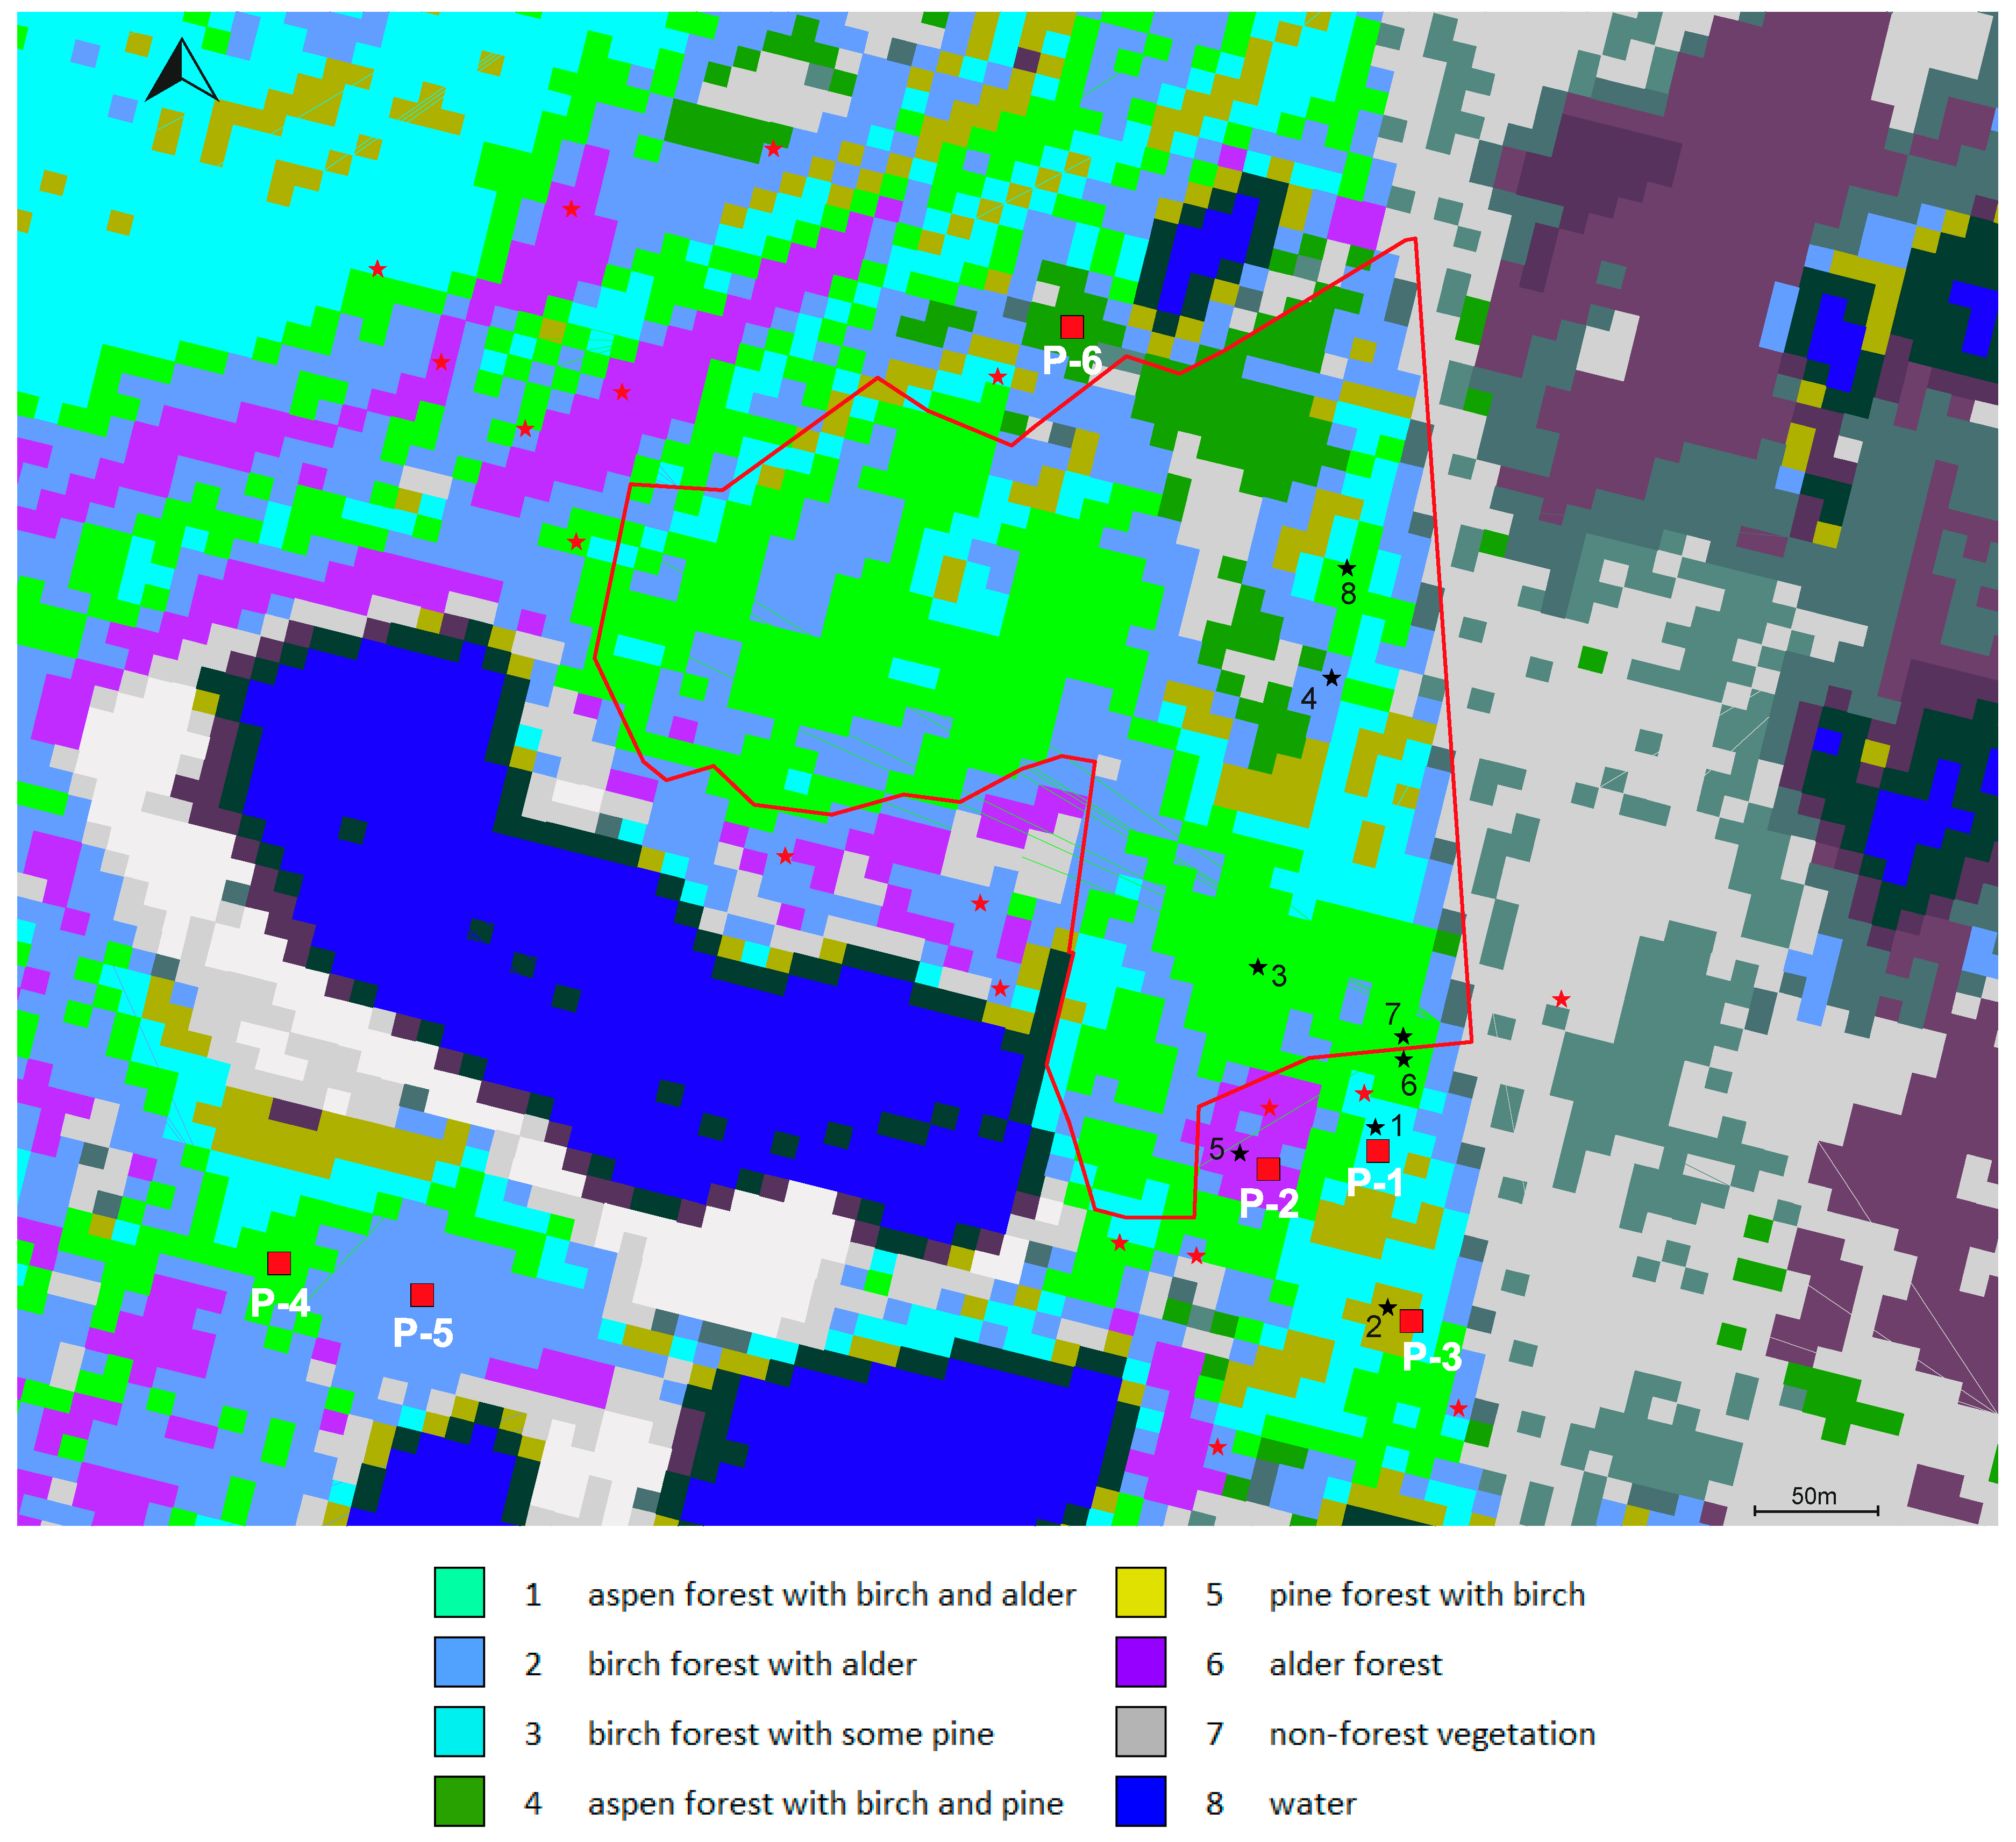
2.3. Classification of the Pre-Fire Satellite Image
2.4. Ground Truthing and Assessment of Biomass Loss
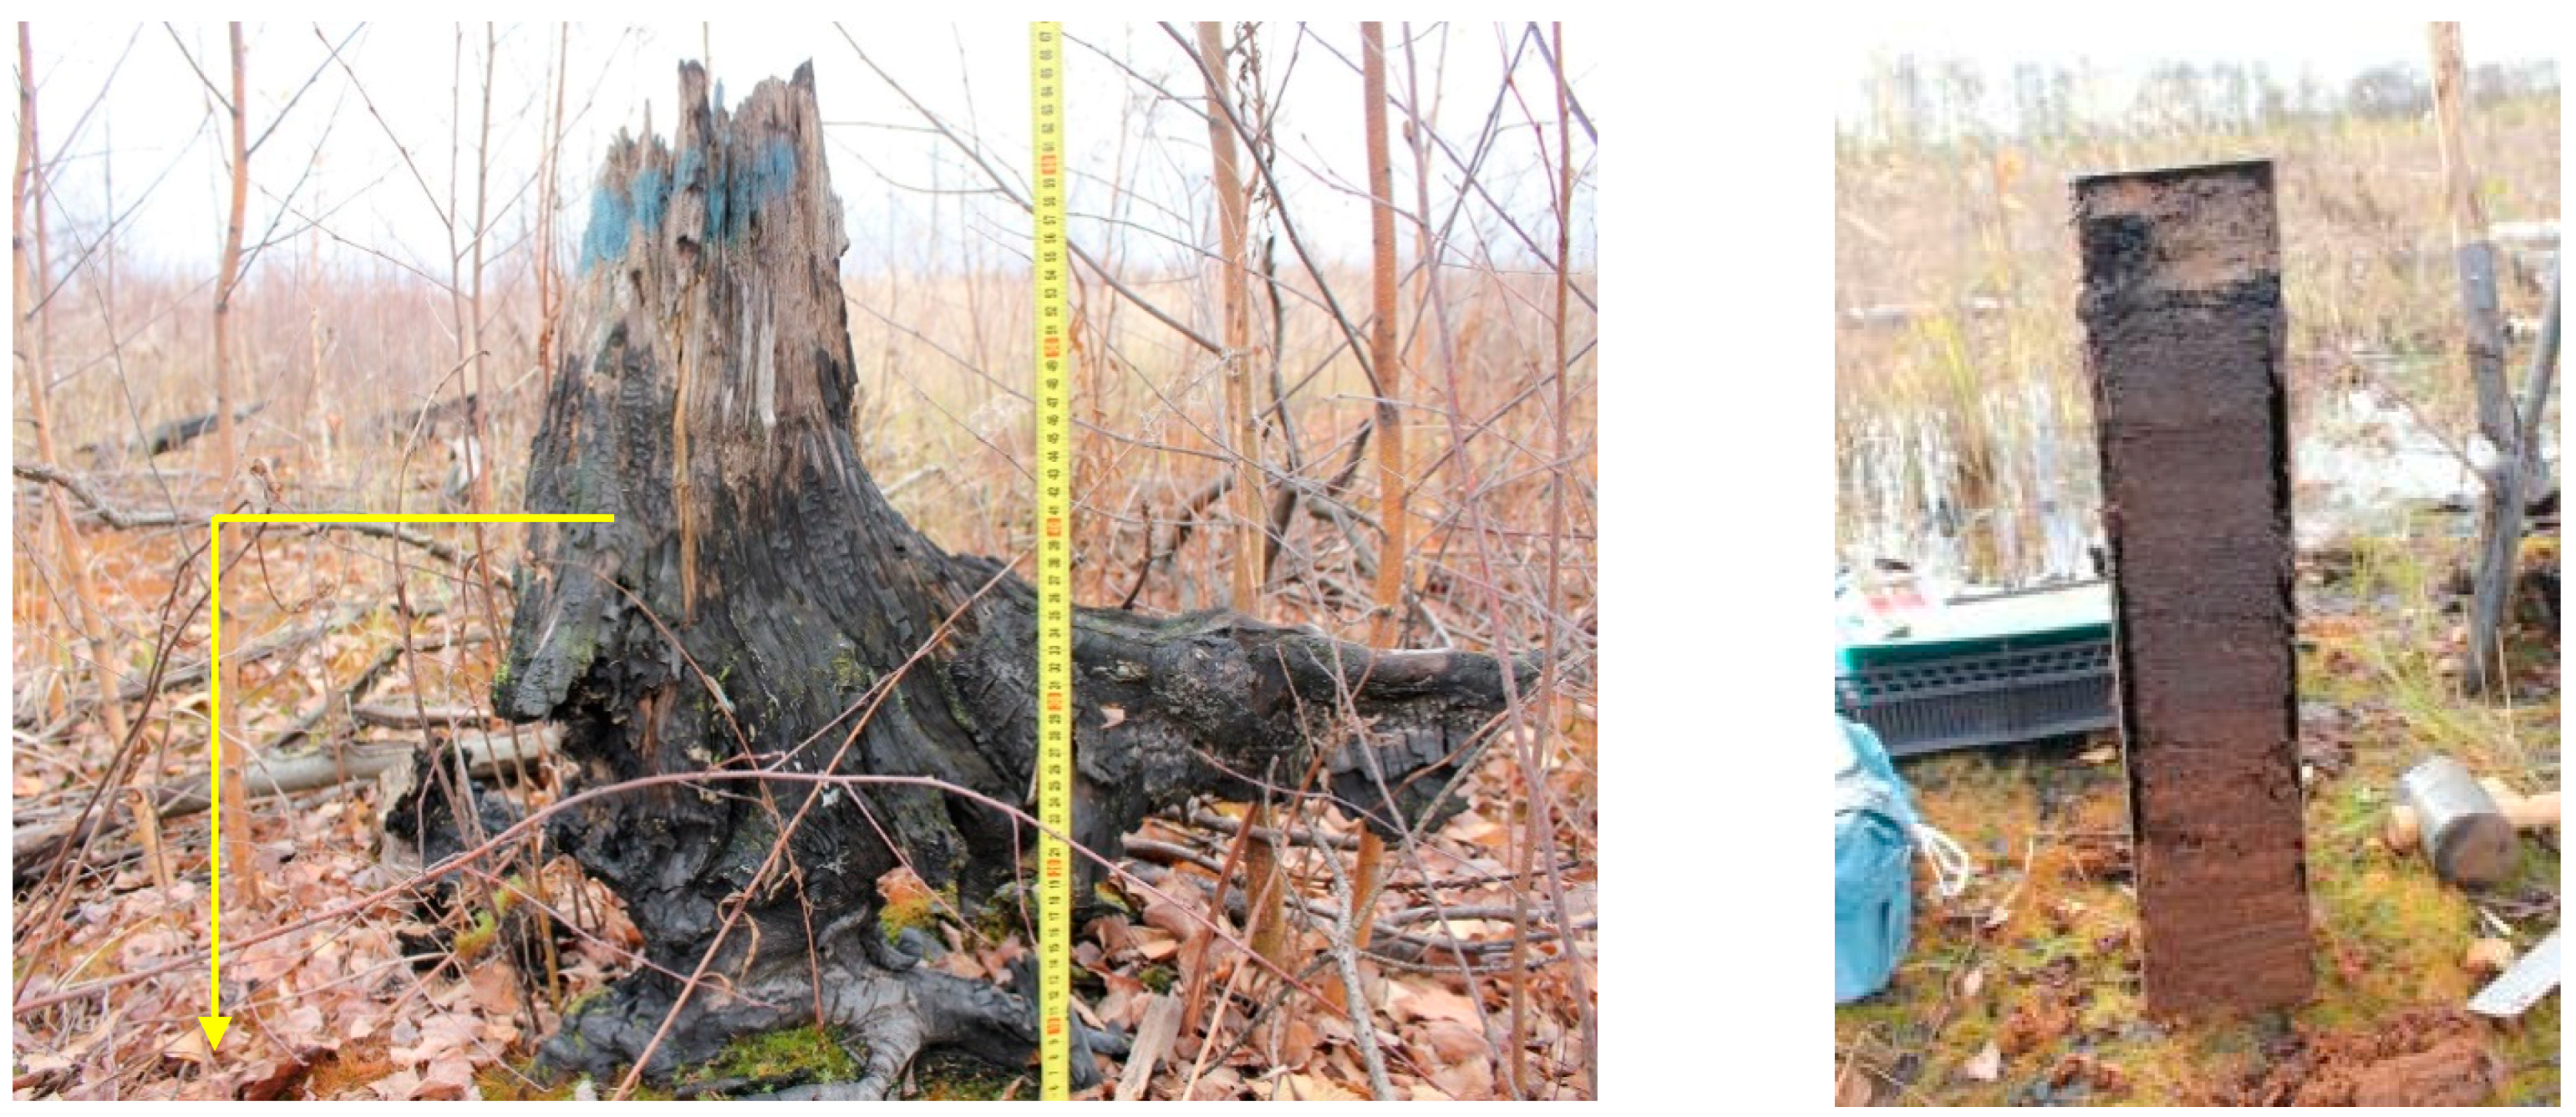
2.5. Determining Peat Burning Depth
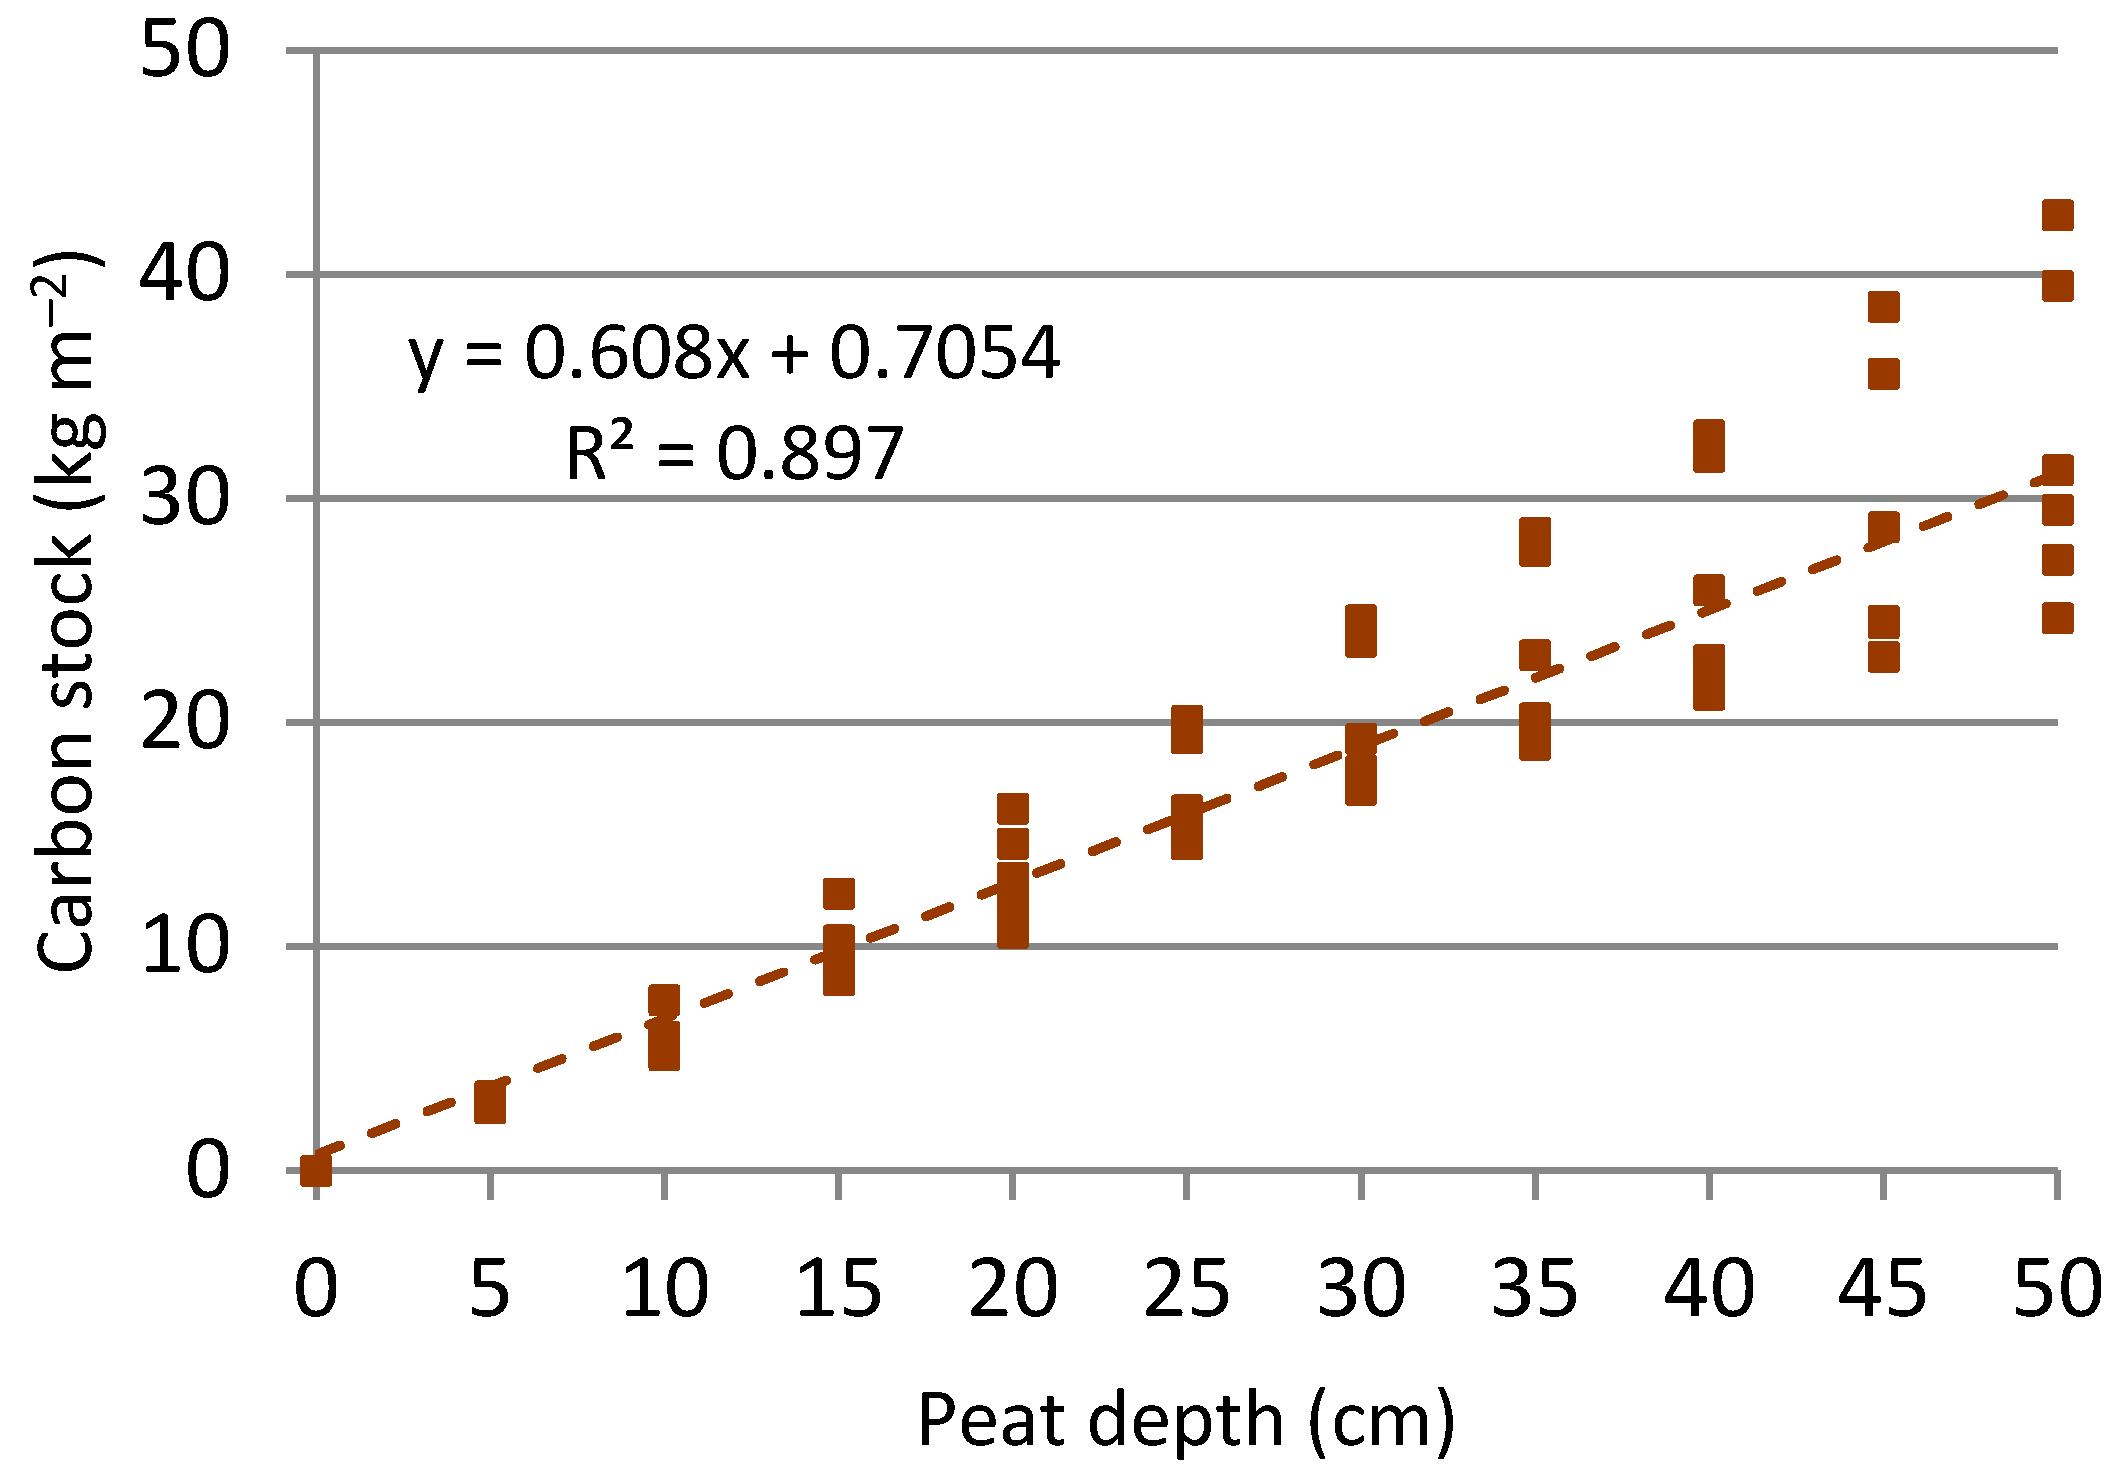
2.6. Peat Characterisation and Determination of Soil Carbon Losses
3. Results
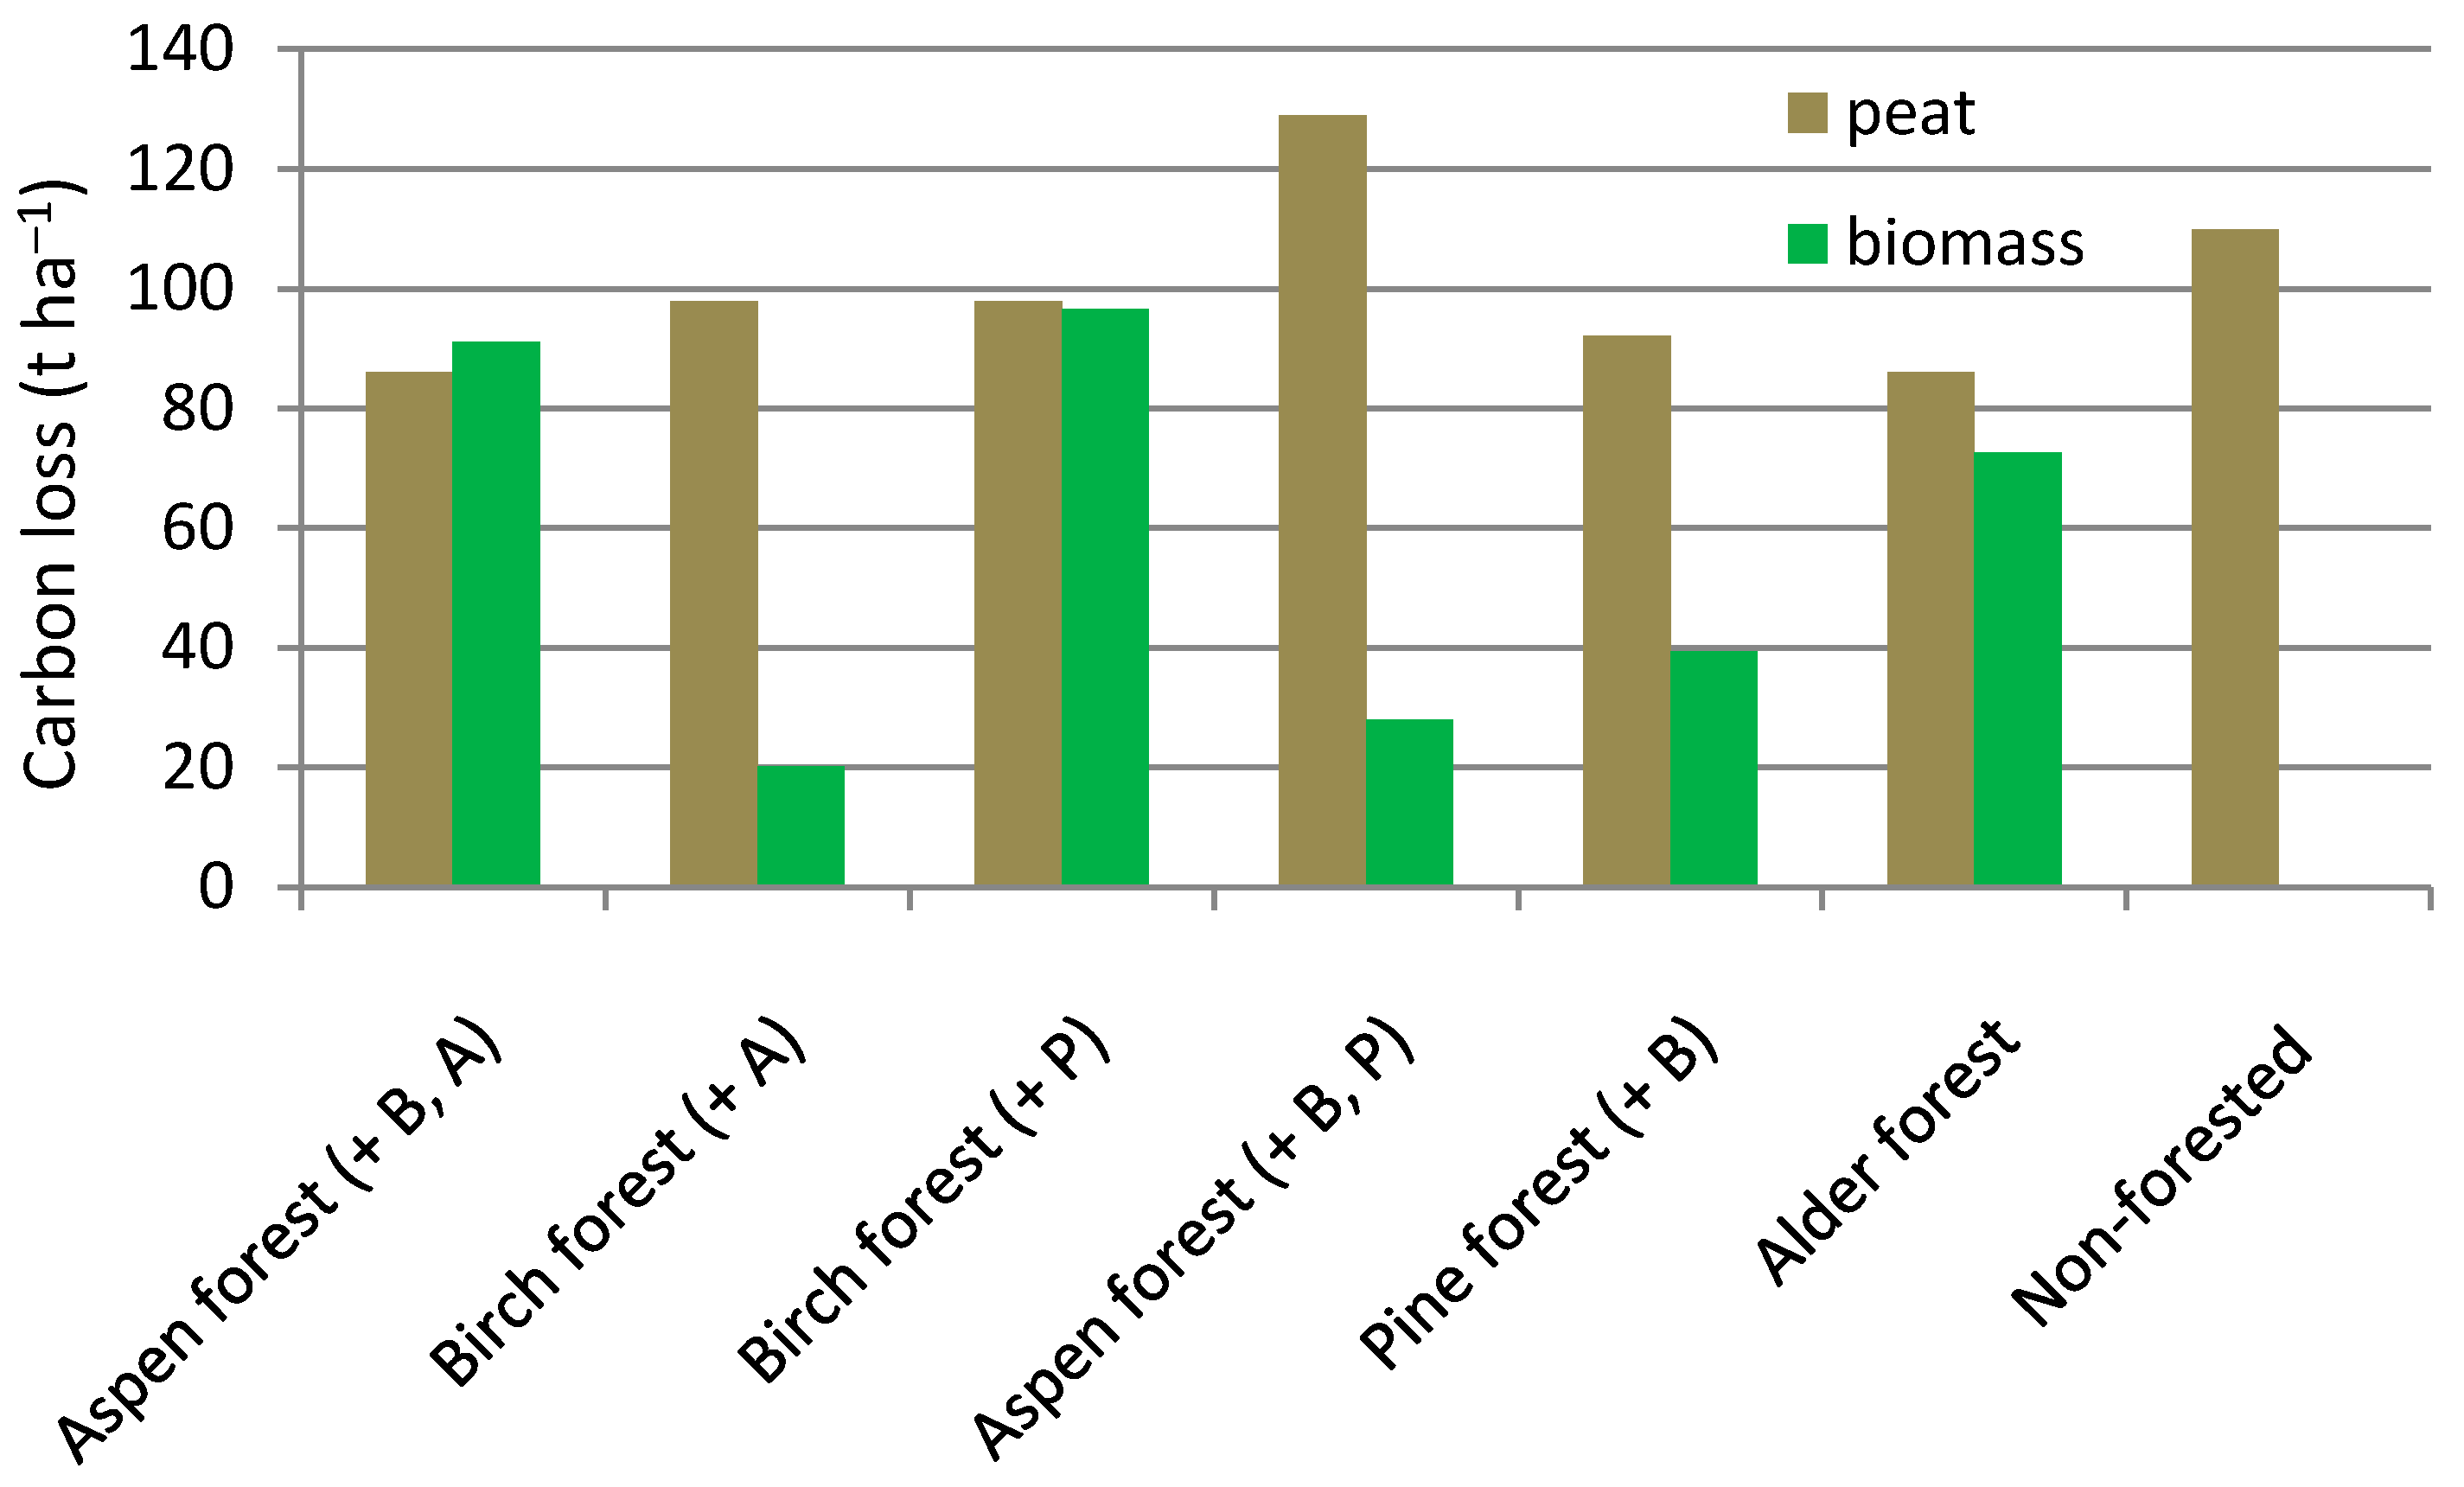
3.1. Biomass and Biomass Carbon Losses
3.2. Reconstruction of Pre-Fire Vegetation
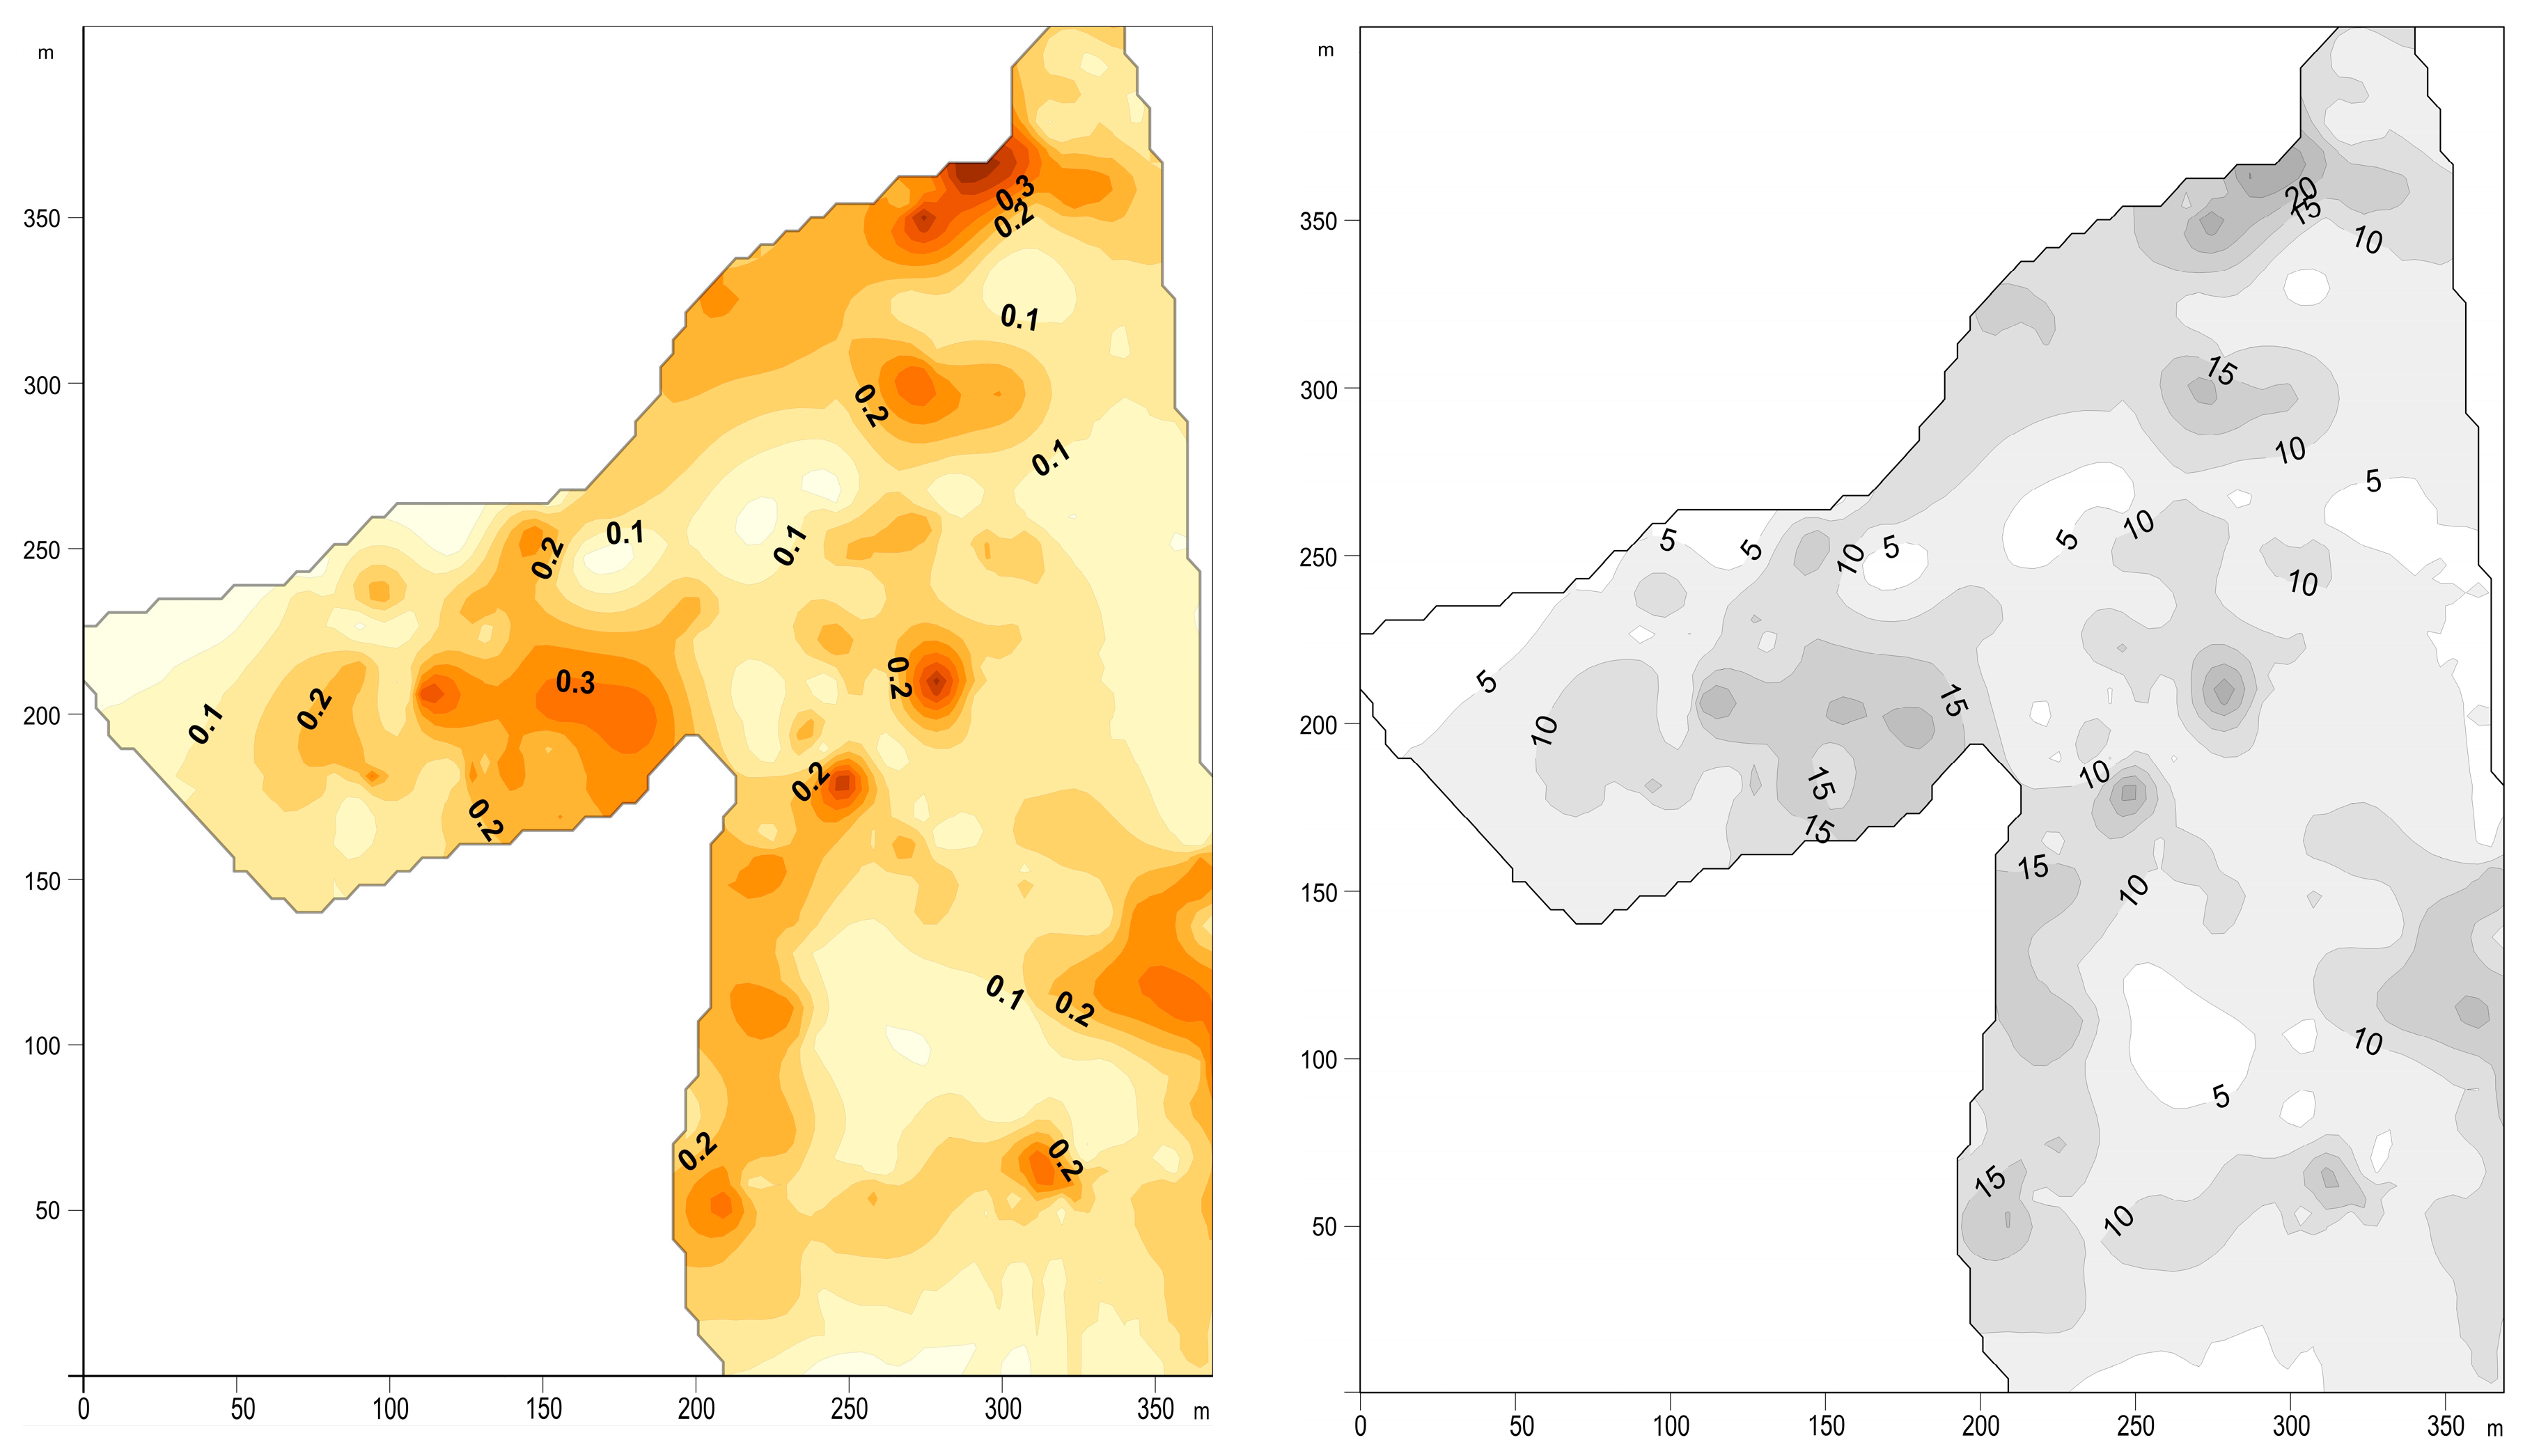
3.3. Burned-Out Depth of Peat
3.4. Soil Carbon Loss
4. Discussion
5. Conclusions
Supplementary Materials
Author Contributions
Funding
Data Availability Statement
Acknowledgments
Conflicts of Interest
References
- Jia, G.; Shevliakova, E.; Artaxo, P.; De Noblet-Ducoudré, N.; Houghton, R.; House, J.; Kitajima, K.; Lennard, C.; Popp, A.; Sirin, A.; et al. Land–climate interactions. In Climate Change and Land: An IPCC Special Report on Climate Change, Desertification, Land Degradation, Sustainable Land Management, Food Security, and Greenhouse Gas Fluxes in Terrestrial Ecosystems; Shukla, P.R., Skea, J., Buendia, E.C., Masson-Delmotte, V., Pörtner, H.-O., Roberts, D.C., Zhai, P., Slade, R., Connors, S., van Diemen, R., et al., Eds.; IPCC: Geneva, Switzerland, 2019; In press. [Google Scholar]
- Seidl, R.; Thom, D.; Kautz, M.; Martin-Benito, D.; Peltoniemi, M.; Vacchiano, G.; Wild, J.; Ascoli, D.; Petr, M.; Honkaniemi, J.; et al. Forest disturbances under climate change. Nat. Clim. Chang. 2017, 7, 395–402. [Google Scholar] [CrossRef] [Green Version]
- van der Werf, G.R.; Randerson, J.T.; Giglio, L.; van Leeuwen, T.T.; Chen, Y.; Rogers, B.M.; Mu, M.; van Marle, M.J.E.; Morton, D.C.; Collatz, G.J.; et al. Global fire emissions estimates during 1997–2016. Earth Syst. Sci. Data 2017, 9, 697–720. [Google Scholar] [CrossRef] [Green Version]
- Ribeiro-Kumara, C.; Köster, E.; Aaltonen, H.; Köster, K. How do forest fires affect soil greenhouse gas emissions in upland boreal forests? A review. Environ. Res. 2020, 184, 109328. [Google Scholar] [CrossRef]
- Vomperskii, S.E.; Glukhova, T.V.; Smagina, M.V.; Kovalev, A.G. Conditions and consequences of wildfires in pine forests on the drained mires. Lesovedenie 2007, 6, 35–44. (In Russian) [Google Scholar]
- Glukhova, T.V.; Sirin, A.A. Losses of soil carbon upon a fire on a drained forested raised bog. Eurasian Soil Sci. 2018, 51, 542–549. [Google Scholar] [CrossRef]
- Turetsky, M.R.; Benscoter, B.; Page, S.; Rein, G.; van der Werf, G.R.; Watts, A. Global vulnerability of peatlands to fire and carbon loss. Nat. Geosci. 2015, 8, 11–14. [Google Scholar] [CrossRef]
- Poulter, B.; Christensen, N.L., Jr.; Halpin, P.N. Carbon emissions from a temperate peat fire and its relevance to interannual variability of trace atmospheric greenhouse gases. J. Geophys. Res. Atmos. 2006, 111. [Google Scholar] [CrossRef]
- Rein, G. Smouldering fires and natural fuels. In Fire Phenomena and the Earth System: An Interdisciplinary Guide to Fire Science; Belcher, C.M., Ed.; Wiley: New York, NY, USA, 2013; pp. 15–34. [Google Scholar]
- Davies, G.M.; Gray, A.; Rein, G.; Legg, C.J. Peat consumption and carbon loss due to smouldering wildfire in a temperate peatland. For. Ecol. Manag. 2013, 308, 169–177. [Google Scholar] [CrossRef] [Green Version]
- IPCC. 2013 Supplement to the 2006 IPCC Guidelines for National Greenhouse Gas Inventories: Wetlands; Hiraishi, T., Krug, T., Tanabe, K., Srivastava, N., Baasansuren, J., Fukuda, M., Troxler, T.G., Eds.; IPCC: Geneva, Switzerland, 2014. [Google Scholar]
- Joosten, H.; Sirin, A.; Couwenberg, J.; Laine, J.; Smith, P. The role of peatlands in climate regulation. In Peatland Restoration and Ecosystem Services: Science, Policy and Practice; Bonn, A., Joosten, H., Evans, M., Stoneman, R., Allott, T., Eds.; Ecological Reviews; Cambridge University Press: Cambridge, UK, 2016; pp. 63–76. [Google Scholar] [CrossRef]
- Huang, X.; Rein, G. Downward spread of smouldering peat fire: The role of moisture, density and oxygen supply. Int. J. Wildland Fire 2017, 26, 907–918. [Google Scholar] [CrossRef]
- Hu, Y.; Fernandez-Anez, N.; Smith, T.E.L.; Rein, G. Review of emissions from smouldering peat fires and their contribution to regional haze episodes. Int. J. Wildland Fire 2018, 27, 293–312. [Google Scholar] [CrossRef]
- Schulte, M.L.; McLaughlin, D.L.; Wurster, F.C.; Varner, J.M.; Stewart, R.D.; Aust, W.M.; Jones, C.N.; Gile, B. Short- and long-term hydrologic controls on smouldering fire in wetland soils. Int. J. Wildland Fire 2019, 28, 177–186. [Google Scholar] [CrossRef] [Green Version]
- Marlier, M.E.; Liu, T.; Yu, K.; Buonocore, J.J.; Koplitz, S.N.; DeFries, R.S.; Mickley, L.J.; Jacob, D.J.; Schwartz, J.; Wardhana, B.S.; et al. Fires, smoke exposure, and public health: An integrative framework to maximize health benefits from peatland restoration. GeoHealth 2019, 3, 178–189. [Google Scholar] [CrossRef] [Green Version]
- Safronov, A.N.; Fokeeva, E.V.; Rakitin, V.S.; Grechko, E.I.; Shumsky, R.A. Severe Wildfires Near Moscow, Russia in 2010: Modeling of Carbon Monoxide Pollution and Comparisons with Observations. Remote Sens. 2015, 7, 395–429. [Google Scholar] [CrossRef] [Green Version]
- Sirin, A.; Minayeva, T.; Vozbrannaya, A.; Bartalev, S. How to avoid peat fires? Sci. Russ. 2011, 2, 13–21. [Google Scholar]
- Sirin, A.A.; Medvedeva, M.A.; Makarov, D.A.; Maslov, A.A.; Joosten, H. Multispectral satellite based monitoring of land cover change and associated fire reduction after large-scale peatland rewetting following the 2010 peat fires in Moscow region (Russia). Ecol. Eng. 2020, 158, 106044. [Google Scholar] [CrossRef]
- Barriopedro, D.; Fischer, E.M.; Luterbacher, J.; Trigo, R.M.; García-Herrera, R. The hot summer of 2010: Redrawing the temperature record map of Europe. Science 2011, 332, 220–224. [Google Scholar] [CrossRef] [PubMed] [Green Version]
- Konovalov, I.B.; Beekmann, M.; Kuznetsova, I.N.; Yurova, A.; Zvyagintsev, A.M. Atmospheric impacts of the 2010 Russian wildfires: Integrating modelling and measurements of an extreme air pollution episode in the Moscow region. Atmos. Chem. Phys. 2011, 11, 10031–10056. [Google Scholar] [CrossRef] [Green Version]
- Shaposhnikov, D.; Revich, B.; Bellander, T.; Bedada, G.B.; Bottai, M.; Kharkova, T.; Kvasha, E.; Lezina, E.; Lind, T.; Semutnikova, E.; et al. Mortality Related to Air Pollution with the Moscow Heat Wave and Wildfire of 2010. Epidemiology 2014, 25, 359–364. [Google Scholar] [CrossRef] [Green Version]
- Shaposhnikov, D.; Revich, B.; Bellander, T.; Bedada, G.B.; Bottai, M.; Kharkova, T.; Kvasha, E.; Lind, T.; Pershagen, G. Long-Term Impact of Moscow Heat Wave and Wildfires on Mortality. Epidemiology 2015, 26, 21–22. [Google Scholar] [CrossRef]
- Rossi, S.; Tubiello, F.N.; Prosperi, P.; Salvatore, M.; Jacobs, H.; Biancalani, R.; House, J.I.; Boschetti, L. FAOSTAT estimates of greenhouse gas emissions from biomass and peat fires. Clim. Chang. 2016, 135, 699–711. [Google Scholar] [CrossRef] [Green Version]
- Page, S.E.; Siegert, F.; Rieley, J.O.; Boehm, H.-D.V.; Jaya, A.; Limin, S. The amount of carbon released from peat and forest fires in Indonesia during 1997. Nature 2002, 420, 61–65. [Google Scholar] [CrossRef]
- Page, S.E.; Rieley, J.O.; Banks, C.J. Global and regional importance of the tropical peatland carbon pool. Glob. Chang. Biol. 2011, 17, 798–818. [Google Scholar] [CrossRef] [Green Version]
- Minayeva, T.; Sirin, A.; Stracher, G.B. The Peat Fires of Russia. In Coal and Peat Fires: A Global Perspective; V.2: Photographs and Multimedia Tours; Stracher, G.B., Prakash, A., Sokol, E.V., Eds.; Elsevier: Amsterdam, The Netherlands, 2013; pp. 375–394. ISBN 9780444594129. [Google Scholar]
- Vompersky, S.E.; Ivanov, A.I.; Tsyganova, O.P.; Valyaeva, N.A.; Dubinin, A.I.; Glukhov, A.I.; Markelova, L.G. Bog organic soils and bogs of Russia and carbon pool of their peats. Eurasian Soil Sci. 1996, 28, 91–105. [Google Scholar]
- Tanneberger, F.; Tegetmeyer, C.; Busse, S.; Barthelmes, A.; Shumka, S.; Mariné, A.M.; Jenderedjian, K.; Steiner, G.M.; Essl, F.; Etzold, J.; et al. The peatland map of Europe. Mires Peat 2017, 19, 1–17. [Google Scholar] [CrossRef]
- Vompersky, S.E.; Sirin, A.A.; Sal’nikov, A.A.; Tsyganova, O.P.; Valyaeva, N.A. Estimation of forest cover extent over peatlands and paludified shallow-peat lands in Russia. Contemp. Probl. Ecol. 2011, 4, 734–741. [Google Scholar] [CrossRef]
- Turetsky, M.R.; Wieder, R.K. A direct approach to quantifying organic matter lost as a result of peatland wildfire. Can. J. For. Res. 2001, 31, 363–366. [Google Scholar] [CrossRef]
- Reddy, A.D.; Hawbaker, T.J.; Wurster, F.; Zhu, Z.; Ward, S.; Newcomb, D.; Murray, R. Quantifying soil carbon loss and uncertainty from a peatland wildfire using multi-temporal LiDAR. Remote Sens. Environ. 2015, 170, 306–316. [Google Scholar] [CrossRef] [Green Version]
- Sirin, A.A.; Makarov, D.A.; Maslov, A.A.; Gummert, I.; Gulbe, Y.I. Depth of peat burning and carbon loss during an underground forest fire. Contemp. Probl. Ecol. 2020, 13, 769–779. [Google Scholar] [CrossRef]
- Hytteborn, H.; Maslov, A.A.; Nazimova, D.I.; Rysin, L.P. Boreal forests of Eurasia. In Coniferous Forests; Andersson, F., Goodall, D.W., Eds.; Ecosystems of the World; Elsevier: Amsterdam, The Netherlands, 2005; Volume 6, pp. 23–99. ISBN 9780444816276. [Google Scholar]
- Sirin, A.A.; Maslov, A.A.; Valyaeva, T.A.; Tsyganova, O.P.; Glukhova, T.V. Mapping of peatlands in the Moscow oblast based on high resolution remote sensing data. Contemp. Probl. Ecol. 2014, 7, 809–815. [Google Scholar] [CrossRef]
- Minayeva, T.; Sirin, A.; Bragg, O.A. (Eds.) Quick Scan of Peatlands in Central and Eastern Europe; Wetlands International: Wageningen, The Netherlands, 2009; p. 132. ISBN 9789058820440. [Google Scholar]
- Sirin, A.; Minayeva, T.; Yurkovskaya, T.; Kuznetsov, O.; Smagin, V.; Fedotov, Y.U. Russian Federation (European Part). In Mires and Peatlands of Europe: Status, Distribution and Conservation; Joosten, H., Tanneberger, F., Moen, A., Eds.; Schweizerbart Science: Stuttgart, Germany, 2017; pp. 589–616. ISBN 9783510653836. [Google Scholar]
- Maslov, A.A.; Gulbe, Y.I.; Makarov, D.A.; Sirin, A.A. Evaluation of pre-fire forest stands condition on burned area using space imagery and on-ground investigations. Leskhoz Inf. 2017, 73–84. (In Russian) [Google Scholar] [CrossRef]
- ScanEx. Remote Sensing Data Processing Program ScanEx Image Processor v. 4.2. Remote Sensing Data Thematic Interpretation Module Thematic Pro. In User’s Guide 2014; Available online: http://new.scanex.ru/upload/iblock/7b7/7b760146c691873ff8580321cc1c5420.pdf (accessed on 18 May 2018).
- Zagreev, V.V.; Suhih, V.I.; Shvidenko, A.Z.; Gusev, N.N.; Moshkalev, A.G. All-Union Standards for Forest Taxation; Kolos: Moscow, Russia, 1992; ISBN 5100013443. (In Russian) [Google Scholar]
- Chung, M.; Han, Y.; Kim, Y. A framework for unsupervised wildfire damage assessment using VHR satellite images with PlanetScope data. Remote Sens. 2020, 12, 3835. [Google Scholar] [CrossRef]
- Shin, J.-I.; Seo, W.-W.; Kim, T.; Park, J.; Woo, C.-S. Using UAV Multispectral Images for Classification of Forest Burn Severity—A Case Study of the 2019 Gangneung Forest Fire. Forests 2019, 10, 1025. [Google Scholar] [CrossRef] [Green Version]
- Dyrness, C.T.; Norum, R.A. The effects of experimental fires on black spruce forest floors in interior Alaska. Can. J. For. Res. 1983, 13, 879–893. [Google Scholar] [CrossRef]
- Efremova, T.G.; Efremov, S.P. Peat fires as an environmental factor of development of boggy forest ecosystems. Ekologiya 1994, 5, 27–34. (In Russian) [Google Scholar]
- Miyanishi, K.; Johnson, E.A. Process and patterns of duff consumption in the mixedwood boreal forest. Can. J. For. Res. 2002, 32, 1285–1295. [Google Scholar] [CrossRef]
- Kasischke, E.S.; Johnstone, J.F. Variation in post-fire organic layer thickness in a black spruce forest complex in Interior Alaska and its effects on soil temperature and moisture. Can. J. For. Res. 2005, 35, 2164–2177. [Google Scholar] [CrossRef]
- Kopoteva, T.A.; Kuptsova, V.A. Effect of fires on the functioning of phytocenoses of peat bogs in the Middle-Amur lowland. Russ. J. Ecol. 2016, 47, 11–18. [Google Scholar] [CrossRef]
- Benscoter, B.W.; Wieder, R.K. Variability in organic matter lost by combustion in a boreal bog during the 2001 Chisholm fire. Can. J. For. Res. 2003, 33, 2509–2513. [Google Scholar] [CrossRef]
- Turetsky, M.R.; Donahue, W.F.; Benscoter, B.W. Experimental drying intensifies burning and carbon losses in a northern peatland. Nat. Commun. 2011, 2, 514. [Google Scholar] [CrossRef]
- Parish, F.; Sirin, A.; Charman, D.; Joosten, H.; Minayeva, T.; Silvius, M.; Stringer, L. (Eds.) Assessment on Peatlands, Biodiversity and Climate Change: Main Report; Global Environment Centre; Kuala Lumpur and Wetlands International: Wageningen, The Netherlands, 2008; pp. 1–179. ISBN 9789834375102. [Google Scholar]
- Minayeva, T.Y.; Sirin, A.A. Peatland biodiversity and climate change. Biol. Bull. Rev. 2012, 2, 164–175. [Google Scholar] [CrossRef]
- Granath, G.; Moore, P.A.; Lukenbach, M.C.; Waddington, J.M. Mitigating wildfire carbon loss in managed northern peatlands through restoration. Sci. Rep. 2016, 6, 28498. [Google Scholar] [CrossRef] [PubMed] [Green Version]
- Suvorov, G.G.; Chistotin, M.V.; Sirin, A.A. The Carbon losses from a drained peatland in Moscow oblast used for peat extraction and agriculture. Agrochemistry 2015, 11, 51–62. (In Russian) [Google Scholar]


| Thematic Class | Plot | Thematic Class Description | Area (ha) | C (t ha−1) | C (t) |
|---|---|---|---|---|---|
| 1 | 4 | Aspen forest with birch and alder | 3.56 | 91.18 | 324.60 |
| 2 | 5 | Birch forest with alder | 2.45 | 20.18 | 49.44 |
| 3 | 1 | Birch forest with some pine | 1.19 | 96.62 | 114.98 |
| 4 | 6 | Aspen forest with birch and pine | 0.68 | 27.91 | 18.98 |
| 5 | 3 | Pine forest with birch | 0.53 | 39.32 | 20.84 |
| 6 | 2 | Alder forest | 0.03 | 72.59 | 2.18 |
| Total: | 8.44 | 62.9 | 531.02 |
| Pine Forest with Birch | Birch Forest with Some Pine | Aspen Forest with Birch and Pine | Aspen Forest with Birch and Alder | Birch Forest with Alder | Alder Forest | Non-Forest | Total Burned Area | |
|---|---|---|---|---|---|---|---|---|
| Area | ||||||||
| ha | 0.48 | 0.98 | 0.67 | 3.11 | 2.25 | 0.08 | 0.51 | 8.08 |
| % | 6.0 | 12.1 | 8.3 | 38.5 | 27.8 | 1.0 | 6.3 | 100 |
| Peat burn depth, cm | ||||||||
| M | 14 | 15 | 20 | 13 | 15 | 13 | 17 | 15 |
| S | 5 | 6 | 9 | 8 | 8 | 5 | 7 | 8 |
| max | 32 | 32 | 50 | 50 | 51 | 27 | 35 | 51 |
| min | 3 | 1 | 6 | 0 | 0 | 5 | 4 | 0 |
| Me | 13 | 14 | 19 | 12 | 15 | 11 | 17 | 14 |
| Loss of soil carbon, kg m−2 | ||||||||
| M | 9.22 | 9.8 | 12.9 | 8.61 | 9.8 | 8.61 | 11.0 | 9.8 |
| S | 3.75 | 4.35 | 6.18 | 5.57 | 5.57 | 3.75 | 4.96 | 5.57 |
| max | 20.2 | 20.2 | 31.1 | 31.1 | 31.7 | 17.1 | 22.0 | 31.7 |
| min | 2.53 | 1.31 | 4.35 | 0 | 0 | 3.75 | 3.14 | 0 |
| Me | 8.61 | 9.22 | 12.3 | 8.0 | 9.8 | 7.39 | 11.0 | 9.22 |
Publisher’s Note: MDPI stays neutral with regard to jurisdictional claims in published maps and institutional affiliations. |
© 2021 by the authors. Licensee MDPI, Basel, Switzerland. This article is an open access article distributed under the terms and conditions of the Creative Commons Attribution (CC BY) license (https://creativecommons.org/licenses/by/4.0/).
Share and Cite
Sirin, A.; Maslov, A.; Makarov, D.; Gulbe, Y.; Joosten, H. Assessing Wood and Soil Carbon Losses from a Forest-Peat Fire in the Boreo-Nemoral Zone. Forests 2021, 12, 880. https://doi.org/10.3390/f12070880
Sirin A, Maslov A, Makarov D, Gulbe Y, Joosten H. Assessing Wood and Soil Carbon Losses from a Forest-Peat Fire in the Boreo-Nemoral Zone. Forests. 2021; 12(7):880. https://doi.org/10.3390/f12070880
Chicago/Turabian StyleSirin, Andrey, Alexander Maslov, Dmitry Makarov, Yakov Gulbe, and Hans Joosten. 2021. "Assessing Wood and Soil Carbon Losses from a Forest-Peat Fire in the Boreo-Nemoral Zone" Forests 12, no. 7: 880. https://doi.org/10.3390/f12070880
APA StyleSirin, A., Maslov, A., Makarov, D., Gulbe, Y., & Joosten, H. (2021). Assessing Wood and Soil Carbon Losses from a Forest-Peat Fire in the Boreo-Nemoral Zone. Forests, 12(7), 880. https://doi.org/10.3390/f12070880