Article

Effects of Planting Density on Morphological and Photosynthetic Characteristics of Leaves in Different Positions on Cunninghamia lanceolata Saplings

1
College of Forestry, Fujian Agriculture and Forestry University, Fuzhou 350002, China
2
State Forestry Administration Engineering Research Center of Chinese Fir, Fuzhou 350002, China
*
Author to whom correspondence should be addressed.
Forests 2021, 12(7), 853; https://doi.org/10.3390/f12070853
Submission received: 15 May 2021 / Revised: 8 June 2021 / Accepted: 24 June 2021 / Published: 28 June 2021
(This article belongs to the Special Issue Effects of Environmental Changes on Forest Growth and Stability)

Abstract

:
The improvement of the stand yield and economic benefits of Cunninghamia lanceolata (Lamb.) Hook, one of the most important plantation trees in China, has always been a concern. An appropriate planting density plays an important role in increasing productivity. To determine the optimum planting density of C. lanceolata, we measured leaf morphology, gas exchange parameters, and photosynthetic pigments in replicate leaves on 4-year-old saplings grown in four canopy positions under a low (D1), medium (D2), and high (D3) planting density (approximately 900, 2505, and 6660 trees·ha−1, respectively). We then ranked trait variations using the coefficient of variation to explore the influence of planting density. Planting density significantly influenced the leaf morphology, gas exchange parameters, and the photosynthetic pigment contents of C. lanceolata. Medium planting density (D2) resulted in a larger leaf area and specific leaf areas, a higher net photosynthesis rate, and higher photosynthetic pigment contents. The responses of leaf gas exchange parameters had the most plastic traits that responded to planting density. An appropriate planting density and leaf position might improve C. lanceolata leaf morphology and physiological attributes, which in turn would facilitate growth.

1. Introduction

Planting density is the main factor controlled by foresters during the entire process of forest cultivation, and it is also the basis for forming specific horizontal stand structures. The selection of planting density is an important technique in plantation management. Planting density has a direct influence on productivity, and determining the appropriate density is the most significant step during plantation. The effects of different planting densities are closely related to population structures, which cause plants tocompete for resources such as light, water, and CO2 in the habitat. To adjust to various environments and be more competitive, plants must tolerate, withstand, and respond to environmental changes through metabolic, developmental, morphological, and physiological adjustments [1,2]. Leaf traits are particularly sensitive to environments that vary across different conditions and include morphological and physiological characteristics; they also play key roles in plant adaptation to various growth environments [3]. Furthermore, different planting densities directly affect the initiation and intensity of resource competition among trees [4]. A higher planting density means less space among plants; competition then intensifies, and self-thinning is likely to occur early. This affects tree quantity and quality as well as stand productivity [4,5,6]. No serious competition among plants under a low planting density has been observed due to a lower mutual shading between saplings. However, under such conditions, leaves are exposed to full sunlight and high temperatures, and an excess of light may lead photoinhibition, which is detrimental to growth and development [7,8]. Competitive interactions and understorey development are similarly driven by the vertical and horizontal forest canopy structure, which are indicators of past forest development [9]. The amount of light intensity that reaches the leaf surface of seedlings and saplings under canopies is significantly reduced by the effect of the canopy structure [10]. Thus, the position of a leaf determines its light distribution and interception, which affects its morphology and photosynthetic characteristics. In practice, planting trees close to each other also leads to a dimmer environment around lower mature leaves, while the upper developing leaves are exposed to more intense light. Thus, considering the set of characteristics analyzed, changes in planting density and leaf position would alter environmental conditions around leaves. Accordingly, the response mechanisms of plants in different layer positions and planted at various densities should be determined.
Photosynthesis is the basis of plant growth and a decisive physiological process for productivity, which is influenced by environmental factors such as light, temperature, CO2 concentration, soil fertility, and other external factors [11]. In addition, most reactions in the photosynthetic process occur in highly plastic leaves [12], the main light-harvesting organs of plants. Therefore, studying the photosynthetic capacity in the leaves of plants in different habitats helps understand their survival, growth ability, and adaptability to ever-changing environmental conditions [13,14]. The photosynthetic pathway can be divided into the processes of light interception, absorption, utilisation, and transformation. Some characteristics represent each step of these processes, from interception (specific leaf area) to light absorption and transformation (photosynthetic pigments). The morphological and physiological attributes of leaves are important in photosynthetic regulation and can provide a structural framework for gas exchange and optimized photosynthetic function [15]. The internal factors of leaves, especially those related to leaf anatomy and morphology, leaf age, chlorophyll content, nitrogen and carbohydrate concentrations, can also affect the photosynthetic capacity [11]. An increased leaf thickness and chlorophyll content result in increased contents of Pn and Gs, which help to capture more light, resulting in a higher conversation of light energy to chemical energy [11,16]. Simultaneously, the considerable variation in morphology and structure reflects the phenotypic plasticity of leaves [14]. These characteristics represent a fundamental mechanism of growth responses to environmental variation and could be good predictors of growth [17]. Therefore, leaf characteristics have served as indicators of plant acclimation potential and adaptation mechanisms [18,19].
Cunninghamialanceolata (Lamb.) Hook is one of the most important plantation tree species in the subtropical zone due to its high-quality timber, fast growth, and cultivation history of 1000 years. Cunninghamia lanceolata plantations occupy almost 8.95 × 10⁶ ha in subtropical China and have a standing timber volume of 625 × 106 m3, representing a typical forest ecosystem [20]. Thus, C. lanceolata is an extremely important reforestation and economic tree species in southern China. Foresters have recently attached greater importance to the operation and management of C. lanceolata plantations, and the effects of planting density have been investigated. Most studies of C. lanceolata plantations have focused on the effects of planting density on productivity [21], stand volume [22], soil microbial community structure [23], soil phosphorus bioavailability, and phosphatase activity [24]. However, it is still not clearly known how the leaves of C. lanceolata respond (both morphologically and photosynthetically) to a variable leaf position and planting density. Therefore, we investigated planting density and leaf position in 4-year-old C. lanceolata plantations. Here, we considered how and to what extent planting density and leaf position affect the morphological plasticity response of C. lanceolata, how the photosynthetic characteristics of C. lanceolata respond to changes in the environment, and whether planting density and leaf position impact how traits relate to performance and each other. We hypothesized that: (1) C. lanceolata saplings will exhibit a unique set of morphological, physiological, and plant light-use strategies for adaptation to variable conditions; (2) planting density would synergistically act with leaf position in shaping morphological (leaf length, width, area, and specific leaf area) and biochemical features (net photosynthesis rate, stomatal conductance, intercellular CO2 concentrations, transpiration rate, water use efficiency, limiting value of stomata), and photosynthetic pigment contents of C. lanceolata leaves; and (3) the plasticity of leaf physiological traits play a key role for C. lanceolata to adapt to varied planting densities. We also searched for potential relationships between planting density, leaf position, and their combined effects on plant response mechanisms. Our findings provide valuable insights into optimum planting density for the establishment and growth of C. lanceolata.

2. Materials and Methods

2.1. Experimental Site and Experiment Design

The study area was located at Mayi Mountain, a small offset branch of the Wuyi Mountain range, at an altitude of 178–212 m above sea level, Fujian Province, China (26°55′7″–26°56′34″ N, 117°45′6″–117°47′12″ E). The area was planted with Yang-061 C. lanceolata seedlings during the spring of 2017, and density was evaluated in 4-year-old C. lanceolata plantations during the spring of 2021. The three planting density gradients were 900, 2505, and 6660 trees·ha−1 (D1, D2, and D3, defined as low, medium, and high density, respectively). The trials compriseda randomized complete block design. Each density level comprised three plots (nine in total). Each plot was 20 × 20 m, with a buffer zone of two rows of the same density of Michelia macclurei seedlings around each plot and a fixed boundary of concrete piles.
Three uniform trees were selected from the upper, middle, and lower positions of each sample plot to minimize the effects of slope on leaf characteristics. Cunninghamia lanceolata is clearly vertical by layer. Four-year-old C. lanceolata trees can be divided into four canopy layers from top to bottom, with layers of branches for different growth ages. Test leaves were selected from a position near the top of the branch of each canopy layer. That is, the front end of the branch of different layers was defined as different leaf positions from top to bottom: Z1 (first layer), Z2 (second layer), Z3 (third layer), and Z4 (fourth layer).

2.2. Measurements of Leaf Area and Dry Mass

Leaf traits were estimated by randomly sampling 10 healthy and fully expanded green leaves from the same leaf position, in each layer of each test tree, in the same plot. Images of leaves were acquired using an Epson Expression 10000XL scanner (Tokyo, Japan); then, the length (cm), width (mm), and projected area (foliage without petioles, cm2) [25] were calculated with WinRHIZO image analysis software (Version 2003e, Regent Instruments, Québec City, QC, Canada). Leaves were then individually placed in paper bags and oven-dried at 80 °C. Upon reaching a constant dry mass, the dry mass of each leaf was determined. The specific leaf area (SLA, cm2·g−1) was calculated as the leaf area divided by the corresponding oven-dried mass per leaf.

2.3. Measurement of Leaf Gas Exchange Attributes

Leaf gas exchange was measured at different leaf positions and from fully expanded and intact leaves from test trees in all plots. Leaf gas exchange parameters, such as net photosynthesis rate (Pn), leaf stomatal conductance (Gs), intercellular CO2 concentration (Ci), and transpiration rate (Tr) were measured using an LI-6400XT portable photosynthesis system (LI-COR Biosciences Inc., Lincoln, NE, USA). Water use efficiency (WUE) was calculated as Pn/Tr, and the limiting value of stomata (Ls) was then deduced according to the equation, Ls =1 − Ci/Ca, where Ca is the atmospheric CO2 concentration [26]. Before measurement, test leaves were spread without overlap in a leaf chamber with a photosynthetic photon flux density of 1000 µmol·m−2s−1 for 30 min. Environmental conditions in the leaf chamber comprised photosynthetic photon flux density 1000 μmol·m−2s−1, CO2 concentration 400 µL·L−1, block temperature 25 °C, and chamber flow rate 300–500 μmol·s−1 to maintain relative humidity between 40% and 60%. The gas exchange parameters in the leaves were measured from 26–30 January 2021. All parameters were measured twice on cloud-free mornings between 9:00 and 11:00 a.m. The areas of leaves were photographed immediately after measuring gas exchange.

2.4. Measurement of Photosynthetic Pigment Contents

After measuring the saplings as described above, the leaves were immediately placed in liquid nitrogen and transported to the laboratory to determine photosynthetic pigment contents. Leaf samples (0.1 g fresh weight) were chopped, soaked in 20 mL of acetone: ethanol (1:1 mixture), then sealed in glass test tubes and stored under darkness to extract chlorophyll until the leaves became blanched [27]. The absorbance of extracts was measured at 663, 645, and 470 nm, using a UV-2800 spectrophotometer (Shimadzu Corp., Kyoto, Japan). Chlorophyll a (Chl a), b (Chl b), total chlorophyll (Chl[a + b]), and carotenoid (Car) contents were calculated as described [27] and are expressed as mg·g−1 fresh weight.

2.5. Statistical Analysis

Differences in leaf morphology and photosynthetic characteristics at different planting densities and leaf positions were determined using one-way ANOVA and post hoc least significant difference (LSD) tests. Plant responses were analyzed using a two-way ANOVA, with planting density and leaf position as fixed factors. Trait plasticity in leaf morphology, leaf gas exchange parameters, and photosynthetic pigment contents were compared using coefficients of variation (CV), as described previously [28]. The CV scores of each variable and leaf position were calculated as 100 × SDX/ X ¯ , where SDX is the standard deviation of treatment means, and X ¯ is the grand mean of treatment means [28]. The CVs of all four positions were averaged for each trait, then ranked to compare relative plasticity. Statistical significance was established at p < 0.05. All statistical analyses were performed using SPSS version 20.0 for Windows (SPSS, Inc., Chicago, IL, USA). Data are presented as means ± standard error. All analyses were replicated nine times per planting density and per position.

3. Results

3.1. Interactions between Planting Density and Leaf Position

The two-way ANOVA explained much of the variation in traits, with a mean R2 of 0.454 (0.274–0.590; Table 1). All traits were strongly influenced by planting density. Leaf position significantly affected all traits of leaf morphology, leaf gas exchange parameters, and photosynthetic pigment contents, except for leaf area. Interactions between planting density vs. leaf position were significant among all traits related to leaf morphology or gas exchange parameters, except for intercellular CO2 concentration and the limiting value of stomata. However, the interaction did not significantly affect leaf photosynthetic pigment contents.

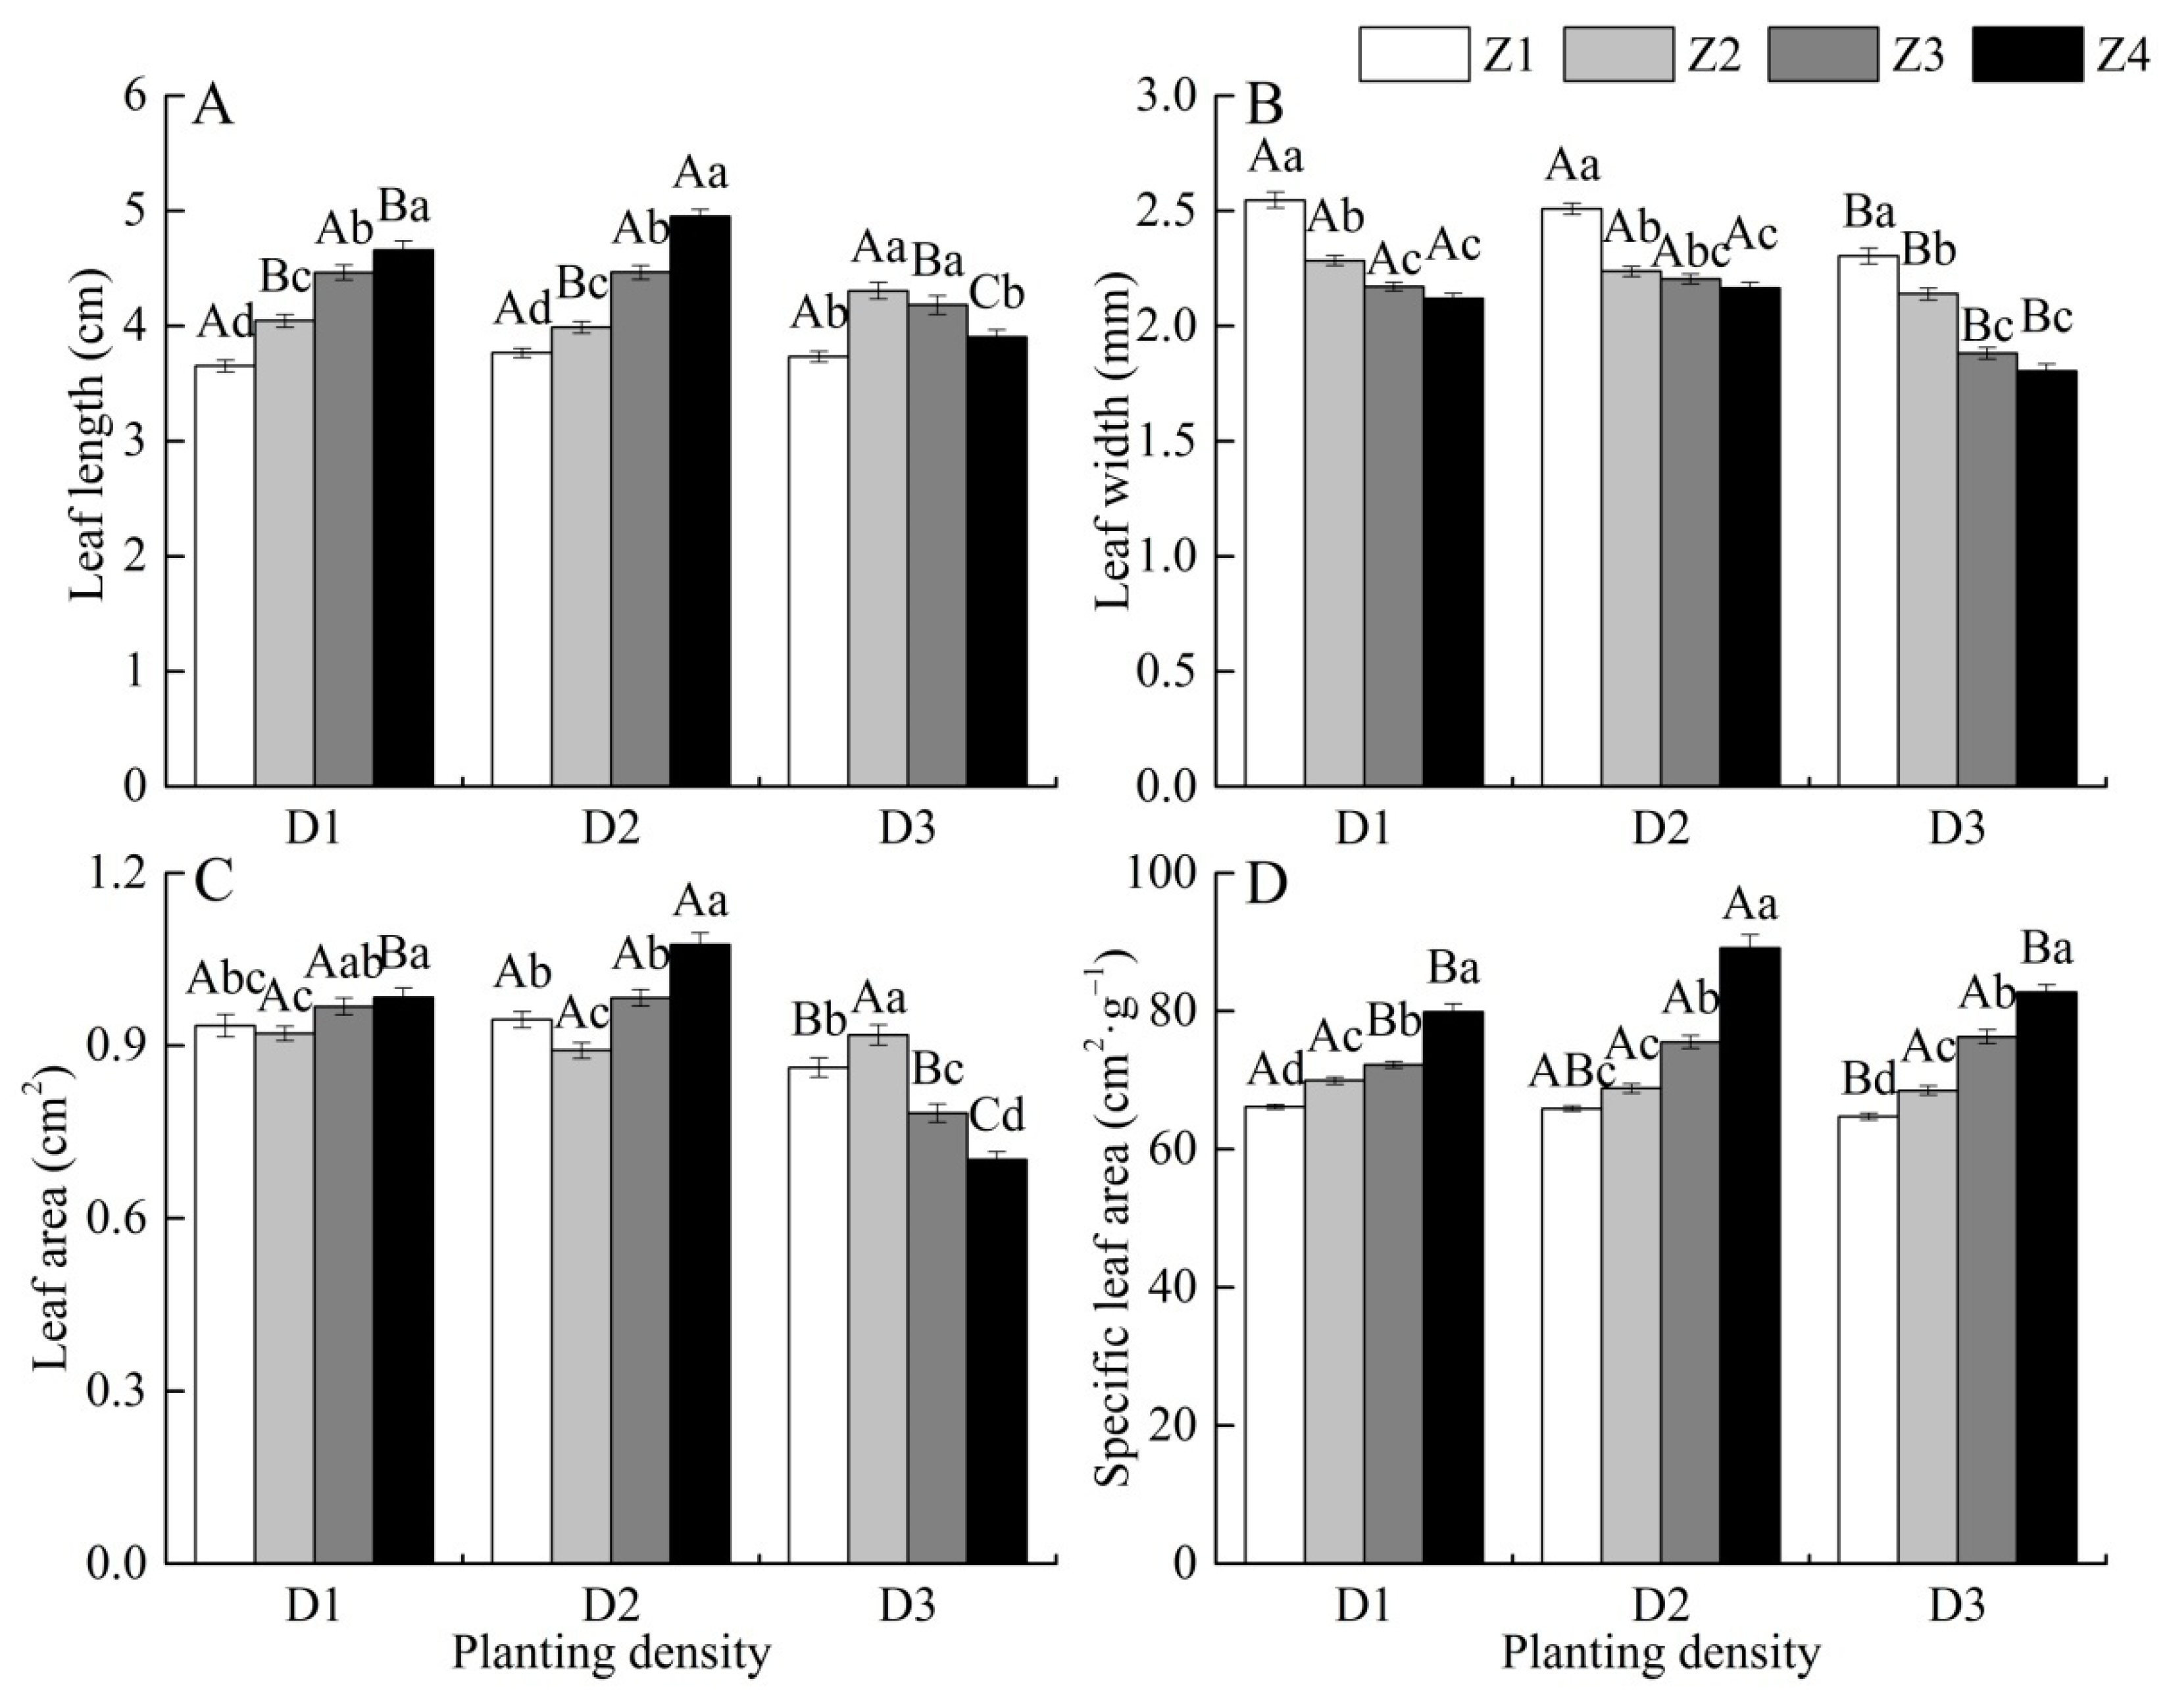
3.2. Effects of Planting Density on Leaf Morphology

Planting density, leaf position, and their interactions, significantly affected leaf length, leaf width, and SLA (Table 1). The D2 planting density had the largest leaf length of all position layers among the planting densities, except for the Z2 leaf position (Figure 1A). Leaf length significantly increased as the leaf position changed under the D1 (p < 0.001) and D2 (p < 0.001) planting densities. In contrast, leaf length initially increased and reached a maximum at the Z2 position, then decreased at the Z3 and Z4 positions under the D3 density. Leaf width decreased consistently with the change in leaf position among the three planting densities (Figure 1B). Particularly under the D3 density, leaves were significantly narrower at the four positions than at other densities. Leaf areas were significantly higher under D1 and D2, than under the D3 planting density, except for the Z2 leaf position, and most were maximal under the D2 density (Figure 1C). Leaf area trends were inconsistent among the planting densities. Both D1 and D2 tended to significantly increase, whereas the D3 density significantly decreased at lower positions. The SLA significantly increased from the Z1 to Z4 positions among all densities (Figure 1D). The SLA was maximum at the lowest leaf position (Z4) at all three densities. The SLAs on the Z1 were significantly smaller than those at the other positions.

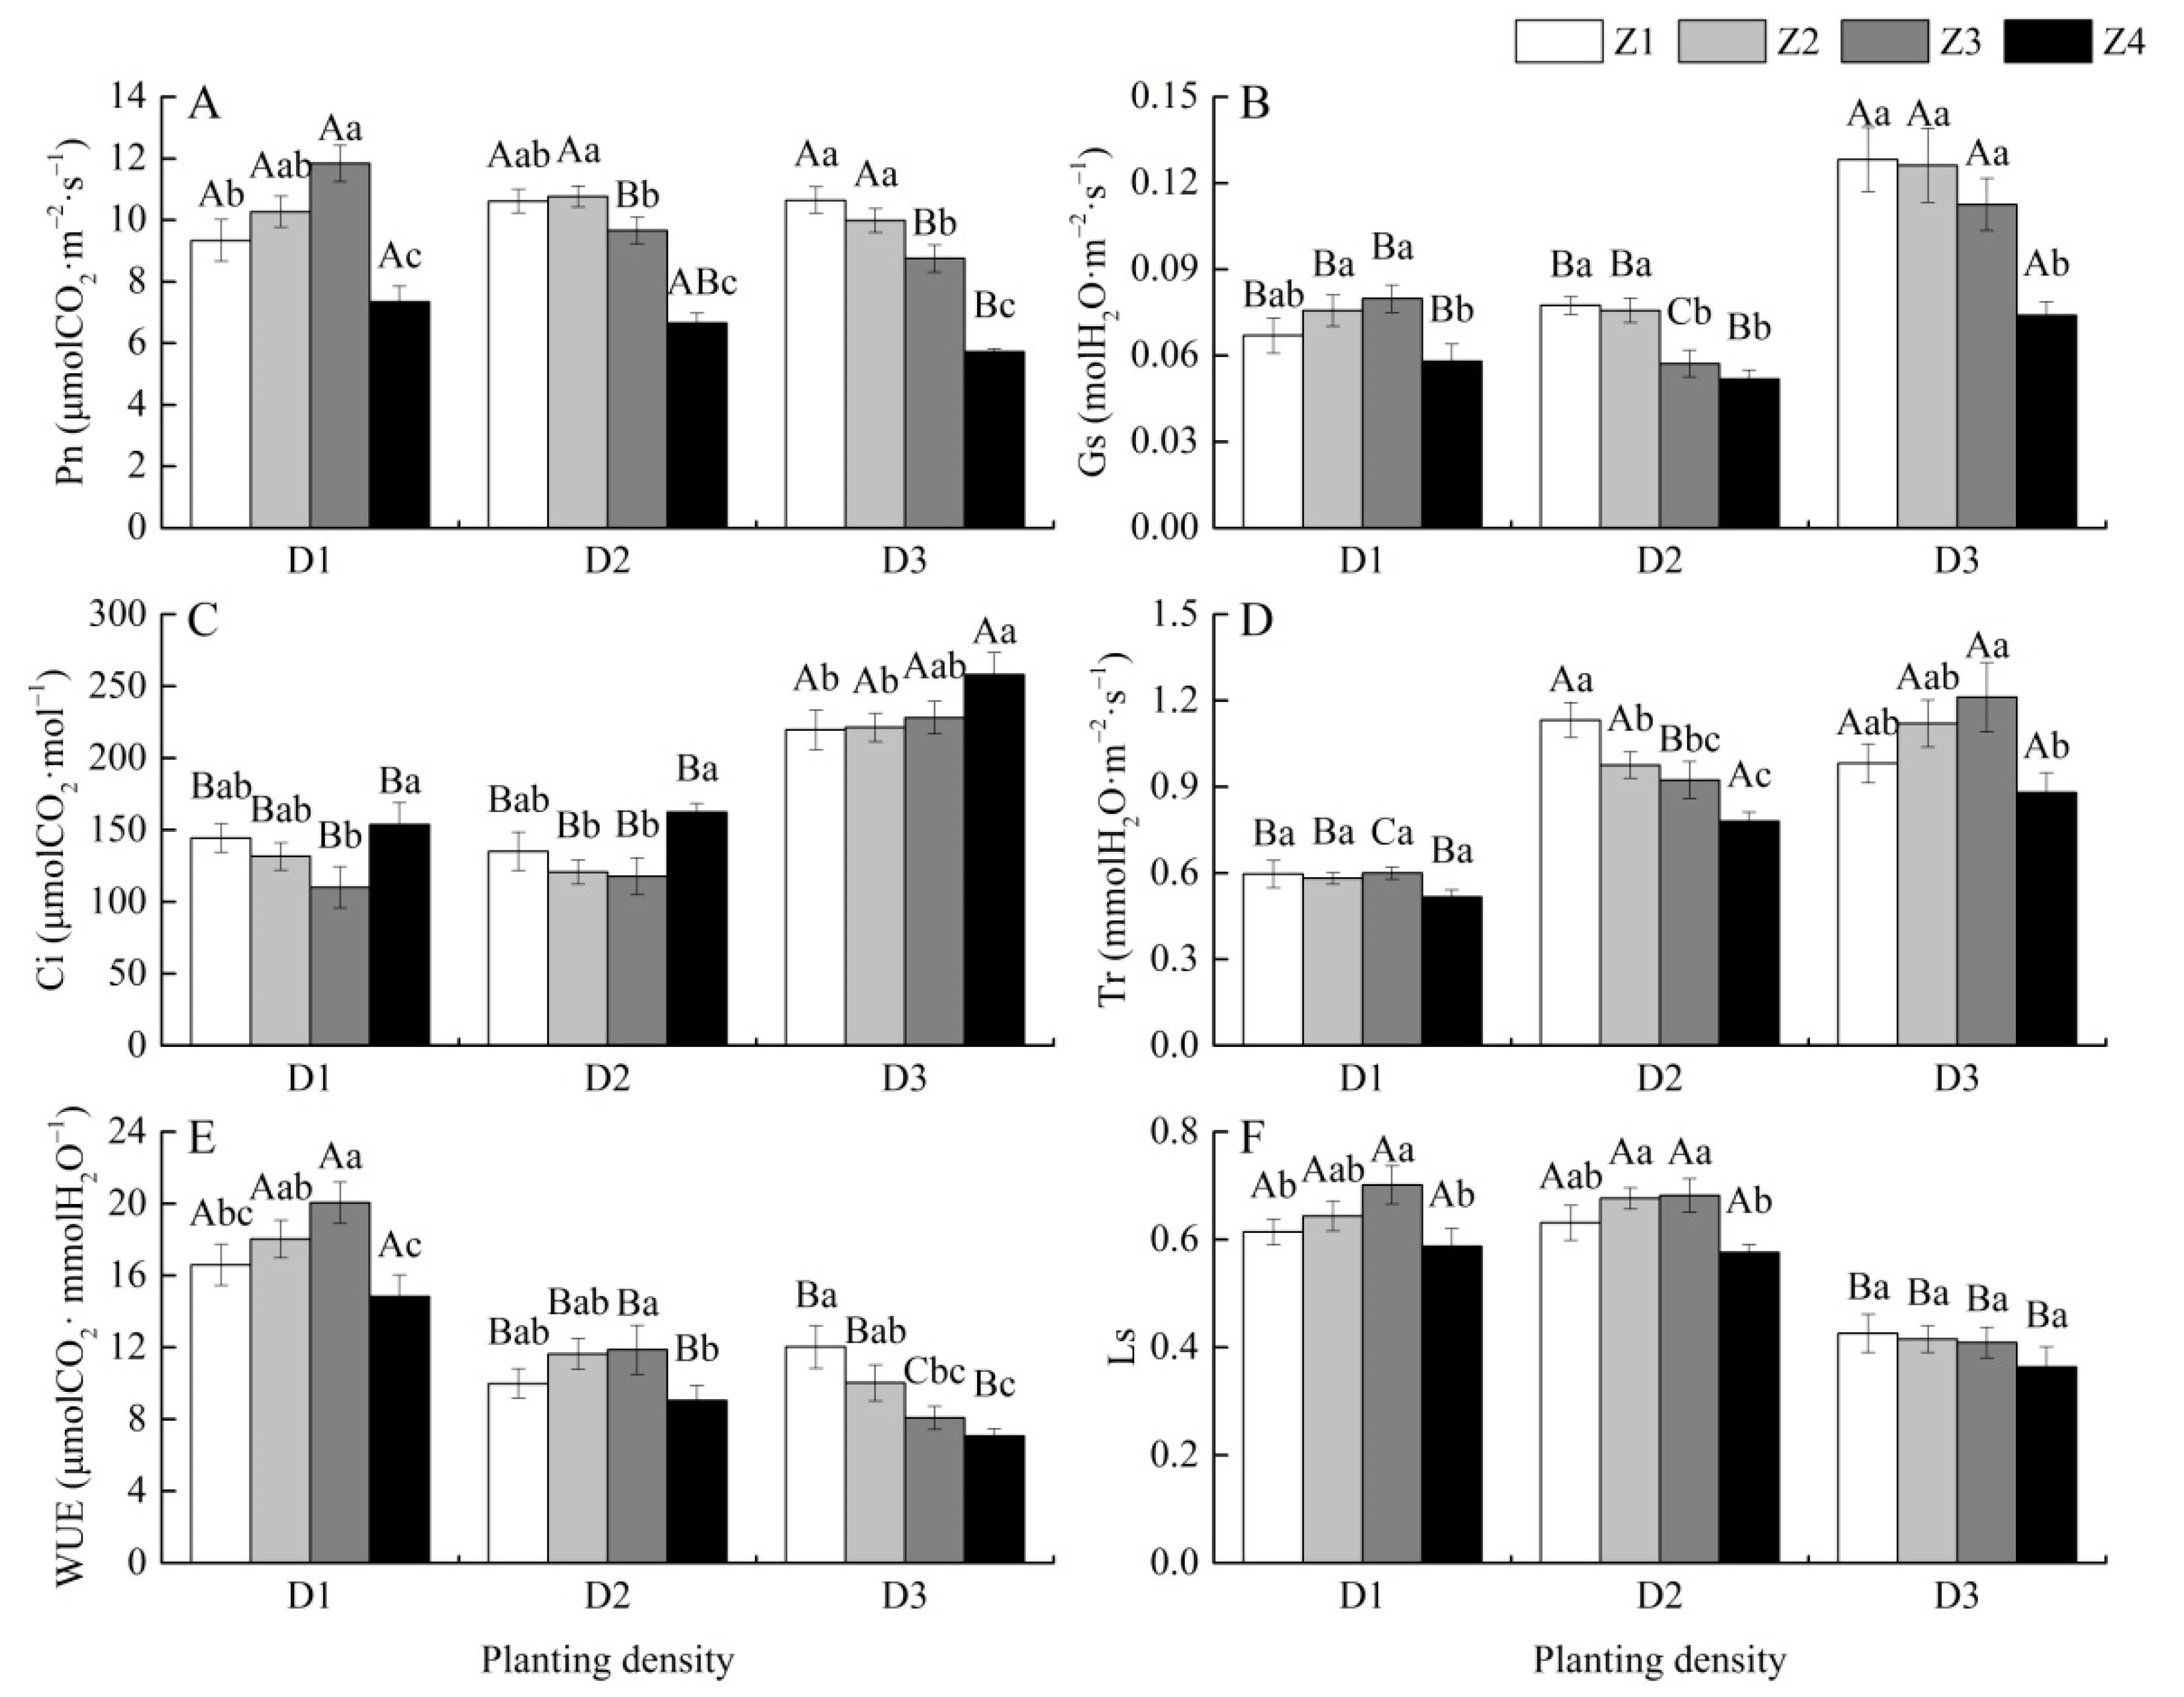
3.3. Effects of Planting Density on Leaf Gas Exchange Parameters

The leaf gas exchange attributes of the leaves at the four positions responded differently to planting density (Figure 2). Pn did not significantly differ at the Z1 and Z2 positions among the three densities, but significantly decreased with increasing density at the Z3 and Z4 positions (Figure 2A) and decreased from the Z1 to the Z4 leaf position under the D2 and D3 planting densities. The Pn was highest at the Z3 position under the D1 density. Leaf stomatal conductance was significantly higher under D3 than the other planting densities across all leaf positions (Figure 2B). Under the three densities, Gs overall tended to decrease among leaf positions. Leaf position did not cause any significant changes in Ci under the D1 (p = 0.089) and D3 (p = 0.122) planting densities. The Ci of all leaf positions was significantly higher under D3 than under the other two densities, reaching a maximum of 258.16 μmol CO2·mol−1 (Figure 2C). Within the same leaf positions in layers under the D2 and D3 planting densities, Tr was significantly higher than D1, and did not significantly differ among different leaf positions under the D1 density (p = 0.199; Figure 2D). WUE was the highest in the D1 planting density across all leaf positions among the three planting densities (Figure 2E). With decreasing leaf position, the WUE initially increased from Z1 to Z3, then declined at the Z4 position under the D1 and D2 densities. However, WUE significantly decreased under the D3 density (p < 0.001). Leaf position did not cause any significant variation in Ls under the D1 (p = 0.057) and D3 (p = 0.527) planting densities. All leaf positions under the D3 planting density had significantly lower Ls and declined with decreasing leaf position, compared with the other densities (Figure 2F).

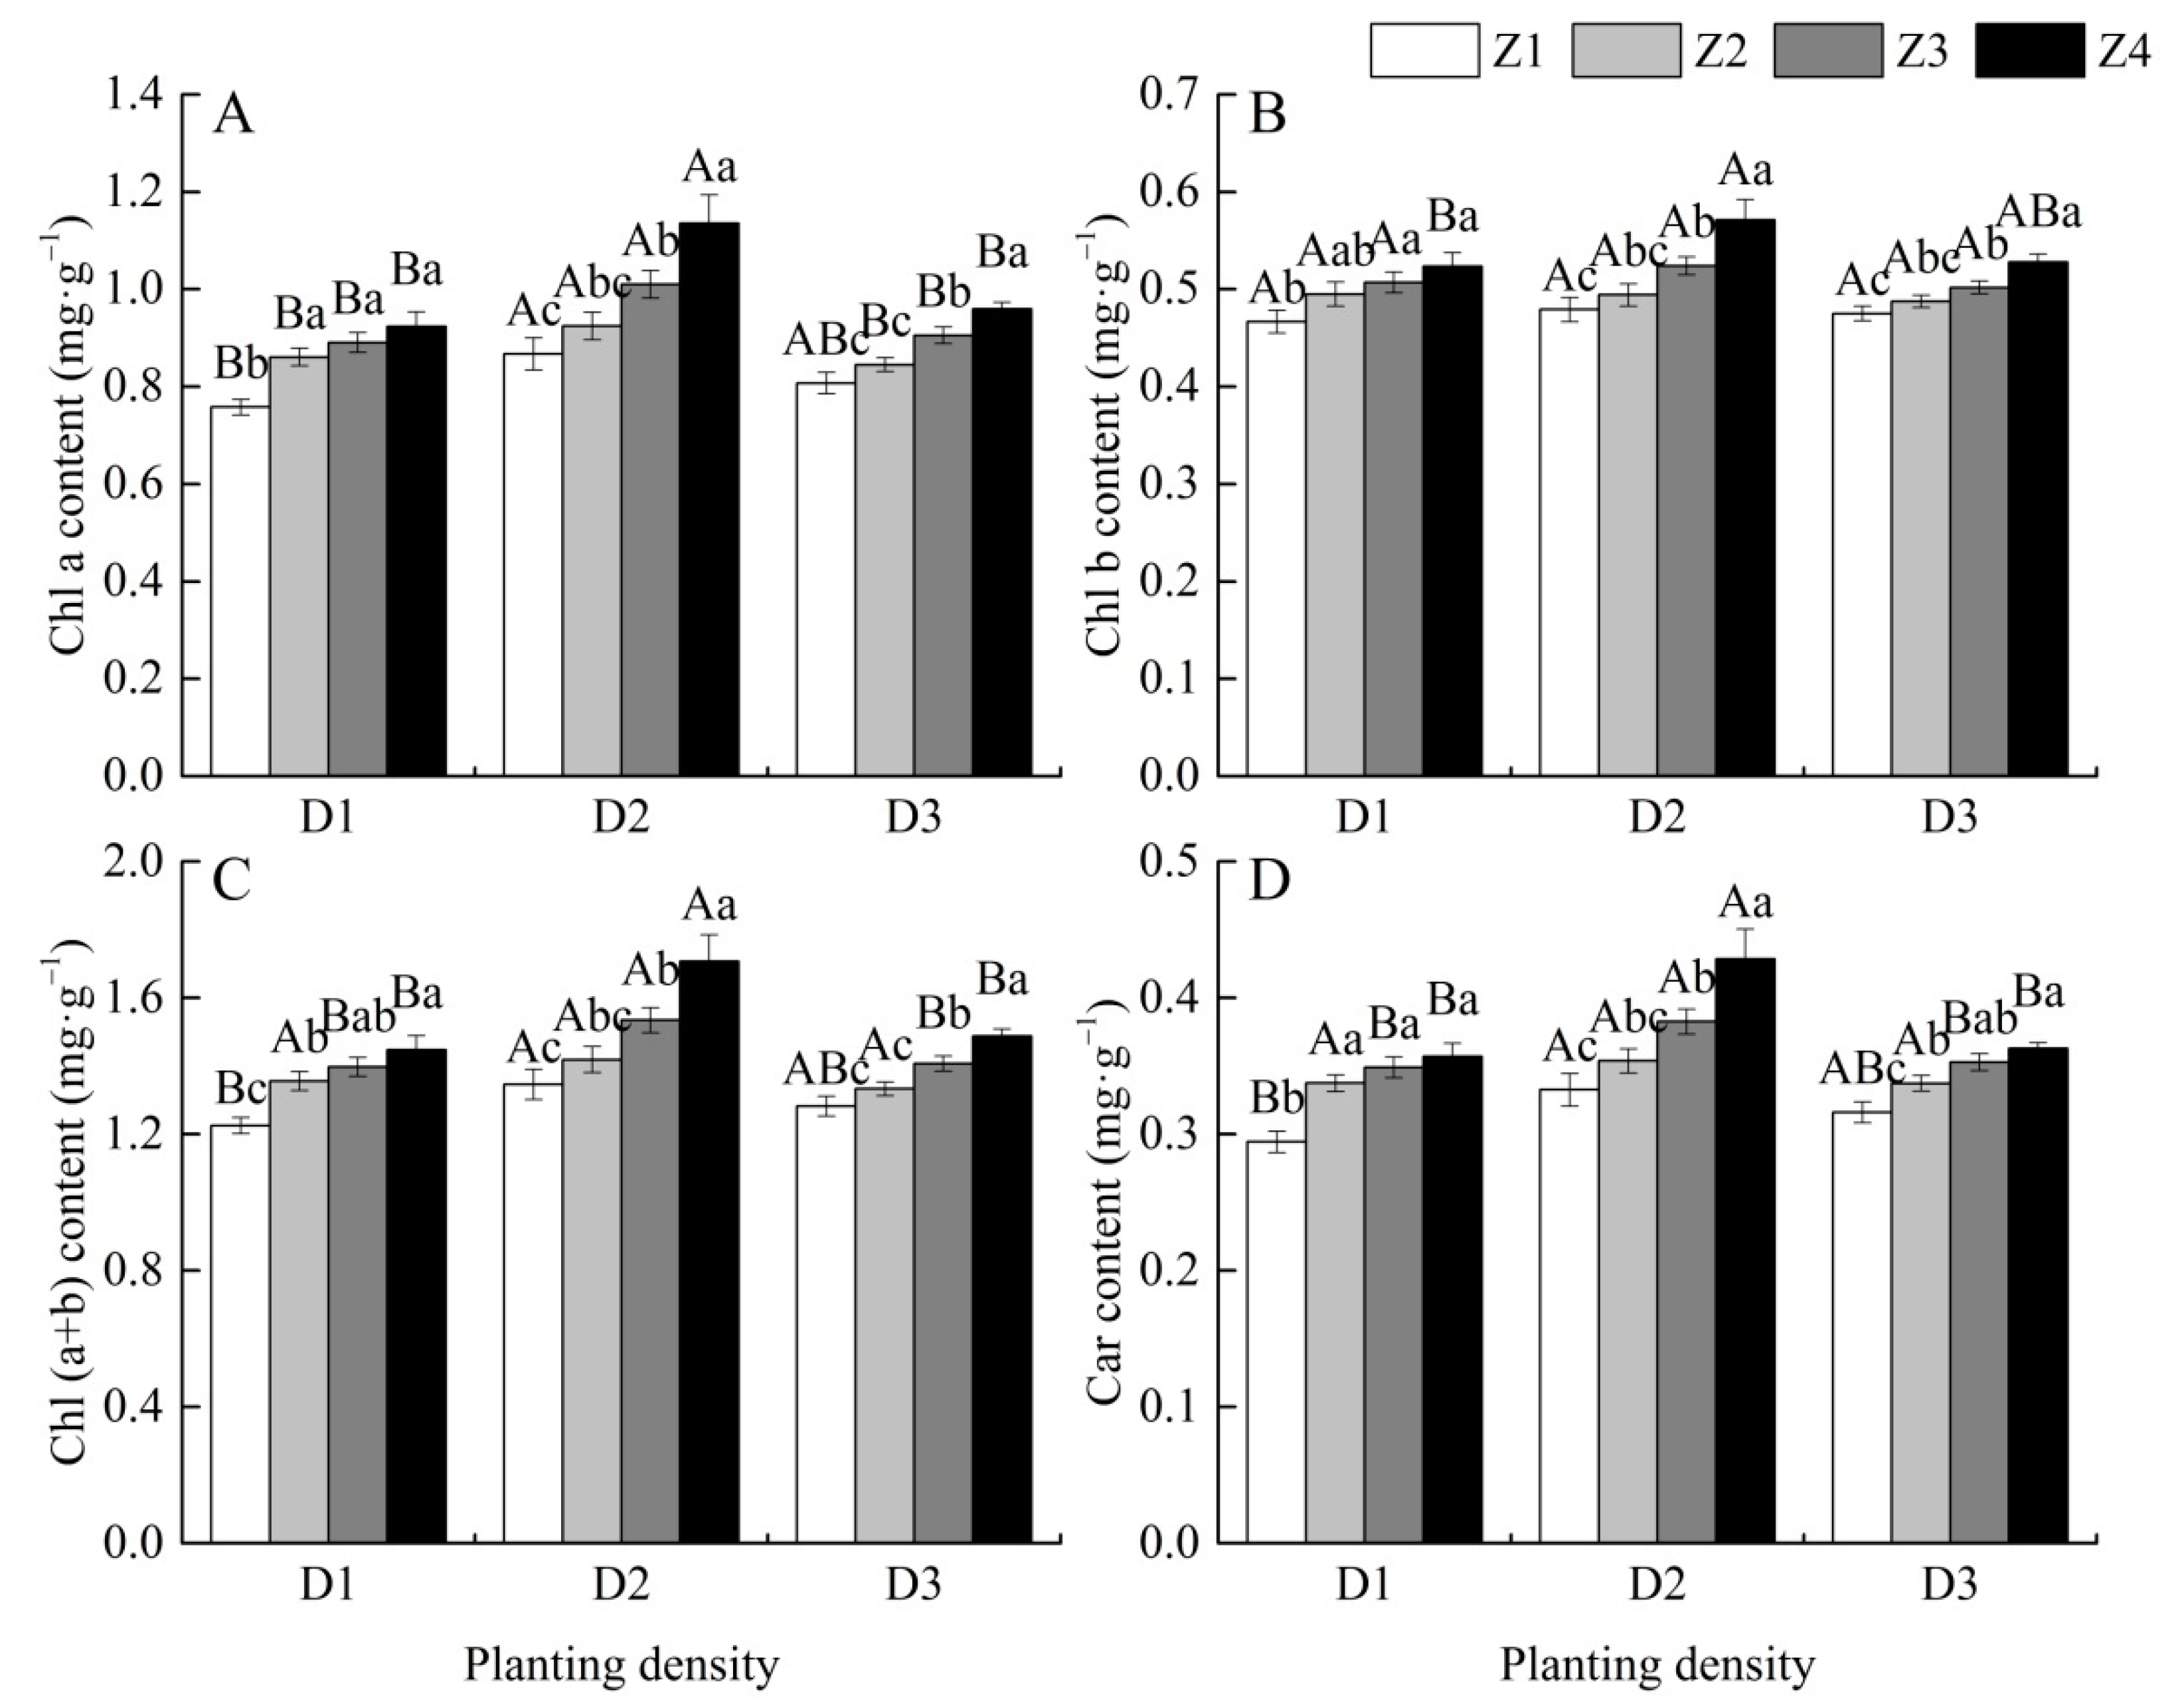
3.4. Effects of Planting Density on Photosynthetic Pigment Contents

The Chl a content significantly differed among the three densities at the same leaf position and appeared to be highest under D2 across all leaf positions, but it did not significantly differ between the D1 and D3 densities (Figure 3A). In contrast, the Chl b content did not significantly vary among all leaf positions under any density (Figure 3B). The Chl (a + b) contents of the Z1 and Z2 leaf positions did not significantly differ among the planting densities (Figure 3C). The Car content was higher at D2 than at the other densities (Figure 3D). The contents of Chl a, Chl b, Chl (a + b), and Car significantly increased with changes in leaf position among the planting densities.

3.5. Phenotypic Plasticity

The traits significantly varied in response to planting density (Table 2). The most plastic traits in response to planting density were leaf gas exchange parameters, in the decreasing order of net photosynthetic rate > water use efficiency > intercellular CO2 concentration > transpiration rate > limiting value of stomata > stomatal conductance. In contrast, the least plastic traits in response to planting density were the photosynthetic pigments, Chl b, Chl (a + b), Car, and Chla contents. The CVs of gas exchange parameters, morphology, and photosynthetic pigments traits were higher for leaves in the Z4 than those of the other leaf positions.

4. Discussion

Plant leaf morphology is mostly plastic in different environments, presumably in part to optimize leaf function according to varied resource constraints, such as light, water, and mineral nutrients [12]. In the current study, with the increase in planting density and the decrease in leaf position between the D1 and D2 densities, the length, area, and SLA of C. lanceolata leaves significantly increased, indicating larger and thinner leaves. This morphological adaptation of C. lanceolata can ensure that leaves maximize light capture and optimize light harvesting under a higher density and alower leaf position. Our findings are in agreement with those reported by Ku et al. [29], who highlighted that plants adapt to density stress by changing leaf architecture to compete more effectively for resources. Moreover, Bhusal et al. [30] found that the leaf length, width, and area of two apple cultivars determined their physiological performance, i.e., a larger leaf size resulted in higher photosynthesis. Shade avoidance is a response to the detection of neighboring plants and begins when planting density increases. This helps plants out grow their neighbors by reallocating resources that enlarge the leaf area and capture maximum sunlight for seedling development. Adjustments at the leaf level are critically important in the forest understorey, where light is usually the most limiting resource [31]. A densely planted and closed canopy also dramatically reduces light penetration in the lower positions and interior parts of the canopy, thereby reducing the interception and availability of light forleaves growing in the understorey. An exponential decrease in the relative photosynthetically active radiation in the canopy with respect to canopy depth was observed in previous studies [32,33]. In contrast, the leaf length, width, and area of C. lanceolata saplings significantly decreased under the D3 planting density. Taken together, C. lanceolata leaves optimize light capture and utilisation by increasing their leaf areas and SLAs within a certain range, as a possible response strategy to increasing planting density and decreasing leaf position. However, they are unlikely to thrive in a heavily shaded understorey under high density. The leaf area was smaller in C. lanceolata grown in the Z1 position; among the three densities, the areas of leaves grown in this position were smaller under exposure to full sunlight and higher temperatures, which might be a protective mechanism. In addition, the specific leaf area of C. lanceolata was smaller in the Z1 position. Our findings are in line with those of Elaeagnus angustifolia leaves, which became smaller and thicker under moreintense light [34]. Because excessive irradiance is detrimental to photosynthetic tissues, plants must produce smaller and thicker leaves with a higher leaf mass per unit area under intense light conditions. This morphology of C. lanceolata leaves allows heat dissipation and helps avoid damage from overheating and high transpiration rates [35,36].
Leaf gas exchange traits are the physiological basis of plant yield and play a central role in biomass formation and accumulation. The Pn is one of the most important indices reflecting photosynthetic capacity and photosynthetic potential productivity [13,37]. The Pn directly affects plant growth and development, which is also influenced by both stomatal and non-stomatal factors [38]. In the present study, as leaf positions decreased in C. lanceolata saplings, Pn increased first from Z1 to Z3, then significantly decreased at the Z4 position under the D1 density. The results indicate that leaves in a high position were exposed to higher temperatures and more intense light. This resulted in stomatal closure, which contributed to CO2 uptake resistance and a stomatal limitation, which might be responsible for depressing Gs and Ci, and in turn suppressed the photosynthetic capacity through the absence of photosynthetic assimilation material and decreased water loss [8]. However, Pn significantly decreased with decreasing position under the D2 and D3 planting densities. This might be because the quality of light becomes significantly less intense with a decrease in the canopy layer under medium and high planting densities. Here, the Pn declined with increasing planting density, probably due to the gradual development of mutual shading between saplings under the D2 and D3 densities. Analysis of Ls and Ci from Z1 to Z3 under the D2 density revealed that leaf position significantly affected the Ls value, which significantly increased. In contrast to Ls, Ci was suppressed, and the changes in Ls values and Ci constituted the main reason for the stomatal limitation that suppressed Pn. Otherwise, Ci significantly increased from Z3 to Z4 under both the D1 and D2 densities, while Ls decreased. In addition, the D3 density induced decreases in Ls and increases in Ci. Accordingly, we deduced that the main reason for the reduced photosynthetic rates of the Z4 position under the D1 and D2 densities and all positions under the D3 density was a non-stomatal limitation [39]. Increasing planting density and decreasing leaf position result in rapid canopy closure and increased radiation interception, which reduces light in the forest understorey. A weaklight environment around leaves adversely affects the development of photosynthetic capacity and light tolerance, which impedes leaf photosynthetic capacity with decreasing Pn, such as the activity and content of ATP and ribulose-1,5-bisphosphate carboxylase-oxygenase (RuBisCo), owing to the existence of a systemic irradiance signal in plants. On the contrary, intercellular CO2 could not be fully utilized and was enriched at the cellular level, so the trend of the intercellular CO2 concentration was upward.
Leaf chlorophyll content is another important factor that determines the rate of photosynthesis and plant growth and also plays an important role in the self-protection mechanism of the plant apparatus under adverse conditions [40]. Chlorophyll content is directly related to the Pn intensity of plants [7,41]. However, the chlorophyll contents of C. lanceolata sapling leaves were not entirely consistent with Pn under both bright and dim light in our study. Indeed, changes inphotosynthesis and chlorophyll content do not always correspond [42]. Excessive irradiance could seriously damage the pigments and impair the photosynthetic system, and we found significantly low chlorophyll contents at high leaf positions and under a low planting density. The effects of light on leaf chlorophyll contents have been confirmed [43,44]. A low Chl a/b ratio indicates highly efficient utilisation of dim light [39,45]. Nevertheless, the Chl a/b ratio of C. lanceolata leaves was higher at lower positions in our study, due to the greater increase in the content of Chl a than Chl b with decreasing leaf position among the different planting densities, which might not be conducive to the capture of a high proportion of blue-violet light in the lower layer position. The contents of Chl (a + b) were maximal and the Pn was minimal in the Z4 leaf positions among the three planting densities, indicating a lesser effect of chlorophyll. The effects of other factors such as chloroplast structure damage, enhanced membrane lipid peroxidation, and decreased ATP and RuBisCo activity and content might be particularly responsible for depressing Pn in the Z4 leaf positions.
The ability of an organism to alter its morphological and physiological traits in response to environmental changes is defined as phenotypic plasticity [46]—an important strategy by which individual plants adjust to environmental heterogeneity [47]. Changes in planting density might have induced differences in morphological and physiological traits that significantly affect C. lanceolata sapling growth. In the present study, the CV was significantly higher for leaf gas exchange parameters than for other traits. Photosynthetic capacity is likely to play a crucial role in facilitating the persistence of C. lanceolata saplings in their environments. However, the photosynthetic pigments of C. lanceolata leaves responded minimally to changes inplanting density. Our findings also confirmed that the capacity for plasticity in leaves atdifferent positions can differ depending on their strategy. In contrast to other positions, both the morphological and physiological traits of leaves in the Z4 position showed the greatest plasticity, as they occur in heterogeneous environments with intense resource competition.

5. Conclusions

Leaf morphology, gas exchange parameters, and photosynthetic pigment contents of C. lanceolata significantly varied in different planting densities and positions. Our findings showed that C. lanceolata leaves can optimize light capture and utilization by increasing leaf areas and specific leaf areas, but the morphological response had some limitations and did function under high density. The leaf physiological traits of C. lanceolata, especially gas exchange parameters, played a key role in the adaptation of C. lanceolata to different planting densities. With the increase in planting density and a decline in leaf position, a dimmer light environment around leaves adversely affected the development of the photosynthetic capacity with decreasing Pn, and the effects of non-stomatal limitation on Pn gradually became apparent. These data further confirmed that the effects of planting density and the environment should be fully considered during C. lanceolata seeding. Ensuring an appropriate planting density, pruning extended and vigorous shoots, and decreasing mutual shading among adjacent mature leaves would improve light penetration and distribution within the tree canopy, and consequently enhance the photosynthetic capability of C. lanceolata leaves and increase plantation yield. Taken together, the study is of great significance for a yield increase and the management of C. lanceolata plantation.

Author Contributions

Z.H. and X.M. conceived and designed the study. Z.H., B.A., X.W. and L.S. conducted the field experiment; Z.H., Q.L. and B.A. collected and analyzed the data and drafted the manuscript; P.W., B.L. and X.M. edited the English version of the manuscript. All the authors contributed to the writing of the manuscript. All authors have read and agreed to the published version of the manuscript.

Funding

This study was funded by the Science and Technology Major Project of Fujian Province (2018NZ0001-1), and the Scientific Research Foundation of the Graduate School of Fujian Agriculture and Forestry University (324-1122yb071).

Data Availability Statement

Data sharing is not applicable to this article.

Conflicts of Interest

The authors declare no conflict of interest.

References

  1. Jafari, T.; Rahikainen, M.; Puljula, E.; Sinkkonen, J.; Kangasjärvi, S. The impact of light intensity on metabolomic profile of Arabidopsis thaliana wild type and reticulata mutant by NMR spectroscopy. Phytochem. Lett. 2018, 26, 170–178. [Google Scholar] [CrossRef]
  2. Nicotra, A.B.; Atkin, O.K.; Bonser, S.P.; Davidson, A.M.; Finnegan, E.J.; Mathesius, U.; Poot, P.; Purugganan, M.D.; Richards, C.L.; Valladares, F.; et al. Plant phenotypic plasticity in a changing climate. Trends Plant Sci. 2010, 15, 684–692. [Google Scholar] [CrossRef]
  3. Zhang, S.R.; Ma, K.P.; Chen, L.Z. Response of photosynthetic plasticity of Paeoniasuffruticosa to changed light environments. Environ. Exp. Bot. 2003, 49, 121–133. [Google Scholar] [CrossRef]
  4. Harrington, T.B.; Harrington, C.A.; DeBell, D.S. Effects of planting spacing and site quality on 25-year growth and mortality relationships of Douglas-fir (Pseudotsugamenziesii var. menziesii). For. Ecol. Manag. 2009, 258, 18–25. [Google Scholar] [CrossRef]
  5. Rodney, W.; Thomas, H.; Thomas, L.; Randal, H.; Robert, H. Effects of planting density and seed source on loblolly pine stands in southeastern Oklahoma. For. Sci. 2010, 56, 437–443. [Google Scholar]
  6. Moreno, G.; Cubera, E. Impact of stand density on water status and leaf gas exchange in Quercus ilex. For. Ecol. Manag. 2008, 254, 74–84. [Google Scholar] [CrossRef]
  7. Dai, Y.J.; Shen, Z.G.; Liu, Y.; Wang, L.L.; Hannaway, D.; Lu, H.F. Effects of shade treatments on the photosynthetic capacity, chlorophyll fluorescence, and chlorophyll content of Tetrastigmahemsleyanum Diels et Gilg. Environ. Exp. Bot. 2009, 65, 177–182. [Google Scholar] [CrossRef]
  8. Tang, H.; Hu, Y.Y.; Yu, W.W.; Song, L.L.; Wu, J.S. Growth, photosynthetic and physiological responses of Torreya grandis seedlings to varied light environments. Trees. 2015, 29, 1011–1022. [Google Scholar] [CrossRef]
  9. Pearcy, R.W. Responses of plants to heterogeneous light environments. In Handbook of Functional Plant Ecology; Dekker, M., Ed.; CRC Press: New York, NY, USA, 2007; pp. 213–258. [Google Scholar]
  10. Gandolfi, S.; Joly, C.A.; Leitão Filho, H.F. “Gaps of deciduousness”: Cyclical gaps in tropical forests. Sci. Agric. 2009, 66, 280–284. [Google Scholar] [CrossRef]
  11. Vemmos, S.N.; Petri, E.; Stournaras, V. Seasonal changes in photosynthetic activity and carbohydrate content in leaves and fruit of three fig cultivars (Ficuscarica L.). Sci. Hortic. Amst. 2013, 160, 198–207. [Google Scholar] [CrossRef]
  12. Chen, F.S.; Zeng, D.H.; Fahey, T.J.; Yao, C.Y.; Yu, Z.Y. Response of leaf anatomy of Chenopodium acuminatum to soil resource availability in a semi-arid grassland. Plant Ecol. 2010, 209, 375–382. [Google Scholar] [CrossRef]
  13. Xia, J.B.; Lang, Y.; Zhao, Q.K.; Liu, P.; Su, L. Photosynthetic characteristics of Tamarixchinensis under different groundwater depths in freshwater habitats. Sci. Total Environ. 2020, 761, 143221. [Google Scholar] [CrossRef]
  14. Guo, Q.X.; Song, H.F.; Kang, J.Y.; Korpelainen, H.; Li, C.Y. Different responses in leaf-level physiology to competition and facilitation under different soil types and N fertilization. Environ. Exp. Bot. 2018, 150, 69–78. [Google Scholar] [CrossRef] [Green Version]
  15. Jiang, C.D.; Wang, X.; Gao, H.Y.; Shi, L.; Chow, W.S. Systemic regulation of leaf anatomical structure, photosynthetic performance, and high-light tolerance in sorghum. Plant Physiol. 2011, 155, 1416–1424. [Google Scholar] [CrossRef] [PubMed] [Green Version]
  16. Bhusal, N.; Bhusal, S.J.; Yoon, T.M. Comparisons of physiological and anatomical characteristics between two cultivars in bi-leader apple trees (Malus x domestica Borkh.). Sci. Hortic. Amst. 2018, 231, 73–81. [Google Scholar] [CrossRef]
  17. Santos, V.; Ferreira, M. Are photosynthetic leaf traits related to the first-year growth of tropical tree seedlings? A light-induced plasticity test in a secondary forest enrichment planting. For. Ecol. Manag. 2020, 460, 117900. [Google Scholar] [CrossRef]
  18. Carlson, J.E.; Adams, C.A.; Holsinger, K.E. Intraspecific variation in stomatal traits, leaf traits and physiology reflects adaptation along aridity gradients in a South African shrub. Ann. Bot. 2016, 117, 195–207. [Google Scholar] [CrossRef] [Green Version]
  19. Liu, Q.Q.; Huang, Z.J.; Wang, Z.N.; Chen, Y.F.; Wen, Z.M.; Liu, B.; Tigabu, M. Responses of leaf morphology, NSCs contents and C:N:P stoichiometry of Cunninghamia lanceolata and Schima superba to shading. BMC Plant Biol. 2020, 20, 386–403. [Google Scholar]
  20. SFA. Reports of Chinese Forestry Resource: The 8th National Forest Resource Inventory; Chinese Forestry Publishing House: Beijing, China, 2013; p. 16. [Google Scholar]
  21. Duan, A.G.; Lei, J.; Hu, X.Y.; Zhang, J.G.; Du, H.L.; Zhang, X.Q.; Guo, W.F.; Sun, J.J. Effects of planting density on soil bulk density, pH and nutrients of unthinned Chinese fir mature stands in south subtropical region of China. Forests. 2019, 10, 351. [Google Scholar] [CrossRef] [Green Version]
  22. Xiang, C.W.; Zhang, J.G.; Duan, A.G.; Zhang, X.Q. Effects of planting density and site quality on stand volume of Chinese fir plantation. For. Res. 2014, 27, 801–808. [Google Scholar]
  23. Wang, C.Q.; Xue, L.; Dong, Y.H.; Hou, L.Y.; Wei, Y.H.; Jiao, R.Z. Responses of soil microbial community structure to stand densities of Chinese fir plantations. J. For. Res. 2019, 24, 162–167. [Google Scholar] [CrossRef]
  24. Wang, C.Q.; Xue, L.; Jiao, R.Z. Soil phosphorus fractions, phosphatase activity, and the abundance of pho C and pho D genes vary with planting density in subtropical Chinese fir plantations. Soil Till. Res. 2021, 209, 104946. [Google Scholar] [CrossRef]
  25. Modrzyński, J.; Chmura, D.J.; Tjoelker, M.G.; Thomas, S. Seedling growth and biomass allocation in relation to leaf habit and shade tolerance among 10 temperate tree species. Tree Physiol. 2015, 35, 879–893. [Google Scholar] [CrossRef] [Green Version]
  26. Liu, X.M.; Wang, L.; Wei, Y.; Zhang, Z.H.; Zhu, H.; Kong, L.G.; Meng, S.Y.; Song, C.D.; Wang, H.T.; Ma, F.Y. Irrigation with magnetically treated saline water influences the growth and photosynthetic capability of Vitis vinifera L. seedlings. Sci. Hortic. Amst. 2020, 262, 109056. [Google Scholar] [CrossRef]
  27. Li, H.S. Principles and Techniques of Plant Physiological and Biochemical Experimental; Higher Education Press: Beijing, China, 2000; pp. 134–137. [Google Scholar]
  28. Kramer-Walter, K.R.; Laughlin, D.C. Root nutrient concentration and biomass allocation are more plastic than morphological traits in response to nutrient limitation. Plant Soil. 2017, 416, 539–550. [Google Scholar] [CrossRef]
  29. Ku, L.X.; Ren, Z.Z.; Chen, X.; Shi, Y.; Qi, J.S.; Su, H.H.; Wang, Z.Y.; Li, G.H.; Wang, X.B.; Zhu, Y.G.; et al. Genetic analysis of leaf morphology underlying the plant density response by QTL mapping in maize (Zea mays L.). Mol. Breed. 2016, 36, 63. [Google Scholar] [CrossRef]
  30. Bhusal, N.; Kim, H.S.; Han, S.G.; Yoon, T.M. Photosynthetic traits and plant–water relations of two apple cultivars grown as bi-leader trees under long-term waterlogging conditions. Environ. Exp. Bot. 2020, 176, 1041. [Google Scholar] [CrossRef]
  31. Granata, M.U.; Bracco, F.; Nola, P.; Catoni, R. Photosynthetic characteristic and leaf traits variations along a natural light gradient in Acer campestre and Crataegus monogyna. Flora 2020, 268, 151626. [Google Scholar] [CrossRef]
  32. Khan, M.N.I.; Khatun, S.; Azad, M.S.; Mollick, A.S. Leaf morphological and anatomical plasticity in Sundri (Heritiera fomes Buch.-Ham.) along different canopy light and salinity zones in the Sundarbans mangrove forest, Bangladesh. Glob. Ecol. Conserv. 2020, 23, 1–15. [Google Scholar] [CrossRef]
  33. Khan, M.N.I.; Suwa, R.; Hagihara, A.; Ogawa, K. Interception of photosynthetic photon flux density in a mangrove stand of Kandeliacandel (L.) Druce. J. For. Res. 2004, 9, 205–210. [Google Scholar] [CrossRef]
  34. Klich, M.G. Leaf variations in Elaeagnus angustifolia related to environmental heterogeneity. Environ. Exp. Bot. 2000, 44, 171–183. [Google Scholar] [CrossRef]
  35. Nascimento, K.C.; Pastorini, L.H.; Romagnolo, M.B.; de Souza, L.A. Do Eugenia hiemalis seedling leaves under different light conditions develop phenotypic plasticity? Plant Ecol. 2015, 216, 1571–1581. [Google Scholar] [CrossRef]
  36. Liu, B.; Liu, Q.Q.; Daryanto, S.; Guo, S.; Huang, Z.J.; Wang, Z.N.; Wang, L.X.; Ma, X.Q. Responses of Chinese fir and Schimasuperba seedlings to light gradients: Implications for the restoration of mixed broadleaf-conifer forests from Chinese fir monocultures. For. Ecol. Manag. 2018, 419–420, 51–57. [Google Scholar] [CrossRef] [Green Version]
  37. Xu, D.Q. Photosynthetic Efficiency; Shanghai science and Technology Press: Shanghai, China, 2002. [Google Scholar]
  38. Farquhar, G.D.; Sharkey, T.D. Stomatal conductance and photosynthesis. Plant Physiol. 1982, 33, 317–345. [Google Scholar] [CrossRef]
  39. Gutiérrez, D.; Gutiérrez, E.; Pérez, P.; Morcuende, R.; Verdejo, A.L.; Martinez-Carrasco, R. Acclimation to future atmospheric CO2 levels increases photochemical efficiency and mitigates photochemistry inhibition by warm temperatures in wheat under field chambers. Physiol. Plant. 2009, 137, 86–100. [Google Scholar] [CrossRef] [PubMed] [Green Version]
  40. Ma, X.H.; Song, L.L.; Yu, W.W.; Hu, Y.Y.; Liu, Y.; Wu, J.S.; Ying, Y.Q. Growth, physiological, and biochemical responses of Camptothecaacuminata seedlings to different light environments. Front. Plant Sci. 2015, 6, 321. [Google Scholar] [CrossRef] [Green Version]
  41. Hallik, L.; Niinemets, U.; Kull, O. Photosynthetic acclimation to light in woody and herbaceous species: A comparison of leaf structure, pigment content and chlorophyll fluorescence characteristics measured in the field. Plant Biol. 2012, 14, 88–99. [Google Scholar] [CrossRef]
  42. Shao, M.J.; Liu, W.K.; Zha, L.Y.; Zhou, C.B.; Zhang, Y.B.; Li, B.S. Altering light-dark cycle at pre-harvest stage regulated growth, nutritional quality, and photosynthetic pigment content of hydroponic lettuce. Acta Physiol. Plant. 2021, 43, 9. [Google Scholar] [CrossRef]
  43. Shao, Q.S.; Wang, H.Z.; Guo, H.P.; Zhou, A.C.; Huang, Y.Q.; Sun, Y.L.; Li, M.Y. Effects of shade treatments on photosynthetic characteristics, chloroplast ultrastructure, and physiology of Anoectochilus roxburghii. PLoS ONE. 2014, 9, e85996. [Google Scholar] [CrossRef]
  44. Griffin, J.J.; Ranney, T.G.; Pharr, D.M. Photosynthesis, chlorophyll fluorescence, and carbohydrate content of illicium taxa grown under varied irradiance. J. Am. Soc. Hort. Sci. 2004, 129, 46–53. [Google Scholar] [CrossRef] [Green Version]
  45. Fontana, M.; Collin, A.; Courchesne, F.; Labrecque, M.; Bélanger, N. Root system architecture of Salix miyabeana “SX67” and relationships with aboveground biomass yields. Bio. Energy Res. 2020, 13, 183–196. [Google Scholar] [CrossRef]
  46. Fagundes, M.D.; Dalmolin, A.C.; Lobo, L.S.; Schilling, A.C.; dos Santos, M.S.; Mielke, M.S. Growth and phenotypic plasticity of two tropical tree species under low light availability. J. Plant Ecol. 2021, 14, 270–279. [Google Scholar] [CrossRef]
  47. Limón, F.; González-Astorga, J.; Nicolalde-Morejón, F.; Guevara, R. Phenotypic variation of Zamia loddigesii Miq. and Z. prasina W. Bull. (Zamiaceae, Cycadales): The effect of environmental heterogeneity. Plant Syst. Evol. 2016, 302, 1395–1404. [Google Scholar] [CrossRef]
Figure 1. Leaf length (A), leaf width (B), leaf area (C), and specific leaf area (D) of C. lanceolata saplings under different planting densities (D1–D3). Bars are the mean values with standard error. Lowercase letters indicate significant differences among leaf position variations (Z1–Z4) at the same planting density; capital letters indicate significant differences among planting density variations at the same leaf position. D1 = low density, approximately 900 trees·ha−1, D2 = medium density, approximately 2505 trees·ha−1, D3 = high density, approximately 6660 trees·ha−1; Z1 = first layer, Z2 = second layer, Z3 = third layer, and Z4 = fourth layer.
Forests 12 00853 g001
Figure 2. Net photosynthetic rate (Pn, (A)), stomatal conductance (Gs, (B)), intercellular CO2 concentration (Ci, (C)), transpiration rate (Tr, (D)), water use efficiency (WUE, (E)), and limiting value of stomata (Ls, (F)) of C. lanceolata saplings in different leaf positions (Z1–Z4) and under different planting densities (D1–D3; as detailed in the caption of Figure 1).
Forests 12 00853 g002
Figure 3. Chlorophyll a (Chl a, (A)), chlorophyll b (Chl b, (B)), Chl (a + b) (C), and carotenoid (Car, (D)) contents of C. lanceolata saplings in different leaf positions (Z1–Z4) and under different planting densities (D1–D3; as detailed in the caption of Figure 1).
Forests 12 00853 g003
Table 1. Summary of ANOVA for main effects of density (df = 2), position (df = 3), and interactions (df = 6) with leaf morphology and photosynthetic characteristics of C. lanceolata saplings (n = 9).
GroupTraitF-ValueModel R2
Planting DensityLeaf PositionPlanting Density × Leaf Position
MorphologyLeaf length18.776 ***96.263 ***24.772 ***0.308
Leaf width121.998 ***158.859 ***5.542 ***0.414
Leaf area111.154 ***0.221 ns30.034 ***0.274
Specific leaf area9.284 ***225.683 ***7.945 ***0.410
Gas exchange parametersNet photosynthetic rate4.450 **49.233 ***4.962 ***0.477
Stomatal conductance50.285 ***12.840 ***2.835 **0.433
Intercellular CO2 concentration88.031 ***6.326 ***0.666ns0.494
Transpiration rate66.897 ***6.286 ***2.729 **0.453
Water use efficiency74.294 ***6.091 ***2.676 **0.473
Limiting value of stomata86.676 ***5.064 **0.706 ns0.486
Photosynthetic pigment contentChl a 23.674 ***27.126 ***1.564 ns0.590
Chl b 3.575 *18.307 ***0.992 ns0.415
Car 18.072 ***25.563 ***1.972 ns0.565
Chl (a + b) 17.422 ***26.706 ***1.512 ns0.564
Significance of F-ratio: * p < 0.05, ** p < 0.01, *** p < 0.001, ns—not significant.
Table 2. Coefficient of variation (CV%) for each trait and leaf position, ranked from highest to lowest across leaf position (n = 27).
GroupTraitZ1Z2Z3Z4Average CV
Gas exchange
parameters
Net photosynthetic rate40.5640.3651.0148.0745.00
Water use efficiency45.7845.8342.6335.7942.51
Intercellular CO2 concentration38.8637.7250.1637.5941.08
Transpiration rate37.0936.3545.8434.0438.33
Limiting value of stomata28.5126.7131.6331.7529.65
Stomatal conductance21.6517.1224.2224.7121.93
MorphologyLeaf area18.0515.3318.6225.1219.28
Leaf length11.6314.2715.2417.1314.57
Leaf width12.8510.2412.0614.5912.43
Specific leaf area5.898.3511.1017.0910.61
Photosynthetic pigment contentChl a10.457.969.0414.5410.50
Car 10.026.407.5313.649.40
Chl (a + b)8.526.797.3612.298.74
Chl b6.626.115.489.096.82
Leaf position average21.1819.9723.7123.96
Publisher’s Note: MDPI stays neutral with regard to jurisdictional claims in published maps and institutional affiliations.

