Article

Compost and PGP-Based Biostimulant as Alternative to Peat and NPK Fertilization in Chestnut (Castanea Sativa Mill.) Nursery Production

by
Teresa Fuertes-Mendizábal
*,
Ximena Huérfano
,
Unai Ortega
,
Carmen González-Murua
,
José María Estavillo
,
Isabel Salcedo
and
Miren K. Duñabeitia
Department of Plant Biology and Ecology, Faculty of Science and Technology, The University of the Basque Country (UPV/EHU), Barrio Sarriena s/n, 48940 Leioa, Spain
*
Author to whom correspondence should be addressed.
Forests 2021, 12(7), 850; https://doi.org/10.3390/f12070850
Submission received: 4 June 2021 / Revised: 17 June 2021 / Accepted: 24 June 2021 / Published: 28 June 2021

Abstract

:
In forest nurseries, intensive use of non-renewable substrates such as peat and high application rates of chemical synthesis fertilizers lead to environmental problems and high susceptibility to biotic and abiotic stresses. This work aims to seek more sustainable crop management to help mitigate these problems, combining the substitution of peat by compost and the use of growth-promoting microorganisms (PGPs) as a fertilization tool. For this purpose, a trial was carried out to test the effectiveness of an agricultural waste compost and a biostimulant based on PGP microorganisms in the production of Castanea sativa plants in a forest nursery. This trial assessed the growth of plants, with both inputs separately and combined, and then studied the tolerance of chestnut seedlings to water deficit. The results showed that partial substitution of peat by compost is possible, but not complete, as the high levels of conductivity and pH generated by a high proportion of compost negatively affected plant growth. It was also noted that the application of the biostimulant enables the complete substitution of mineral fertilization. Moreover, at the end of the nursery phase, chestnut seedlings treated with the biostimulant showed the same or even better quality than chestnut seedlings obtained with conventional fertilization, also resulting in greater resistance to water deficit, based on the increase in root volume and the improvement of the physiological status. Changes observed in both quantity and composition of microbiota associated with chestnut rhizosphere after inoculation with PGPs were related to the improvement observed. In relation to water deficit resistance, a positive synergy was also observed with the combination of both inputs, since plants with full substitution of peat by compost combined with PGP-based fertilization showed the greatest drought resistance.

1. Introduction

European chestnut (Castanea sativa Mill.) is a deciduous species widely distributed in the Mediterranean regions of Europe and Asia, highly valued and traditionally cultivated for timber and fruit production. At the end of the XIX century, its cultivation suffered a significant regression by the decline in the use of chestnut as a diet basis and by the onset of ink and canker diseases. However, nowadays, many factors help raise awareness of the value of chestnut trees as a multifunctional landscape element [1]. Among them, the revaluation of chestnut as a food of high nutritional value, the development of improved forest breeding materials, and the possibility of using them for the cultivation of edible fungi, coupled with the need to seek alternatives to exotic conifer populations (severely affected by various fungal diseases), promotes chestnut tree cultivation as a competitive alternative in reforestation projects. The success of reforestation will depend largely on seedling quality at the time of planting. After transplanting to the field, the seedlings will be subjected to both abiotic and biotic stresses, mainly water deficit [2], so it is essential to produce seedlings with a high morpho-physiological quality in the nursery in order to obtain a higher survival rate, faster growth, and greater stability of future trees.
In the nursery management, substrate and fertilization are the most important factors influencing the final characteristics of container-grown seedlings [3]. The most commonly used substrate is peat [4], since peat generally tends to possess excellent physical, chemical, and biological properties for plant growth and development [5], and widespread reserves of peat have so far been available in the northern hemisphere, making it an available and relatively cheap resource [6]. However, peat is a limited resource, and its intensive use will eventually deplete reserves and have negative impacts on the environment [7]. In fact, peat extraction has been limited by peat-exporting countries in northern and central Europe [8]. On the other hand, conventional fertilization applied in virtually all forest nurseries is based on the use of chemically-synthesized fertilizers, which can generate environmental problems such as eutrophication processes, increases in greenhouse gaseous emissions, substrate acidification, or increased plant susceptibility to pathogenic organisms [9]. In addition, the uptake of nitrogen easily available from mineral fertilizer may have unfavorable effects by causing morphological imbalances due to greater development of shoots with respect to roots [10], which may favor susceptibility to water deficit.
In this context, one of the modern forestry challenges is to propose alternatives to the use of mineral fertilization and peat as non-renewable substrates, fitting with the concept of the circular economy. In this line, the use of compost as an alternative to peat in forest nurseries is attractive because of its high organic matter and nutrients content [11]. The term compost generally refers to organic matter subjected to aerobic and thermophilic stabilization processes for an extended period obtaining a stable sanitized product with humic characteristics. Many studies have shown the benefits of compost in greenhouses and nurseries [12], although plant response depends on the species [13], the feedstock material, the compost properties, and the functionality of the composting method [14].
On the other hand, biostimulants (BS) are proposed as an alternative to conventional fertilization. The term BS refers to those substances stimulating biological processes by increasing nutrient availability and optimizing their absorption, so improving the quality of the plant and increasing its tolerance to stress [15]. Within the different BS categories described in the literature, this work focuses on the use of microbial inoculum. Microbial inocula use in agriculture began three decades ago [16], although its use so far is not widespread. Within beneficial microorganisms known as plant growth promoters (PGPs), there are countless species of both bacteria (PGPB) and fungi (PGPF). They colonize the extracellular or intracellular rhizosphere environment of plants in search of a carbon source [17], competing for space, water, and nutrients and often improving their competitive capacity by developing associations with the plant. These associations can benefit plant growth and health in different ways [18]. Mechanisms that benefit the plant growth include phosphate solubilization, nitrogen fixation, and phytohormone secretion [17]. In addition, several studies have shown that root-associated microorganisms can increase the plant’s resistance to abiotic stresses such as drought [19]. However, plant species and variety (releasing different types of root exudates), soil type, environmental conditions, and commercial formulation are crucial determinants of the efficient action of inoculated PGPs [20].
The objective of this work was to assess the use of a plant-based compost as an alternative to peat in chestnut seedling production. This work also aimed to assess the effectiveness of a PGPs-based BS as an alternative fertilization tool, also influencing plant tolerance to water deficit during the nursery phase.

2. Materials and Methods

2.1. Compost and Biostimulant

The compost was produced using forest pruning waste mixed with 15% horse manure. The BS was obtained after aerobic fermentation for 4 days at room temperature (22 ± 2 °C) of a compost of exclusively plant origin (mainly cabbage, kale, red cabbage, pumpkin, and tomato from large producers, mixed with 10% garden waste) and water in a proportion 1:10 w/v as described Otero et al. (2019) [21]. The physicochemical characteristics of the compost and BS are stated in Table 1. In the BS, neither plant hormones (gibberellins, cytokinins, and auxins) nor vitamins, except B1 (1.21 mg kg−1), were detected, quantifying 2.5 × 10⁶ CFU g−1 of aerobic mesophiles.
Metabarcoding analysis of BS was performed by SGIKER (UPV/EHU) following the protocol 16S metagenomics Sequencing Library Preparations of Illumina® using MiSeq sequencer. Bacterial microbial community was composed by Euryarchaeota (1.37%), Actinobacteria (1.70%), Tenericutes (3.60%), Synergistetes (4.47%), Spirochaetes (4.60%), Firmicutes (11.93% in Class Clostridia and 3.53% in Class Bacilli), Bacteroidetes (15.60%), and Proteobacteria (47.09%). In this last phylum, the main classes were α-Proteobacteria (13.73%), β-Proteobacteria (14.53%), δ-Proteobacteria (11.60%), ε-Proteobacteria (2.80%), and γ-Proteobacteria (4.43%). The remaining 6.11% belonged to other groups. Cultivable microorganisms present in BS were also analyzed using Sanger sequencing and included bacterial species (Ochrobactrum tritici (24.5%), Pseudomonas aeruginosa (17.4%), Gordonia terrae (15.8%), Bacillus subtilis (14.2%), Bacillus licheniformis (11.9%), Bacillus pumilus (5.5%), Bacillus safensis (4.7%), Bacillus velezensis (4.0%), Serratia marcescens (1.6%), Pseudomonas fluorescens (0.1%), and Pseudomonas putida (0.1%)), and fungal species (Rhodotorula mucilaginosa, Cladosporium ramotenellum, Penicillium concentricum, Penicillium daelae, Aspergillus terreus, Penicillium brevicompactum, Rhyzopus oryzae, Fusarium equiseti, Penicillium atroveneretum, and Mucor moelleri), which represent around a 0.04% of the whole community.

2.2. Experimental Design

Chestnut seedlings were grown for 8 months under plastic cover in the forest plant nurseries of BASALAN (Provincial Council of Bizkaia). Seeds were sown in plastic trays of 6 alveoli filled with 1000 cc of substrate in each one. The trial consisted of two factors, substrate and fertilization, with four replications (trays). The first factor, substrate, included 5 percentage levels of peat and compost mixture: peat/compost mixture 80/0 (treatment 0%), 60/20(treatment 25%), 40/40 (treatment 50%), 20/60 (treatment 75%), and 0/80 (treatment 100%). A 20% perlite inert substrate used to improve aeration in forest cultivation was added to each mixture. The second factor, fertilization, included two treatments: irrigation with NPK (14:7:14) mineral fertilizer vs. irrigation with BS. The fertilization treatment was applied once a month for six consecutive months. NPK was applied at a rate of 23.33 mg N/plant in each application, while BS was applied at a rate of 1 L of BS/tray, diluted 1/20. A control treatment consisting of plants grown in the peat/compost mixture 80/0 (0%) being irrigated only with water was included. As a result, 10 treatments plus the control were established, with 24 seedlings each (four trays of six alveoli/tray). The trays were placed in an open plastic tunnel with daily irrigation to field capacity by a sprinkler system for 8 months. After the nursery phase, 12 plants for each treatment were selected for morpho-physiological and biochemical parameters characterization. In addition, the rhizosphere substrate (the substrate in direct contact with root surface) of each plant was collected for analysis of cultivable microorganisms. The remaining 12 plants were kept to perform the water deficit experiment.

2.3. Morpho-Physiological Parameters of Seedlings

Before the onset and at the end of the experiment, pH and electrical conductivity of the substrate mixture was analyzed. The substrate was mixed with distilled water at a ratio of 1:5 (v/v), stirred 30 min at 100 rpm, and left to decant for another 30 min. The measurements were taken in the supernatant once the particulate matter had been filtered off.
Six plants selected per treatment were used for morphological characterization and six plants for physiological and biochemical measurements. The biometric description of the plant consisted of determining the plant height and root diameter at neck level, and total leaf area of each plant was also measured using image analysis (ImageJ Software 1.52a, National Institutes of Health, Bethesda, MD, USA). Afterwards, roots, stems, and leaves were dried at 80 °C for 48 h and weighed separately. Specific leaf area (SLA) was calculated as the ratio between leaf area and leaf dry weight. The Dickson quality index (DQI) was calculated as total dry weight (g)/((height (cm)/diameter (mm)) + (shoot dry weight (g)/root dry weight (g))) [22]. Dry foliar material was used to determine nitrogen concentration using an elemental analyzer. Analysis of stomatal conductance was performed in six seedlings per treatment using a leaf porometer (Decagon Devices).

2.4. Water Deficit Assay

With the remaining plants (12 plants/treatment) a water deficit tolerance trial was carried out. For this purpose, irrigation of six plants was suppressed, and the water condition of the substrate was monitored by means of TDR (time domain reflectometry, Eijkelamp), which measures the soil impedance proportional to the soil water potential. When each alveolus under drought condition reached the TDR value of 0.05 θv (soil moisture volumetric content, m3·m−3), previously defined as the point close to permanent wilting point for the plants under these conditions, daily irrigation was re-established for a week. The water potential (Ψw) of the plants was determined at the beginning of the drought experiment, at the moment of maximum stress (TDR = 0.05 v) and at the moment of recovery (1 week after starting rehydration). A Scholander pressure chamber was used for this purpose. Two leaves of each plant (6 plants per treatment and water condition) were measured.

2.5. Cultivable Microorganisms

In order to isolate and count cultivable microorganisms, samples of 10 g of rhizosphere soil were diluted in 90 mL of sterile isotonic saline solution (0.9% NaCl, pH 7.2), vigorously shaken, and left to rest for 15 min to prepare 1:10 serial dilutions until dilution 10−5. From each dilution, 100 µL were spread in Petri dishes with different media. To isolate fungi, Rose Bengal (RB) was used; for general bacteria, Luria–Bertani medium (LB) was used; and to discriminate the genus Pseudomonas, Cetrimide agar was used. For each treatment, dilution, and culture medium, six dishes were prepared and left to incubate in darkness for 14 d at 28 °C. The dishes were observed every 2 days to differentiate the main morphotypes and to determine the number of colony-forming units (CFU g–1) for each morphotype.

2.6. Statistical Analysis

Statistical analyses were carried out using SPSS v.24.0 software (Chicago, IL, USA). The normality of the data and the homogeneity of the variances were checked. The results were compared using ANOVA variance analysis, using Duncan’s test for comparison of mean values at a significance level p < 0.05. Student’s t-test was also used to compare BS vs. NPK within each substrate mixture, and the Pearson correlation index was used to check the correlation between different parameters. To analyze the cultivable microbiota communities PRIMER 7 [23] was used, with square root overall transformed data. Regarding microbial communities, the effect of fertilization and substrate factors was assessed with a permutational multivariate analysis of variance (PERMANOVA), based on a Bray–Curtis dissimilarity matrix. To visualize the similarity of the cultivable microbial communities of the different treatments, multidimensional scaling (MDS) using bootstrap averages analysis was performed. The Shannon diversity index was also calculated for each treatment.

3. Results

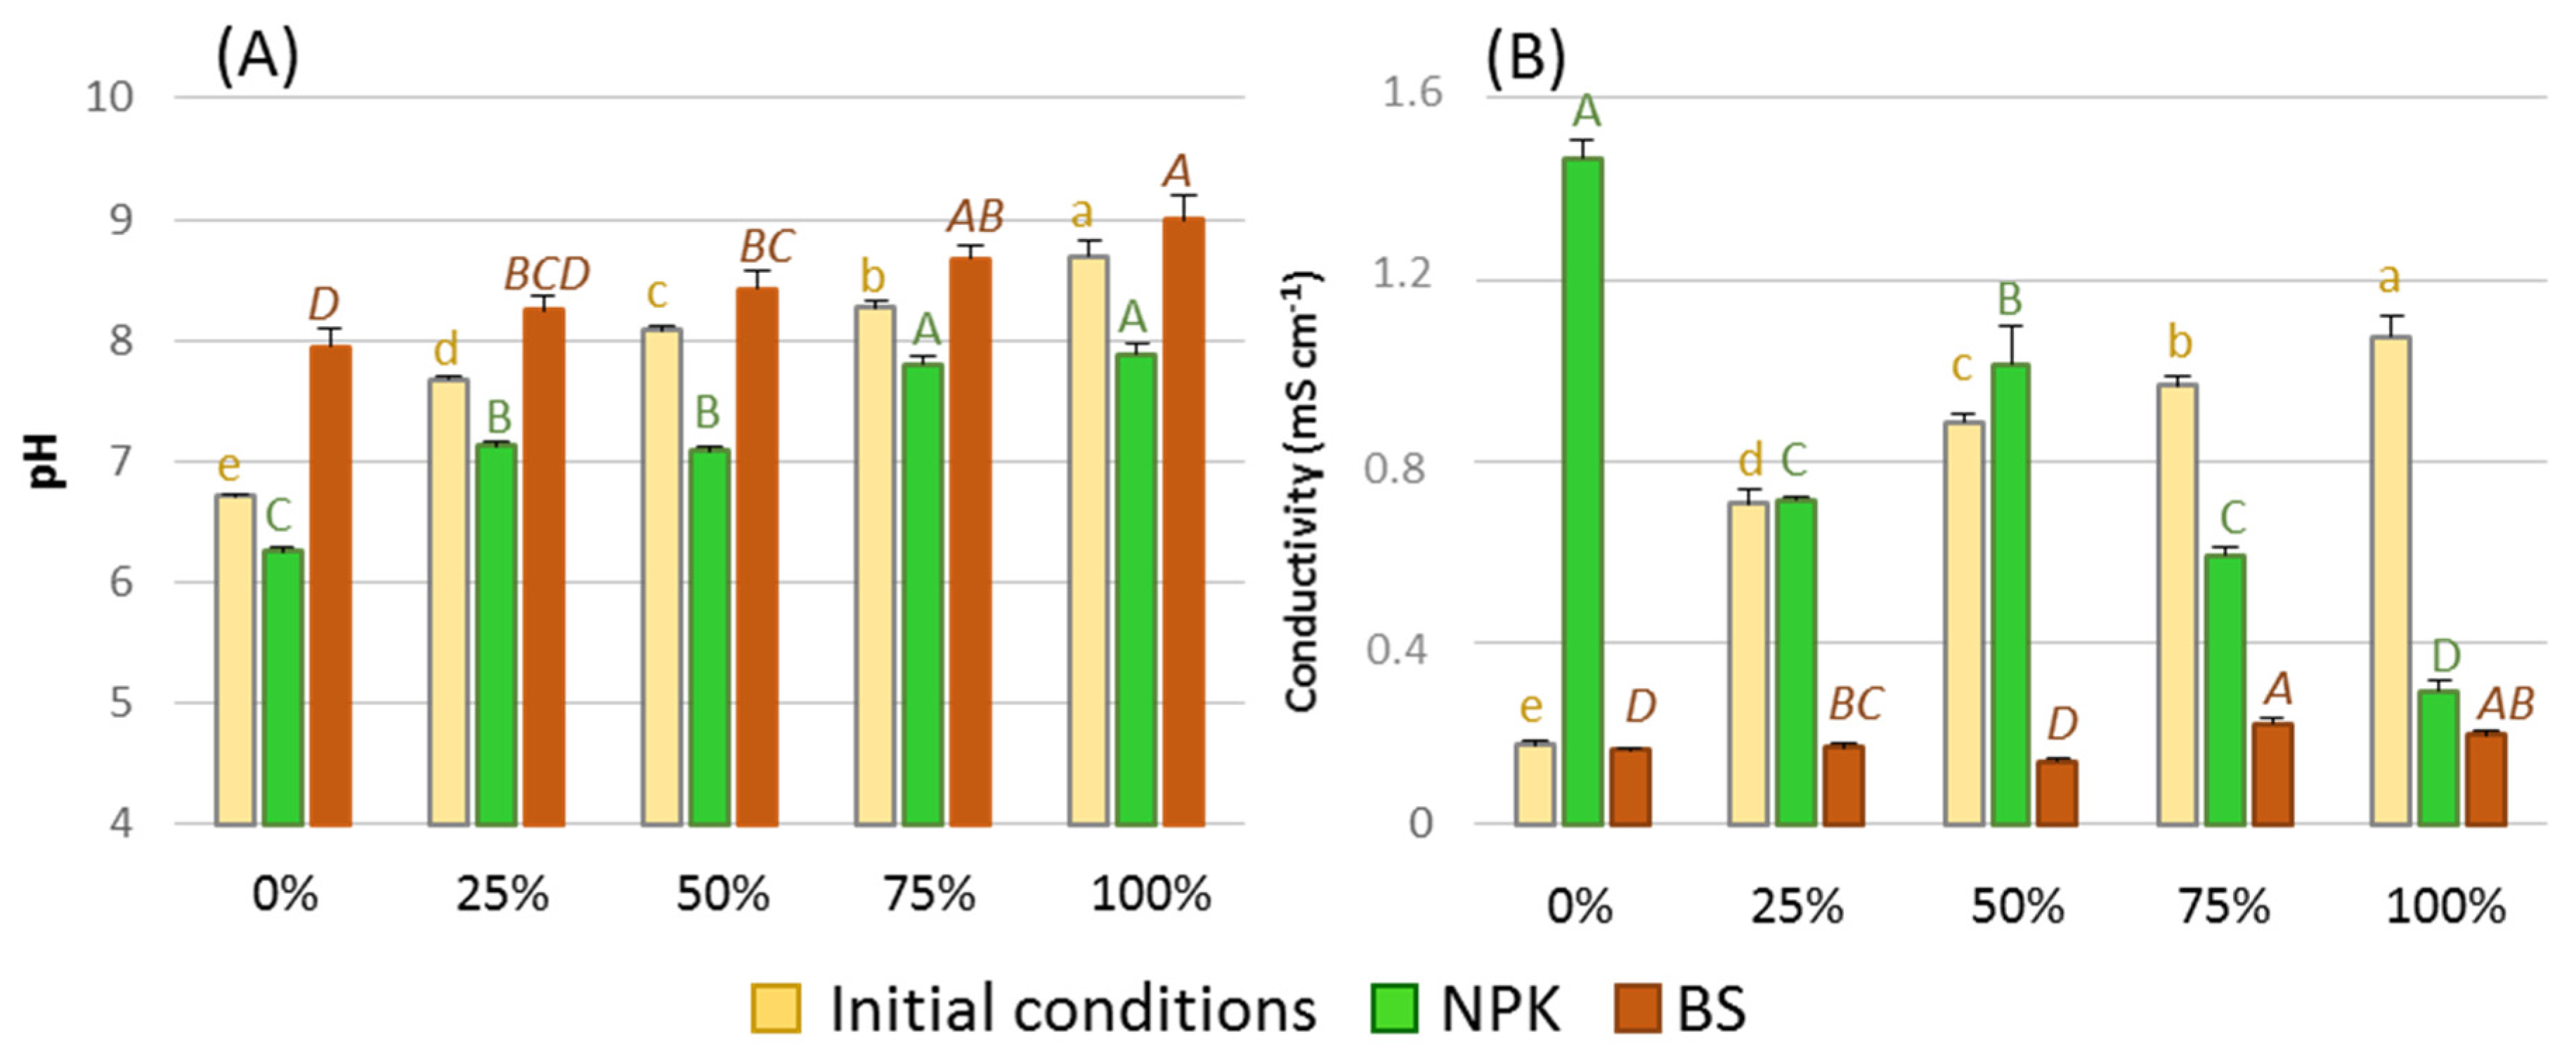
3.1. Chemical Characteristics of the Substrate
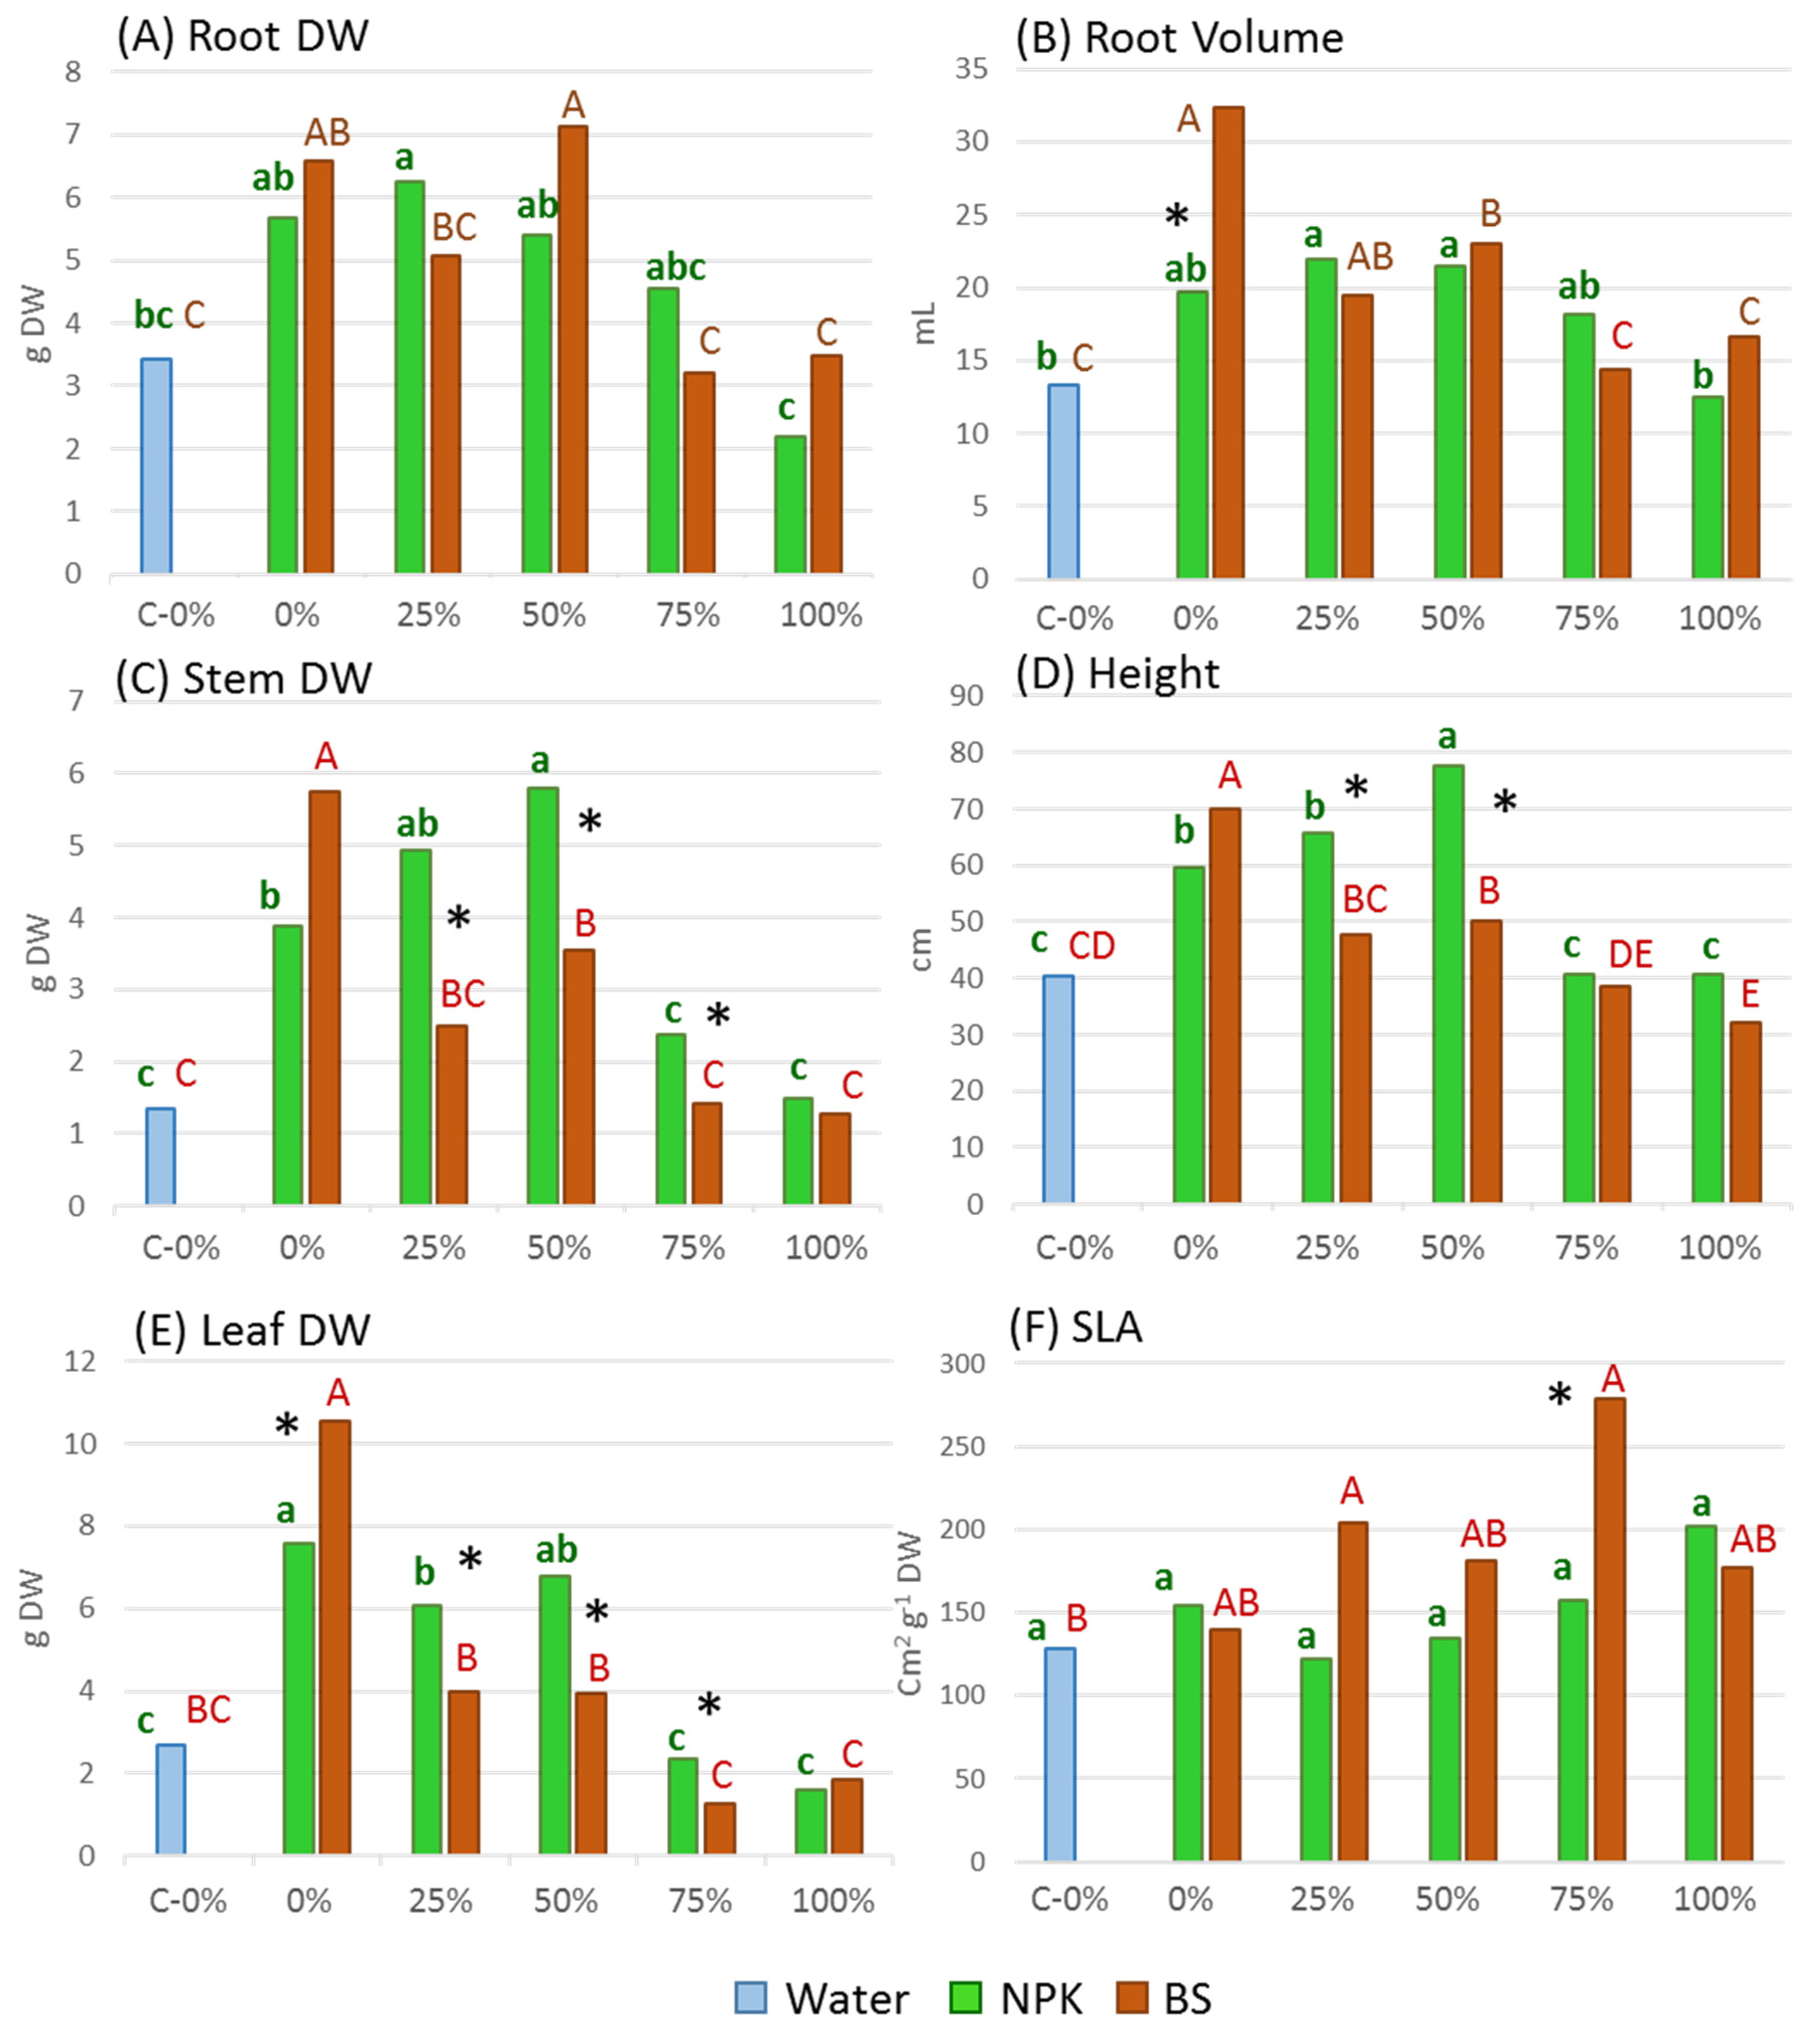
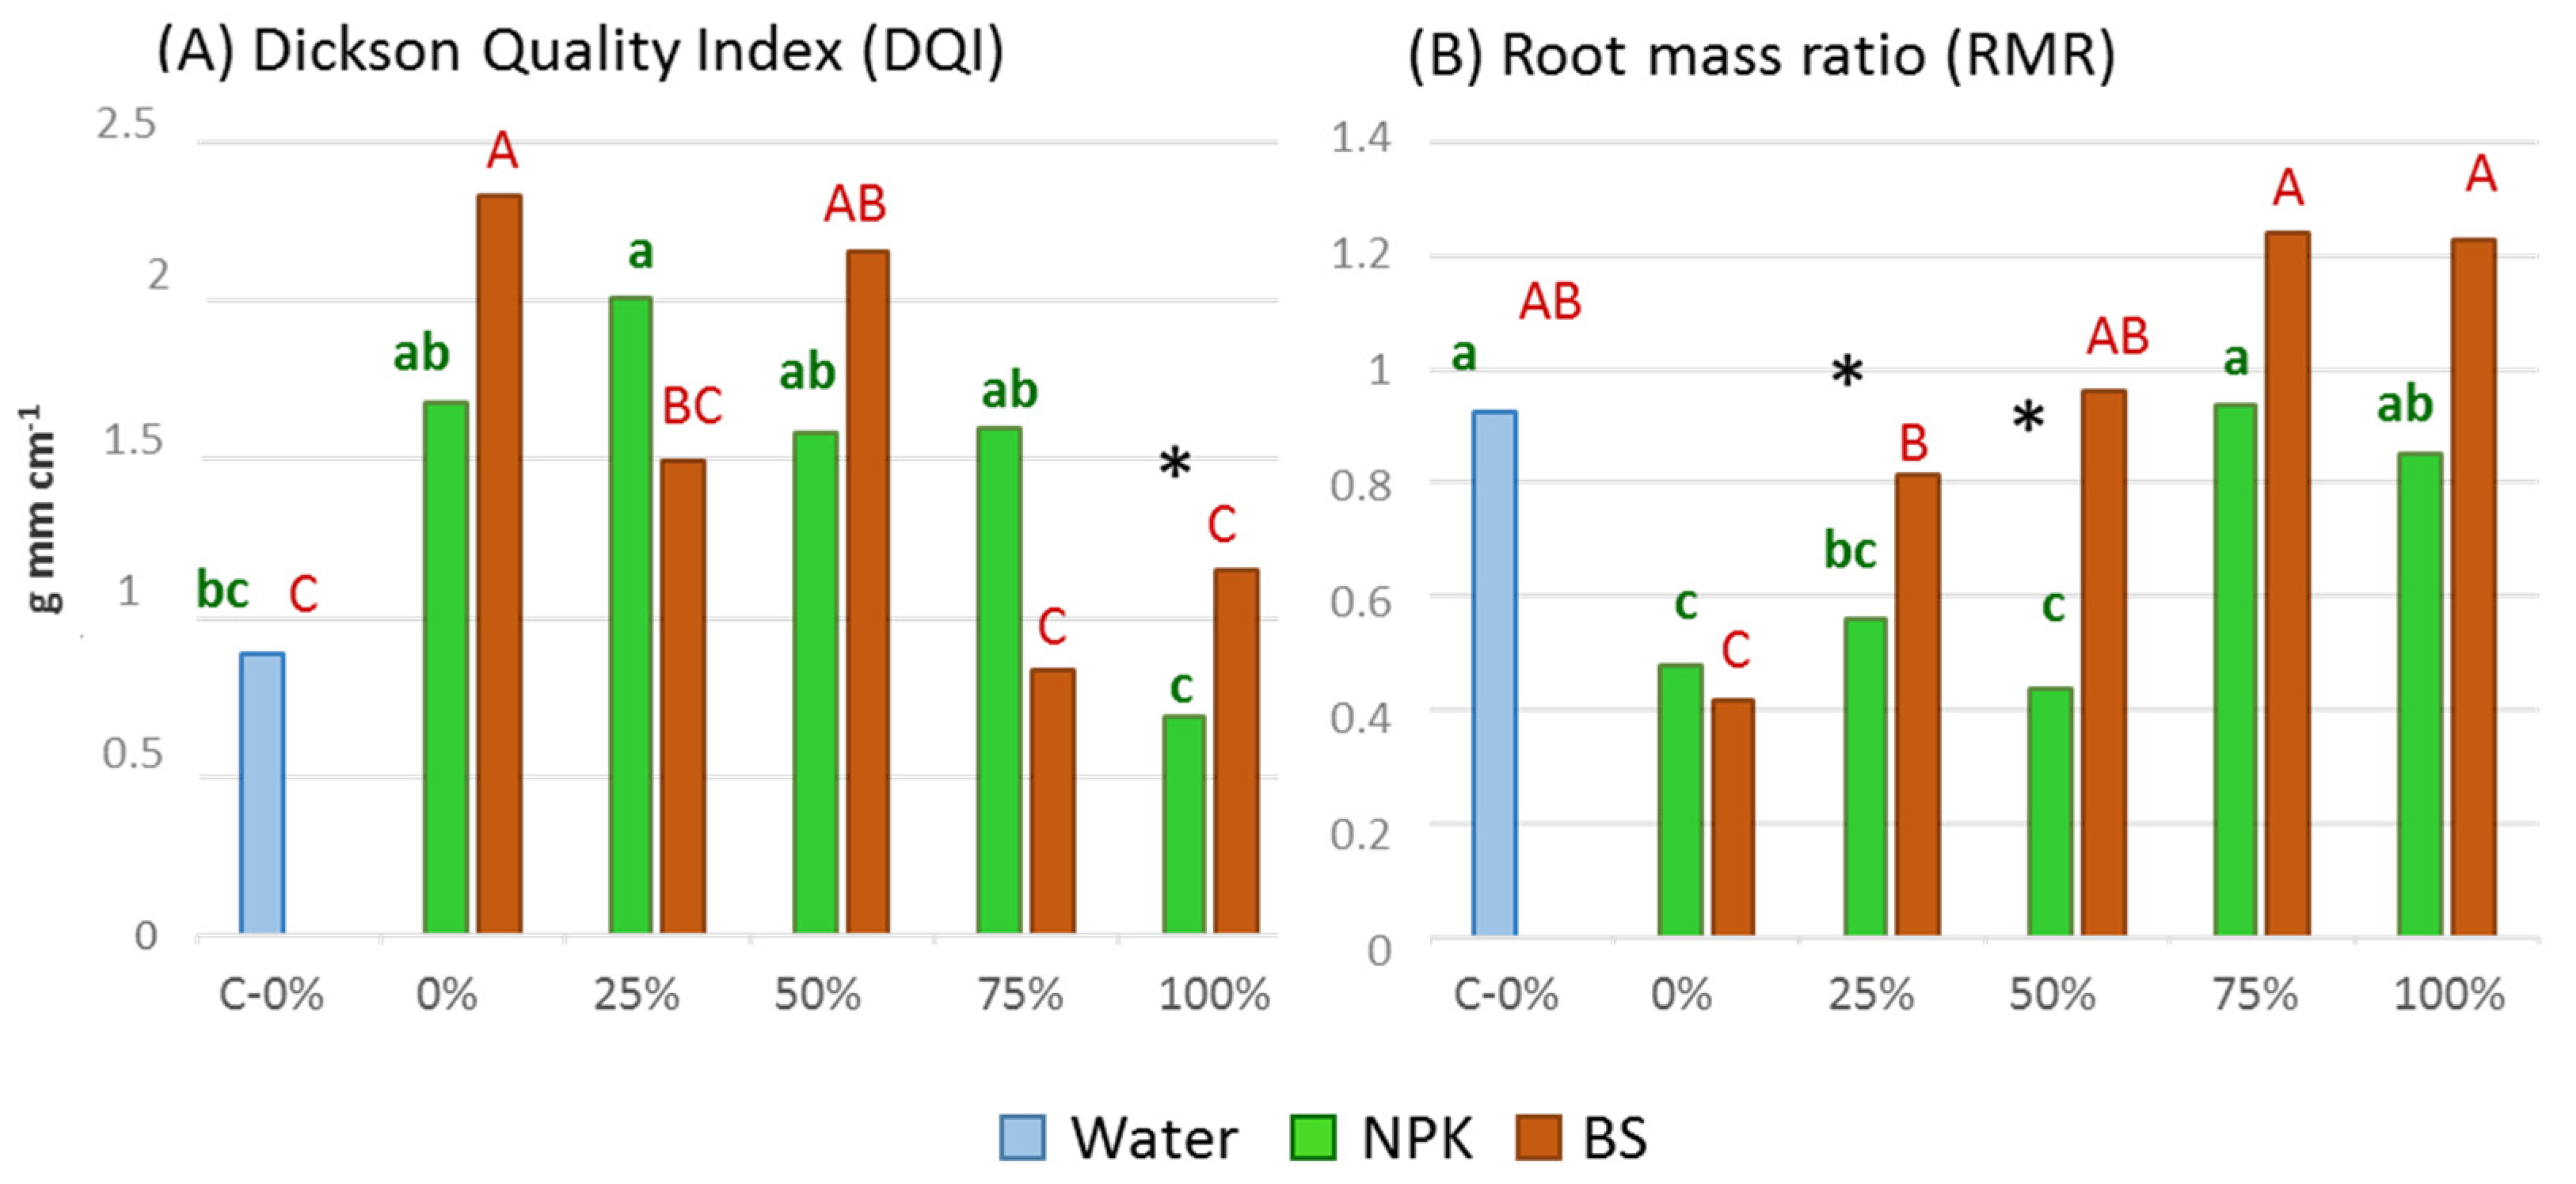
Both substrate composition and fertilization management exerted a strong and significant effect on the physicochemical parameters of the substrate (Table 2). The starting conditions of the substrate were influenced by compost addition, with a significant increase in both pH and electric conductivity (EC) as the proportion of compost in the mixture increased (Figure 1, yellow bars). The application of NPK slightly acidified the substrate by the end of the experiment, whereas it increased EC by 10 times in the 0% mixture, maintained EC values at 25% and 50% compost doses, and decreased EC values at high compost doses (75% and 100%). BS-treated substrate slightly increased/maintained substrate pH, and strongly decreased EC values by the end of the experiment at whatever compost dose.

3.2. Plant Growth

Most of the effects on biometric parameters were due to substrate composition, as indicated by partial ƞ2 values (Table 2), although the significant interaction between both factors (substrate and fertilization) revealed that changes in biometric parameters were also conditioned by the fertilization strategy. Lower root, stem, and leaf biomass production was observed when increasing compost in the substrate mixture (Figure 2). At the highest compost concentrations, plant dry weight decreased significantly, being equal or even lower than that of the control plants. BS-treated plants showed higher leaf dry weight values than NPK-fertilized plants when no compost was added to the substrate, although the contrary was observed in 25%, 50%, and 75% mixtures (Figure 2). Similarly, BS-treated plants obtained lower stem dry weight values than NPK-treated plants at medium compost concentrations (25%, 50%, and 75%), with no differences in root dry weights between treatments (Figure 2). The application of BS, in comparison to NPK, significantly increased root volume when no compost was added.
Chestnut plants developed longer stems in the absence of or at low–medium compost concentrations (0%, 25% and 50%). In these low–medium compost concentrations, NPK-treated plants developed significantly longer stems than did BS-treated plants. The specific leaf area (SLA) of NPK-treated plants remained constant whatever the substrate composition, while BS-treated plants showed a trend to increase this parameter with respect to control plants and to NPK-treated plants, this difference being significant only for 75% compost treatment.
From the recorded biometric data, Dickson quality index and root mass ratio (RMR) were calculated (Figure 3). Substrate composition exerted a stronger effect on these two parameters than the fertilizer management (Table 2), although BS application also induced significant changes in RMR (Figure 3). When peat was completely replaced by compost, DQI was equal to control plants, while the application of BS led to a significant increase of DQI in this substrate mixture. The addition of compost favored the increase in the RMR. In 25% and 50% mixtures, BS-treated plants showed significantly higher RMR values than in NPK-treated ones.
The stomatal conductance of NPK-treated plants remained constant in all substrate mixtures (Figure 4). On the contrary, BS-treated plants showed progressively increasing stomatal conductance values with the addition of compost to the substrate. Plants growing in 75% and 100% mixtures showed significantly higher stomatal conductance when BS was applied with respect to NPK. In addition, when no compost was added, BS-treated plants tended to extract more N than those treated with NPK. However, the contrary was observed when including compost in the substrate mixtures, the N extraction in BS-treated plants being significantly lower in NPK-treated ones. It must be highlighted that the effect size of fertilizer management in N extraction and stomatal conductance was higher than that observed in biometric variables (Table 2).

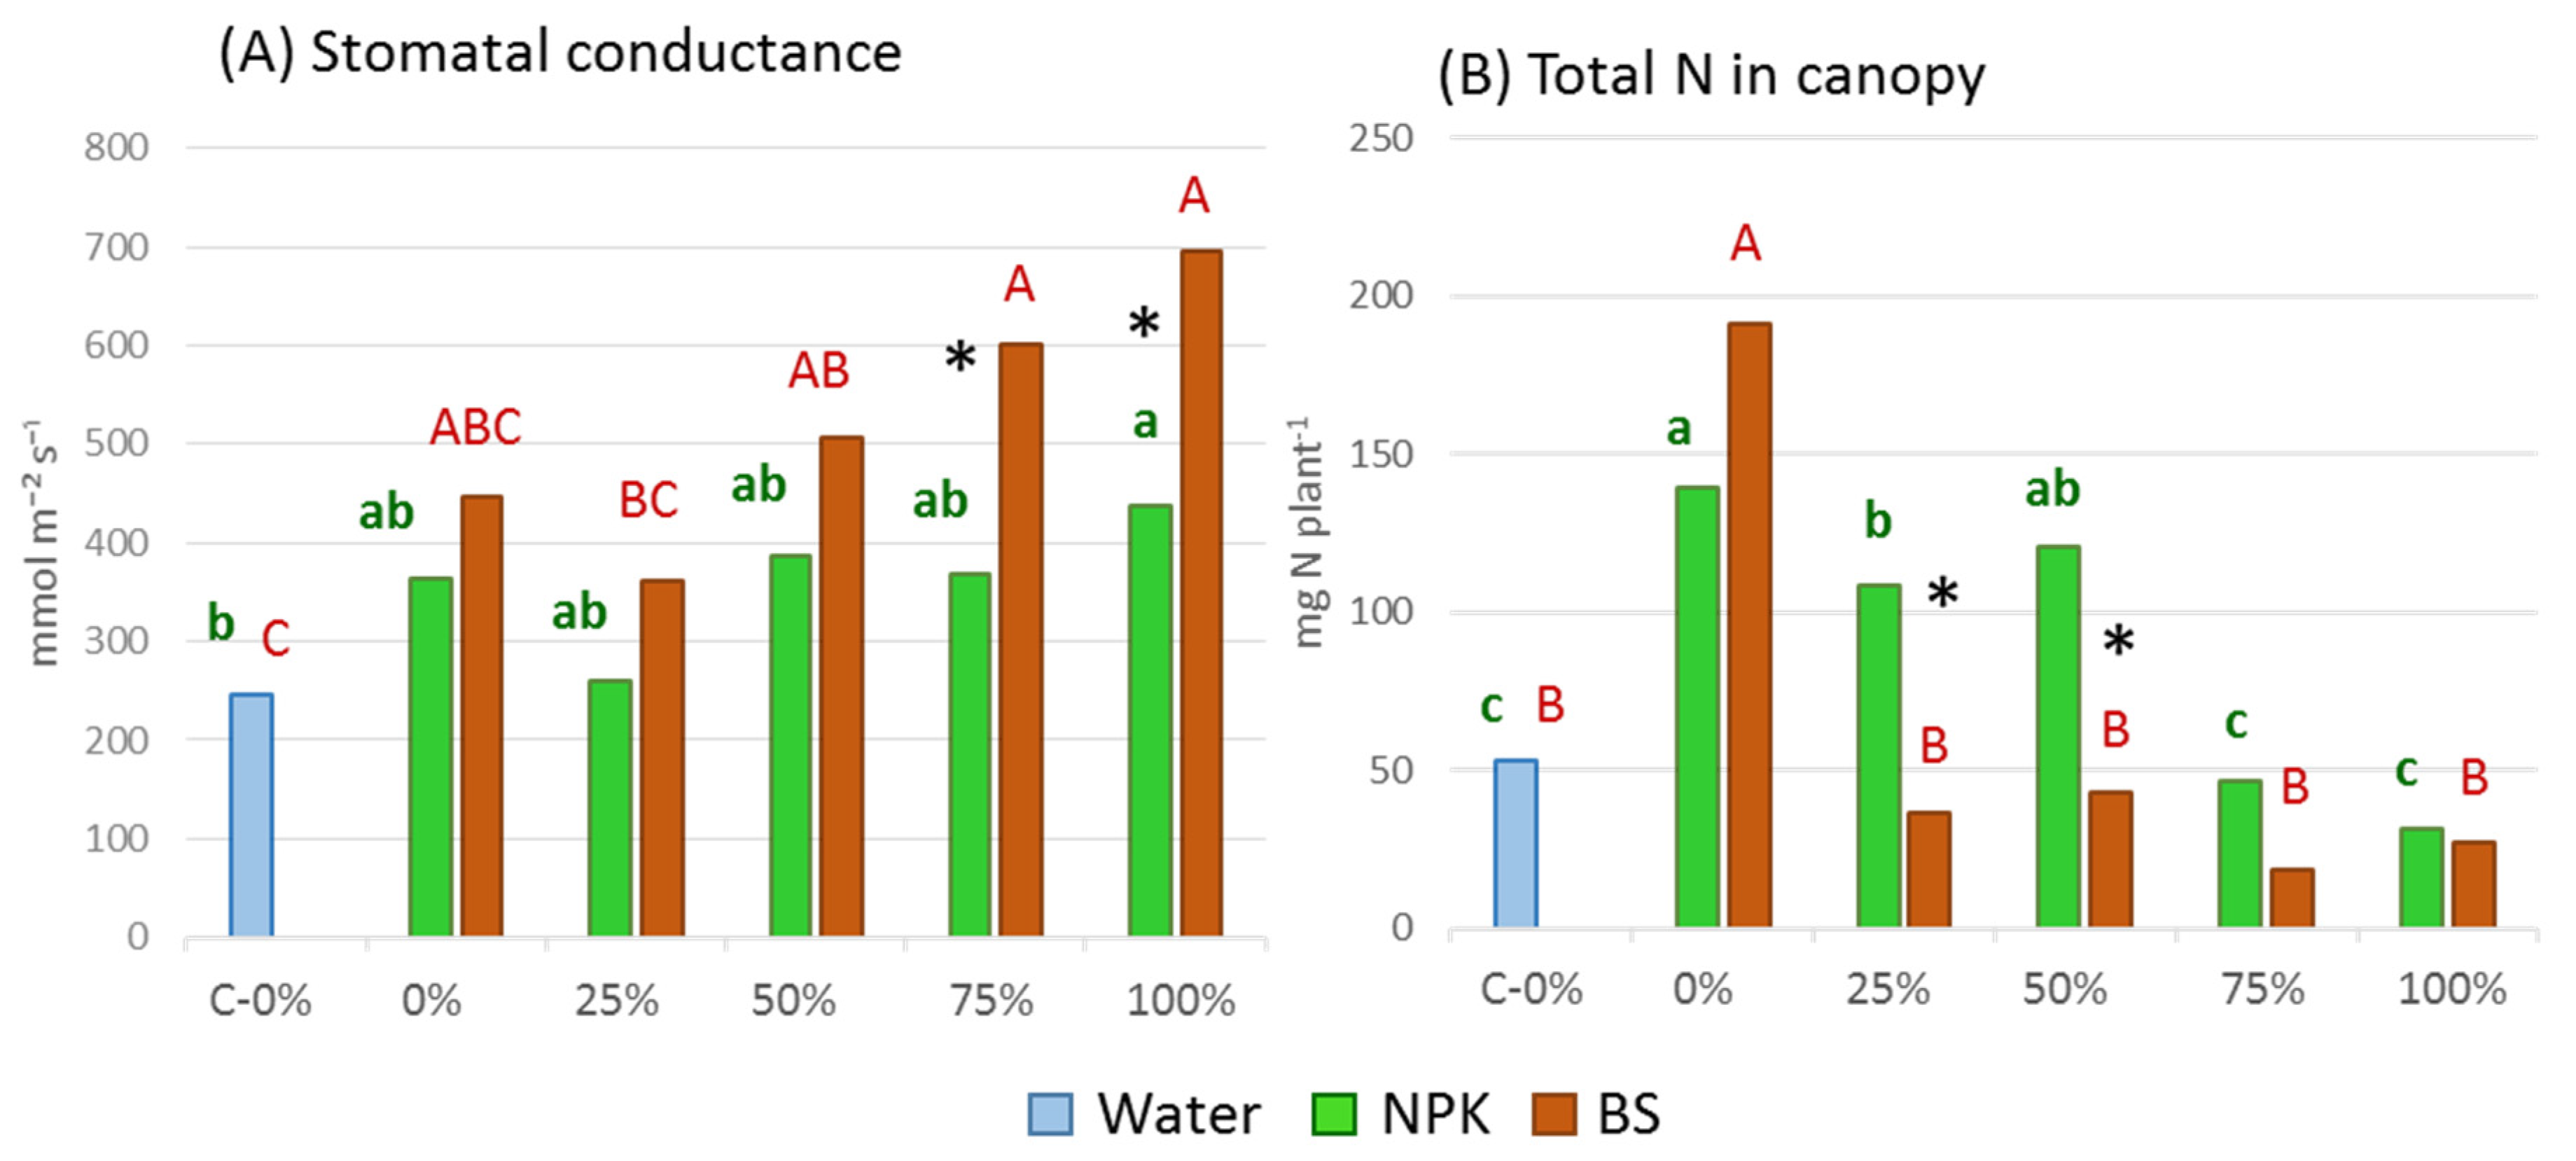
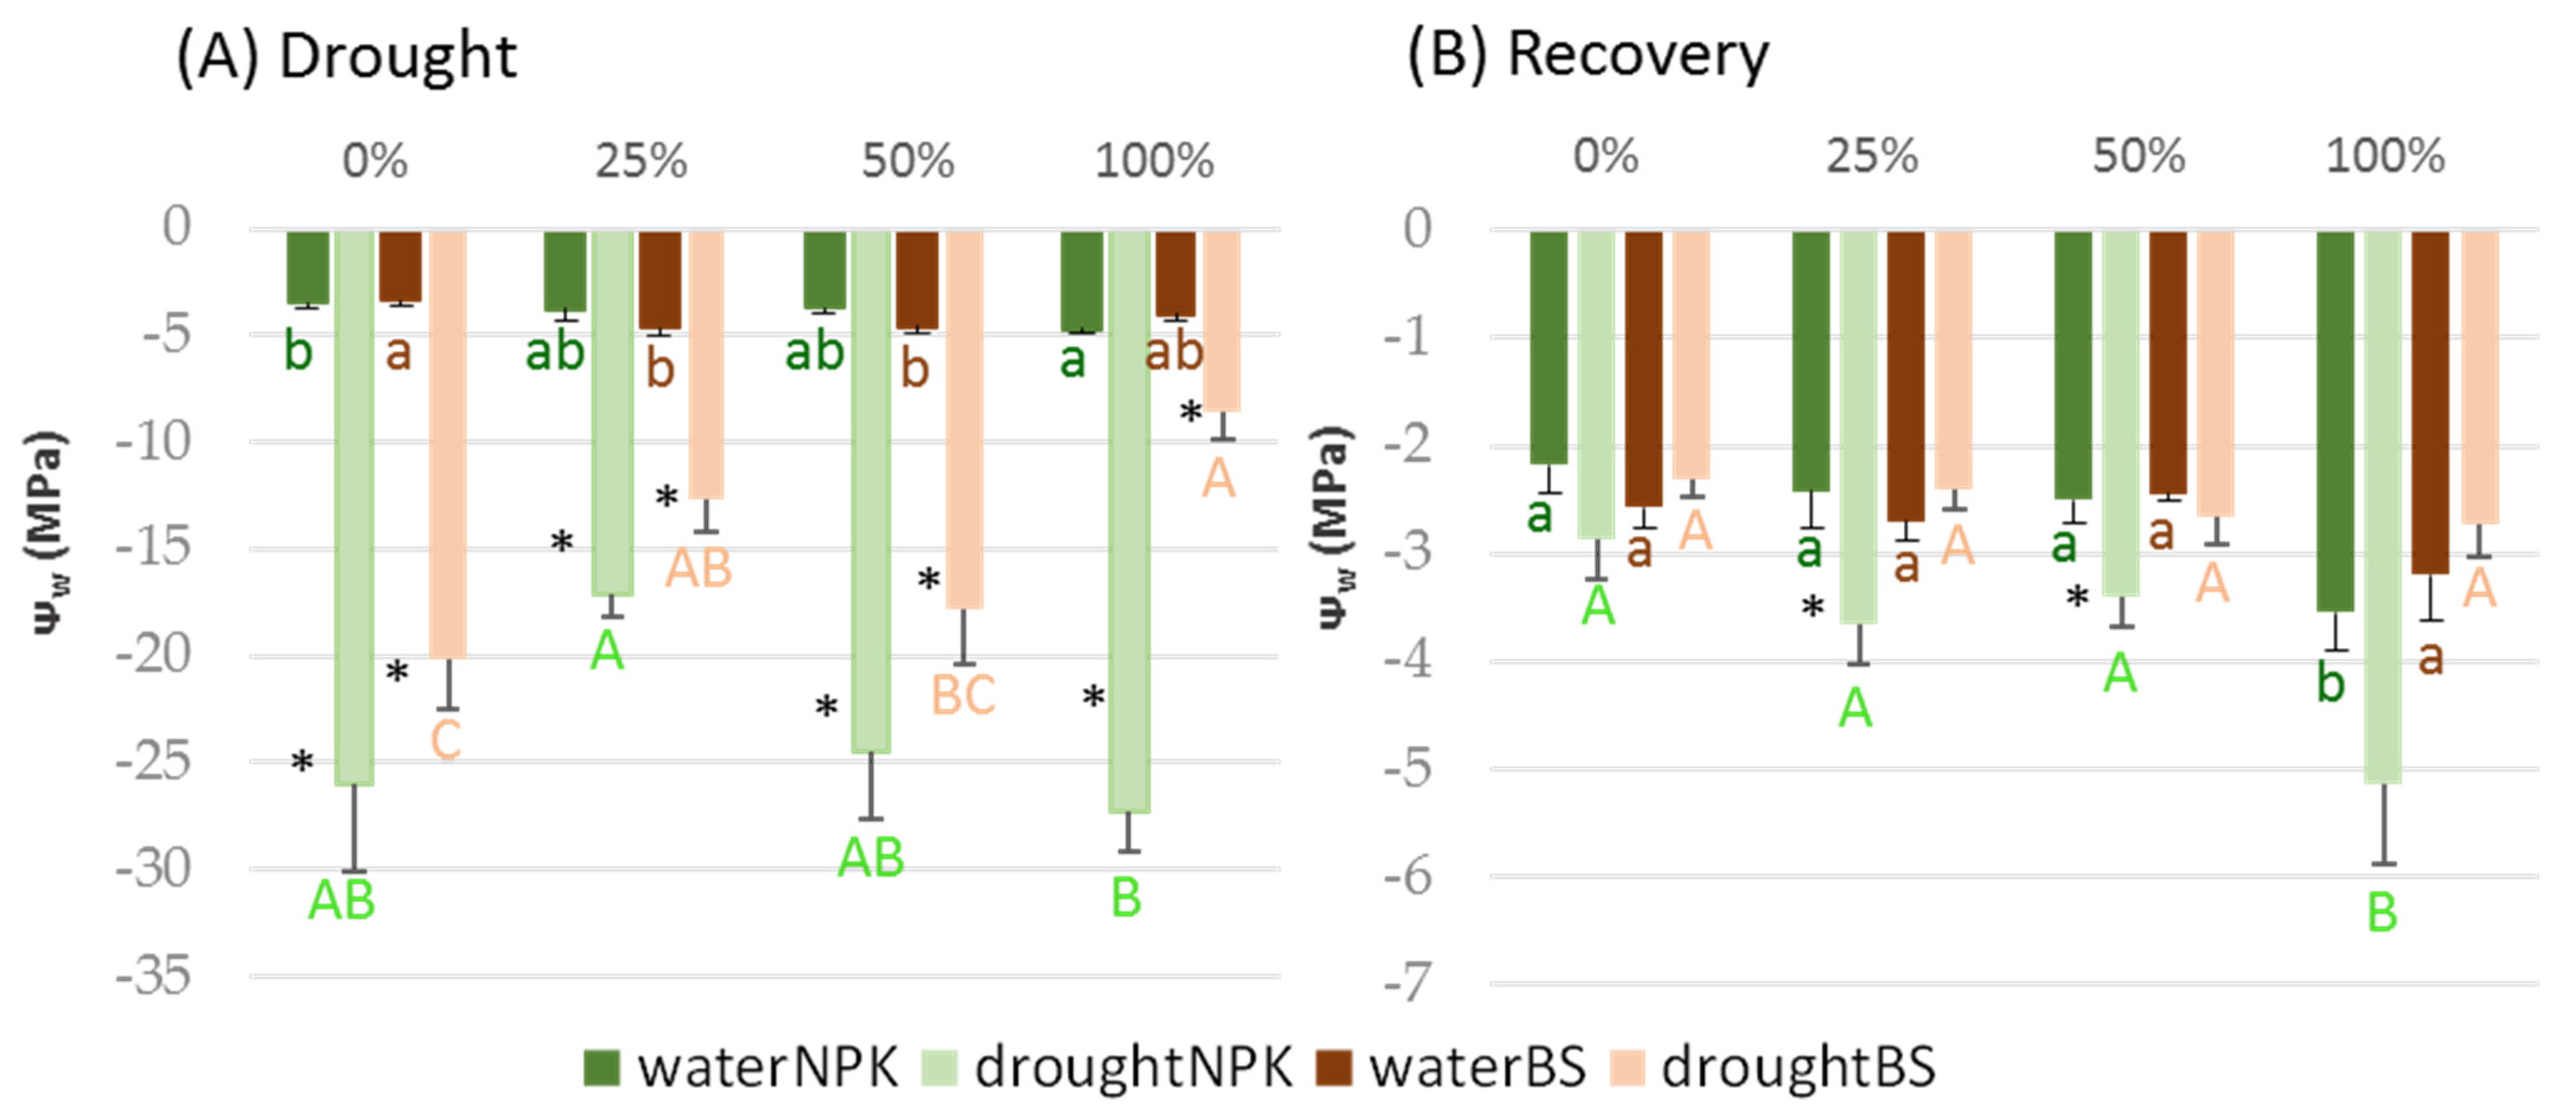
3.3. Plant Tolerance to Water Stress

Monitoring of the substrate TDR values during the experiment of plant tolerance to water stress revealed that the speed of desiccation was different for each substrate mixture (Figure S1). When a linear model was adjusted between TDR values and days of drought, more accused slopes were observed in the substrate without compost. Mixtures with compost showed less marked slopes, the substrate with the highest percentage of compost having the lowest slope. No difference was observed between substrates with different fertilization management. When soil moisture reached the value established as the limit around which plants would reach the permanent wilting point (TDR = 0.05), the plant Ψw values were determined and, as expected, plants subjected to water stress showed much more negative values than irrigated control plants (Figure 5A). BS-treated plants showed in all cases significantly less negative water potentials than plants fertilized with NPK, the less negative being the substrate containing higher compost concentration.
After one week of rehydration, BS-treated plants recovered Ψw values similar to those of the irrigated control plants in all the substrate mixtures (Figure 5B). In the case of NPK-treated ones, despite the recovery of Ψw values, these values were slightly more negative than those of the irrigated control. Moreover, Ψw was also more negative in the 100% treatment. In the case of BS-treated plants, they recovered initial Ψw values whatever the substrate composition.

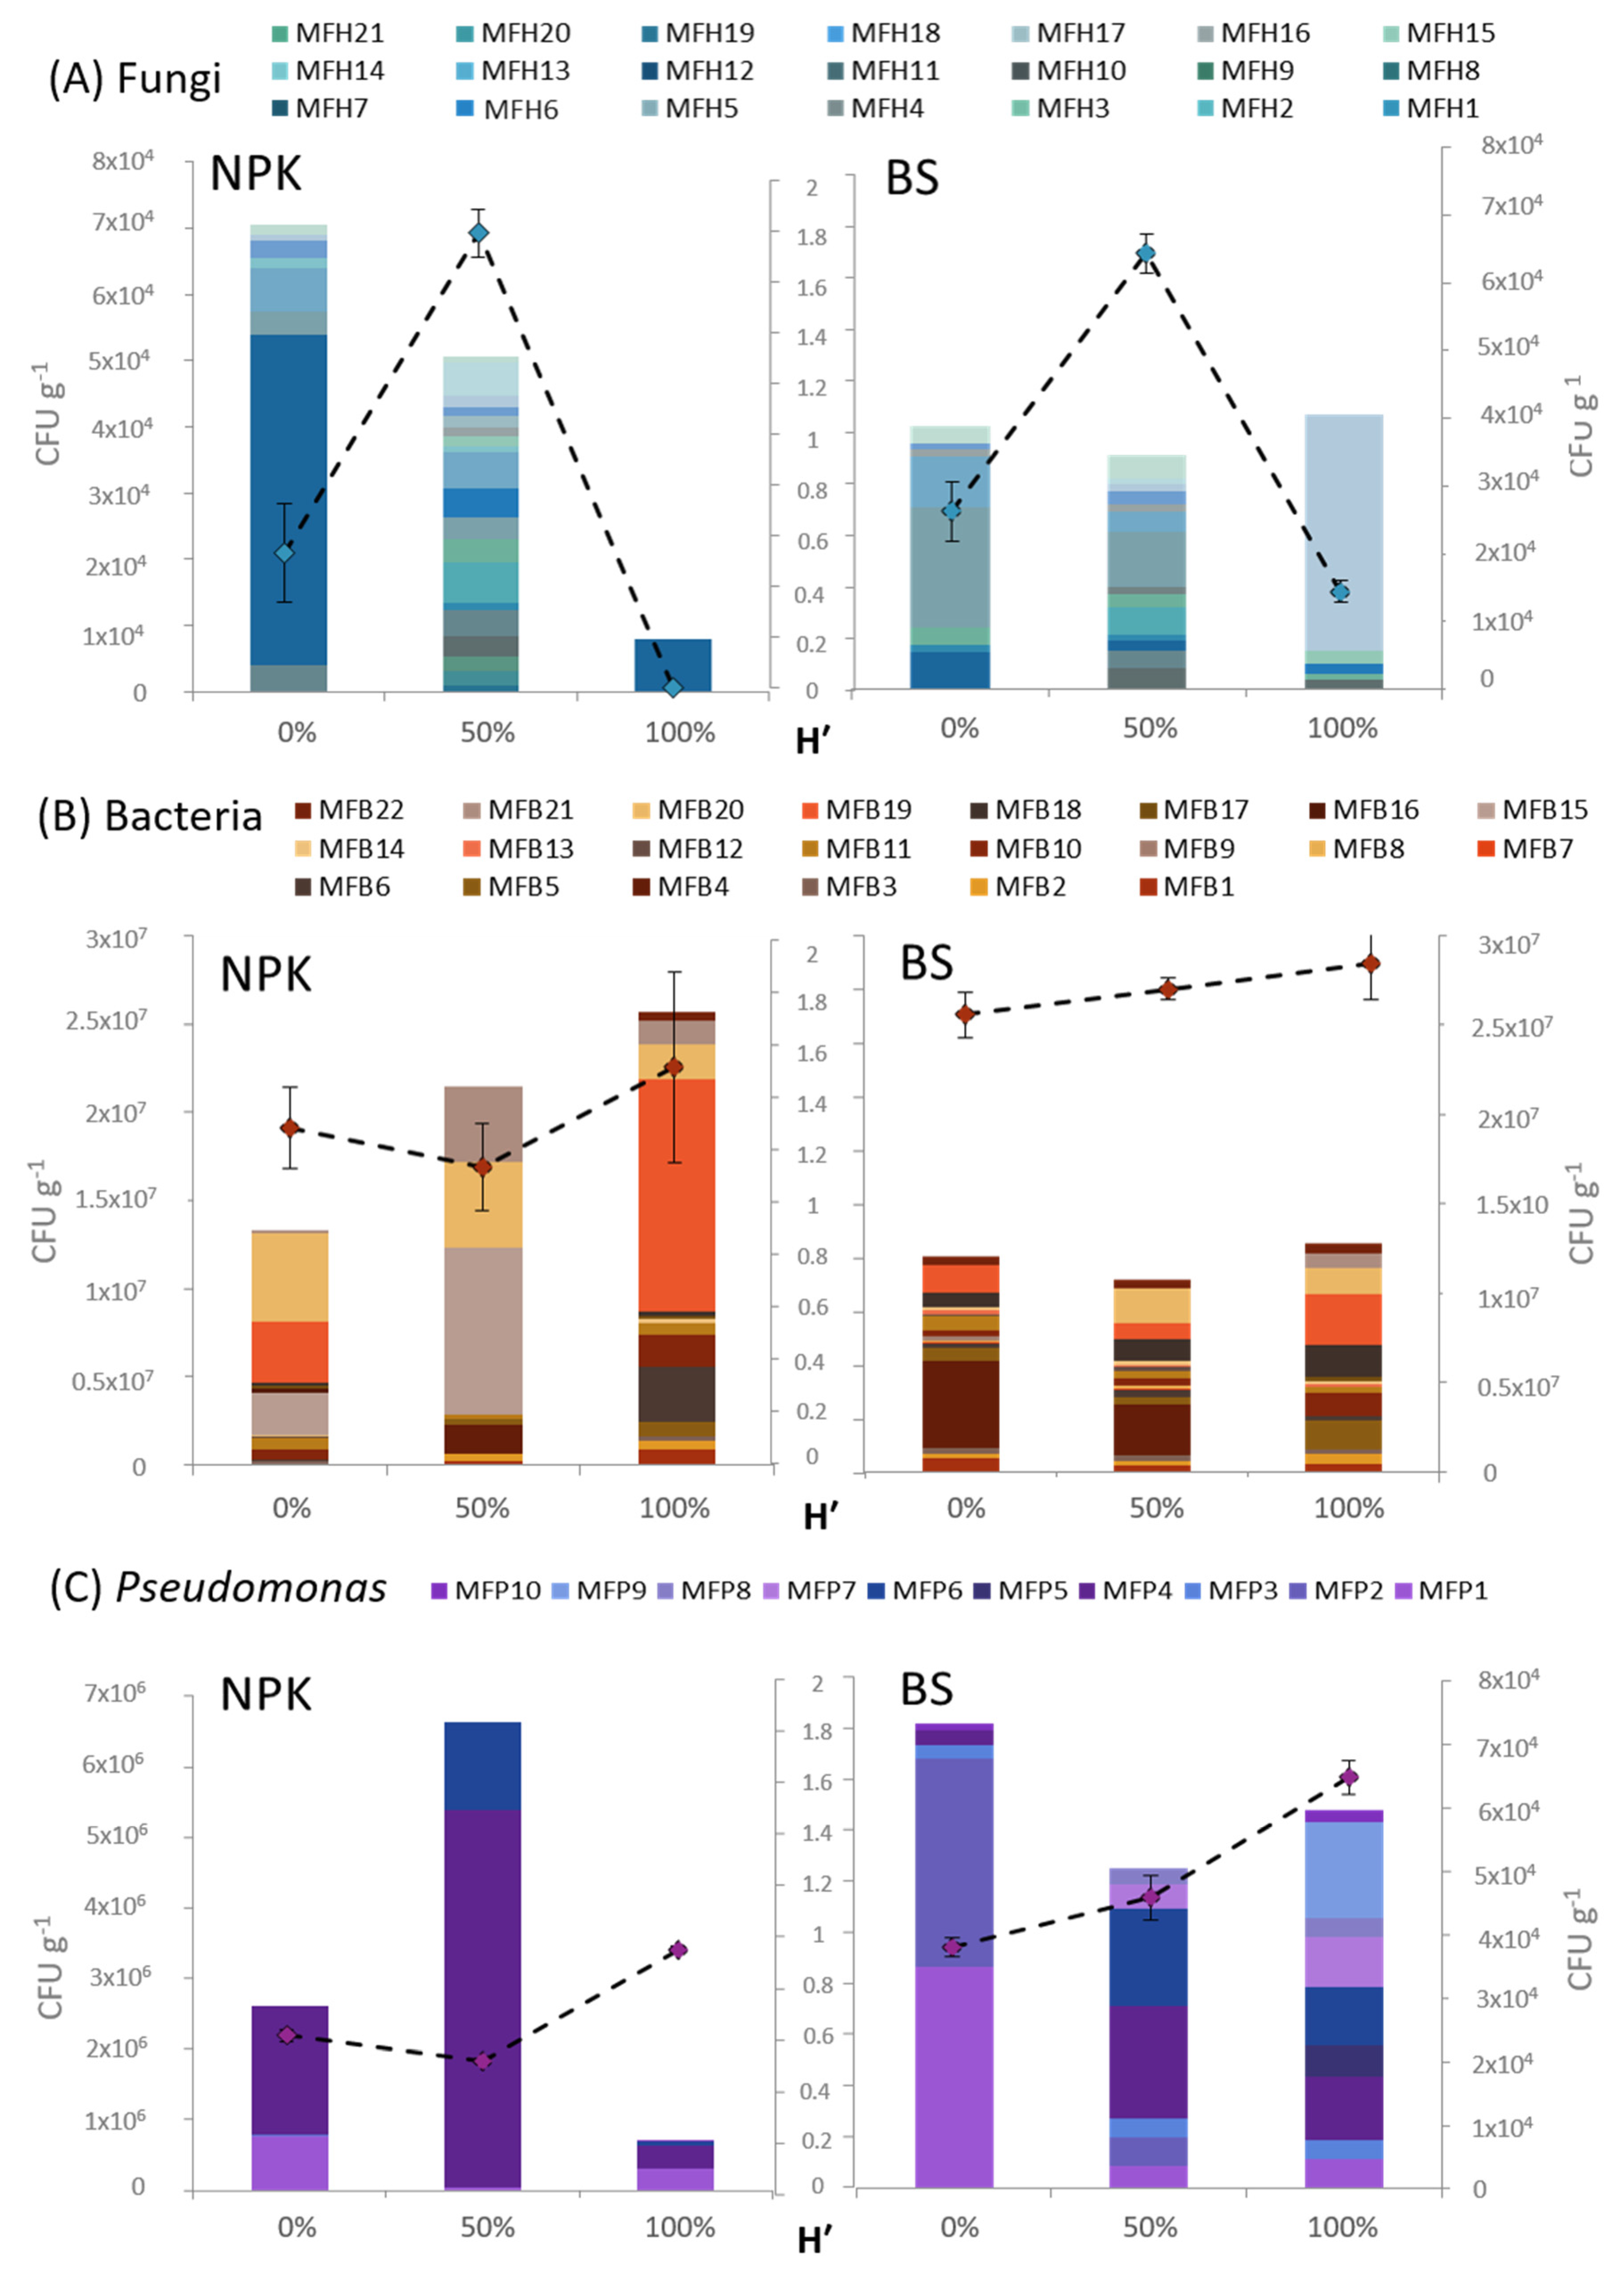
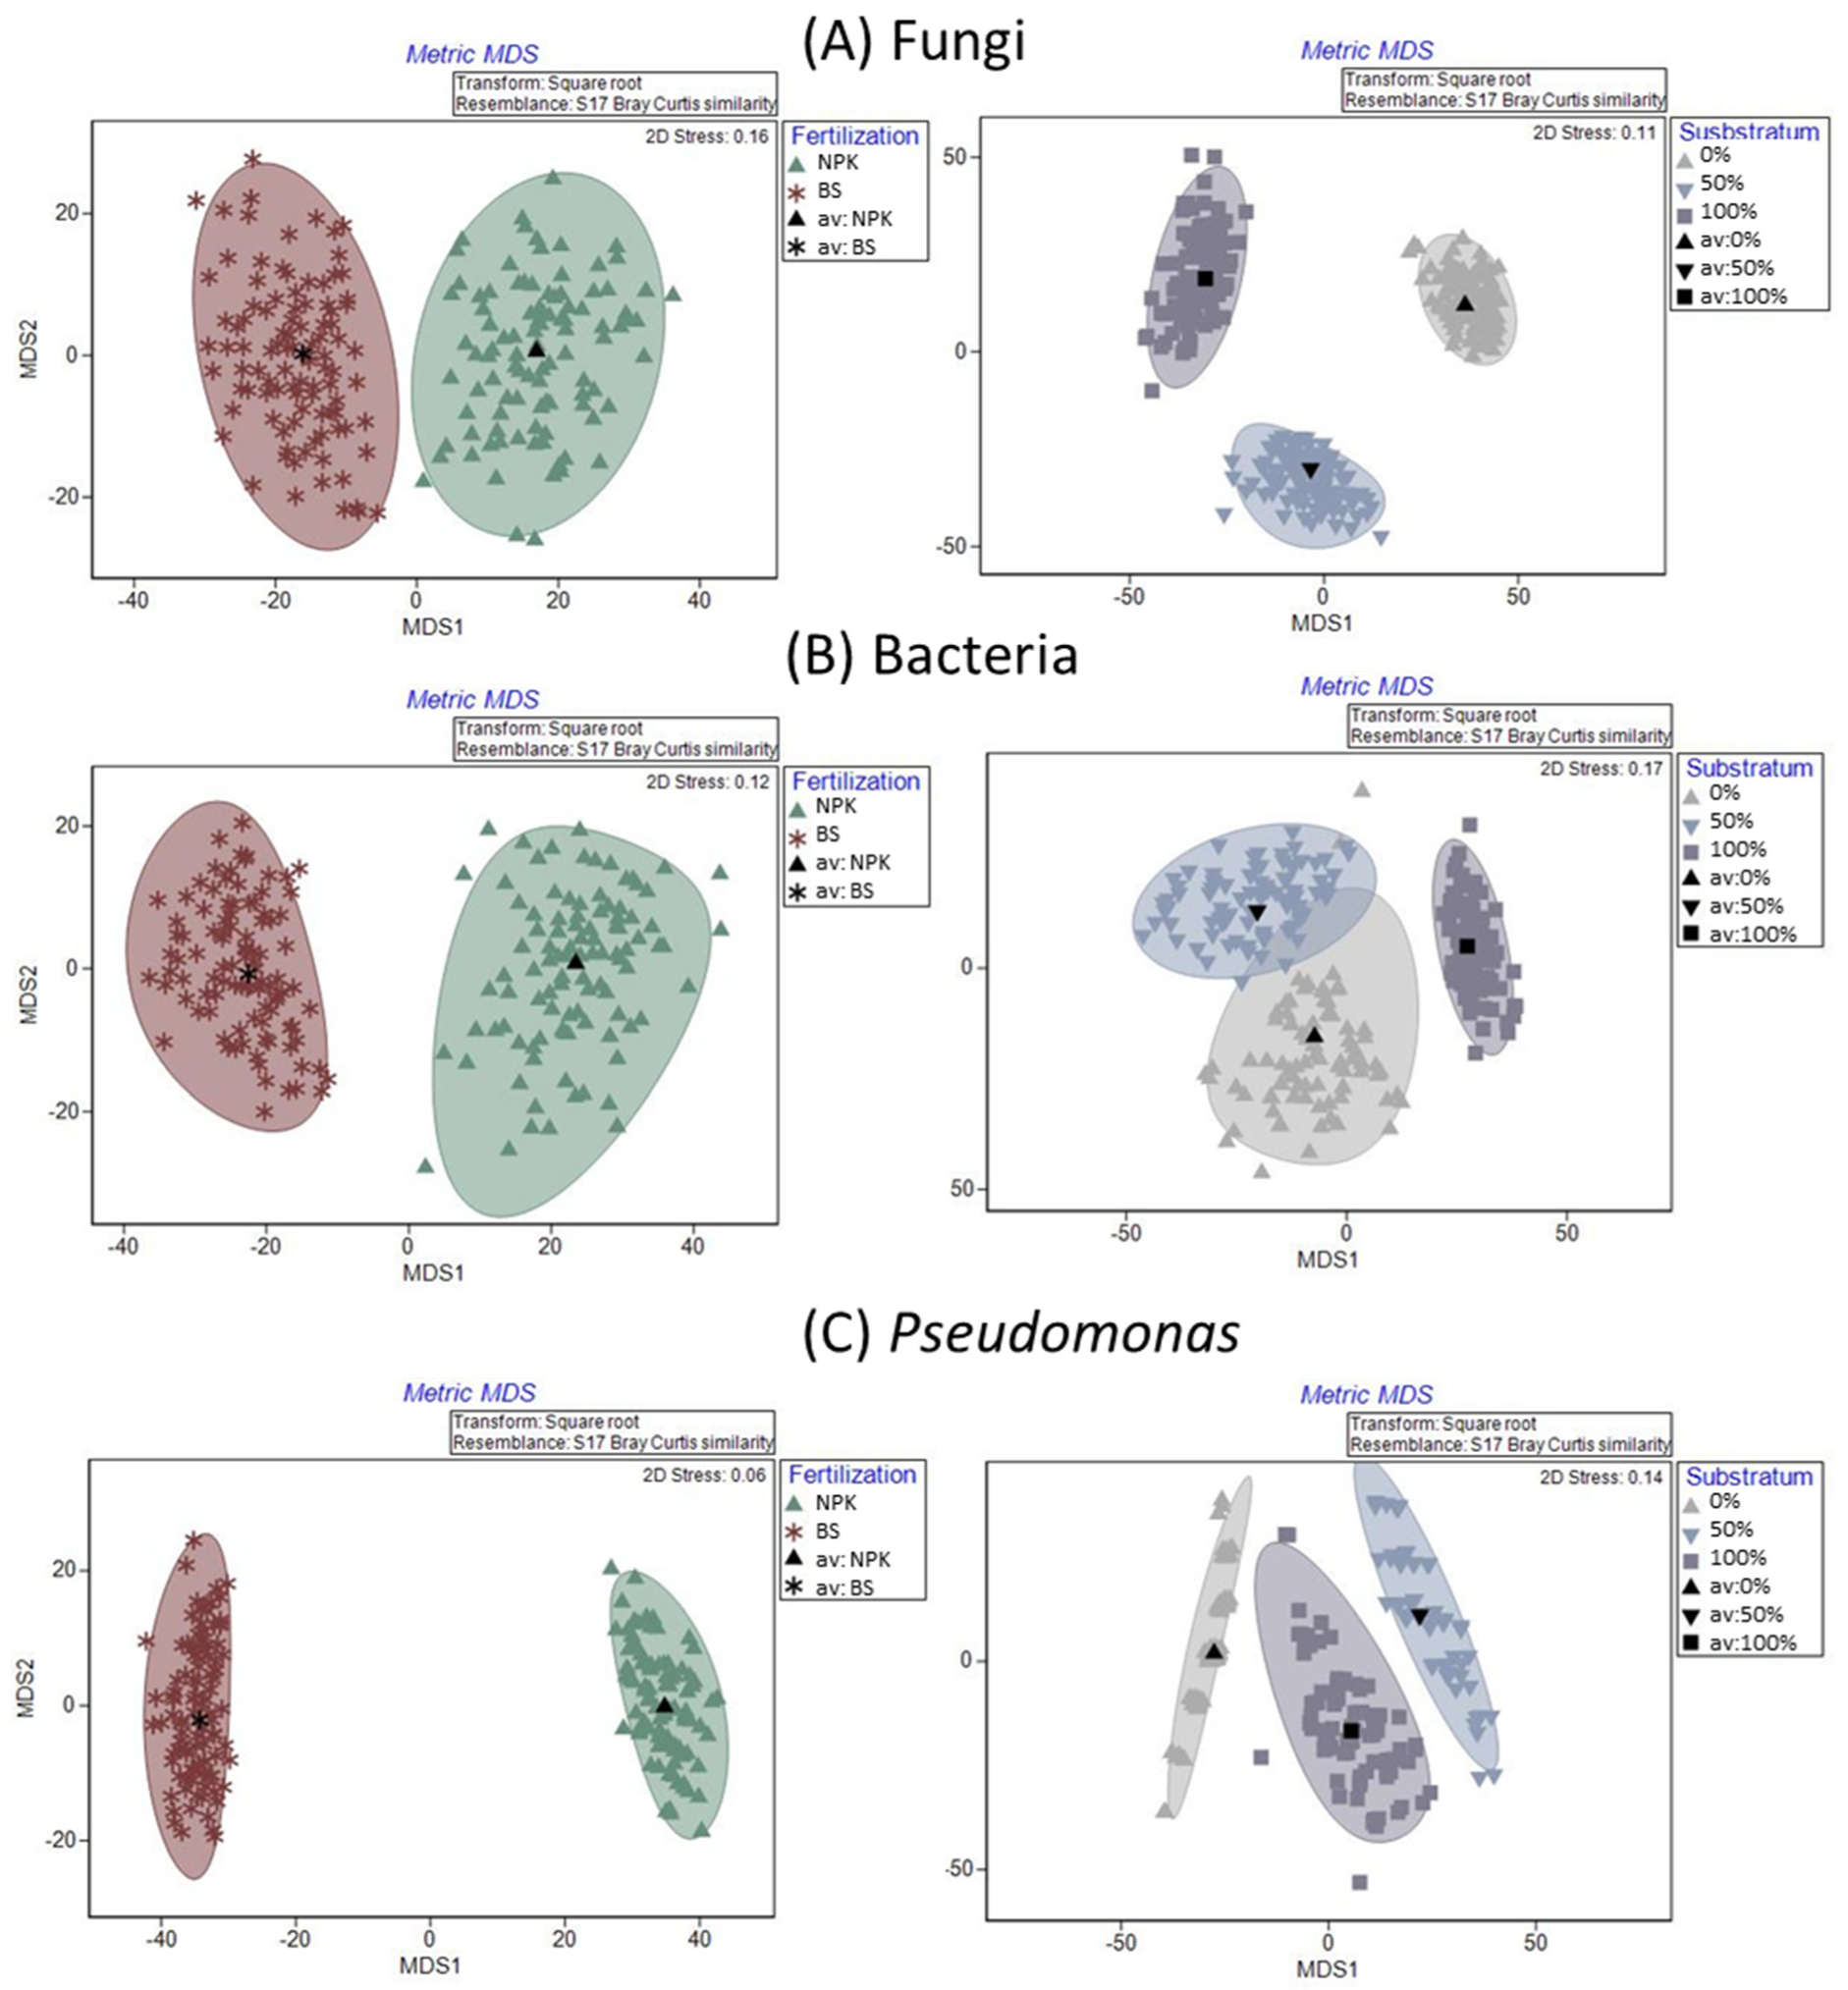
3.4. Rhizosphere Microbiota Analysis

The cultivable rhizosphere microbiota was quantitated and classified into different morphotypes. Within all the treatments, 21 morphotypes of fungi (MFH), 22 of bacteria (MFB), and 10 of Pseudomonas (MFP) were distinguished (Figure 6). Fungi morphotypes were identified up to genera by means of microscopic observations: Aspergillus (MFH 1 and 2), Acremonium (MFH3), Cladosporium (MFH 4 and 5), Fusarium (MFH 6–8), Penicillium (MFH 9–13), Scopulariopsis (MFH14), Trichoderma (MFH 15–18), and yeasts (MFH19–21). The PERMANOVA models revealed an effect of fertilization and substrate composition on the culturable Fungi and Bacteria, as well as in the genus Pseudomonas (Table 3). To visualize the effect of different substrate compositions and fertilizer treatments on the cultivable microbial communities, a multidimensional scaling (MDS) using bootstrap averages analysis was generated based on the Bray–Curtis similarity index and using fourth-root transformed species data (Figure 7). Substrate composition influenced microbial communities to a higher extent in the case of fungi, showing stress values ≤ 0.17, which denote a good representation of the data in reduced dimensions. The fertilization treatment led to higher dissimilarities between NPK- and BS-treated substrate microbial communities, with stress values even lower than those observed for substrate composition, in the case of Bacteria, and in particular in the Pseudomonas genus (Figure 7). In fact, PERMANOVA results indicated that both fertilization and substrate composition exerted a highly significant effect on the soil microbiota. The effect of fertilization was more significant in Bacteria, including the genus Pseudomonas, while the substrate composition showed a lower p value for Fungi (Table 3).
The differences observed in the multidimensional scaling become more explicit in Figure 6, which shows the quantity and composition of each microbial community, reflecting the diversity by means of the Shannon diversity Index (Figure 6). When comparing the NPK-treated substrate with the BS-treated one in the absence of compost (0%), a general increase in biodiversity was observed with BS application in both fungal and bacterial populations. Regarding fungi, the presence of MFH6, identified as Fusarium sp., decreased from the 70% of the identified cultivable fungi in NPK substrate to 16% in BS-treated substrate (Figure 6A). On the contrary, species such as Penicillium sp. (MFHs 9 to 13) or yeasts (MFHs 19–21) increased from 14% to 71% and from 3% to 7%, respectively, in BS-treated substrate in relation to NPK-treated ones. The highest fungal development, up to 7 × 10⁴ CFU g−1 soil, was observed in NPK-treated substrate without compost (0%), this high quantity being due to the dominance of Fusarium. The mixture of peat and compost in the same proportion (50%) decreased the total CFUs but showed higher fungal diversity, with a Shannon index around 1.8. On the contrary, by increasing compost up to 100%, both diversity and fungal presence decreased drastically in the NPK-treated and BS-treated rhizosphere. In BS-treated plants, the fungal presence was equal between the different substrates, also showing higher morphotype richness in the 50% compost treatment. Penicillium was the most abundant genus when no BS was added to the substrate 0%, while yeasts were dominant in 100% BS-treated substrate.
Regarding bacterial abundance, in NPK-treated rhizosphere (Figure 6B), compost addition to substrate increased both quantity and diversity of bacteria in the rhizosphere. BS-treated substrate revealed lower bacterial abundances but higher diversity than NPK-treated ones, with changes not being observed between the different substrates. Finally, in relation to the genus Pseudomonas (Figure 6C), it should be noted that the abundance in BS-treated plants was two orders of magnitude lower than in NPK-treated plants. However, the richness in terms of total morphotypes differentiated was much higher in BS-treated substrates, increasing indeed with the addition of compost to the mixture.

4. Discussion

4.1. Use of Compost as a Substitute for Peat in Chestnut Tree Cultivation

The beneficial effects of compost utilization on plant growth has been reported in many green house and nursery-crop production systems [24,25], although some studies also show that plant response depends on the plant species, the compost properties, and the composting method [14]. In our study, substrate mixtures with higher amounts of compost generally showed significantly lower values in all biometric parameters (excepting SLA) than substrates with higher amounts of peat. The Dickson quality index, which integrates almost all the biometric parameters, providing us with a complete overview, showed that plants grown only with compost had lower quality in terms of robustness and needed to cope with the field conditions after transplanting. These negative effects observed in the growth of chestnut seedlings at high compost doses would be a consequence of the increase in substrate pH and electric conductivity. When plants do not grow in an acceptable pH range, the solubility of micronutrients such as Fe or Mn can decrease, leading to deficiency symptoms, chlorosis, and necrosis [26,27]. On the other hand, the electrical conductivity is an indirect measure of the level of soluble salts in the substrate, which was increased with the amount of compost. This could exert a negative effect on plant growth, as suggested by the significant negative correlations between initial substrate EC and plant total biomass (r = −0.665) and root volume (r = −0.469). The high levels of Na, K, and Cl present in the compost could lead to osmotic problems through increasing substrate osmotic potential, limiting the availability of water to plants and generating toxic conditions [28], depending on the quantity of compost in the mixture. Although Yadav et al. (2012) [29] considered that compost with EC values > 3.0 mScm−1 are suitable for agricultural use, our data, with values around 1 mScm−1, suggested a slight negative effect on biomass production at high compost rates in the case of chestnut seedlings. Despite decreasing root volume, the substitution of part of the peat by compost favored the increase of the root mass fraction, which would result in a better balance between the root and the aerial part in order to obtain more resistant plants for transplanting to the field. At this time, plants must face environmental changing conditions and are more susceptible to potential abiotic stresses, mainly water deficit. In this sense, it has been proven that the root architecture of the forest plant, in particular the degree of branching and the size, amount, and distribution of fine roots, is one of the major factors helping to resist this stress [30]. Our results suggest that although the use of compost cannot completely replace peat, incorporating it into the chestnut growth substrate in mixtures up to 50% is possible. At this rate, the effect of pH around 8, and EC around 0.8 mScm−1 is not detrimental o chestnut growth and can provide the plant with greater resistance to water deficit, both at the nursery stage and in the rooting and initial phases of growth in the field after transplanting. In addition, compost addition also significantly influenced the rhizosphere microbial composition, especially the fungal composition. In fact, the highest fungal and bacterial diversity was observed in 50% substrate mixtures, with a decrease in potential pathogenic species such as Fusarium sp., and an increase in two genera designated as PGPFs such as Trichoderma sp. and Aspergillus sp., the former being described as a typical inhabitant of a properly produced compost [31].

4.2. Use of PGP-Based Biostimulant as an Alternative to Mineral Fertilization

There is some work describing seedling growth increase after inoculation with PGP bacteria in Pseudotsuga menziesii (Mirb.) Franco [32], Pinus pinea authority. [33] or Pinus radiata D. Don [21]. However, to our knowledge, apart from few works related to pest biocontrol, this is the first work reporting data on PGPs’ effects on chestnut growth. Fertilizer application in the nursery is a key factor affecting the chemical properties of the seedling rhizosphere, EC, pH, redox potential, and, thus, nutrient availability [34], which influences seedling growth, nutrient storage, root growth potential, and tolerance of adverse growth conditions [3]. The low mineral nutrient content of the BS compared to NPK fertilizer changes this pattern in fertilization management. However, the growth promoting capacity of the BS was reflected in the biometric and plant quality parameters, where the BS fertilized plants obtained better values than the unamended control plants. This means that chestnut growth was improved without addition of any mineral fertilization. Moreover, in the absence of compost (0%), the application of BS promoted growth that reached that of NPK-fertilized plants and even significantly exceeded it in parameters such as root volume and leaf biomass. So, in terms of seedling growth without compost, BS can maintain or even improve the growth obtained applying NPK, although attending to its composition, BS does not provide nutrients as directly as NPK does, and the microorganisms present in BS can mobilize some nutrients that would not be available for plants in the soil. The most important mobilization processes described are nitrogen fixation and solubilization of other nutrients, such as phosphate and potassium [35]. In this sense, free-living N2-fixing bacteria, including some strains of Pseudomonas [36] and Bacillus [37], can make atmospheric nitrogen available to the plant [38]. This nitrogen, together with nitrogen coming from the soil organic matter mineralization, will be available for plants. Therefore, even if nitrogen is not directly supplied as in mineral fertilization, plants get the same level of nitrogen when fertilized with BS instead NPK.
Bacteria with growth-promoting capacities are also characterized by the production of organic compounds, such as phytohormones, affecting the plant growth and development [17]. Related to this, both Pseudomonas aeruginosa and Pseudomonas putida, present in the BS used in this work, have been described to produce auxins. Auxins are capable of promoting root growth by stimulating cell division and elongation [39] and also prevent ethylene production by increasing ACC deaminase activity. As a consequence of the decrease in ethylene synthesis, root elongation is favored, provided that the potentially inhibitory high concentrations of auxins are not reached [40]. Bacillus is another genus with abundant representation in BS, also present in the rhizosphere of chestnut seedlings treated with the BS. This genus has also been described to produce auxins [37,39,41]. Thus, the higher bacterial diversity could explain differences in root volume between BS- and NPK-treated plants. However, the microorganisms involved in promoting plant growth are not only bacteria, since some fungi can also play an important role. The application of BS increased the presence of Trichoderma in the rhizosphere, a free-living fungus classified as beneficial for plant growth, since it stimulates the lateral root development by means of auxin-like compound production [42]. This has been associated with significant improvements in photosynthetic efficiency and biomass yield [43], as well as with an increased tolerance to abiotic stress and nutrient use efficiency [44].
In the case of fungi, in addition to the higher abundance of Trichoderma, the most remarkable feature of BS treatment was the drastic reduction of the incidence of Fusarium spp., a facultative pathogenic fungus, therefore reducing the pathogen inoculum pressure in comparison to NPK fertilization. It is known that biostimulants based on microorganism consortia instead of a single PGP strain can reach most of the niches because of their increased genetic diversity, colonizing the root zone much faster than a single strain and competing spatially with a broader range of potential pathogens under different plant growth and environment conditions [45]. In this study, BS application led to changes in functional groups, with an increase of around 60% in the contribution of Penicillium, common saprophytic fungus, or a moderate rise in the contribution of yeasts to the total fungi morphotypes identified. Related to this, the role of yeasts as growth promoters has been widely described [46,47], including their biocontrol capability [48]. Moreover, some Penicillium strains have been identified as antagonist to phytopathogens [49].
With respect to the response of chestnut seedlings to water shortage, a better water status of BS-treated plants with respect to those fertilized with NPK under drought conditions was observed. This allowed us to verify that the application of BS effectively conferred chestnut plants a greater capacity to tolerate water stress, which is in agreement with the results obtained in other works with PGPs [50,51]. In this experiment, the most drought resistant chestnut seedlings were those combining compost with BS, which together with the fact that BS-treated plants showed higher values of stomatal conductance when both inputs were applied suggests a positive synergy through an improvement in the plant water status. In fact, the least negative water potential was achieved with the complete replacement of peat by compost combined with PGP-based fertilization.
Different mechanisms have been proposed and demonstrated to explain the ability of some microorganisms to induce plant resistance to drought [52]. This induction would be related to higher root development [30], as was observed in this study, where BS induced higher root mass fraction, while other indirect mechanisms should be also considered. Pseudomonas and Bacillus have been reported to stimulate plant growth under dry conditions, increasing root biomass and plant water content [20], and partially eliminating the effect of drought stress by decreasing ethylene production in pea [53]. Arzanesh et al. (2011) [54] demonstrated that hormones secreted by PGPRs altered plant root morphology, allowing greater water uptake. In our study, the volumetric difference observed in roots between NPK and BS fertilized chestnut trees, although only significant in substrates without compost, suggests a key role in resisting water stress. The higher stomatal conductance observed in BS-treated plants would indicate higher transpiration rates and, therefore, a better water status. Related to this, the increasing incidence of Trichoderma spp. would be associated with the better physiological status under drought conditions, the alleviation of ROS in plants [55,56] and the release of metabolites analogous to phytohormones [42,57] being reported as mechanisms enhancing plant growth under drought stress conditions. In addition, it is well known that osmolytes secreted by microorganisms act together with plant-generated osmolytes, improving plant water status [51]. Through these mechanisms, the application of BS based on PGPs would have conferred to chestnut plants a greater resistance to drought, maintaining less negative water potentials than those treated with NPK. Hence, our results demonstrate that the application of this PGP-based BS in chestnut nursery is an effective alternative to traditional mineral fertilization, since seedlings with equal or improved biometric characteristics compared to NPK are obtained, together with a greater resistance to the possible drought stress after transplanting to field conditions.

4.3. Compost–Biostimulant Synergy

Although this work has not demonstrated that the joint application of both compost and BS favors chestnut growth, the application of BS could replace NPK at all compost levels, obtaining plants with similar development or with slightly less canopy, but more balanced in terms of root development. In the study by Arif et al. (2017) [58], it was shown that an N-enriched compost together with an inoculum of PGPs favored sunflower growth through an increase in the availability of nitrogen in the substrate. In our case, the combination of these two inputs resulted in a significantly lower N extraction, so we could deduce that our PGP-based BS was not able to utilize so efficiently the N of the compost, making it more available to the chestnut seedlings. Thus, despite achieving higher root mass fractions when both inputs were combined, the aerial part of BS-treated plants extracted less quantity of N than NPK-treated plants, regardless of the level of compost in the substrate. However, a compost concentration up to 50% allowed the chestnut trees to maintain similar quality with BS or NPK, although aerial biomass and height were higher under NPK application. The amendment of a PGP-based BS seemed to partly counteract the negative effect of an excess of compost in the substrate, as suggested by the low EC values after BS application, regardless of the substrate composition. Moreover, less fluctuations were observed in rhizosphere microbial populations sizes in terms of CFUs between BS-treated substrate mixtures in comparison to NPK amended ones. Thus, BS amendment appeared to be exerting a buffer effect, avoiding the compost-induced changes, decreasing fungal population, and increasing bacterial ones when NPK was applied. These facts, together with the higher bacterial diversity observed when both inputs were jointly applied would be related to the chestnut quality improvement/maintenance with respect to NPK application, although not having applied mineral nutrients.

5. Conclusions

Compost can be used for chestnut seedling production in forest nurseries, replacing peat by up to 50%, which would reduce the use of peat, yielding plants with practically the same size and quality for field production. PGP-based biostimulants can be considered as alternatives to the use of mineral fertilization in the production of chestnut seedlings in nurseries, since these microorganisms provide multiple benefits to the plants, yielding similar or better chestnut quality than applying mineral fertilization. In addition, biostimulant significantly improves plant tolerance to water deficit, the joint application of both compost and biostimulant being recommended when peat substitution by compost does not exceed 50%.

Supplementary Materials

The following are available online at https://www.mdpi.com/article/10.3390/f12070850/s1, Figure S1: Linear adjustments between substrate TDR values and days under drought conditions for each substrate composition (0% blue, 25% green, 50% yellow, 100% brown) for NPK-treated substrate (A) and BS-treated substrate (B). (n = 6).

Author Contributions

Conceptualization, T.F.-M., I.S., M.K.D.; methodology, T.F.-M., U.O., X.H., M.K.D.; software, T.F.-M., I.S.; validation, J.M.E., X.H., M.K.D.; formal analysis, T.F.-M., U.O., X.H., M.K.D.; investigation, T.F.-M., I.S., M.K.D.; data curation, T.F.-M., I.S., M.K.D.; writing—original draft preparation, T.F.-M., I.S., M.K.D.; writing—review and editing U.O., X.H., J.M.E., C.G.-M., I.S., M.K.D.; visualization, I.S., M.K.D.; supervision, M.K.D.; project administration, C.G.-M., M.K.D., I.S., J.M.E.; funding acquisition, C.G.-M., M.K.D., J.M.E. All authors have read and agreed to the published version of the manuscript.

Funding

This work was funded by the Spanish Government (RTI2018-094623-B-C21 MCIU/AEI/FEDER, UE), and by the Basque Government (IT-932-16).

Data Availability Statement

Not applicable.

Acknowledgments

The authors want to thank the technical support of Kepa Txarterina from Basalan S.L. (Provincial Council of Bizkaia). The authors are thankful for the technician and human support provided by the Sequencing and Genotyping Unit of SGIKER, University of the Basque Country (UPV/EHU FEDER, EU).

Conflicts of Interest

The authors declare no conflict of interest. The funders had no role in the design of the study; in the collection, analyses, or interpretation of data; in the writing of the manuscript; or in the decision to publish the results.

References

  1. Conedera, M.; Krebs, P. History, present situation and perspective of chestnut cultivation in Europe. Acta Hort. 2008, 784, 23–27. [Google Scholar] [CrossRef]
  2. Radoglou, K.; Raftoyannis, Y.; Halivopoulos, G. The effects of planting date and seedling quality on field performance of Castanea sativa Mill. And Quercus frainetto Ten. Seedl. For. 2003, 76, 569–578. [Google Scholar] [CrossRef] [Green Version]
  3. Landis, T.D. Mineral nutrition as an Index of Seedling Quality. In Evaluating Seedling Quality: Principles, Procedures, and Predictive Abilities of Major Tests; Duryea, M.L., Ed.; Forest Research Laboratory, Oregon State University: Corvallis, OR, USA, 1985; pp. 29–48. [Google Scholar]
  4. Veijalainen, A.M.; Juntunen, M.L.; Heiskanen, J.; Lilja, A. Growing Picea abies seedlings in peat and composted forest-nursery waste mixtures for forest regeneration. Scan. J. For. Res. 2007, 22, 390–397. [Google Scholar] [CrossRef]
  5. Krucker, M.; Hummel, R.L.; Cogger, C. Chrysanthemum production in composted and noncomposted organic waste substrates fertilized with nitrogen at two rates using surface and subirrigation. Hort. Sci. 2010, 45, 1695–1701. [Google Scholar] [CrossRef]
  6. Maher, M.; Prasad, M.; Raviv, M. Organic soilless media components. In Soilless Culture: Theory and Practice; Raviv, M., Lieth, J.H., Eds.; Academic Press: San Diego, CA, USA, 2008; pp. 459–504. [Google Scholar]
  7. Alexander, P.D.; Bragg, N.C.; Meade, R.; Padelopoulos, G.; Watts, O. Peat in horticulture and conservation: The UK response to a changing world. Mires Peat 2008, 3, 8. [Google Scholar]
  8. Medina, E.; Paredes, C.; Pérez-Murcia, M.D.; Bustamante, M.A.; Moral, R. Spent mushroom substrates as component of growing media for germination and growth of horticultural plant. Bioresour. Technol. 2009, 100, 4227–4232. [Google Scholar] [CrossRef] [PubMed]
  9. Luo, H.; Wang, Q.; Zhang, J.; Wang, L.; Li, Y.; Yang, G. Minimum fertilization at the appearance of the first flower benefits cotton nutrient utilization of nitrogen, phosphorus and potassium. Sci. Rep. 2001, 10, 1–13. [Google Scholar]
  10. Van den Driessche, R. Changes in drought resistance and root growth capacity of container seedlings in response to nursery drought, nitrogen and potassium treatments. Can. J. Forest Res. 1992, 22, 740–749. [Google Scholar] [CrossRef]
  11. Farrell, M.; Jones, D.L. Food waste composting: Its use as a peat replacement. Waste Manag. 2010, 30, 1495–1501. [Google Scholar] [CrossRef]
  12. Veijalainen, A.M.; Heiskanen, J.; Juntunen, M.L.; Lilja, A. Tree-seedling compost as a component in Sphagnum peat-based growing media for conifer seedlings: Physical and chemical properties. Acta Hort. 2008, 779, 431–438. [Google Scholar] [CrossRef]
  13. Wilson, S.B.; Mecca, L.K.; Stoffella, P.J. Evaluation of compost as a viable medium amendment for containerized perennial production. Acta Hort. 2004, 659, 697–703. [Google Scholar] [CrossRef]
  14. Raviv, M. Production of high-quality composts for horticultural purposes—A minireview. Hort. Technol. 2005, 15, 52–57. [Google Scholar] [CrossRef] [Green Version]
  15. DuJardin, P. Plant biostimulants: Definition, concept, main categories and regulation. Sci. Hort. 2015, 196, 3–14. [Google Scholar] [CrossRef] [Green Version]
  16. Hayat, R.; Ali, S.; Amara, U.; Khalid, R.; Ahmed, I. Soil beneficial bacteria and their role in plant growth promotion: A review. Ann. Microbiol. 2010, 60, 579–598. [Google Scholar] [CrossRef]
  17. Odoh, C.K.; Eze, C.N.; Akpi, U.K.; Unah, V.U. Plant growth promoting rhizobacteria (PGPR): A novel agent for sustainable food production. Am. J. Agr. Biol. Sci. 2019, 14, 35–54. [Google Scholar]
  18. Nihorimebere, V.; Ongena, M.; Smargiassi, M.; Thonart, P. Beneficial effect of the rhizosphere microbial community for plant growth and health. Biotechnol. Agron. Soc. Environ. 2011, 15, 327–337. [Google Scholar]
  19. Yang, J.; Kloepper, J.W.; Ryu, J. Rhizosphere bacteria help plants tolerate abiotic stress. Trend Plant Sci. 2009, 14, 1–4. [Google Scholar] [CrossRef]
  20. Calvo, P.; Nelson, L.; Kloepper, J. Agricultural uses of plant biostimulants. Plant Soil. 2014, 383, 3–41. [Google Scholar] [CrossRef] [Green Version]
  21. Otero, M.; Salcedo, I.; Txarterina, K.; González-Murua, C.; Duñabeitia, M.K. Quality assessment of Pinus radiata production under sustainable nursery management based on compost tea. J. Plant Nutr. Soil. Sci. 2019, 182, 1–11. [Google Scholar] [CrossRef]
  22. Dickson, A.; Leaf, A.L.; Hosner, J.F. Quality appraisal of white spruce and white pine seedling stock in nurseries. Forest. Chron. 1960, 36, 10–13. [Google Scholar] [CrossRef]
  23. Clarke, K.R.; Gorley, R.N. PRIMER v7: User Manual/Tutorial. PRIMER-EPlymouth. 2015. Available online: http://updates.primer-e.com/primer7/manuals/User_manual_v7a.pdf (accessed on 4 June 2021).
  24. Wilson, S.B.; Stoffella, P.J.; Graetz, D.A. Development of compost-based media for containerized perennials. Sci. Hort. 2002, 93, 311–320. [Google Scholar] [CrossRef]
  25. Davis, A.S.; Jacobs, D.F.; Wightman, K.E.; Birge, Z.K.D. Organic matter added to bareroot nursery beds influences soil properties and morphology of Fraxinus pennsylvanica and Quercus rubra seedlings. New For. 2006, 31, 293–303. [Google Scholar] [CrossRef]
  26. Albano, J.P.; Miller, W.B. Marigold cultivars vary in susceptibility to iron toxicity. Hort. Sci. 1998, 33, 1180–1182. [Google Scholar] [CrossRef] [Green Version]
  27. Smith, B.R.; Fisher, P.R.; Argo, W.R. Growth and pigment content of container-grown impatiens and petunia in relation to root substrate pH and applied micronutrient concentration. Hort. Sci. 2004, 39, 1421–1425. [Google Scholar] [CrossRef]
  28. Cristiano, G.; Camposeo, S.; Fracchiolla, M.; Vivaldi, G.A.; De Lucia, B.D.L.; Cazzato, E. Salinity differentially affects growth and ecophysiology of two mastic tree (Pistacia lentiscus L.) accessions. Forests 2016, 7, 156. [Google Scholar] [CrossRef] [Green Version]
  29. Yadav, K.D.; Ahammed, M.M. Integrated composting-vermicomposting process for stabilization of human faecal slurry. Ecol. Eng. 2012, 47, 24–29. [Google Scholar] [CrossRef]
  30. Grossnickle, S.C. Importance of root growth in overcoming planting stress. New For. 2005, 30, 273–294. [Google Scholar] [CrossRef]
  31. Ashraf, R.; Shahid, F.; Adam, T.A. Association of fungi, bacteria and Actinomycetes with different composts. Pak. J. Bot. 2007, 39, 2141–2151. [Google Scholar]
  32. Khan, Z.; Kandel, S.L.; Ramos, D.N.; Ettl, G.J.; Kim, S.H.; Doty, S.L. Increased biomass of nursery-grown Douglas-fir seedlings upon inoculation with diazotrophic endophytic consortia. Forests 2015, 6, 3582–3593. [Google Scholar] [CrossRef] [Green Version]
  33. Probanza, A.; Lucas García, J.A.; Ruiz Palomino, M.; Ramos, B.; Gutiérrez Mañero, F.J. Pinus pinea L. seedling growth and bacterial rhizosphere structure after inoculation with PGPR Bacillus (B. licheniformis CECT 5106 and B. pumilus CECT 5105). Appl. Soil Ecol. 2002, 20, 75–84. [Google Scholar] [CrossRef]
  34. Jacobs, D.F.; Timmer, V.R. Fertilzer-induced changes in rhizosphere electrical conductivity: Relation to forest tree seedling root system growth and function. New For. 2005, 30, 147–166. [Google Scholar] [CrossRef]
  35. Bhattacharyya, P.N.; Jha, D.K. Plant growth-promoting rhizobacteria (PGPR): Emergence in agriculture. World J. Microbiol. Biotechnol. 2012, 28, 1327–1350. [Google Scholar] [CrossRef]
  36. Yan, Y.; Yang, J.; Dou, Y. Nitrogen fixation island and rhizosphere competence traits in the genome of root-associated Pseudomonas stutzeri A1501. Proc. Nat. Acad. Sci. USA 2008, 21, 7564–7569. [Google Scholar] [CrossRef] [Green Version]
  37. Iqbal, S.; Hameed, S.; Shahid, M.; Hussain, K.; Ahmad, N.; Niaz, M. In vitro characterization of bacterial endophytes from tomato (Solanum lycopersicum L.) for phytobeneficial traits. App. Ecol. Environ. Res. 2018, 16, 1037–1051. [Google Scholar] [CrossRef]
  38. Vessey, J.K. Plant growth promoting rhizobacteria as biofertilizers. Plant Soil 2003, 255, 571–586. [Google Scholar] [CrossRef]
  39. Patten, C.L.; Glick, B.R. Role of Pseudomonas putida indoleacetic acid in development of the host plant root system. App. Environ. Microbiol. 2002, 68, 3795–3801. [Google Scholar] [CrossRef] [Green Version]
  40. Kudoyarova, G.; Arkhipova, T.; Korshunova, T.; Bakaeva, M.; Loginov, O.; Dodd, C. Phytohormone mediation interactions between plants and non-symbiotic growth promoting bacteria under edaphic stresses. Front. Plant Sci. 2019, 10, 1368. [Google Scholar] [CrossRef]
  41. Gutiérrez-Mañero, F.J.; Ramos-Solano, B.; Probanza, A.N.; Mehouachi, J.R.; Tadeo, F.; Talon, M. The plant-growth-promoting rhizobacteria Bacillus pumilus and Bacillus licheniformis produce high amounts of physiologically active gibberellins. Phys. Plant. 2001, 111, 206–211. [Google Scholar] [CrossRef]
  42. Contreras-Cornejo, H.A.; Macías-Rodríguez, L.; Cortés-Penagos, C.; López-Bucio, J. Trichoderma virens, a plant beneficial fungus, enhances biomass production and promotes lateral root growth through an auxin-dependent mechanism in Arabidopsis. Plant Physiol. 2009, 149, 1579–1592. [Google Scholar] [CrossRef] [Green Version]
  43. Hossain, M.M.; Sultana, F.; Islam, S. Plant Growth-Promoting Fungi (PGPF): Phytostimulation and Induced Systemic Resistance. In Plant-Microbe Interactions in Agro-Ecological Perspectives, Microbial Interactions and Agro-ecological Impacts; Singh, D.P., Singh, H.B., Prabha, R., Eds.; Springer: Singapore, 2017; Volume 2, pp. 135–191. [Google Scholar]
  44. Colla, G.; Rouphael, Y.; Di Mattia, E.; El-Nakhel, C.; Cardarelli, M. Co-inoculation of Glomus intraradices and Trichoderma atroviride acts as a biostimulant to promote growth, yield and nutrient uptake of vegetable crops. J. Sci. Food Agric. 2015, 95, 1706–1715. [Google Scholar] [CrossRef]
  45. Reddy, P.P. Plant Growth Promoting Rhizobacteria for Horticultural Crop Protection, Challenges, Future Prospects and Conclusions; Springer: New Delhi, India, 2014; pp. 296–303. [Google Scholar]
  46. Amprayn, K.; Rose, M.; Kecskés, M.; Pereg, L.; Nguyen, H.; Kennedy, I. Plant growth promoting characteristics of soil yeast (Candida tropicalis HY) and its effectiveness for promoting rice growth. Appl. Soil Ecology. 2012, 61, 295–299. [Google Scholar] [CrossRef]
  47. Sarabia, M.; Cornejo, P.; Azcón, R.; Carreón-Abud, Y.; Larsen, J. Mineral phosphorus fertilization modulates interactions between maize, rhizosphere yeasts and arbuscular mycorrhizal fungi. Rhizosphere 2017, 4, 325–341. [Google Scholar] [CrossRef]
  48. Nutaratat, P.; Srisuk, N.; Arunrattiyakorn, P.; Limtong, S. Plant growth-promoting traits of epiphytic and endophytic yeasts isolated from rice and sugar cane leaves in Thailand. Fungal Biol. 2014, 118, 683–694. [Google Scholar] [CrossRef]
  49. Babu, A.G.; Kim, S.W.; Yadav, D.J.; Hyum, U.; Adhikari, M.; Lee, Y.S. Penicillium menonorum: A novel fungus to promote growth and nutrient management in cucumber plants. Mycobiology 2015, 43, 49–56. [Google Scholar] [CrossRef] [PubMed] [Green Version]
  50. Liu, F.; Xing, S.; Ma, H.; Du, Z.; Ma, B. Cytokinin-producing, plant growth-promoting rhizobacteria that confer resistance to drought stress in Platycladus orientalis container seedlings. App. Microbiol. Biotech. 2013, 97, 9155–9164. [Google Scholar] [CrossRef] [PubMed]
  51. Sandhya, V.Z.A.S.; Grover, M.; Reddy, G.; Venkateswarlu, B. Alleviation of drought stress effects in sunflower seedlings by the exopolysaccharides producing Pseudomonas putida strain GAP-p45. Biol. Fert. Soil. 2009, 46, 17–26. [Google Scholar] [CrossRef]
  52. Vurukonda, S.S.K.P.; Vardharajula, S.; Shrivastava, M.; SkZ, A. Enhancement of drought stress tolerance in crops by plant growth promoting rhizobacteria. Microbiol. Res. 2016, 184, 13–24. [Google Scholar] [CrossRef] [PubMed]
  53. Arshad, M.; Shaharoona, B.; Mahmood, T. Inoculation with Pseudomonas spp. containing ACC-deaminase partially eliminates the effects of drought stress on growth, yield, and ripening of pea (Pisum sativum L.). Pedosphere 2008, 18, 611–620. [Google Scholar] [CrossRef]
  54. Arzanesh, M.H.; Alikhani, H.A.; Khavazi, K.; Rahimian, H.A.; Miransari, M. Wheat (Triticum aestivum L.) growth enhancement by Azospirillum sp. under drought stress. World J. Microbiol. Biotech. 2011, 27, 197–205. [Google Scholar] [CrossRef]
  55. Shoresh, M.; Harman, G.E.; Mastouri, F. Induced systemic resistance and plant responses to fungal biocontrol agents. Ann. Rev. Phyto. 2010, 48, 21–43. [Google Scholar] [CrossRef] [Green Version]
  56. Chepsergon, J.; Mwamburi, D.L.; Kassim, M.K. Mechanism of Drought Tolerance in Plants Using Trichoderma spp. Int. J. Sci. Res. 2014, 3, 1592–1595. [Google Scholar]
  57. Martínez-Medina, A.; Alguacil, M.D.M.; Pascual, J.A.; Van Wees, S.C. Phytohormone profiles induced by Trichoderma isolates correspond with their biocontrol and plant growth-promoting activity on melon plants. J. Chem. Ecol. 2014, 40, 804–815. [Google Scholar] [CrossRef] [PubMed]
  58. Arif, M.S.; Shahzad, S.M.; Riaz, M.; Yasmeen, T.; Shahzad, T.; Akhtar, M.J.; Bragazza, L.; Buttler, A. Nitrogen-enriched compost application combined with plant growth-promoting rhizobacteria (PGPR) improves seed quality and nutrient use efficiency of sunflower. J. Plant Nutr. Soil Sci. 2017, 180, 464–473. [Google Scholar] [CrossRef]
Figure 1. Substrate pH (A) and electric conductivity (B) values. Yellow bars, initial substrate conditions; green bars, NPK-treated substrate at the end of the experiment; brown bars, BS-treated substrate at the end of the experiment. Different letters indicate significant differences using Duncan’s test (p < 0.05; n = 6) within each condition: initial (Yellow lowercase letters), NPK-treated (green uppercase letters) and BS-treated (brown uppercase bold letters).
Forests 12 00850 g001
Figure 2. Biometric parameters ((A) Root DW, (B) Root Volume, (C) Stem DW, (D) Height, (E) Leaf DW, (F) SLA) of chestnut seedlings cultivated with the different substrate mixtures (compost: 0%, 25%, 50%, 75% and 100%) supplied with NPK (green bars) or BS (brown bars). Blue bars represent control substrate 0% supplied only with water. SLA, specific leaf area. Different letters indicate significant differences (p < 0.05; n = 6) between each substrate mixture (green lowercase letters for NPK and brown uppercase letters for BS). Asterisk means significant differences using t-tests between NPK and BS within each substrate mixture.
Forests 12 00850 g002
Figure 3. Dickson quality index (A) and root mass ratio (B) of chestnut plants cultivated with the different substrate mixtures (compost: 0%, 25%, 50%, 75% and 100%) supplied with NPK (green bars) or BS (brown bars). Blue bars represent control substrate of 0% supplied only with water. Different letters indicate significant differences (p < 0.05; n = 6) between each substrate mixture (green lowercase letters for NPK and brown uppercase letters for BS). Asterisk means significant differences using t-tests between NPK and BS within each substrate mixture.
Forests 12 00850 g003
Figure 4. Stomatal conductance (A) and total N in the canopy (B) of chestnut plants cultivated with the different mixtures (compost: 0%, 25%, 50%, 75% and 100%) supplied with NPK (green bars) or BS (brown bars). Blue bars represent control substrate 0% supplied only with water. Different letters indicate significant differences (p < 0.05; n = 6) between each substrate mixture (green lowercase letters for NPK and brown uppercase letters for BS). Asterisk means significant differences using t-tests between NPK and BS within each substrate mixture.
Forests 12 00850 g004
Figure 5. Water potential values of chestnut plants cultivated with the different substrate mixtures (compost: 0%, 25%, 50% and 100%) after one week of drought (A) and after one week of irrigation restoration (B). Within each substrate mixture, the green bars show the values of NPK-treated plants (irrigated dark bars, and subjected to drought light bars) and the brown bars show the values of BS-treated plants (irrigated dark bars, and subjected to drought light bars). Letters (green lowercase letters for irrigated NPK-treated, green uppercase letters for drought NPK-treated, brown lowercase letters for irrigated BS-treated and brown uppercase letters for drought BS-treated) indicate significant differences (p < 0.05; n = 6) between substrate mixtures for each situation (irrigation or drought) and within each treatment (NPK or BS). Asterisk means significant differences using t-tests between water and drought within each substrate mixture and treatment (NPK or BS).
Forests 12 00850 g005
Figure 6. Cultivable fungi (A), bacteria (B) and bacteria from Pseudomonas genus (C) isolated from rhizosphere soil of chestnut seedlings grown for 8 months on different substrate mixtures (compost: 0%, 50% and 100%). Bars show microorganism quantity in colony formation units per gram of soil (CFU/g) as the sum of the quantity of all morphotypes found in each treatment (represented with different colors within each group. MFH, fungal morphotypes; MFB, bacterial morphotypes; MFP, Pseudomonas morphotypes). Dotted line graphs show changes in Shannon diversity index (H′) for each treatment. Values represent mean ± SE (n = 6).
Forests 12 00850 g006
Figure 7. Multidimensional scaling (MDS) using bootstrap averages of the different biota communities ((A) Fungi, (B) Bacteria, (C) Pseudomonas) based on Bray–Curtis index. Metric MDS ordination employed (100 per group) bootstrap averages of the centroid of each sample to show where 95% of the centroid averages lay within multivariate space. Figures on the left represent cultures compared regarding fertilization: NPK (green) vs. BS (brown). Figures on the right represent cultures compared regarding substrate composition: 0% (grey), 50% (light purple) and 100% (dark purple).
Forests 12 00850 g007
Table 1. Physicochemical characteristics of compost and biostimulant (n.m., not measured; nd, not detected; MPN, most probable number).
CompostBiostimulant (BS)
Dry matter (%)87.740.91
Moisture (%)12.2699.09
Organic matter (%)69.3nd
Total N (%)2.850.1449
Ammonium (mg/L)71.20.0183
Nitrate (mg/L)<1.0nd
Organic C (%)40.2n.m.
C/N14.114.1
pH (1/5 v/v)7.597.84
Conductivity (mS/cm) (1/5 v/v)11.214.3
Density (g/cm3)0.351.011
Total calcium (mg/L)2330.0131
Sulphate (mg/L)4020.0634
Phosphate (mg/L)35.7nd
Magnesium (mg/L)60.400.0508
Carbonate (mg/L)<5.0n.m.
Bicarbonate (mg/L)1740n.m.
Chloride (mg/L)2140n.m.
Potassium (mg/L)31700.457
Sodium (mg/L)3492.037
Humic acids (%)18.40nd
Fulvic acids (%)3.82nd
Total humic extract (%)22.2nd
Escherichia coli (MPN/g)<10nd
Salmonella (25 g)ndnd
Table 2. Significance (sig) and size effect determined as partial eta-squared (ɳ2p) of each factor (substrate and fertilizer management) and their interaction of the different variables measured. * p < 0.05; ** p < 0.01; *** p < 0.001; ns, non-significant. SLA, specific leaf area; DW, dry weight; RMR, root mass ratio; DQI, Dickson quality index; SC, stomatal conductance; EC, soil electrical conductivity.
Root
Volume
HeightRoot-
Collar
Diameter
Canopy AreaSLALeaf DWStem DWRoot DWTotal DW
sigɳ2psigɳ2psigɳ2psigɳ2psigɳ2psigɳ2psigɳ2psigɳ2psigɳ2p
substrate***0.381***0.792***0.96***0.716ns0.158***0.843***0.679***0.377***0.723
fertilizationns0.044***0.320ns0.002ns0.002ns0.028ns0.054**0.118ns0.06ns0.024
substrate × Fert**0.214***0.485***0.309ns0.119ns0.121***0.421***0.345ns0.110**0.260
RMRDQIRoot/ShootLeaf N (%)N CanopySCSoil pHSoil EC
sigɳ2psigɳ2psigɳ2psigɳ2psigɳ2psigɳ2psigɳ2psigɳ2p
substrate***0.449***0.337***0.581***0.403***0.798**0.297***0.842***0.935
fertilization***0.199ns0.004**0.147***0.543***0.211**0.186***0.884***0.983
substrate × Fertns0.107*0.181*0.215*0.246***0.468ns0.063***0.284***0.916
Table 3. Results of the PERMANOVA analysis to test the effect of fertilization and substrate on the cultivable microbial communities (Fungi, Bacteria, and the genus Pseudomonas).
Fungi Bacteria Pseudomonas
Fertilization Fertilization Fertilization
SourceDfSum SqPseudo-Fp (perm)SourceDfSum SqPseudo-Fp (perm)SourceDfSum SqPseudo-Fp (perm)
Fertilization19589.42.63850.017Fertilization195795.09690.001Fertilization127,03612.3760.001
Residuals341.24 × 105 Residuals1630,070 Residuals3474,274
Total351.33 × 105 Total1739,649 Total351.01 × 105
Substrate Substrate Substrate
SourceDfSum SqPseudo-Fp (perm)SourceDfSum SqPseudo-Fp (perm)SourceDfSum SqPseudo-Fp (perm)
Substrate243,9848.13830.001Substrate29682.62.42340.016Substrate214,6832.79680.004
Residuals3389,175 Residuals1529,967 Residuals3386,627
Total351.33 × 105 Total1739,649 Total351.01 × 105
Df: degrees of freedom; Sum Sq: sum of squares; Pseudo-F: F value by permutation; p (perm): p-values based on 999 permutations (statistically significant p-values are shown in bold).
Publisher’s Note: MDPI stays neutral with regard to jurisdictional claims in published maps and institutional affiliations.

