Article

Net Revenue of Forest Carbon Offset Projects: Application of the Korean Emission Trading System in the Forestry Sector

1
College of Forest and Environmental Sciences, Kangwon National University, Chuncheon 24341, Korea
2
Forest Industries Research Centre, University of the Sunshine Coast, Locked Bag 4, Maroochydore DC, QLD 4558, Australia
3
Division of Forest Science, Kangwon National University, Chuncheon 24341, Korea
*
Authors to whom correspondence should be addressed.
Forests 2021, 12(6), 742; https://doi.org/10.3390/f12060742
Submission received: 10 May 2021 / Revised: 1 June 2021 / Accepted: 2 June 2021 / Published: 4 June 2021
(This article belongs to the Special Issue Carbon Stock and Sequestration in Forest Ecosystems)

Abstract

:
Under the Korean Emission Trading System in The Forestry Sector (KETSF) initiative, the Korean government has developed several greenhouse gas (GHG) emissions reduction programs that include forestry activities as cornerstones of the initiative. Forest management is deemed to be a major strategy to implement KETSF; this has been confirmed by most participants in the program, who have shown their preference for forest management projects as the most effective and encouraging strategy to participate in the KETSF program. For a successful implementation of KETSF projects, it is essential to explore methods that optimize the positive impacts of such strategies, thereby maximizing the economic returns and carbon stocks that result from the implementation of forest management activities. Thus, this study investigated the economic returns of several KETSF projects in Korea, which included simulated scenarios under two main forest management strategies, one based on an extension of the rotation age, and a second one based on reforestation with new species. Five forest management scenarios were examined and evaluated in their ability to maximize carbon stocks and economic returns. Based on the results, two scenarios were identified as the best KETSF projects in terms of carbon stock increments. Additionally, the results indicated that projects including reforestation with new species added more economic value than projects that considered an extension of the rotation age. The study also revealed that KETSF projects generated revenue in both scenarios, by either extending the rotation age or by implementing reforestation with new species.

1. Introduction

In 1992, the leaders of 172 countries gathered at the Earth Summit in Rio de Janeiro to discuss environmental issues related to climate change. The United Nations Framework Convention on Climate Change (UNFCCC) was adopted to reduce greenhouse gas (GHG) emissions and prevent climate change environmental issues. However, at the first conference of the UNFCCC Parties [1] in 1995, it was concluded that voluntary commitments were inappropriate and would not satisfy the expectations of most developed countries [2]. Two years later, the Kyoto Protocol was adopted but the agreement has led to conflicts regarding common and differentiated responsibilities within the parties [3,4]. In 2015, the Paris Agreement was penned to commemorate 20 years of the conference of the parties [1] and drew all nations to a common cause to undertake efforts to reduce GHG. All UNFCCC members signed the agreement in February 2020, and 189 countries became associated parties.
The United Nations suggests that forest management activities, including tree planting or reducing deforestation, is equivalent to reducing emissions from burning fossil fuels [5]. Internationally, forest and land management have been considered key strategies to mitigate GHG and combat climate change [6,7,8,9,10,11]. Winjum et al. [12] presented a study showing that expanding forest management has a high potential to increase carbon sequestration. The role of forests in GHG mitigation has also been investigated over the past decades by several authors [13,14,15,16]. Among the category of carbon offsets, forestry activities have been highlighted as primary strategies to reduce carbon emissions and increase the storage of carbon dioxide (CO2). Forestry activities, including afforestation, reforestation, and forest management, have been indicated as preferred strategies to mitigate GHG emissions. According to a GHG mitigation report published in the United States [17], forestry activities are able to reduce a significant amount of GHG at prices as low as USD 5 per tonne of CO2 equivalent. Additionally, Article 5 of the Paris Agreement is primarily dedicated to forests and land use as the main options for reducing forest-related emissions in developing countries [18]. Most of the parties of the Paris Agreement have developed several forest carbon offset projects and methods to mitigate GHG emissions, including strategies such as improved forest management, payments for ecosystem services (PES), and market building for ecosystem services (MES) [19,20].
As a member country of the Paris Agreement, Korea, has submitted pledges to reduce carbon emissions over the next 10 to 15 years. To reduce GHG emissions, Korea set a specific target of 37% reduction compared to the 2030 Business as Usual (BAU), of which 4.5% was planned to be achieved [21]. To reach this goal, the Ministry of Environment (MOE) [22] of Korea announced amendments to the Enforcement Decree of the Act on the Allocation and Trading of Greenhouse Gas Emissions Allowances. The MOE developed 255 offset program methodologies, including 211 clean development mechanism methodologies and 34 domestic methodologies to mitigate GHG emissions [23,24,25,26,27,28]. Seven strategies were proposed as domestic methodologies for offset projects under the Korea Emission Trading System in The Forestry Sector (KETSF) [29]; these included (1) afforestation and reforestation, (2) extension of the rotation age, (3) vegetation restoration, (4) use of wood products, (5) utilization of forest biomass energy, (6) reforestation with new species, and (7) reforestation in areas affected by fires and pests [27]. Among the KETSF strategies, forest management projects that included an extension of the rotation age and reforestation with new species received the greatest support from the participants in the KETSF initiative [23]. According to the registration status of forest carbon offset scheme projects, 51% of the KETSF projects proposed an extension of the rotation age or reforestation with new species projects [23].
Despite some previous research that has investigated the mitigating effects of KETSF projects [10,21,24,29,30], there are a number of perceived administrative and economic challenges and issues that continue to act as barriers to participating in carbon offset projects. One issue, for example, is the postponement of timber harvesting due to the extension of forest stands rotation age. According to Birdsey [31], the cost of the different forest strategies is a significant factor to be taken into consideration when deciding which forest activities program to pursue. In that sense, the results of preliminary analyses have provided valuable information to landowners and managers as to the convenience of extending the final rotation age or reforesting with new species.
Considering the above context, this research investigated several value-added KETSF projects with a focus on forest management strategies. Expected carbon stocks were estimated for strategies that included both an extension of the rotation age and reforestation with new species methods. The total revenue of the projects was compared among the scenarios to identify the KETSF methods that maximized value in Korea. It is anticipated that this research will contribute to providing valuable information on value-added KETSF scenarios to forest owners and managers who have interest in participating in the KETSF initiative.

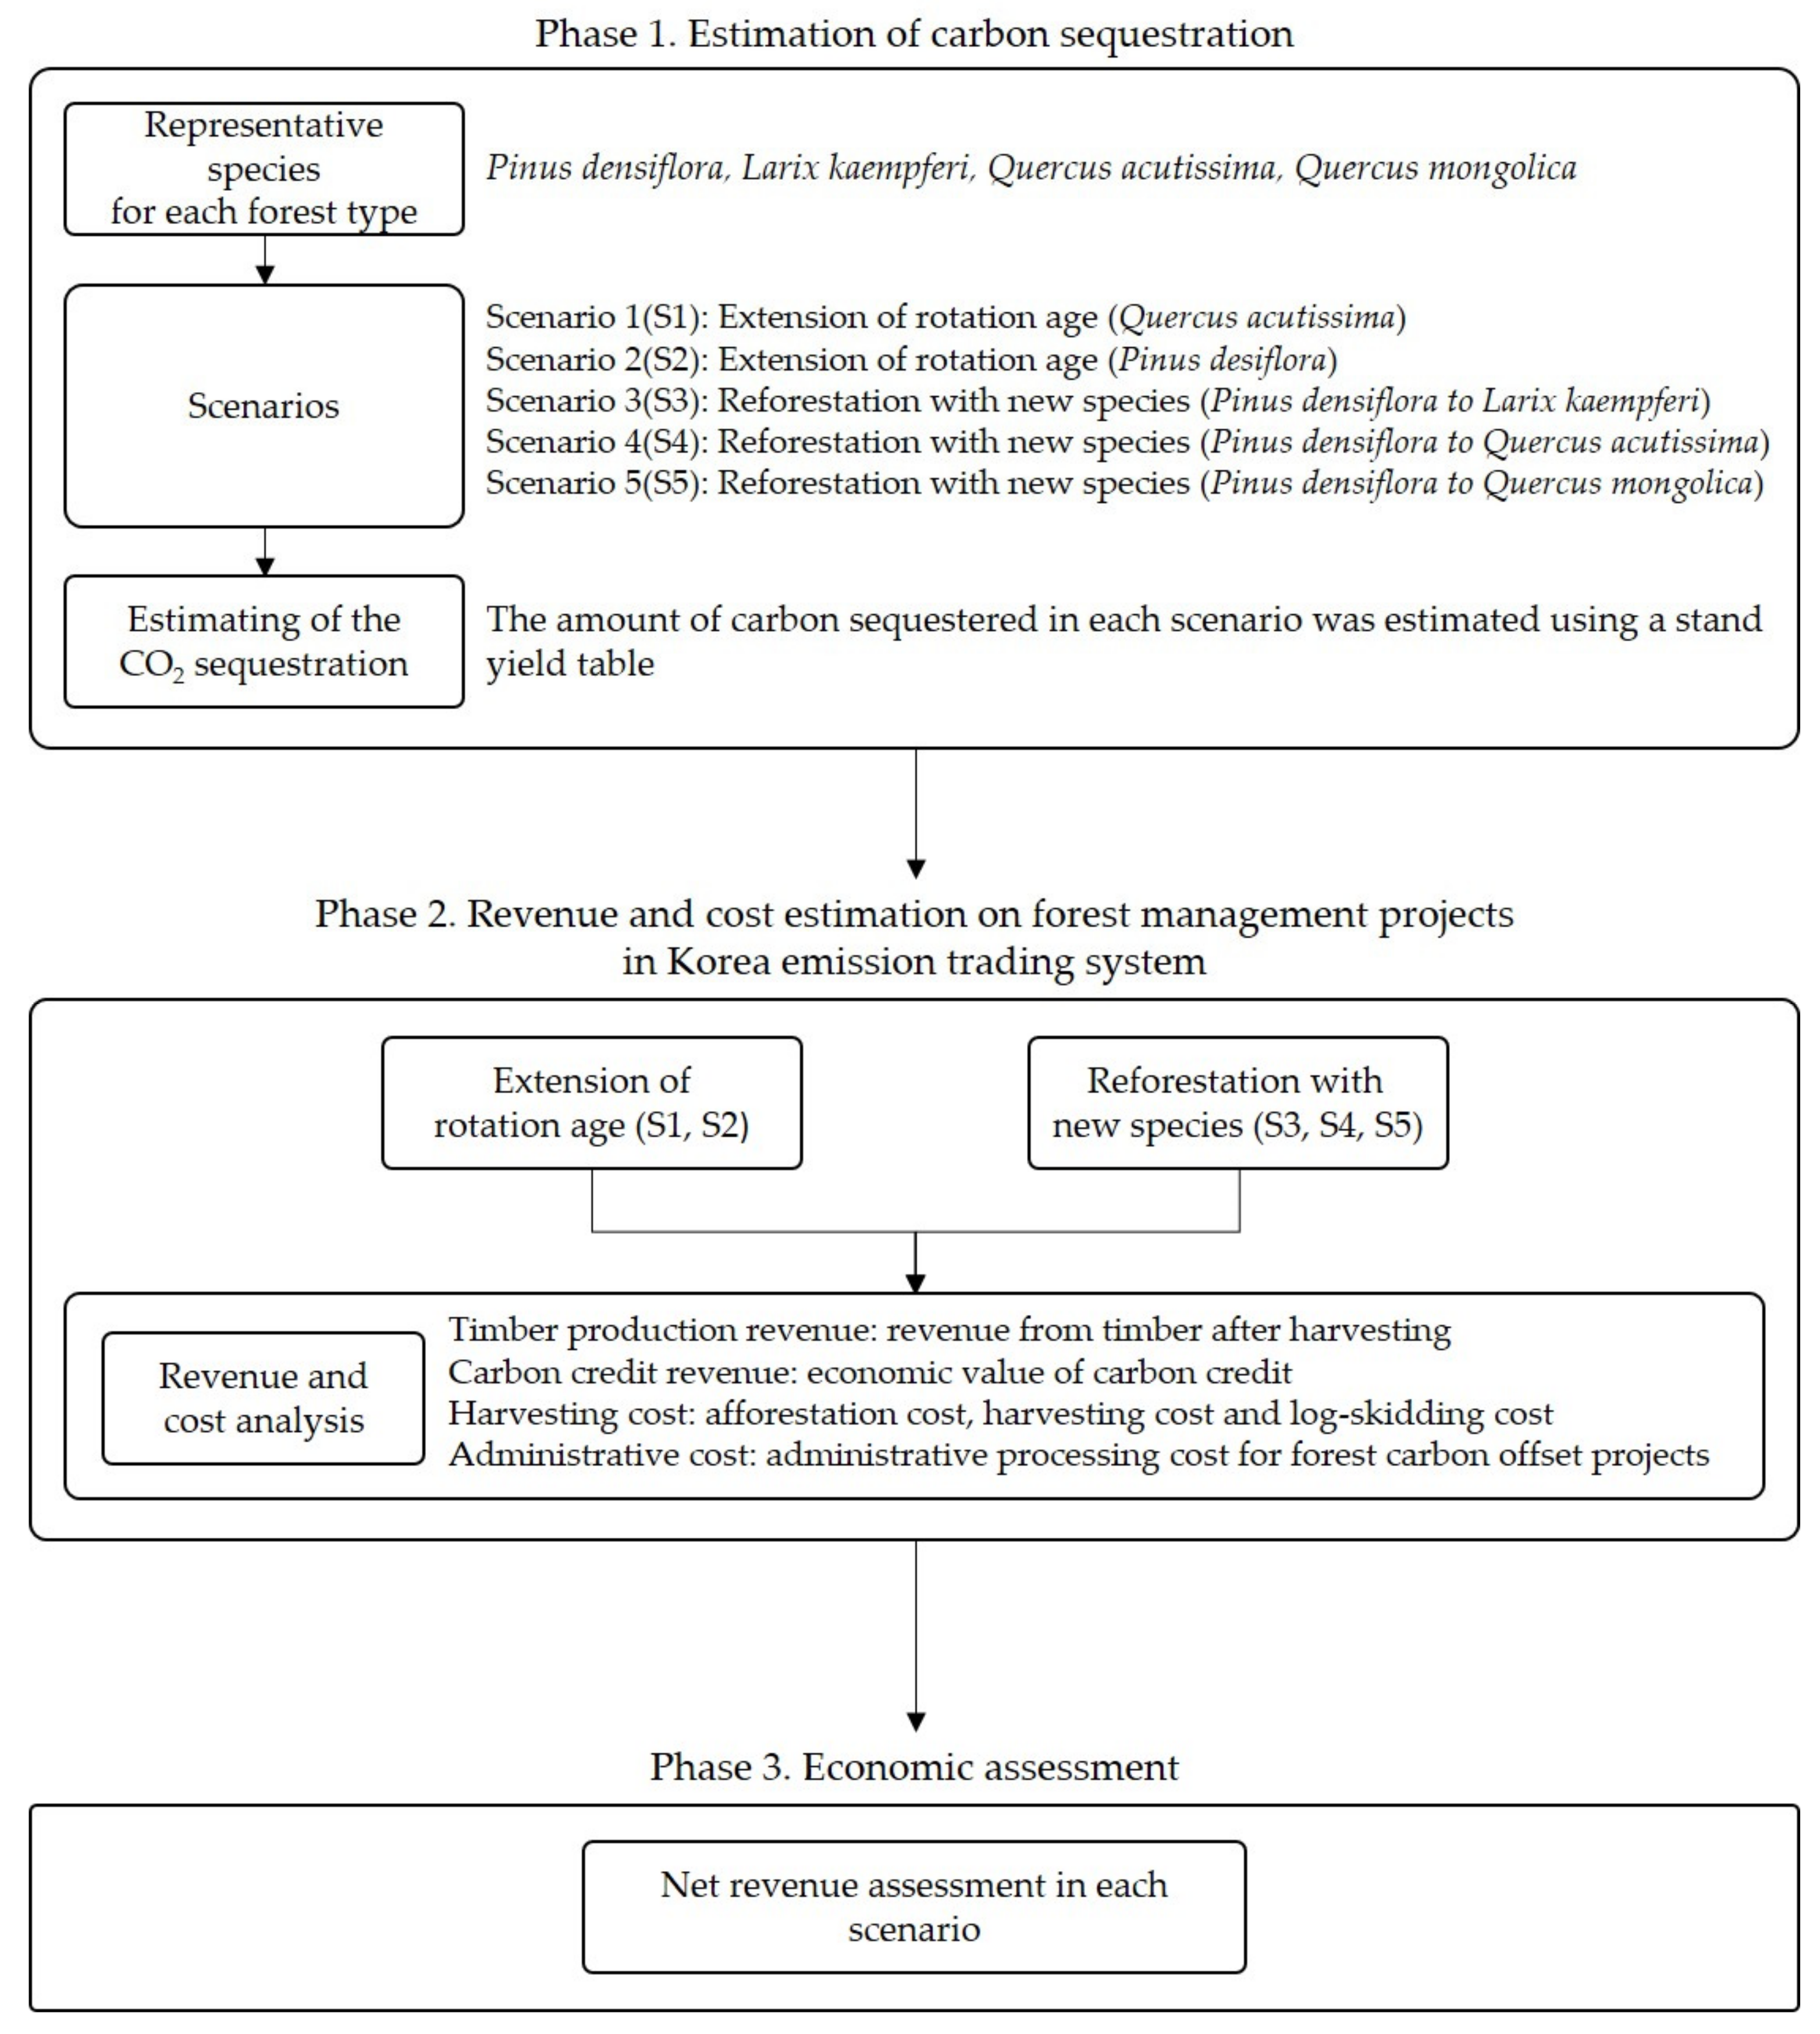
2. Materials and Methods

The flowchart of the overall methodological approach used in this research is presented in Figure 1. The approach comprised three phases. The first phase involved the estimation of carbon sequestration under the five forest activities scenarios. A detailed description of the factors included in the scenarios is presented in Table 1; they were classified into two major categories (“extension of the rotation age” or “reforestation with new species”) according to the type of KETSF project.
The amount of carbon sequestered in each scenario was estimated using a stand yield table for the major species present in Korean forests, including Pinus densiflora, Larix kaempferi, Quercus acutissima and Quercus mongolica. Figure 2 presents the distribution of the major species in private forests of Korea. The private forest land embraces an area of 797,678 ha, out of which 73% of the area (579,266 ha) is covered by Pinus densiflora and 13% (101,874 ha) is covered with Larix kaempferi. Additionally, Quercus acutissima and Quercus mongolica species only accounted for 5% and 9% within major species distribution of private forests in Korea, respectively.
The stand yield table was developed by the National Institute of Forest Science as part of the Korean offset program development process based on guidelines provided by IPCC [32,33,34]. The description of the modeling methodology to develop the stand yield table has been described previously in [33,34].
To establish the baseline for the “extension of the rotation age” and “reforestation with new species” strategies, different approaches and assumptions were used. The baseline set in our study adopted a method that considers emission levels from guidelines provided by KETSF as a reference [24,25]. The second step involved estimating revenue from timber production and the economic value of carbon credits based on market prices; figures from reports published for domestic timber products in Korea (2019) as well as CO2 European Emission Allowances (2020) were used for that purpose [35,36]. The final step of the economic assessment involved an investigation into value-added KETSF projects in Korea. The cost of each scenario was analyzed based on data published in guidelines for sustainable forest resources management [37] and guidelines for implementing and supervising forest thinning [38]. In exploring value-added scenarios among the KETSF projects, a series of economic assessments were performed to compare their revenue; this simulation modeling quantified the total revenue and cost in each scenario. A detailed description of the methodologies used in the study is provided in the following sections.

2.1. Estimation of Carbon Sequestration

2.1.1. Baseline Scenario

Carbon baselines were set up as reference points against which net changes in carbon stocks were measured and compared so that credits resulting from a reduction in GHG emissions could be issued [39,40]. In the category “extension of the rotation age”, carbon baseline emissions for the target species were calculated through Korean standard forestry biometric methods (Equation (1)). Carbon baselines were calculated for a rotation age of 25 and 40 years for Quercus acutissima and Pinus densiflora, respectively, based on the report of estimated forest volume and biomass in Korea [41]. In the case of the “reforestation with new species” category, the baseline was assumed from historical data of the original species. Fraction details and key assumptions associated with these baseline estimations are presented in Table 2.

2.1.2. Total Carbon in Woody Biomass

Carbon credits were estimated from the difference in emissions between the baseline and actual project scenarios. The additional carbon yield was estimated based on IPCC and KETSF guidelines [24,25,32,40] using Equations (1)–(3):
B = i = 1 I p = 1 P Δ C i p × 3.664
Δ C i p = p = 1 P C V i p C V i p 1 i I
C V i p = V i p   ×   B E F   ×   1   +   R R   ×   W D   ×   C F i I ,   p P
where:
I = set of forest stands (iI);
P = set of assessment periods (pP);
B = total carbon in woody biomass, including all the assessment stands and periods (t CO2-eq);
Δ C i p = total carbon stock change in stand i and period p (the sum of above-ground and below-ground biomass terms in Equation (3)) (t C);
C V i p = total carbon in stand i and period p (t C);
V i p = merchantable growing stock (trunk volume) volume in stand i and period p (m3);
BEF = biomass expansion factor for the expansion of merchantable growing stock volume to above-ground biomass;
RR = ratio of below-ground biomass to above-ground biomass, in tonne dry matter below-ground biomass (tonne d.m. above-ground biomass)−1;
WD = basic wood density (t m−3);
CF = carbon fraction of dry matter, tonnes C (dry matter tonne)−1;
3.664 = factor from carbon dioxide to carbon (e.g., 1 CO2 = 3.664 × C).

2.1.3. Carbon Loss and Leakage during the Project Periods

Carbon loss is defined as the total decrease in carbon stocks due to the implementation of the projects; it includes tending operations, GHG emissions from harvesting equipment, and biomass removal [39]. Carbon loss PE (t CO2-eq) was assumed to be 5% of the total CO2 absorbed and stored in the woody biomass, including all the assessment periods (B) based on KETSF guidelines [24]. On the other hand, carbon leakage is defined as the impact that the project might have on sequestered carbon (increase or decrease) that occurs outside the boundaries of the project [39]. Carbon leakage LE (t CO2-eq) is difficult to measure and for the purpose of this study, it was assumed to be 2% of the total CO2 absorbed and stored in the woody biomass in all the assessment periods (B) based on KETSF guidelines [24].

2.1.4. Net Change in CO2 Absorption

The net change in CO2 absorption is defined as the net increment of carbon that results from the implementation of the carbon offset project during the project period. The applied net change in carbon absorption was calculated using Equation (4):
B S = B R P E L E
where:
BS = net change in CO2 absorption, including all the assessment periods (t CO2-eq);
B = total CO2 absorption of woody biomass, including all the assessment periods (t CO2-eq);
R = baseline CO2 absorption in woody biomass (specific species), including all the assessment periods (t CO2-eq);
PE = CO2 loss, including all the assessment periods (tCO2-eq);
LE = CO2 leakage, including all the assessment periods (tCO2-eq).

2.2. Revenue and Cost Estimation in Forest Management Projects under Korea’s Emission Trading System

2.2.1. Revenue from Timber Production and Carbon Increment

Total revenue for the different forest management projects was divided into two categories, revenue from timber products and revenue from carbon credits in the global market for CO2 emissions based on EU-ETS. Timber and by-products from harvesting and thinning operations were estimated using actual Korean prices in the domestic timber market as well as data included in the report of forest GHG inventory and stand yield table for the major species in Korea [33,36]. The forest GHG inventory and stand yield table of major species in Korea provide information on species, site index, age, diameter at breast height, basal area, tree height, stand density, volume (m3 ha−1), and annual growth rate (m3 ha−1 year−1). Furthermore, the price of timber products (USD m−3) was obtained using data from the Korean report of domestic timber market prices, which provides information about prices for different tree species and DBH classes. Thus, the final value associated with timber production was calculated by combining data from yield tables and reports of timber products. In addition, the average carbon trading cost from EU-ETS in 2019 (USD 25.91) was used to estimate the value associated with carbon increments in KETSF projects [35].

2.2.2. Total Cost of KETSF Projects

The total cost of each KETSF project was calculated from both the transactional costs associated with carbon offset projects and the costs associated with forest management. The transactional costs included administrative, project developing, monitoring, and project certification costs [26]. The costs associated with forest management also included reforestation, tending operation, harvesting, and primary transportation costs. They were based on guidelines for sustainable forest resources management as well as actual cost figures associated with the implementation and supervision of forest tending activities [37,38]. To calculate the net present value of the total cost, a 1.25% interest rate was assumed based on the base rate of the Bank of Korea in 2019.
The costs associated with forest management considered the number of planting trees, as well type of forest tending and harvesting operations following guidelines for sustainable forest resources management in Korea [37]. These costs included material and labor costs, and other expenses such as equipment and machine maintenance costs associated with reforestation and harvesting activities. In the case of harvesting, cable yarding was assumed to be the primary transportation operation to extract the logs from the stump to roadside since this represents the most common harvesting method in Korea. Additionally, the average extraction distance was limited to 100 meters based on the distance capacity of the HAM 200 cable yarding machine. All the values and standards to calculate the overall costs were obtained from guidelines provided by the Korean Forest Service Government [37,38].

2.3. Net Revenue of Forest Management Projects under the Korea Emission Trading Scheme in the Forest Sector

2.3.1. Scenarios Including an Extension of the Rotation Age

The projects that included an extension of the rotation age were simulated for two major Korean species, Pinus densiflora and Quercus acutissima. An extension of the rotation age was assumed for forest carbon offset projects that consider forest management beyond the rotation age assumed in the baseline. Carbon baselines were calculated for a rotation age of 25 years in the case of Quercus acutissima and 40 years in the case of Pinus densiflora, based on the report of estimated forest volume and biomass in Korea [41]. In Scenario 1 (S1), it was assumed that the forest stand of Pinus densiflora was managed for 60 extra years (until year 100) over the regulated age of 40 years. Thus, the carbon increment of the carbon offset project was only computed between years 41 to 100. Likewise, in Scenario 2 (S2), it was assumed that the harvesting age of Quercus acutissima was postponed until year 100, with a forest management period that exceeded by 75 years the original regulated age of 25 years. In this scenario, the carbon increment of the carbon offset project was only computed between years 26 and 100. Lastly, the baseline for scenarios involving an extension of the rotation age was determined through standard forestry biometric methods used in Korea assuming the rotation age of the target species.

2.3.2. Scenarios Including Reforestation with New Species

For projects involving reforestation with new species, it was assumed that the forest stands regenerated from Pinus densiflora to Larix kaempferi, Quercus acutissima and Quercus mongolica species so as to enhance carbon sequestration. A harvesting rotation age of 40 years was assumed for the original stands of Pinus densiflora, followed by reforestation with new species (Larix kaempferi in Scenario 3 (S3), Quercus acutissima in Scenario 4 (S4), and Quercus mongolica in Scenario 5 (S5)) for the remaining period of the carbon offset project. The carbon increment resulting from the change in species was quantified in S3 (Pinus denisflora replaced by Larix kaempferi), S4 (Pinus densiflora replaced by Quercus acutissima), and S5 (Pinus densiflora rapleced by Quercus mongolica). The baseline scenario in projects involving reforestation with new species was established using historical data of the original species.

3. Results and Discussions

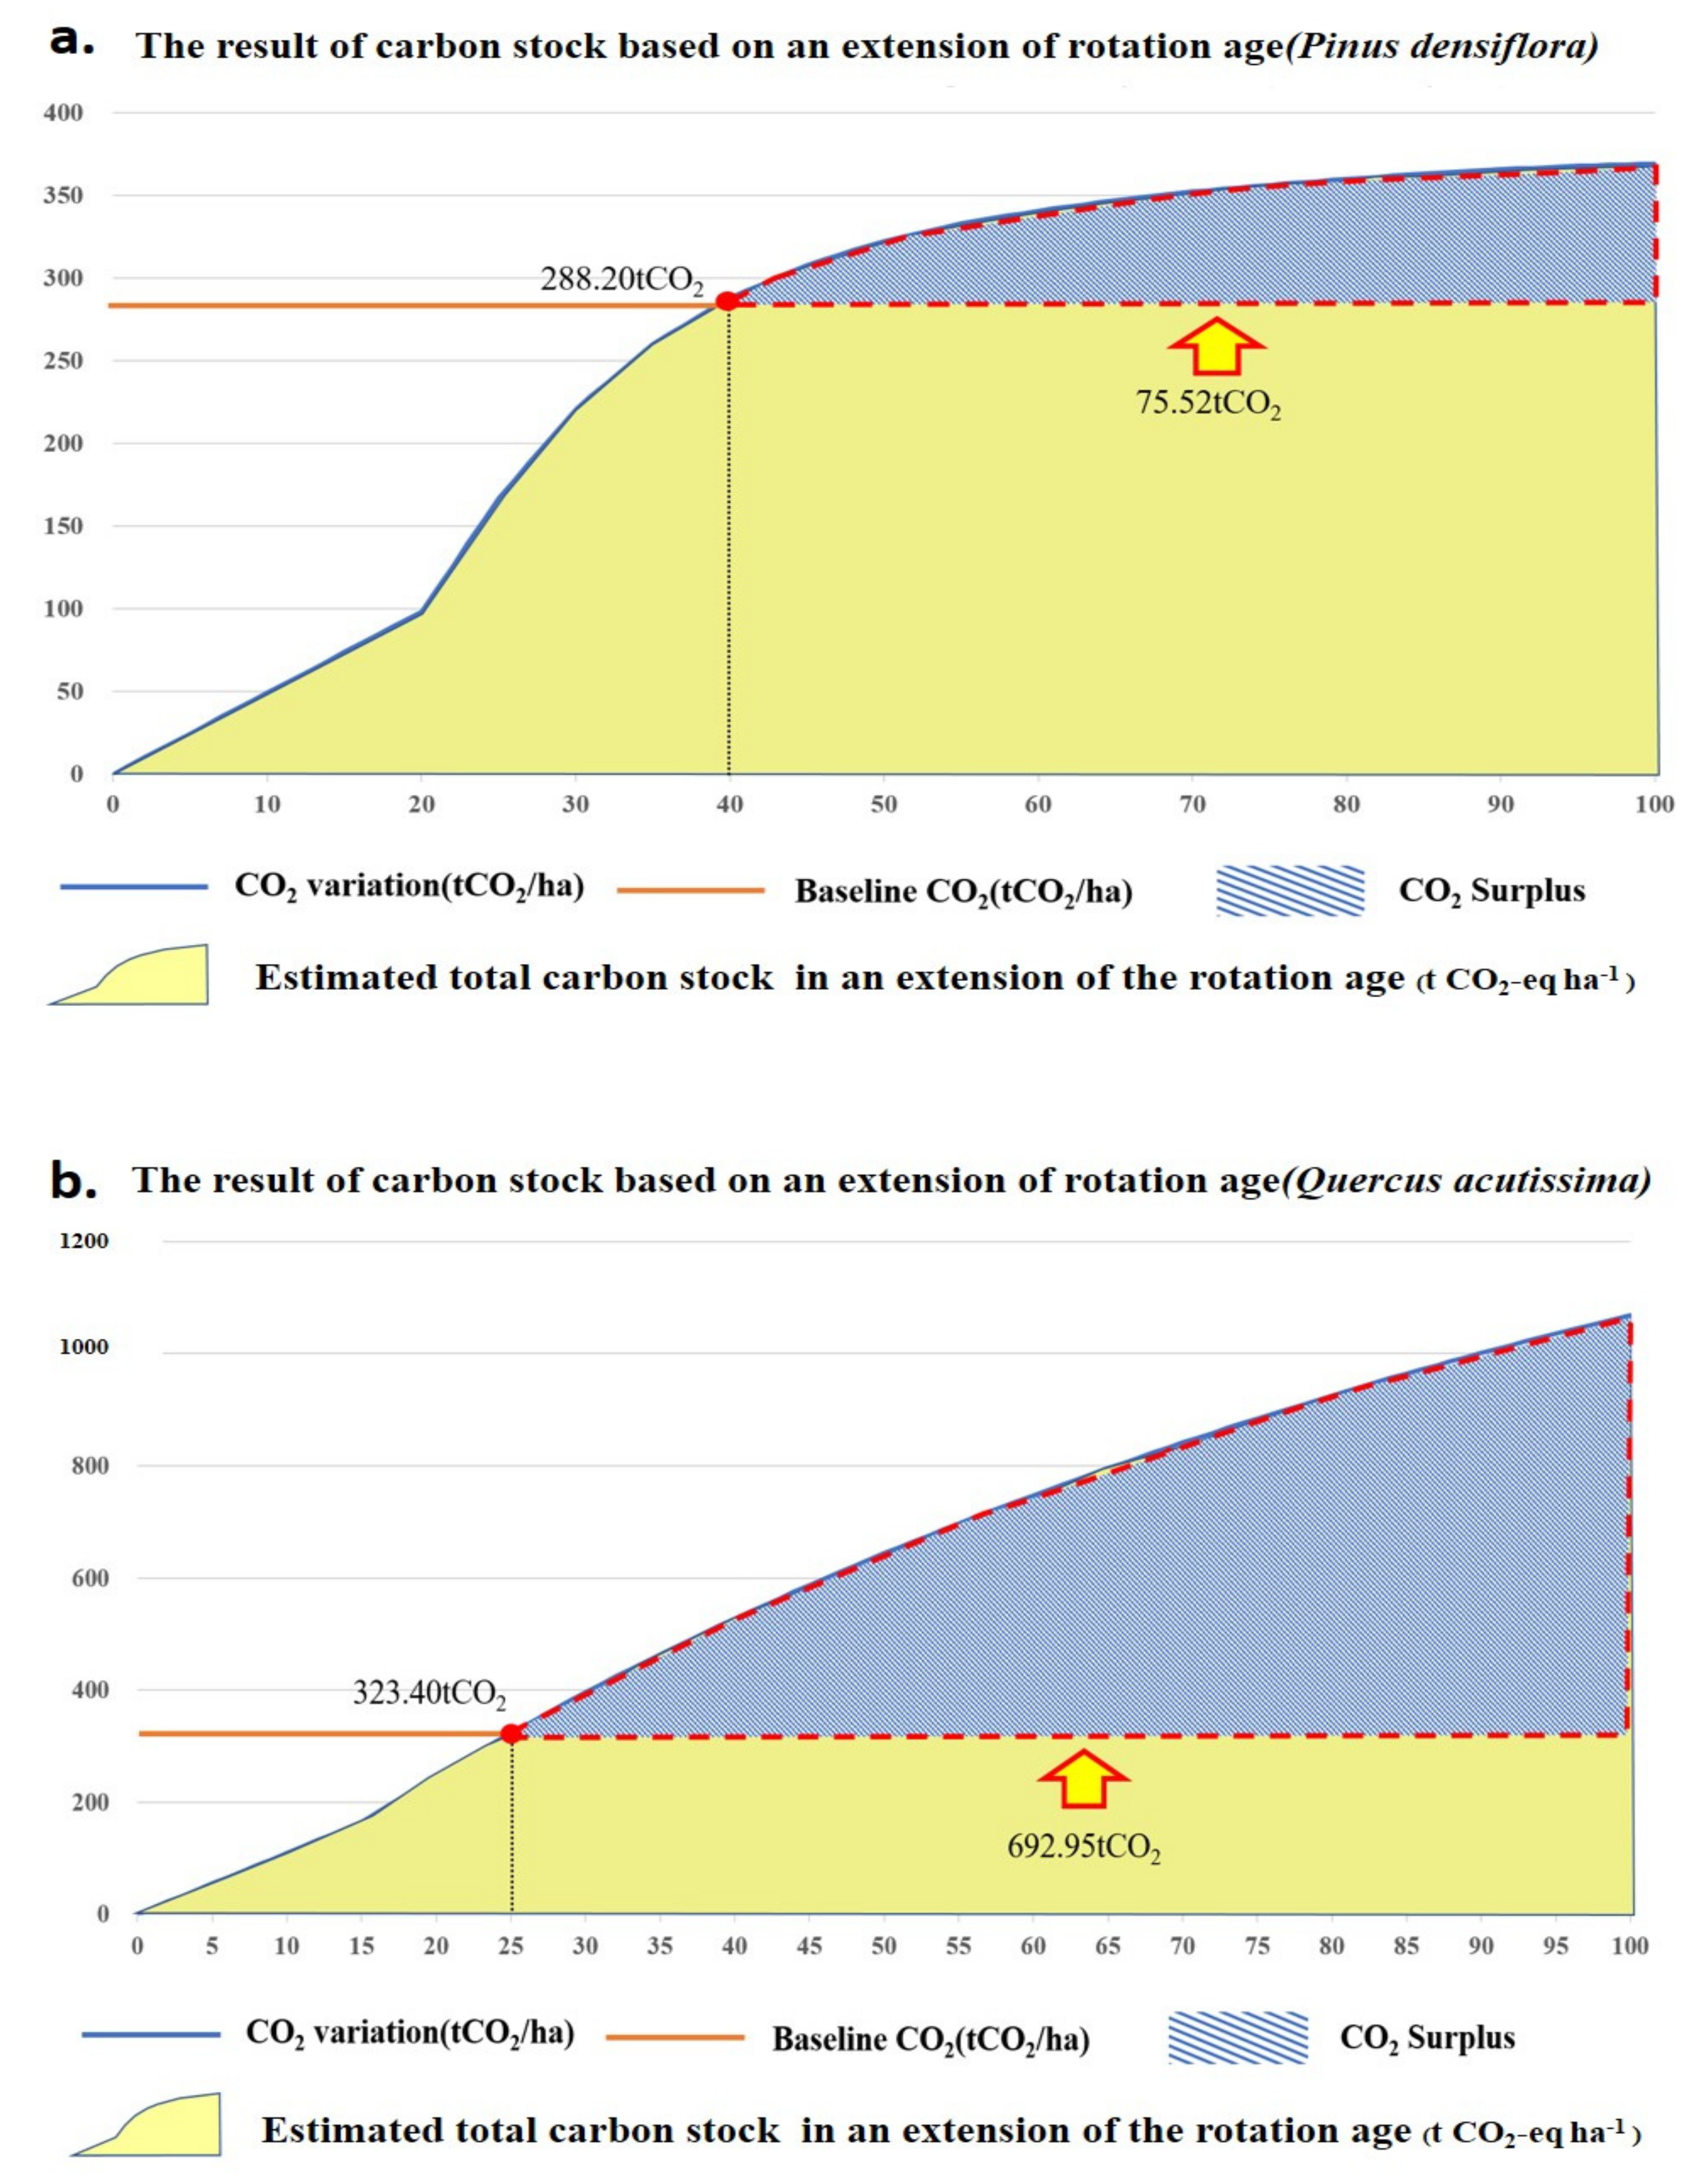
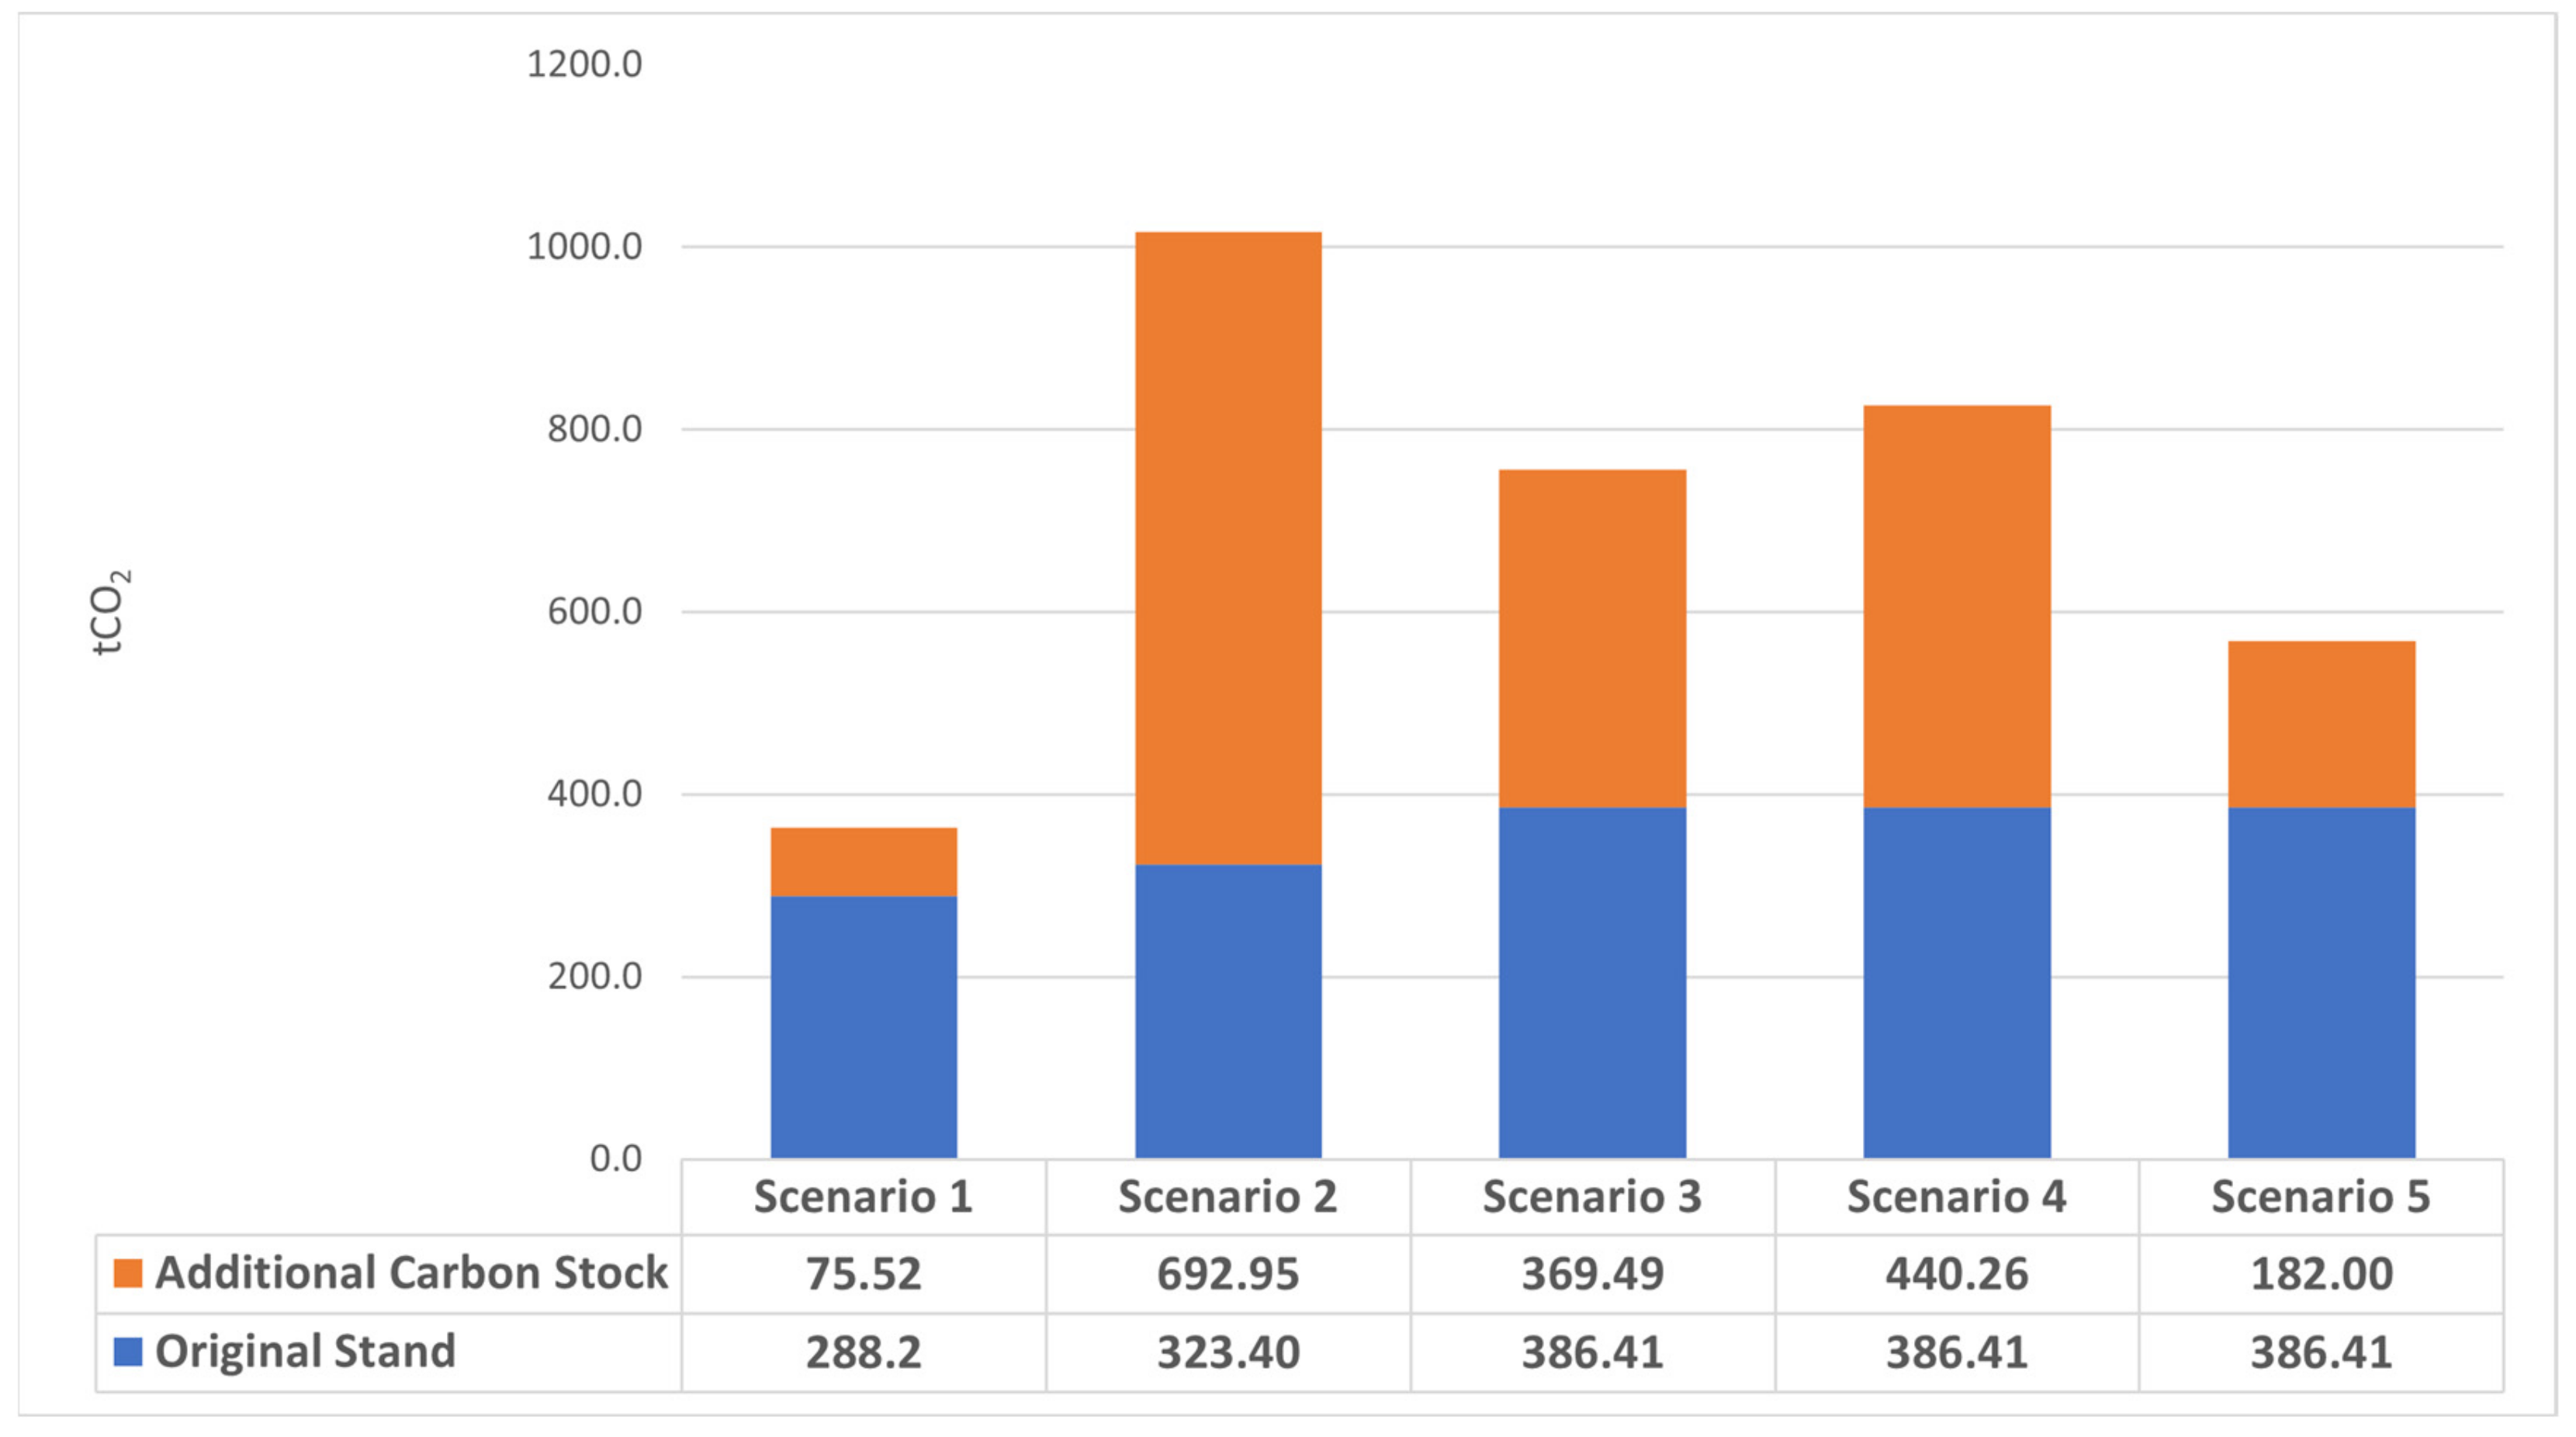
3.1. Carbon Sequestration under the Five Forest Scenarios

Figure 3 presents the results of the simulation conducted on scenarios that included an extension of the rotation age; the simulation provided estimates of net change carbon stocks in KETSF, forest management projects, as well as timber production volumes and additional revenues associated with the execution of the projects. The results show that S2 (Quercus acutissima) has a greater net change in carbon stock (692.95 t CO2-eq ha−1) than S1 (Pinus densiflora) (75.52 t CO2-eq ha−1).
Additionally, the available timber production was much higher in S2 (424.9 m3 ha−1) than in S1 (241.1 m3 ha−1). Based on these estimates, scenarios that included an extension of the rotation age for Quercus acutissima showed a higher performance compared to Pinus densiflora when conducting a KETSF forest management project (Table 3).
Carbon increments in projects involving reforestation with new species are presented in Figure 4. The baseline for the scenarios that included reforestation with new species was estimated in 386.41 t CO2-eq ha−1, assuming that the original stand was occupied by Pinus densiflora. In these scenarios, carbon loss and carbon leakage were not included as sources of GHG emissions since forest thinning and tending operations are considered as regular forest management practices [25]. The estimates showed that reforestation with Quercus mongolica (S4) resulted in the highest net change in carbon stocks (440.26 t CO2-eq ha−1) among the three scenarios. Secondly, reforestation with Quercus acutissima represented the second most effective carbon offset strategy (369.49 t CO2-eq ha−1). The results indicate that within the major Korean species, Larix kaempferi (softwood species) has a lower capacity to capture carbon in comparison with Quercus mongolica and Quercus acutissima (hardwood species) (Table 4). This study also revealed that extending the rotation age of Quercus acutissima (S2) and regenerating with hardwood species (S3 and S4) are the best options to increase carbon stocks when implementing KETSF projects. As for timber production, reforestation with Larix kaempferi (S5) produced the largest amount of timber (585.5 m3) compared to hardwood species (S3 and S4). Based on these results, S2 and S4 represent the most effective KETSF projects aiming at increasing carbon stocks. Additionally, the reforestation with new species scenarios resulted in more timber production compared to scenarios including an extension of the rotation age (Figure 4).

3.2. Revenue of KETSF Projects

The revenue estimates in KETSF projects are presented in Table 5. The sources of revenue associated with the projects included timber production and carbon credits. The revenue from timber production indicated that the reforestation with new species is a more profitable strategy than extending the rotation age. The results also reveal that the number of harvesting activities is a critical factor to increase timber production and revenue in KETSF projects. Reforestation with new species involves multiple timber harvesting interventions and more timber production than scenarios that include an extension of the rotation age, which only consider a single harvest. In projects that included reforestation with new species, S5 (Pinus densiflora to Larix kaempferi) was the scenario with the highest revenue from timber production (USD 34,017), while S3 (Pinus densiflora to Quercus acutissima) was the second most profitable option (USD 25,757) among the scenarios. In the Korean timber market, prices are determined by diameter class. The estimated timber volume in S4 (Pinus densiflora to Quercus mongolica) exceeded that of S3, even though the estimated diameter of Quercus acutissima was much larger than that of Quercus mongolica based on volume estimates for the same age class. This resulted in S3 being a more profitable option than S4. Furthermore, in projects that included an extension of the rotation age, the estimated timber production in S2 (Quercus acutissima) (424.9 m3 ha−1) was approximately twice that the one obtained in S1 (Pinus densiflora) (241.1 m3 ha−1). However, the revenue from timber production in S1 and S2 was similar due to the high price of Pinus densiflora in the Korean timber market.
The estimated revenues from increased carbon stocks are presented in Table 5. The estimated carbon revenue confirmed that an extension of the rotation age in Quercus acutissima (S2) resulted in the highest revenue (USD 10,477) among the five scenarios analyzed in the study. Projects that included reforestation with new species Quercus acutissima (S3) and Quercus mongolica (S4) resulted in the second and third most profitable projects regarding carbon revenue, respectively. Thus, hardwood species generated more carbon revenue than softwood species.
Lastly, scenarios that included reforestation with new species (S3, S4, and S5) were more profitable (more revenue from timber and carbon combined) as compared to scenarios that included an extension of the rotation age (S1 and S2). The results indicate that KETSF projects generated revenue in scenarios that either involved an extension of the rotation age or reforestation with new species (Table 5). The single most profitable scenario was S5, which included regeneration with new species (Pinus densiflora to Larix kaempferi). This scenario resulted in the highest total revenue as well as revenue from timber, while S2 (extension of the rotation age with Quercus acutissima species) was the scenario that generated more revenue from carbon stocks.

3.3. Estimated Costs of KETSF Projects

Extending the rotation age of Quercus acutissima (S2) was found to be more expensive than extending the rotation age of Pinus densiflora (S1) (Table 6). The difference between the two scenarios was due to the associated forest management and transactional costs. Regarding forest management costs, the estimation methods were based on timber production, which was higher in S2. Additionally, the shorter rotation age in S2 required more monitoring activities, which also increased the transactional costs of S2 in comparison to S1.
Cost estimates in scenarios that included reforestation with new species are also presented in Table 6. The transactional costs in these scenarios were estimated to be USD 2554. Regarding forest management costs, harvesting costs at the end of the rotation age resulted in the cost component with the largest differences among the scenarios that included reforestation with new species (S3, S4, and S5). The number of harvesting interventions is associated with higher forest management costs and represents a critical cost factor to be accounted for when implementing projects that include reforestation with new species projects.

3.4. Net Revenue of KETSF Projects

Net revenue associated with projects that included an extension of the rotation age of Quercus acutissima was the highest (USD 15,661.90) among the five KETSF scenarios evaluated. Reforestation with new species (Pinus densiflora to Larix kaempferi) (S5) resulted in the second most profitable scenario, with a net revenue that totaled USD 14,813.50. Even though the revenue of timber production was much higher in S5 than in S2, forest management costs in S5 were three times higher than S2. Thus, S2 resulted to be the most profitable scenario (Table 7).
Revenue estimates were higher in S1 than S3 and S4. Although revenues from timber production in S3 and S4 were approximately twice that in S1, the larger number of harvesting interventions in S3 and S4 resulted in a substantial increase in forest management costs.
Despite the high revenue resulting from projects that included reforestation with new species, the results indicated that the economic return of KETSF projects are sensitive to forest management costs. Based on the study results, KETSF projects that include hardwood species had a better performance from a carbon sequestration perspective. However, a correct economic assessment also requires considering the costs involved in implementing the KETSF projects.

4. Conclusions

This research investigated value-added KETSF forest management projects. Five forest management scenarios were examined and evaluated to identify the most effective KETSF projects from a carbon and economic perspective.
Carbon estimates for scenarios that included an extension of the rotation age showed that S2 (Quercus acutissima) resulted in a greater net change in carbon stock and timber production in comparison to S1 (Pinus densiflora). In scenarios that included reforestation with new species, reforestation with Quercus mongolica (S4) resulted in the highest net change in carbon stocks among all scenarios. Based on the results of net change in carbon stocks, the study revealed that the extension of the rotation age of Quercus acutissima (S2) and regeneration with hardwood species (S3 and S4) achieved the greatest net change in carbon stocks when implementing KETSF projects. As for timber production, reforestation with Larix kaempferi (S5) produced the highest volume of timber among the scenarios that included reforestation with new species. Based on the results, S2 and S4 resulted in the most effective KETSF projects from a carbon increment perspective.
Secondly, revenues were quantified to identify the most value-added KETSF project from an economic perspective. The results indicated that the scenarios that included reforestation with new species scenarios (S3, S4, and S5) resulted in better economic returns than scenarios that included an extension of the rotation age (S1 and S2). In addition, the study revealed that KETSF projects created revenue both in scenarios that included an extension of the rotation age and scenarios that included reforestation with new species. From a revenue perspective, the most profitable project included reforestation with Larix kaempferi (S5). However, S2, which included an extension of the rotation age with Quercus acutissima species, achieved the highest revenue.
From a cost perspective, scenarios that included an extension of the rotation age were less expensive than scenarios that included reforestation with new species. Moreover, the number of harvesting interventions increased forest management costs both in scenarios that included an extension of the rotation age and scenarios that included reforestation with new species. This revealed that the costs associated with KETSF projects are quite sensitive to the number of harvesting interventions.
Despite the high revenue obtained in scenarios that included reforestation with new species, the study revealed that the assessment of KETSF projects must consider the costs associated with forest management. This study also revealed that KETSF projects that included hardwood species resulted in larger carbon increments. It is anticipated that the results presented in this article will contribute to providing valuable information to decision makers and policy makers regarding effective value-added KETSF projects aiming at reducing GHG emissions in Korea.

Author Contributions

Conceptualization, J.K. and B.C.; methodology, H.W. and M.A.; software, H.W.; validation, B.C., M.A., and J.K.; formal analysis, H.W.; investigation, H.W.; resources, J.K. and B.C.; data curation, H.W.; writing—original draft preparation, H.W.; writing—review and editing, H.W., M.A., and B.C.; visualization, H.W.; supervision, M.A., B.C. and J.K.; project administration, J.K.; funding acquisition, J.K. All authors have read and agreed to the published version of the manuscript.

Funding

This study was carried out with the support of the R&D Program for Forest Science Technology (Project No.1 2018111B10-2020-BB01 and Project No.2 2019151B10-2123-0301) provided by Korea Forest Service (Korea Forestry Promotion Institute).

Conflicts of Interest

The authors declare no conflict of interest.

References

  1. Matese, A.; Toscano, P.; Di Gennaro, S.F.; Genesio, L.; Vaccari, F.P.; Primicerio, J.; Belli, C.; Zaldei, A.; Bianconi, R.; Gioli, B. Intercomparison of UAV, aircraft and satellite remote sensing platforms for precision viticulture. Remote Sens. 2015, 7, 2971–2990. [Google Scholar] [CrossRef] [Green Version]
  2. Birdsey, R.; Alig, R.; Adams, D. Mitigation activities in the forest sector to reduce emissions and enhance sinks of greenhouse gases. In The Impact of Climate Change on America’s Forests: A Technical Document Supporting the 2000 USDA Forest Service RPA Assessment; Gen. Tech. Rep. RMRS-GTR-59; Joyce, L.A., Birdsey, R., Eds.; US Department of Agriculture, Forest Service, Rocky Mountain Research Station: Fort Collins, CO, USA, 2000; Voluem 59, pp. 112–128. [Google Scholar]
  3. Ekardt, F.; von Hövel, A. Distributive Justice, Competitiveness, and Transnational Climate Protection: “One Human—One Emission Right”. Carbon Clim. Law Rev. 2009, 3, 102–113. [Google Scholar] [CrossRef]
  4. Oberthür, S.; Ott, H.E. The Kyoto Protocol: International Climate Policy for the 21st Century; Springer Science & Business Media: Berlin/Heidelberg, Germany, 1999. [Google Scholar]
  5. Brack, D. Forests and Climate Change. In Proceedings of Background Study Prepared for the Fourteenth Session of the United Nations Forum on Forests; United Nations Forum on Forests: New York, NY, USA, 2019. [Google Scholar]
  6. United States Congress Office of Technology Assessment. Changing by Degrees: Steps to Reduce Greenhouse Gases; US Government Printing Office: Washington, DC, USA, 1991; Volume 91.
  7. National Academy of Sciences Staff. Policy Implications of Greenhouse Warming: Mitigation, Adaptation, and the Science Base; National Academy Press: Washington, DC, USA, 1992. [Google Scholar]
  8. Intergovernmental Panel on Climate Change. Climate Change: The IPCC Response Strategies; Island Press: Washington, DC, USA, 1990. [Google Scholar]
  9. Nilsson, S.; Schopfhauser, W. The carbon-sequestration potential of a global afforestation program. Clim. Chang. 1995, 30, 267–293. [Google Scholar] [CrossRef]
  10. Winjum, J.K.; Dixon, R.K.; Schroeder, P.E. Forest management and carbon storage: An analysis of 12 key forest nations. Water Air Soil Pollut. 1993, 70, 239–257. [Google Scholar] [CrossRef]
  11. Kolchugina, T.P.; Vinson, T.S. Carbon sources and sinks in forest biomes of the former Soviet Union. Glob. Biogeochem. Cycles 1993, 7, 291–304. [Google Scholar] [CrossRef]
  12. Winjum, J.K.; Dixon, R.K.; Schroeder, P.E. Estimating the global potential of forest and agroforest management practices to sequester carbon. Water Air Soil Pollut. 1992, 64, 213–227. [Google Scholar] [CrossRef]
  13. Sedjo, R.A. Forests. Environ. Sci. Policy Sustain. Dev. 1989, 31, 14–20. [Google Scholar] [CrossRef]
  14. Richards, K.R.; Stokes, C. A review of forest carbon sequestration cost studies: A dozen years of research. Clim. Chang. 2004, 63, 1–48. [Google Scholar] [CrossRef]
  15. Galik, C.S.; Cooley, D.M.; Baker, J.S. Analysis of the production and transaction costs of forest carbon offset projects in the USA. J. Environ. Manag. 2012, 112, 128–136. [Google Scholar] [CrossRef] [PubMed]
  16. Law, B.E.; Hudiburg, T.W.; Berner, L.T.; Kent, J.J.; Buotte, P.C.; Harmon, M.E. Land use strategies to mitigate climate change in carbon dense temperate forests. Proc. Natl. Acad. Sci. USA 2018, 115, 3663–3668. [Google Scholar] [CrossRef] [PubMed] [Green Version]
  17. Murray, B.; Sohngen, B.; Sommer, A.; Depro, B.; Jones, K.; McCarl, B.; Gillig, D.; DeAngelo, B.; Andrasko, K. Greenhouse Gas Mitigation Potential in US Forestry and Agriculture; Environmental Protection Agency EPA: Washington, DC, USA, 2005; Volume 430. [Google Scholar]
  18. Climate Focus. Forests and Land Use in the Paris Agreement; The Paris Agreement Summary: Paris, France, 2015. [Google Scholar]
  19. Nabuurs, G.-J.; Delacote, P.; Ellison, D.; Hanewinkel, M.; Lindner, M.; Nesbit, M.; Ollikainen, M.; Savaresi, A. A New Role for Forests and the Forest Sector in the EU Post-2020 Climate Targets; European Forest Institute: Joensuu, Finland, 2015. [Google Scholar] [CrossRef]
  20. Blanc, S.; Accastello, C.; Bianchi, E.; Lingua, F.; Vacchiano, G.; Mosso, A.; Brun, F. An integrated approach to assess carbon credit from improved forest management. J. Sustain. For. 2019, 38, 31–45. [Google Scholar] [CrossRef]
  21. Lee, S. Strategy of Forest Carbon Offset Scheme to Enhance the Chungcheong nam do Climate Change Planning; Chungnam Institute: Sejong, Korea, 2016; Volume 2015. [Google Scholar]
  22. Simões, D.; Fenner, P.T. Avaliação Técnica E Econômica Do Forwarder Na Extração De Madeira Em Povoamento De Eucalipto De Primeiro Corte. Floresta 2010, 40. [Google Scholar] [CrossRef] [Green Version]
  23. KFS. The registration Status of Forest Carbon Offset Scheme Projects; Korea Forest Service: Daejeon, Korea, 2020.
  24. KFS. The Guideline of Application of the Extension Final Age of Maturity in Forest Carbon Offset Scheme in South Korea Ver 1.0; Korea Forest Service: Daejeon, Korea, 2019; pp. 1–18.
  25. KFS. The Guideline of Application of the Reforestation with New Species after Timber Harvesting Ver 1.0; Korea Forest Service: Daejeon, Korea, 2019; pp. 1–13.
  26. KFS. Administrative Cost Estimation Tool for Forest Carbon Offset Project Ver3.0; Korea Forest Service: Daejeon, Korea, 2017.
  27. KFS. Forest Carbon Offset Scheme Brochure; Korea Forest Service: Daejeon, Korea, 2015.
  28. KRIC. Introduction to Korea Emission Trading Scheme; Korea Research Institute on Climate Change: Chuncheon, Korea, 2018. [Google Scholar]
  29. Kim, Y.-H. Analysis of the Average Abatement Cost of Forest Carbon Offset Projects for the Government Purchase of Forest Carbon Credits. J. Clim. Chang. Res. 2016, 7, 391–396. [Google Scholar] [CrossRef]
  30. Kim, Y.H.; Jeon, E.J.; Shin, M.Y.; Chung, I.B.; Lee, S.T.; Seo, K.W.; Pho, J.K. A Study on the Baseline Carbon Stock for Major Species in Korea for Conducting Carbon Offset Projects Based on Forest Management. J. Korean Soc. For. Sci. 2014, 103, 439–445. [Google Scholar] [CrossRef] [Green Version]
  31. Birdsey, R.A. Carbon accounting rules and guidelines for the United States forest sector. J. Environ. Qual. 2006, 35, 1518–1524. [Google Scholar] [CrossRef] [PubMed]
  32. Intergovernmental Panel on Climate Change. IPCC Guidelines for National Greenhouse Gas Inventory; IPCC: Paris, France, 2006; Volume 1. [Google Scholar]
  33. Son, Y.M.; Lee, K.H.; Kim, R.H.; Pyo, J.K.; Park, I.H.; Son, Y.H.; Lee, Y.J.; Kim, C.S. Developing Forest Greenhouse Gas Inventory and Stand Yield Table on Korean Major Species; National Institute of Forest Sciences (NIFOS): Seoul, Korea, 2010; Volume 129.
  34. Lee, S.J.; Lim, J.S.; Kang, J.T. Estimation of Forest Carbon in Korea Forest (Focused on Major Species); National Institute of Forest Science, Ed.; National Institute of Forest Science: Seoul, Korea, 2019; Volume 129.
  35. EU-ETS. CO2 European Emission Allowances (Commodity). Available online: https://markets.businessinsider.com/commodities/co2-european-emission-allowances (accessed on 18 December 2019).
  36. KFS. The Trend of Korean Domestic Wood Market Price; Korea Forest Service: Daejeon, Korea, 2018; ISSN 2288-7369.
  37. KFS. Guidelines for Sustainable Forest Resources Management; Korea Forest Service: Daejeon, Korea, 2015; Volume 1244.
  38. KFS. Guideline for Implementing and Supervising Forest Tending Works; Korea Ministry of Government Legislation: Daejeon, Korea, 2020; Volume 1455, p. 115.
  39. Ruddell, S.; Walsh, M.J.; Kanakasabai, M. Forest Carbon Trading and Marketing in the United States; Report to the North Carolina Division of the Society of American Foresters; Society of American Forester: Washington, DC, USA, 2006; Available online: https://idahoforests.org/wp-content/uploads/2016/12/Forest_Carbon_Trading_and_Marketing_V5_Octr_23_06.pdf (accessed on 2 June 2021).
  40. Eggleston, H.; Buendia, L.; Miwa, K.; Ngara, T.; Tanabe, K. IPCC Guidelines for National Greenhouse Gas Inventories. Volume 4: Agriculture, Forestry and Other Land Use; IGES: Tokyo, Japan, 2006. [Google Scholar]
  41. KFS. The Estimated Forest Volume and Biomass in South Korea; Korea Forest Service: Daejeon, Korea, 2014.
  42. Penman, J.; Gytarsky, M.; Hiraishi, T.; Kruger, D.; Pipatti, R. Good Practice Guidelines on Land Use, Land Use Change and Forestry. In Good Practice Guidelines on Land Use, Land Use Change and Forestry; Institute for Global Environmental Strategies: Hayama, Kanagawa Prefecture, Japan, 2003. [Google Scholar]
Figure 1. Overall approach used to analyze value-added forest carbon offset projects based on the application of the Korea emission trading system in the forestry sector.
Forests 12 00742 g001
Figure 2. Spatial distribution of the four major species in Korea (Pinus densiflora, Larix kaempferi, Quercus acutissima, and Quercus mongolica).
Forests 12 00742 g002
Figure 3. The estimated net change carbon stocks in scenarios that included an extension of the rotation age. (a.) Scenario 1—Pinus densiflora. (b.) Scenario 2—Quercus acutissima.
Forests 12 00742 g003
Figure 4. Estimated net change in carbon stocks for scenarios included in KETSF projects.
Forests 12 00742 g004
Table 1. Description of scenarios and assumptions in KETSF for forest management projects.
ScenariosCategory of KETSFInitial Species in the StandReforestation Target SpeciesInitial Species Rotation Age2nd Species Rotation Age
Scenario 1 (S1)Extension of rotation ageQuercus acutissimaN/A25Continued from original stand
Scenario 2 (S2)Pinus densifloraN/A40Continued from original stand
Scenario 3 (S3)Reforestation with new speciesPinus densifloraLarix kaempferi4030
Scenario 4 (S4)Quercus acutissima25
Scenario 5 (S5)Quercus mongolica25
Table 2. Fraction values and factors used to estimate carbon for the five major species in Scheme 41 (IPCC, 2006 [40]).
FractionWood Density
(WD)
(t m−3)
Biomass Expansion Factor (BEF)Root Ratio (RR)Carbon Fraction [42]Factor of CO2 to Carbon
Species
Pinus densiflora0.4721.4130.2540.513.664
Larix kaempferi0.4531.3350.291
Quercus acutissima0.7211.4500.3130.48
Quercus mongolica0.6631.6030.388
Table 3. The simulation results of carbon increment in scenarios that include an extension of the rotation age.
ProjectScenarios That Include an Extension of the Rotation Age
ScenarioScenario 1 (S1)Scenario 2 (S2)
SpeciesPinus densifloraQuercus acutissima
Timber production (m3 ha−1)241.1424.9
Total carbon in woody biomass (t CO2-eq ha−1)369.411068.51
Baseline (t CO2-eq ha−1)288.20323.40
Carbon loss (t CO2-eq ha−1)4.0637.26
Carbon leakage (t CO2-eq ha−1)1.6314.90
Net change in carbon stocks (t CO2-eq ha−1)75.52692.95
Table 4. The simulation results of carbon increment in scenarios that included reforestation with new species.
ProjectScenarios That Include Reforestation with New Species
ScenarioScenario 3 (S3)Scenario 4 (S4)Scenario 5 (S5)
SpeciesPinus densiflora to Quercus acutissimaPinus densiflora to
Quercus mongolica
Pinus densiflora to Larix kaempferi
Timber production (m3 ha−1)488.7494.0585.5
Total carbon in woody biomass (t CO2-eq ha−1)755.90826.67568.41
Baseline (t CO2-eq ha−1)386.41386.41386.41
Carbon loss * (t CO2-eq ha−1)N/AN/AN/A
Carbon leakage ** (t CO2-eq ha−1)N/AN/AN/A
Net change in carbon stocks (t CO2-eq ha−1)369.49440.26182.00
* Carbon loss and ** carbon leakage were not considered as additional sources of GHG emissions in scenarios that included reforestation with new species [25].
Table 5. Revenue associated with KETSF forest management projects (extension of rotation age and reforestation with new species).
Project TypesExtension of Rotation AgeReforestation with New Species
ScenariosS1S2S3S4S5
SpeciesPinus densifloraQuercus
acutissima
Pinus densiflora to Quercus acutissimaPinus densiflora to Quercus mongolicaPinus densiflora to Larix kaempferi
Estimated timber production (m3 ha−1)241.1424.9488.7494585.5
Total carbon in woody biomass (t CO2-eq ha−1)81.21745.12369.5440.27181.95
Timber production (USD)12,542.7113,712.4725,757.6423,927.5234,017.33
Revenue from carbon stocks
(USD)
1119.8010,477.194642.415624.732242.13
Total revenue (USD)13,662.5124,189.6730,400.0429,552.2636,259.46
Table 6. Total costs of forest carbon offset projects.
Project TypesExtension of the Rotation AgeReforestation with New Species
ScenariosS1S2S3S4S5
SpeciesPinus densifloraQuercus acutissimaPinus densiflora to Quercus acutissimaPinus densiflora to Quercus mongolicaPinus densiflora to Larix kaempferi
Afforestation cost a
(USD)
206.34228.871276.301042.20943.22
Harvesting cost b750.811175.407165.906181.803282.60
Primary
Transportation cost c (USD)
3852.504082.9016,811.2016,755.7014,767.40
Forest
management cost (a+b+c) (USD)
4809.605487.2025,253.4023,979.6018,993.20
Transactional cost of carbon offset projects d (USD)2554.303108.402554.302554.302554.30
Total cost (a+b+c+d) (USD)7363.908595.5027,807.7026,534.0021,547.60
Table 7. Net revenue of KETSF projects.
Project TypesExtension of the Rotation AgeReforestation with New Species
ScenariosS1S2S3S4S5
SpeciesPinus densifloraQuercus
acutissima
Pinus densiflora to Quercus
acutissima
Pinus densiflora to Quercus
mongolica
Pinus densiflora to Larix kaempferi
Estimated timber production (m3 ha−1)241.1424.9488.7494585.5
Total carbon in woody biomass (t CO2-eq ha−1)81.21745.12369.5440.27181.95
Timber production a (USD)12,577.9013,750.9025,829.8023,994.6034,113.00
Revenue from carbon market b (USD)1122.9010,506.604622.405640.502248.40
Afforestation cost c (USD)206.34228.871276.301042.20943.22
Harvesting cost d (USD)750.811175.407165.906181.803282.60
Primary transportation cost e (USD)3852.504082.9016,811.2016,755.7014,767.40
The cost of forest management (c+d+e) (USD)4809.605487.2025,253.4023,979.6018,993.20
Transactional cost of carbon offset projects f (USD)2554.303108.402554.302554.302554.30
Net revenue * (USD)6336.9015,661.902644.503101.2014,813.90
Net revenue * = (a + b) − (c + d + e + f).
Publisher’s Note: MDPI stays neutral with regard to jurisdictional claims in published maps and institutional affiliations.

