Article

Clonal Reproduction and Low Genetic Diversity in Northern Australian Santalum lanceolatum (Santalaceae) Populations Highlights the Need for Genetic Rescue of This Commercially Significant Species

1
GeneCology Research Centre, University of the Sunshine Coast, Maroochydore, QLD 4556, Australia
2
School of Science, Technology and Engineering, University of the Sunshine Coast, Maroochydore, QLD 4556, Australia
3
Forest Industries Research Centre, University of the Sunshine Coast, Maroochydore, QLD 4556, Australia
*
Author to whom correspondence should be addressed.
Forests 2021, 12(6), 741; https://doi.org/10.3390/f12060741
Submission received: 10 May 2021 / Revised: 28 May 2021 / Accepted: 3 June 2021 / Published: 4 June 2021
(This article belongs to the Section Genetics and Molecular Biology)

Abstract

:
Genetic diversity and the extent of clonality in a plant species can significantly influence its reproductive success. Whilst clonality can be an effective life-history strategy, in harsh environments it can lead to low levels of diversity and sexual reproductive failure. Santalum lanceolatum (Santalaceae) is a hemi-parasitic shrub endemic to the monsoonal dry tropics of northern Australia, which was harvested for its oil-rich heartwood from natural populations in Cape York, Australia. Despite wild harvesting ending over 70 years ago, populations in the region are currently declining. The aims of this study were to examine genetic variation, population genetic structure, inbreeding and clonality of six S. lanceolatum populations from this northern margin of the species range. Analyses of twelve microsatellite markers showed S. lanceolatum had low genetic diversity (AR = 2.776, HE = 0.409), evidence of regional differentiation (FST = 0.307–0.424) and negligible inbreeding levels (F = −0.052). Clonality investigations revealed 135 genets among 200 samples, suggesting that the clonal structure of S. lanceolatum may be limiting the potential for sexual reproduction and natural recruitment. We recommend a conservation strategy involving genetic rescue to prevent the further decline and potential local extinction from a variety of environmental pressures and human activities.

1. Introduction

Commercial extraction of economically important plants from natural populations is a significant factor leading to the decline of many species across the globe [1,2,3]. Wild harvesting has a variety of ecological consequences and impacts on forest resources, including loss of habitat, isolation and reduction in population size [4]. Plant species confined to small and fragmented populations are particularly susceptible to loss of genetic variability as a result of overharvesting due to interrupted gene flow, inbreeding, and genetic drift, which ultimately influence the potential for long-term survival [3]. In addition, the life-history strategy of species in disturbance-prone environments influences persistence under stressful conditions [5]. While vegetative reproduction is common among many plant species [2,5,6,7], the population dynamics and genetic features of clonal growth have rarely been studied in systems of frequent disturbance, such as the fire-prone tropical savannas.
The sandalwood genus (Santalum L. Santalaceae) is a broadly distributed group of plants with 16 extant species that occur throughout the Asia-Pacific region [8]. A number of sandalwood species are endangered due to overharvesting of wild populations, as the timber is highly sought after due to the commercial value of fragrant oil derived from mature heartwood [9]. Whole trees are harvested from natural populations to extract the oil-rich heartwood and roots, which are widely used in aromatherapy, cosmetics, perfumes, carvings and production of incense sticks [10]. Slow growth rates and low levels of natural regeneration of valuable sandalwood species have exacerbated declines of natural populations subject to commercial harvesting [11]. Increasing demand and a global decline of wild sources has made sandalwood one of the most expensive wood products in the world [12]. As a consequence, there is significant pressure on remaining natural stands of sandalwood from unsustainable harvesting, habitat loss and disease [13].
India has historically been the leading producer of sandalwood [14]. However, there is an emerging global shortage of Indian sandalwood (Santalum album) stocks due to reductions in wild harvested populations [15]. The shortage of S. album supplies has generated demand for other sandalwood species throughout Papua New Guinea, Australia and the Pacific Islands [9]. In Australia, S. spicatum and S. lanceolatum have also been extensively wild harvested [16,17] and are currently threatened by grazing and habitat fragmentation [18,19].
Santalum lanceolatum R. Br. Sensu stricto, commonly referred to as northern sandalwood, is a small to medium tree endemic to the monsoonal dry tropics of northern Australia and is of emerging conservation and economic significance. Northern sandalwood was widely exploited in Far North Queensland (QLD), Australia, including the Northern Peninsula Area (NPA) between the late 1800s and 1930s. By around 1940, the wild resources in the region were exhausted, effectively ending the brief export industry [20]. Growing up to 17 m in height and 25 cm in diameter at breast height (dbh) [10], it is the largest and second most widely distributed of the seven sandalwood species native to Australia, which include S. acuminatum, S. album, S. murrayanum, S. leptocladum, S. spicatum and S. obtusifolium [16]. Once recorded to inhabit a range of environments in all states of Australia [4], a taxonomic review of the species in 2007 revised the range to a narrower area, generally contained within the northern humid and sub-humid areas north of 20° S latitude [16].
Current populations of S. lanceolatum at its northern distributional limit in the NPA are threatened by a range of human impacts, including previous overharvesting, grazing and fires [1]. These factors, combined with poor natural recruitment, have led to a decline of northern sandalwood in the NPA. Furthermore, even though wild harvesting from the region ceased more than 70 years ago, there has been no research on the genetic structure of remaining natural stands in the area. The most recent survey of northern sandalwood observed a 19% decrease in known individuals in the NPA over a ten-year period [10]. Consequently, northern sandalwood populations in the region are small and fragmented and considered to be locally threatened, with few large trees remaining [10]. These isolated, small populations may become genetically segregated by chance events or selection pressures [21]. As such, we might expect to see some level of differentiation between the most geographically isolated populations in the NPA. Furthermore, restricted gene flow may have significant consequences in plant populations that utilise clonal reproduction to maintain persistence and are found in clusters comprised of high numbers of genetically identical individuals [4,7]. However, there is no current research available that provides information of sufficient detail regarding the genetic architecture of the species and in particular of these isolated NPA populations.
Sandalwood reproduces both vegetatively and sexually with genetically identical individuals (clonality) observed in wild populations of S. album [22], S. insulare [2] and S. leptocladum [4]. Whilst we may observe increased somatic mutations across the life-span of persistent, clonal individuals, we still expect high levels of relatedness amongst parental (genets) and mutated ramets [23]. Clonal reproduction can increase the degree of pollination between flowers within the same clone, i.e., geitonogamy [24], leading to inbreeding depression in self-compatible plants or a decline in genetic diversity [24] and low reproductive success in self-incompatible species [4]. Research suggests a number of sandalwood species are self-incompatible [4,25,26] with clonal populations of S. leptocladum from southern Australia demonstrating pollen to pistil incompatibility, pollen sterility or pistil dysfunction, which contributes to poor reproductive success [4]. Additionally, although poor seed production was reported for S. lanceolatum by [26], highlighting that just 20% of trees produced fruit from self-pollination experiments, this suggests northern sandalwood are not exclusively self-incompatible. Although early reports suggest S. lanceolatum produces large amounts of seeds [1], there is little evidence of seed-sourced natural recruitment from the remnant NPA populations, with most regeneration believed to be from asexual, vegetative reproduction through root suckering [10,19]. This suggests that S. lanceolatum in the NPA may have significant levels of clonal structuring, which may exacerbate conservation concerns of S. lanceolatum within the region and potentially for the taxon as a whole.
Northern sandalwood also remains a species of commercial interest due to the discovery of individuals with high quality oil profiles [19]. This finding has sparked interest in developing a managed plantation led by traditional communities as a means to take advantage of the growing niche market for sandalwood products. However, because northern sandalwood in the NPA appears to be in decline [10], conservation of the taxa in the region needs to be addressed as a priority. Understanding the levels of genetic variation and population structure are therefore key components to the development of a successful conservation strategy [27,28].
In this study, we investigated the genetic diversity, population genetic structure and levels of relatedness of natural stands of S. lanceolatum using twelve microsatellite markers. Our objectives were to: (i) quantify the genetic diversity within six natural populations of S. lanceolatum from the NPA; (ii) determine levels of genetic differentiation between the populations; (iii) assess genetic change and clonality of the populations and between age classes; (iv) identify genetic relationships of regionally distinct S. lanceolatum populations, and (v) to utilise the population genetic data to identify threats to S. lanceolatum in the study region and propose conservation measures to guide effective management of the species.

2. Materials and Methods

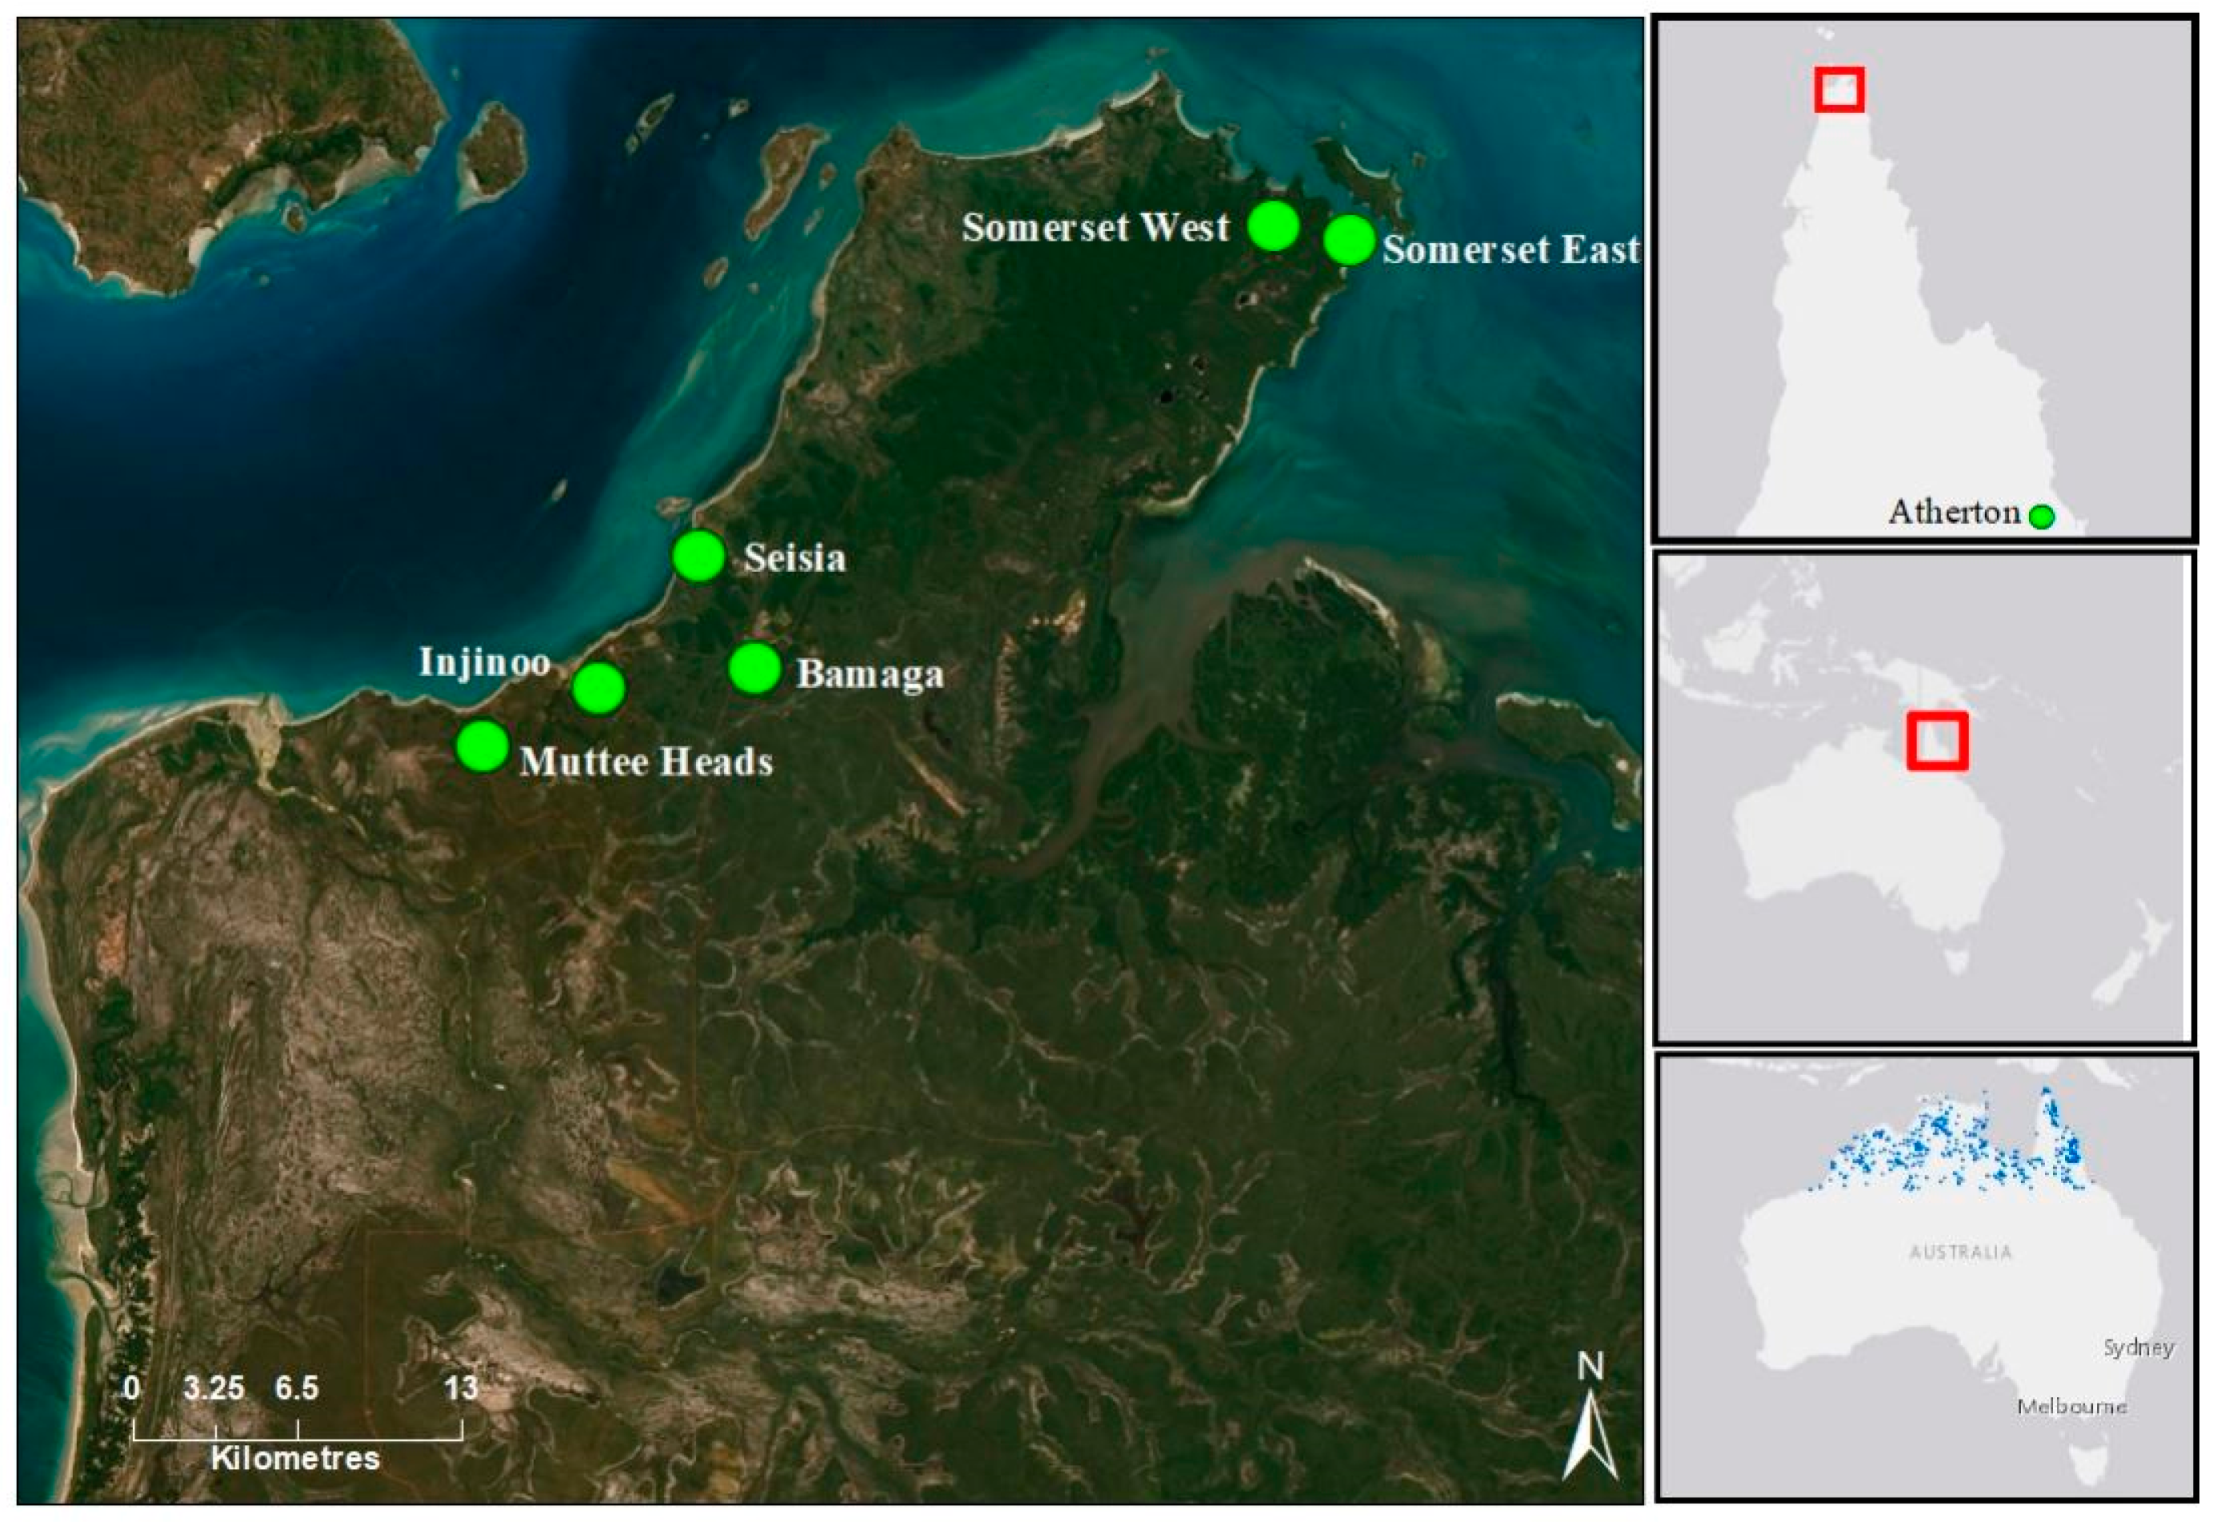
A total of 200 Santalum lanceolatum individuals were sampled from eight populations covering the geographic range of the species in the tropical savanna woodlands of the Northern Peninsula Area (NPA) and two geographic outlier populations from the Atherton region of Cape York, Queensland, Australia (Figure 1). Rainfall in the NPA region is concentrated over the summer wet season, which is from December to February, with a yearly average rainfall of 1791.6 mm and an average of 94.9 days of rain annually [29]. Average yearly temperatures range from a minimum of 24.7 °C to a maximum of 30.4 °C.
Though widely distributed across northern Australia, current populations of northern sandalwood in the NPA are small and fragmented, with low levels of natural recruitment [10]. An exhaustive sampling approach was used to analyse clonality of S. lanceolatum populations. In October 2018, leaf tissue was collected from between 12 and 46 individuals from each of these six populations, with a total of 177 individuals sampled from the NPA region. Three ‘central’ populations (Seisia, Bamaga and Injinoo) are found on the western coast of the NPA covering an area of approximately 80 km2 (Figure 1). The two Somerset populations (Somerset East and Somerset West) are approximately 5.5 km apart at the north-eastern tip of the Cape York and more than 28 km from the central cluster of populations. The Muttee Heads population is approximately 9 km to the south of the central cluster and is potentially isolated by a tidal estuary. Individual trees were assessed for evidence of reproductive structures, tree height and dbh. Trees with evidence of flowers and/or fruit, >2 m high and with >2 cm dbh were categorised as adults. Individuals < 2 m in height, with a dbh < 2 cm and no evidence of flowers and/or fruit were categorised as juveniles. For an age-class genetic diversity and structural analyses, a total of 60 trees classified as juveniles were collected from Bamaga (19 individuals), Seisia (21 individuals) and Injinoo (20 individuals). Material was collected under guidance and with permission from the traditional owners of the region, the Gudang/Yadhaykenu people.
Additional leaf tissue was collected from 23 individuals from two S. lanceolatum populations (Rocky Creek and Price Creek, 27.5 km apart; ~748 km SSE from the closest NPA population) on the Atherton tablelands, in southern Cape York. These populations were collected to provide comparison and perspective of genetic features to the NPA populations. We also collected two leaf samples to use as outgroups for hierarchal clustering analysis between S. lanceolatum populations that were sourced from five Santalum congeners (S. album, S. austrocaledonicum, S. leptocladum, S. macgregorii, S. yasi) grown at research facilities near Gympie, Queensland, Australia.
Leaf samples were stored in zip lock plastic bags with silica gel at ambient temperature prior to DNA extraction. Total genomic DNA was extracted and isolated using a DNeasy Plant Mini Kit (Qiagen, Valencia, CA, USA) following the manufacturer’s instructions.
Seven microsatellite markers specific for S. lanceolatum were sourced from [17]. We screened an additional 22 primer sequences (Table S1) designed for a variety of sandalwood congener species sourced from [30,31,32]. The additional primers were assessed for the potential to cross-amplify with S. lanceolatum with the aim of selecting a greater number of primers for analyses than had previously been utilised.
Twelve polymorphic microsatellite loci were selected that produced consistent Polymerase Chain Reaction (PCR) amplification, distinct allelic variation and clarity of fluorescent signal (electrophoretic signature) to evaluate population genetic variation. Forward primers for each locus were direct labelled with one of four fluorescent dyes (FAM, NED, VIC, PET). PCR was performed in a total reaction volume of 12.5 µL containing 7 µL ddH20, 1.25 µL PCR reaction buffer, 1 µL dNTP’s, 0.75 µL MgCl2, 0.25 µL of each forward and reverse primer, 0.25 µL Bovine Serum Albumin (BSA), 0.05 µL Taq F1 DNA polymerase and 1.5 µL (diluted to 1:10) genomic DNA. Amplification was performed with an Eppendorf Mastercycler (Hamburg, Germany) using the following cycling parameters: 95 °C for 3 min, followed by 35 cycles of 94 °C for 30 s, 56 °C for 30 s, 72 °C for 45 s, with a final extension at 72 °C for 10 min. PCR products were separated by capillary electrophoresis using an AB Genetic Analyser (Applied Biosystems). Fragment sizes were resolved corresponding to an internal lane standard (GS-600 LIZ; Applied Biosystems) using GENEMARKER v 2.4.0 software (SoftGenetics LLC, State College, PA, USA) followed by manual verification by a second person. Ambiguous and unresolved signals were assessed by repeat PCR and capillary electrophoresis.
To assess the extent of clonality, we used GenAlEx version 6.5 [33]. We first applied the Find Clones function to produce a list of matching (i.e., identical) multilocus genotypes (MLGs). The list of matching MLGs was used to measure G/N, which determines the ratio between the matching MLGs (G) and total number of individuals in a population (N). The G/N ratio ranges between zero and one, with results close to zero suggesting strict clonality and a higher proportion of individuals sharing the same multilocus genotype. A G/N equal to one suggests sexual reproduction where individuals each have a unique multilocus genotype [34]. The Find Clones function identifies clonality and clonal probability at the population level but does not handle missing data. From our dataset with identical individuals removed, we had 7.3% missing values. To overcome the missing values to run the Find Clones function, we interpolated the missing data for missing values. As most loci had at least one sample of missing data, we used the most common allele (mode allele) for each locus to replace all missing data for the clonal analyses. To determine whether the probability of the detection of MLGs was significant (p ≤ 0.05), we calculated the Psex value where Psex is the probability of encountering a given genotype by chance, and PsexNgen is the probability of finding that MLG in the N sampling units collected and analysed. Whilst similar clonal analysis programs handle missing data by various methods such as using a ‘mean’ allele [35] or treat missing values as ‘new’ alleles [36], we acknowledge that using alternative methods or programs may produce different results.

2.1. Genetic Diversity

The polymorphic information content (PIC) was calculated using CERVUS Version 3.0.3 [37]. Deviation from Hardy–Weinberg Equilibrium (HWE) at each locus and evidence for genotypic linkage disequilibrium (LD) among pairs of loci was calculated using FSTAT v2.9.3.2 [38]. To estimate the possibility for large allele dropout, stuttering from genotyping errors and presence of null alleles, we used MICRO-CHECKER v2.2.3 [39] and ML-NULLFREQ [40] run with 1000 bootstraps at a 95% confidence interval. Three loci (SsA106, Lanc03 and Lanc08) displayed significant evidence of linkage disequilibrium and deviation from HWE (Table S2). The low rate of natural recruitment and likelihood of the study populations being closely related or clonal may have contributed to homozygote excess, which influenced the HWE and LD test results. However, the locus Lanc03 was excluded from further analyses as it also showed evidence of potential null alleles (whereas SsA106 and Lanc08 did not). Thus, we obtained a final set of 12 loci suitable for the population genetics analysis of S. lanceolatum. The average potential null allele frequencies for the 12 selected loci were estimated to be and 0.16 ± 0.07 by ML-NULLFREQ and 0.11 ± 0.03 by MICRO-CHECKER. Loci from natural populations are expected to present deviation from HWE as a result of a number of genetic factors such as genetic drift, level of relatedness, natural selection and founder effects, and null alleles are often prone to false positives in these situations [41]. It is therefore unlikely that the estimated frequency of null alleles will significantly impact subsequent genetic analyses.
To provide a context to similar studies of Santalum species with reported clonal populations, all ramets were excluded from analyses, with one representative (genet) from each clonal group used for diversity and population structure analyses. The difference in diversity results was negligible when all individuals from each population including singletons, genets and ramets were included.
Allelic frequencies were assessed using GenAlEx version 6.5 [33] to analyse population genetic diversity parameters including: mean number of alleles per locus (A), observed heterozygosity (HO), expected heterozygosity (HE) and the past inbreeding measure (F) index [42]. Allelic richness (AR; mean number of alleles per locus) and private allelic richness (PAR; mean number of private alleles per locus) were generated at a minimum sample size of 6 genes for age-class comparisons and 12 genes for populations without juveniles, using rarefaction from HP-Rare [43].
Data from the southern populations (Rocky Creek and Price Creek) were unable to be resolved at the loci mSiCIR153 as it failed to amplify despite repeated PCR and capillary electrophoresis. Here, we report AR and PAR for these populations without loci mSiCIR153. However, it is worth noting that these missing data may have influenced the final results.

2.2. Population Structure and Progeny Dynamics

To analyse the population genetic structure and assess genetic change between generations (age class), we performed a number of analyses of molecular variance (AMOVAs) using GenAlEx version 6.5 [33] with 999 permutations. The AMOVAs detected multilocus comparisons of the average pairwise levels of differentiation (
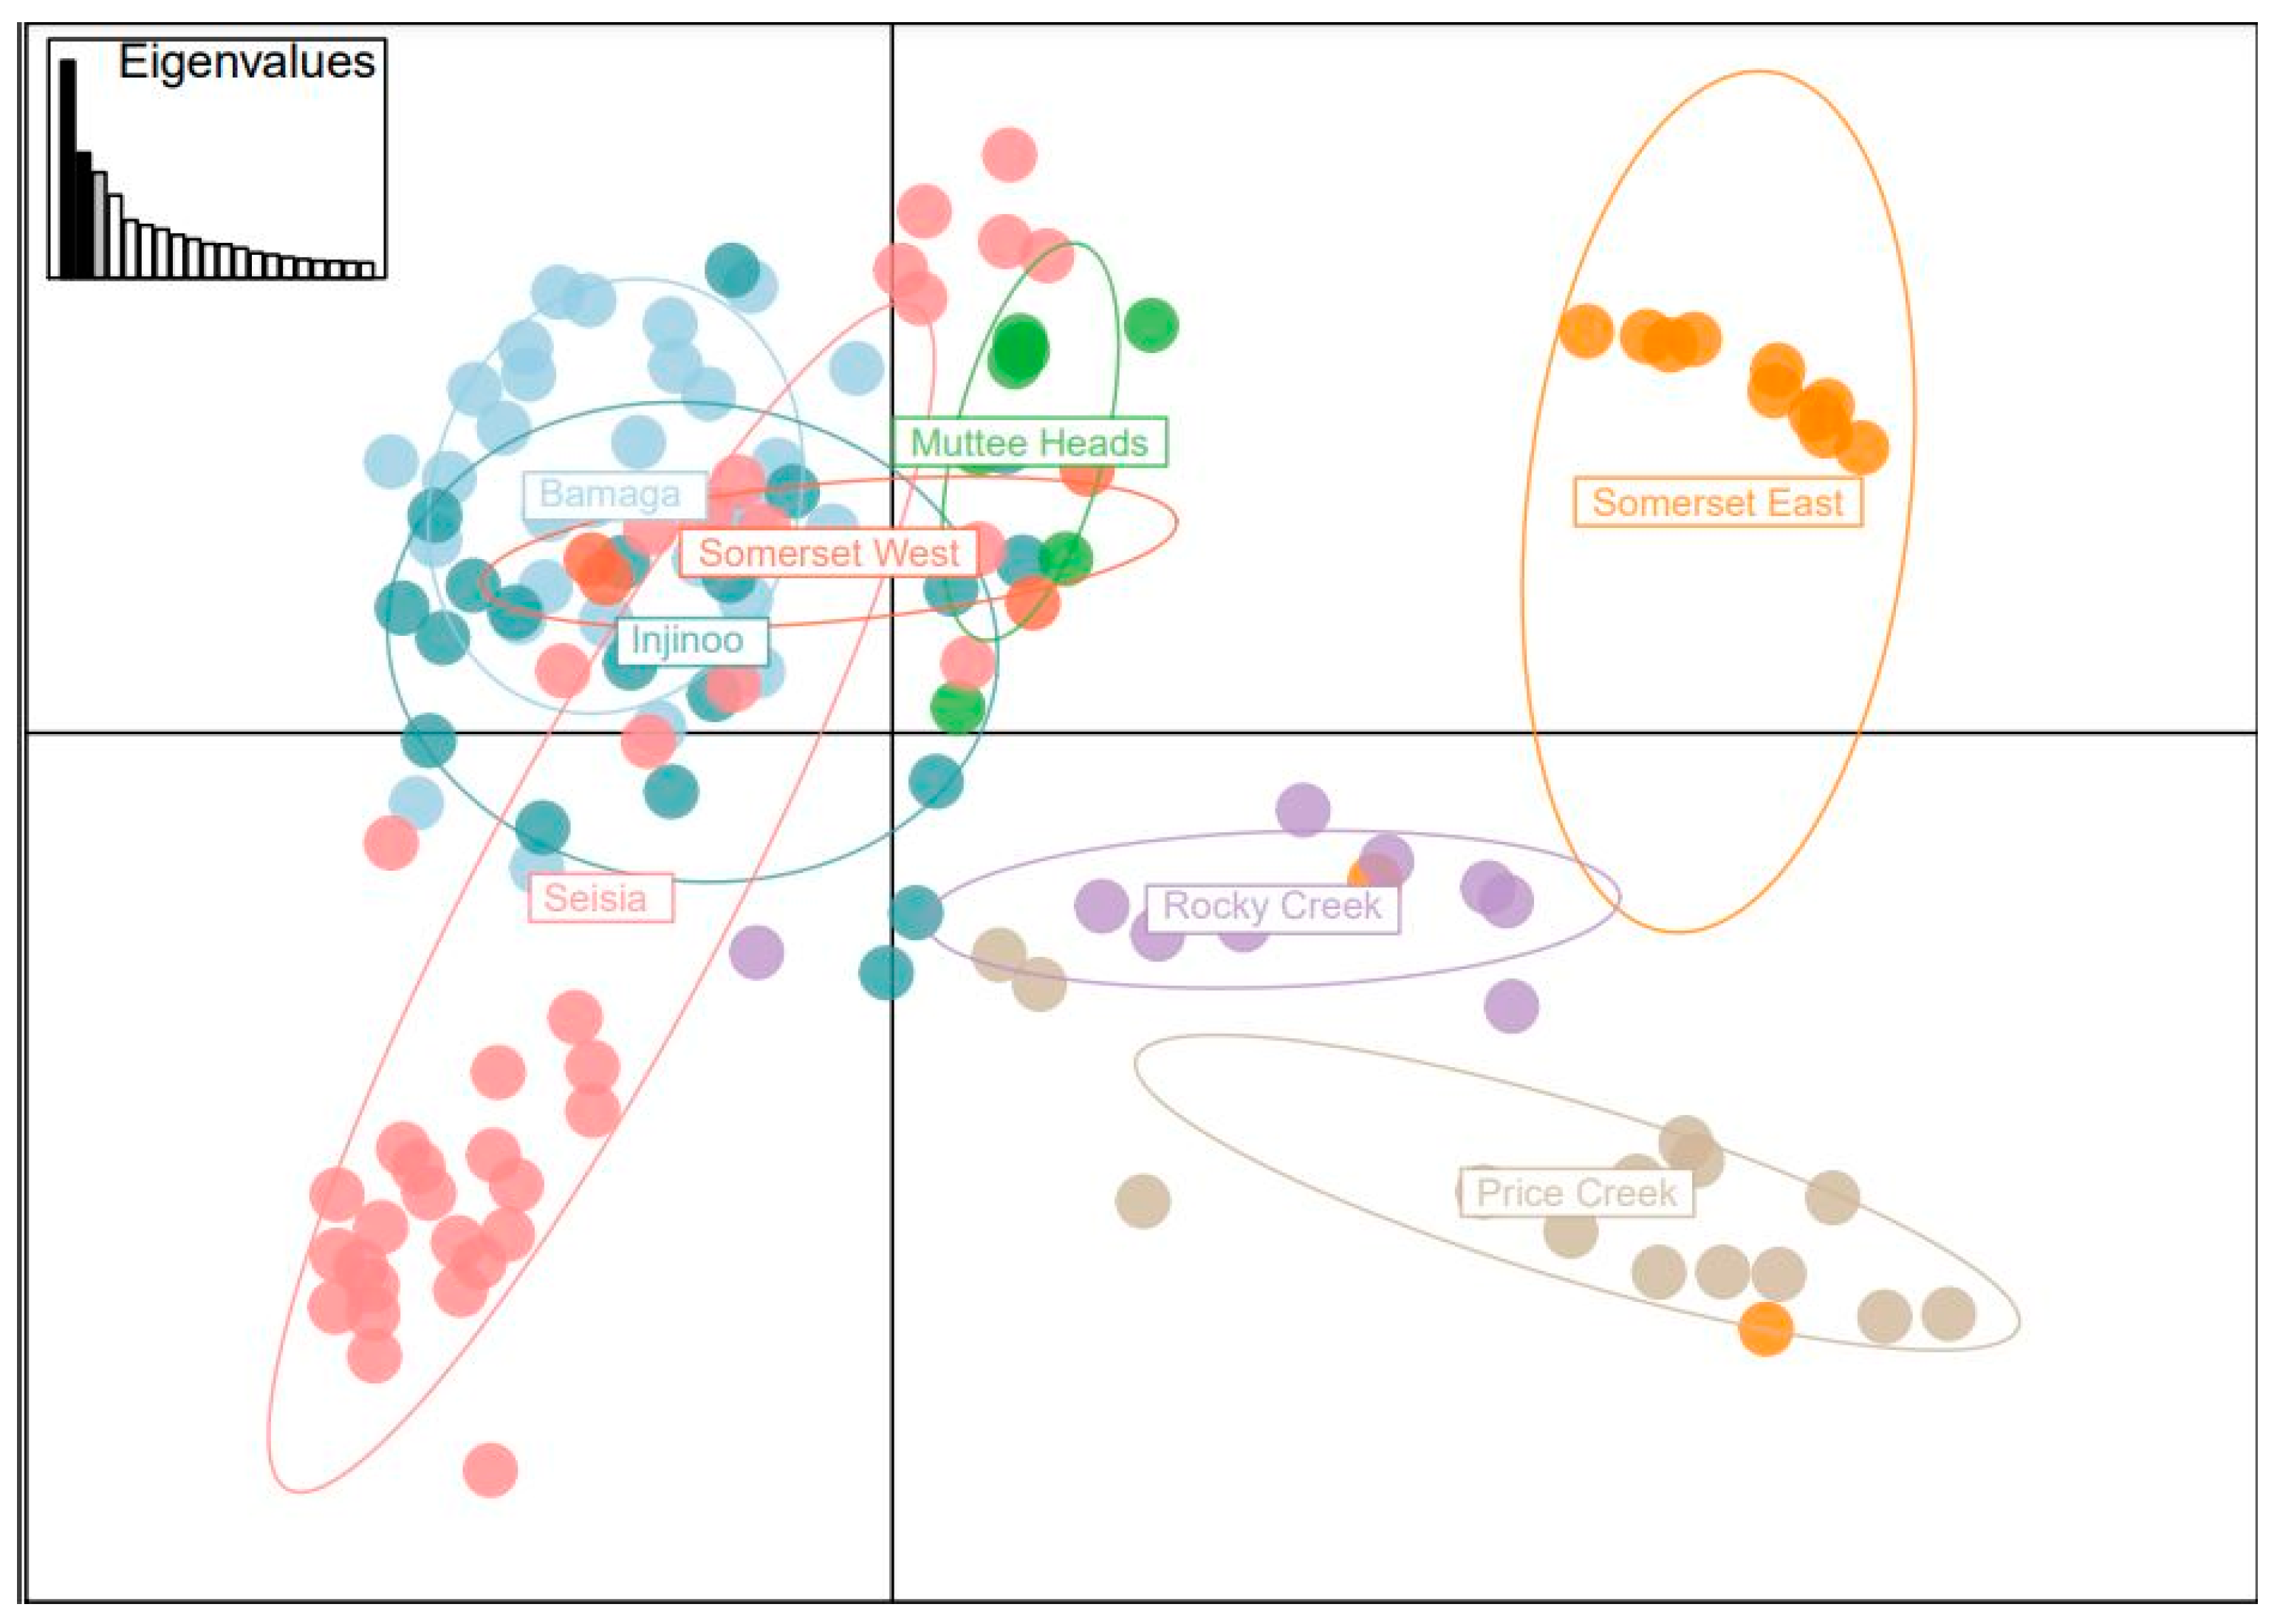
FST) within and between adult and juvenile populations. Further analysis of genetic differentiation within and between populations was performed using the R package Adegenet [44] in the R environment (R studio, version 1.1.453) using a discriminant analysis of principal components (DAPC) to identify posterior probabilities of individual assignment to K means groups. The DAPC was based on 30 principal components retained from the cross-validation function. Groups were identified using the ‘snapclust’ function over a maximum of 20 groups to generate Bayesian Information Criterion (BIC) to identify the optimal K value. Snapclust evaluates clustering by modelling Hardy–Weinberg equilibrium combined with the maximum-likelihood estimation from an Expectation-Maximisation algorithm to determine the optimal number of genetic clusters (K) based on goodness-of-fit criteria [45].
We also performed additional validation in STRUCTURE version 2.3.4 [46] using the Evanno method [47] to confirm assignments. Results of the DAPC K means clustering were visualised using the R package ggplot2 [48]. To estimate genetic relationships between 
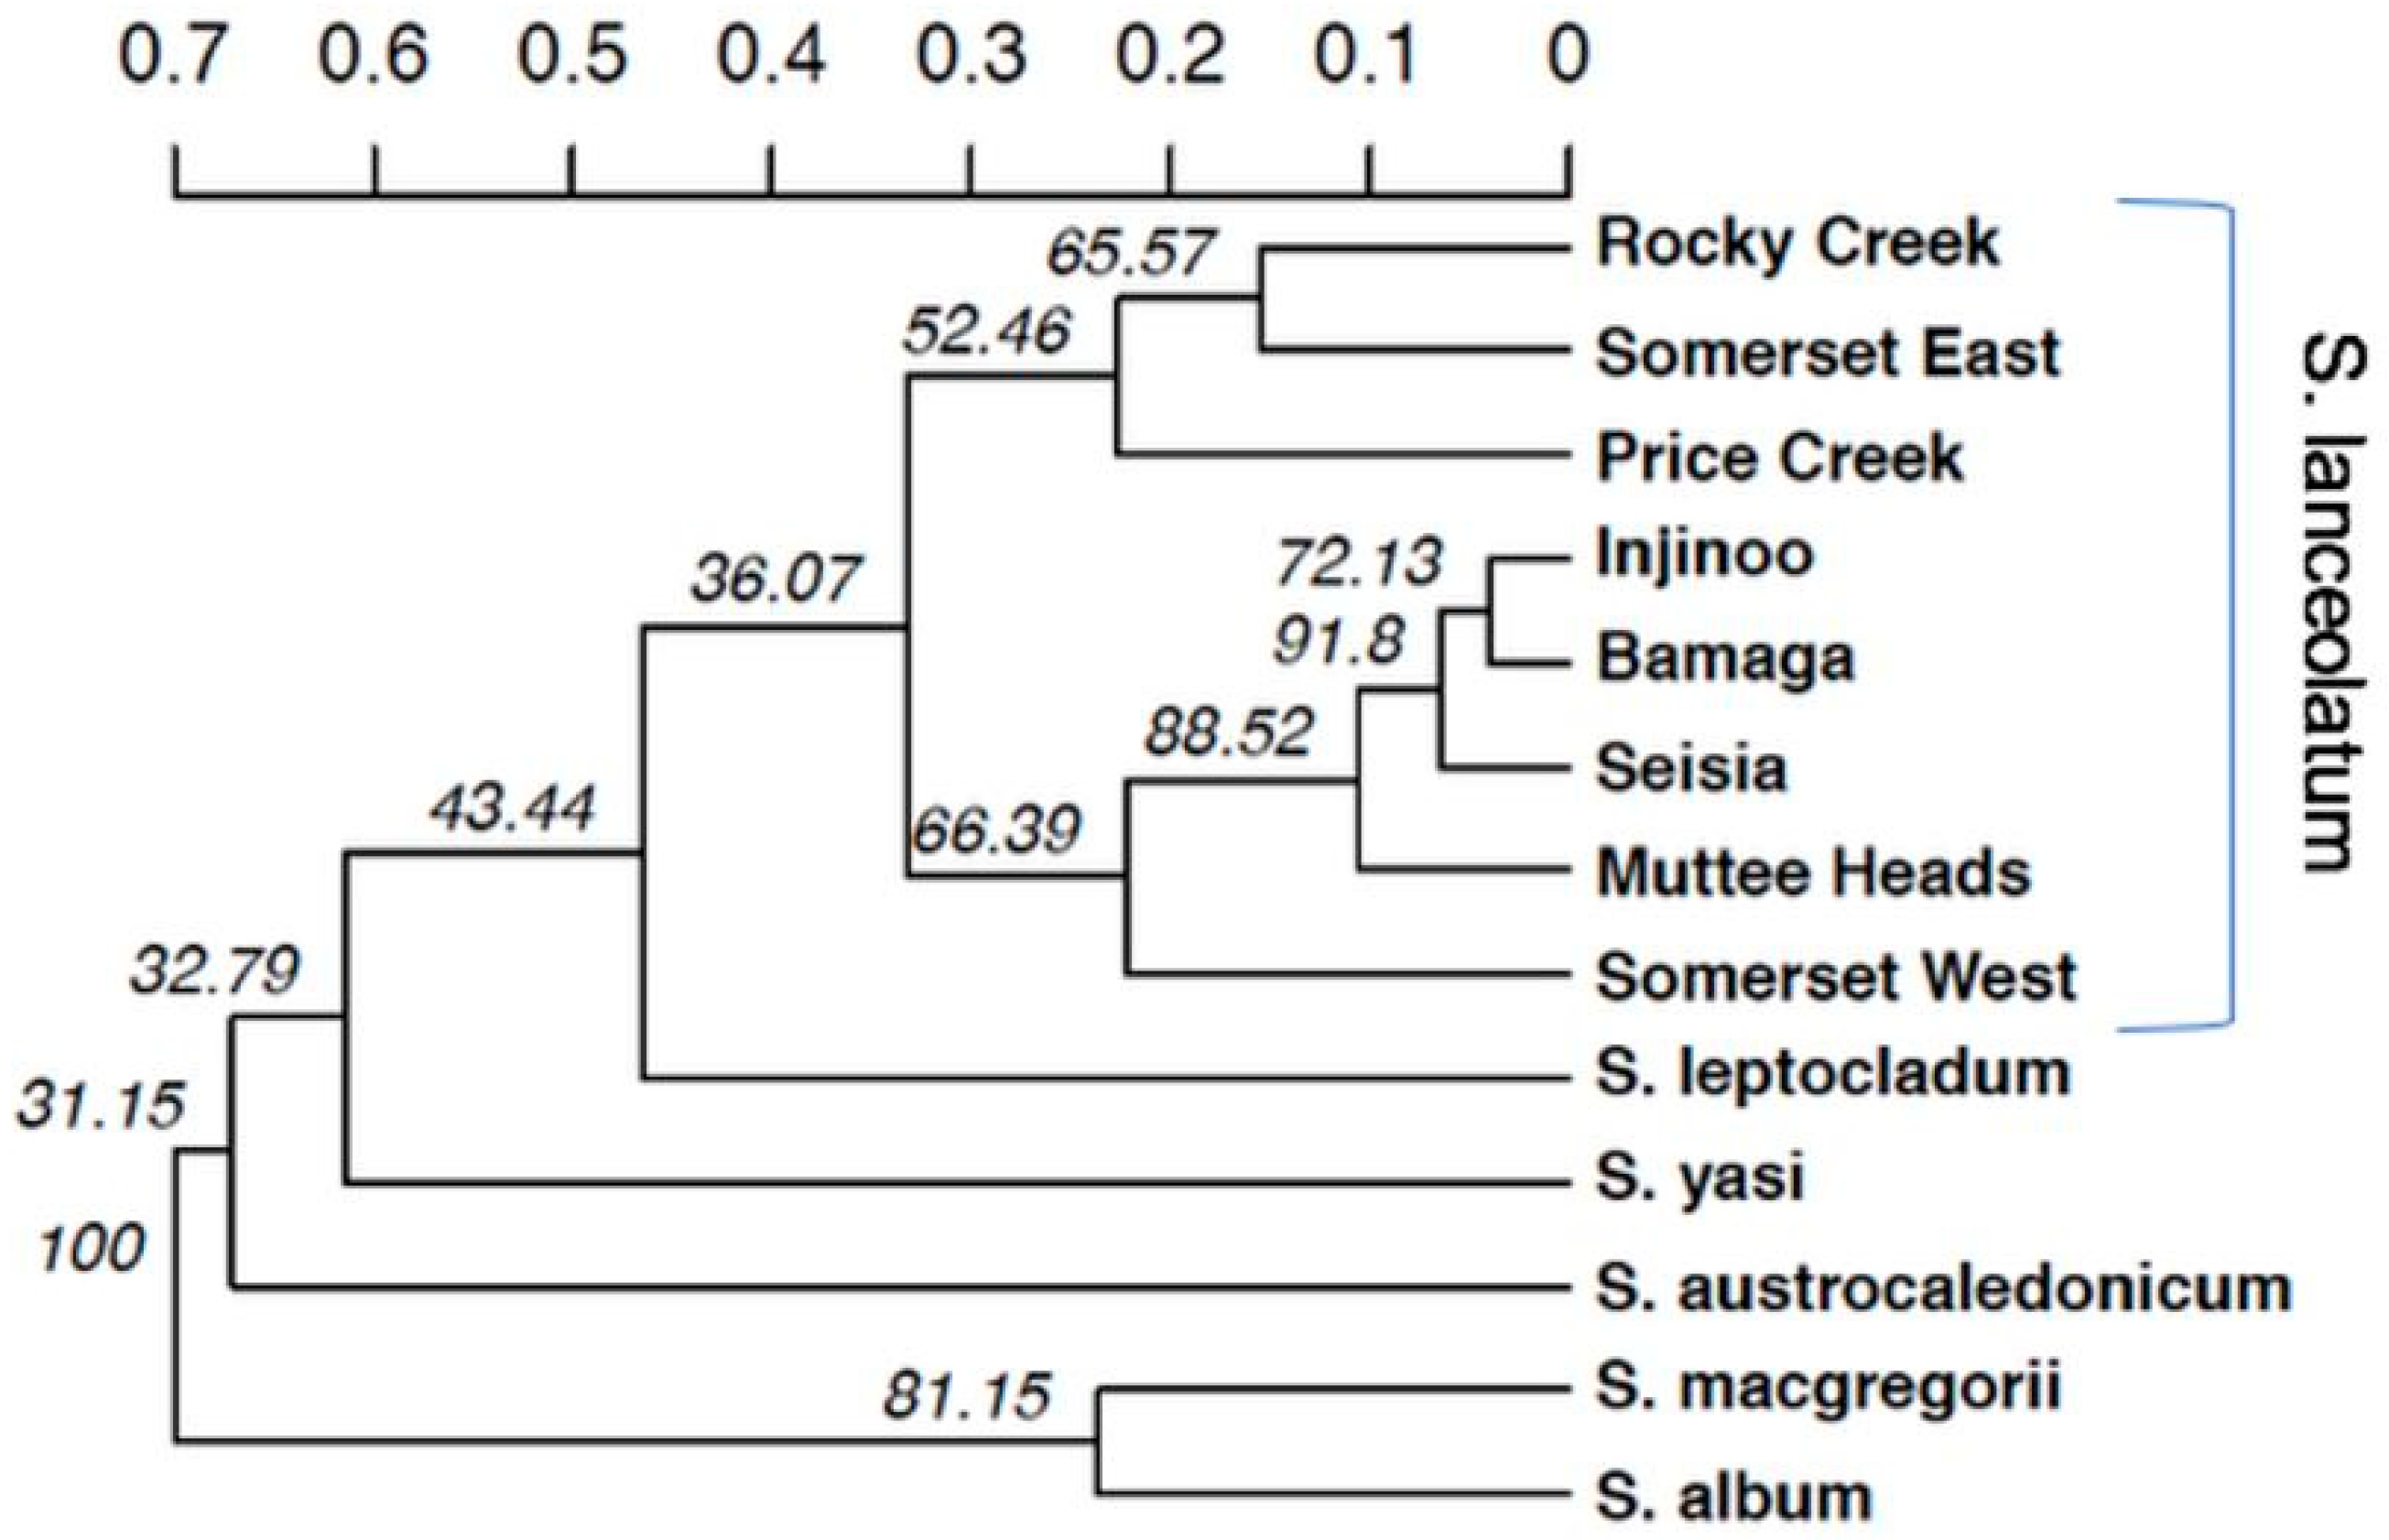
S. lanceolatum populations and additional Santalum species we used the R package Ape, Version 5.1 [49], to perform a Neighbour Joining (NJ) tree, hierarchal cluster analysis run at 999 bootstraps based on Nei’s genetic distance [50]. Principal Coordinates of Analyses (PCoA) were produced for several axes from the R package Adegenet [44] to assess genetic associations.

2.3. Detection of Bottlenecks

To detect the probability of a recent bottleneck event we used BOTTLENECK [51]. Using a heterozygosity excess method, this program tests assumptions that a recent decline in effective population size leads to genetic bottlenecks as a result of deviations from mutation-drift equilibrium. We used the Wilcoxon’s signed-rank test as a minimum of 20 loci are needed for a standardized difference test. The two-phased mutation (TPM) model was used for its suitability with microsatellite markers [51] with an 80% stepwise mutation model and 20% multistep mutations.

3. Results

3.1. Microsatellite Marker Analysis

From the 177 S. lanceolatum individuals sampled across the NPA, 135 were unique multilocus genotypes with the remaining 42 samples treated as identical MLGs (clones). As such, all marker measures and subsequent diversity analyses were only run on the 135 unique MLG samples. A total of 76 alleles were resolved from the 135 unique MLGs of the NPA S. lanceolatum individuals across the 12 microsatellite markers employed with between two and twelve alleles per locus (Table S3). The two populations from southern Cape York were excluded from this analysis as alleles at loci mSiCIR153 were unable to be resolved. The mean number of alleles per locus at the species level (NA) was 6.33 with PIC values ranging from 0.085 to 0.756 (mean PIC = 0.500; Table S1). There was a slight excess of HO (mean = 0.457) compared to HE (mean = 0.402), with overall low levels of FIS (mean = −0.083). Locus Lanc08 displayed the lowest measures of diversity (PIC = 0.085, NA = 3, HO = 0.052, HE = 0.098).

3.2. Detection of Clonality

From the total of 200 S. lanceolatum individuals, we found 135 unique MLGs and 65 identical MLGs. No identical MLGs were detected from the two southern Cape York populations, which were excluded from further clonality analyses. All NPA populations tested were found to have some level of clonality. The probability of observing identical MLGs within a population under conditions of sexual reproduction was significant in all adult and juvenile age classes (Psex ≤ 0.01, PsexNgen ≤ 0.01, Table 1) suggesting it is very unlikely that these genotypes were identical by chance. Clonality did not uniformly affect the different populations of northern sandalwood with mean proportion of distinct genotypes (G/N) ranging from 0.38 at Injinoo to 0.71 at Somerset East (Table 1). The number of identical MLGs was extensive across the six NPA S. lanceolatum populations (mean = 44.24%, Table 1) with the proportion of clones per population ranging between 28.57 and 61.54% (Table 1). Levels of clonality were variable between the populations. Muttee Heads (33.33%) and Somerset East (28.57%) had the lowest levels of clonality while Bamaga, Injinoo, Seisia and Somerset West all had clonal levels above 43%. Analysis within the context of the age class revealed the juvenile class of S. lanceolatum also had a high proportion of clones (mean = 35.46%, Table S4), with juveniles of Bamaga and Injinoo found to have over 42% of samples with identical genotypes and Seisia juveniles having low a proportion of clonality at 14.28%. The range of ramets was also variable across the populations with clonality. Bamaga and Injinoo contained over 20 ramets each from five genets. Seisia, which had a similar number of individuals to Bamaga and Injinoo, had 12 ramets from four genets (Table 1). Somerset West and East had similar ratios of ramets to genets, with both populations containing three genets with eight to six ramets, respectively. Muttee Heads had the smallest number of ramets (four) from one genet. There were no genets or ramets shared across populations which was expected due to the significant man-made and natural physical barriers and distance between population sites. Genet to ramet ratios between age classes suggested a small increase in clonality between generations with the mean number of genets between adults being 2.17 and juveniles being 3.67. The mean number of ramets was 7.17 for adults and 10.67 for juveniles.

3.3. Genetic Diversity

The mean number of alleles per locus (A) across all S. lanceolatum populations was 3.021 for adult trees and 2.889 for the juveniles (Table 2). Correction for variable sampling size via rarefaction resulted in adjusted mean allelic richness per locus (AR) for the adult populations of 2.476 and 2.640 for juvenile populations. When assessing total alleles at the population level, Bamaga, Seisia, Injinoo and Somerset East had a total count of alleles ranging from 41 to 47 each. Somerset West and Muttee Heads were considerably lower with 30 and 31 total alleles, respectively.
Adult population measures of observed heterozygosity (HO) ranged from relatively low (0.313) to moderate (0.563), with a relatively low mean HO of 0.440, with similar levels of expected heterozygosity (HE), which ranged from 0.349 to 0.496 for a mean HE of 0.428 measured under HWE conditions (Table 2). Subsequently, when averaged across all S. lanceolatum adult populations, the mean fixation index (F = −0.003) showed no evidence of inbreeding. However, when assessed at the population level, Seisia and Rocky Creek had relatively high inbreeding levels of 0.128 and 0.148, respectively.
Measures of observed (HO = 0.352–0.476, mean = 0.410) and expected heterozygosity (HE = 0.411–0.428; mean = 0.427) were relatively low across all three juvenile northern sandalwood populations (Table 2). Combined with the relatively low number of alleles per locus (A), low allelic richness and private allelic richness (AR and PAR), we determined that overall levels of genetic diversity were also low in all juvenile populations. The similar HO and HE results for the juvenile groups were also reflected in the low combined mean fixation index (F = 0.021), indicating overall negligible levels of inbreeding with the exception of the Injinoo juveniles, which had a high inbreeding level (F = 0.158).
Mean private allelic richness per locus (PAR) for all S. lanceolatum populations was 0.320 with 24 private alleles detected at six of the eight populations surveyed with a frequency between 0.022 and 0.500 (Table S5). Three private alleles were detected in the most isolated NPA populations of Somerset West and two at Somerset East. Six private alleles were detected at the Seisia population: one at Injinoo and no private alleles at Bamaga or Muttee Heads. The greater number of private alleles observed in the Seisia population compared to all other NPA populations indicated stronger interpopulation variation in allelic composition for this site.

3.4. Population Structure and Progeny Dynamics

3.4.1. Genetic Differentiation

Analysis of molecular variance (AMOVA) for combined age-class populations found 64% of the genetic variation was within individuals, 24% among populations and 12% among individuals (Table S6). Adult to juvenile population genetic variation was 74% within individuals, 15% among populations and 11% among individuals.
The mean pairwise population FST value of all S. lanceolatum populations was 0.242 (Table 3). Pairwise population values were all significantly different from zero (p ≤ 0.001) and ranged from a minimum differentiation level (FST = 0.047) between two of the geographically closest populations in the NPA (Bamaga and Injinoo), to a maximum level of differentiation (FST = 0.372) between West and East Somerset, indicating a higher level of genetic differentiation. Differentiation was relatively high between all the pairwise comparisons of the two southern Cape York populations and NPA populations with FST values ranging between 0.268 and 0.373.
Neighbour Joining (NJ) tree cluster analysis (Figure 2) displayed five (Bamaga, Seisia, Injinoo, Muttee Heads and Somerset West) of the six NPA S. lanceolatum populations with relatively close genetic profiles. Seisia had a high bootstrap support (>88%) for this population that was different from Muttee Heads and Somerset West. However, generally it appears the three geographically proximate populations of Bamaga, Seisia and Injinoo are clustered together with a moderate bootstrap support (72) of difference between Bamaga and Injinoo from Seisia. Muttee Heads appeared to be genetically divergent from all other NPA populations, with Somerset West showing a weak bootstrap support of difference from the other populations.
Results from the NJ tree confirmed the two southern Cape York populations as genetic outliers while unexpectedly showing that Somerset East had a genetic profile more aligned with these populations situated approximately 750 km south of the NPA. However, this is based on a low bootstrap support (36) of difference. All five additional Santalum species included in the NJ analysis also showed a low bootstrap support (43) of difference from S. lanceolatum.
Principal Coordinates Analysis (PCoA) highlighted separation of the two southern Cape York populations on the first two axes (Figure 3) and at axes one v three (Figure S1). Differences in genetic distance viewed on the PCoA supported the NJ results, with Somerset East overlapping Rocky Creek and Price Creek, with Somerset West and Muttee Heads as relatively discrete clusters on the axes one v three PCoA from the other NPA populations. Eigenvalues for axes 1 vs 2 explained 28.48% of the total genetic variation compared to 26.77% explained at axes 1 vs 3. The total genetic variation explained within the first three axes of the PCoA was 36.99%.
Muttee Heads, Somerset East, Rocky Creek and Price Creek were detected as relatively discrete clusters also in agreement with NJ analysis and concordant with the geographic separation of these three populations. Bamaga individuals were loosely clustered with Injinoo on the PCoA, with some overlap of Seisia. However, Seisia individuals were widely separated with some genetic overlap of Bamaga and Injinoo, which was reflected in the genetic distance of the NJ tree.

3.4.2. Regional Differentiation and Age-Class Structure

Based on the NJ tree and PCoA results, we investigated regional differentiation between the combined central cluster of Bamaga, Injinoo and Seisia, compared to the Somerset group (East and West) and the two southern Cape York populations (Table 4). There was strong differentiation between all combined metapopulations (mean FST = 0.244), indicating regional differentiation between the southern populations and the northern metapopulations of Somerset (0.209) and the central cluster (0.273). There was also strong evidence of differentiation between the central cluster and Somerset (0.209), likely reflecting the large distance and physical barriers between these groups.
The mean pairwise population FST value between adult and juvenile populations was 0.110 (Table 5). Pairwise population values between both Seisia age classes and all other age-class population comparisons were all significantly different from zero (p ≤ 0.002). Comparison of FST values between the juveniles and adults showed a decrease by more than 50%, indicating strong differentiation between some age classes. The minimum level of differentiation (FST = 0.000) was between the Bamaga adults and juveniles, which could be expected for two generations from the same population. A maximum level of differentiation (FST = 0.213) was detected between the Bamaga juveniles and Seisia juveniles (Table 5). This result suggests these two geographically close populations have a high level of genetic differentiation. In fact, the Seisia juveniles had high levels of differentiation (0.131–0.213) in pairwise comparison across all ages class combinations. Surprisingly, moderate levels of differentiation (0.131) were detected between the Seisia adult and juvenile groups, which is reflected in the moderately high inbreeding index (F = 0.111) observed in Table S1.
Bayesian Information Criterion in the Adegenet package (Figure S2) and STRUCTURE validation (Figure S3) identified that the most likely number of genetic groups was K = 4 within the eight S. lanceolatum populations, showing genetic clustering generally aligned with geographical location (Figure S4). Within the K = 4 group, most of the NPA populations had members across three genetic groups. Somerset East was shown to have genetic group membership more aligned with the two populations (Rocky Creek and Price Creek) from southern Cape York. This provides additional support to the NJ tree and PCoA results reflecting Somerset East as not genetically associated with the other NPA populations. The BIC plot output using the snapclust command also showed an ‘Optimal K’ value of 4 and a ‘TRUE K’ value of 6 (K = 6, Figure S3). Therefore, to better understand population structure of S. lanceolatum, admixture barplots were drawn assuming 4 (K = 4) and 6 (K = 6) genetic clusters, in addition to the optima identified ad hoc statistic validated in both STRUCTURE and Adegenet packages.
Results of the bottleneck analysis did not find any evidence (p > 0.05) of recent genetic bottlenecks in any populations of NPA S. lanceolatum.

4. Discussion

There are several key findings from this study, which are highly relevant to the ecology and conservation of S. lanceolatum. Overall, we found a high proportion of clonality and low sexual reproduction, which in combination with low genetic variation may be exacerbating the decline of northern sandalwood populations in the NPA region. There is also evidence to suggest regional genetic differentiation between most northern Cape York and southern Cape York populations. Finally, our results indicated genetic similarity between one population of S. lanceolatum from the NPA and the two southern Cape York populations.
Clonality in the remnant populations of S. lanceolatum in the NPA was more extensive than expected with over 43% of sampled trees shown to be ramets with identical multilocus genotypes to other trees. Somerset West and Injinoo had the highest clonal structure of S. lanceolatum in the NPA, with each population containing over 46% of identical multilocus genotypes to other trees within their respective populations. Somerset West is also moderately genetically divergent from all other northern sandalwood populations probably as a result of long-term isolation from other breeding populations, possibly by distance and physical barriers. Nevertheless, outlying populations such as Somerset may be significant for ongoing preservation as populations for potential speciation events [52]. The Santalum genus is considered to have Australian origins, with some Pacific island sandalwoods thought to be directly divergent from S. lanceolatum [8], further highlighting the conservation significance of this study.
The humid regions of Australia are highly seasonal with over 90% of annual rainfall occurring in the summer period, followed by a distinct dry season where natural and human mediated fires can be frequent. Page et al. (2007) and Lee et al. (2019) reported that the majority of recruitment of S. lanceolatum in Cape York was likely from vegetative reproduction following fire. We found root suckering to be contributing to recruitment in all NPA populations, including the nominal juveniles, which supports the reported lack of seedling regeneration for S. lanceolatum in the NPA. Post-fire vegetative regeneration is a vital life-history strategy for many tropical savanna woody plants with the need to be highly resistant to fire events [53]. Despite the benefits of clonal recruitment, seed production is a vital dispersal strategy to access more suitable environments and reduce competition [54]. Seed production is significantly reduced in small populations of self-incompatible plant species due to limited amounts of outcrossing pollen, which is further restricted by a highly clonal structure [55]. An ex situ pollination experiment showed S. lanceolatum to be generally self-incompatible [26], while a mixed accession, grafted clonal seed orchard of S. lanceolatum trees sourced from across the NPA had abundant fruit production [10]. This suggests the current genetic diversity within northern sandalwood from the NPA is capable of increased seed production when the proportions of outcrossing pollen are increased and disturbance is minimised.
Our data showed 68% of genetic variation was among the S. lanceolatum populations. High levels of among-population variation are common among clonal plant species with extensive clonality, leading to populations that may have a single or few genets [56]. While our results suggest populations have a proportion of unique multilocus genotypes to balance the levels of clonality, in severe cases this can cause sexual reproduction failure [4]. Without sexual reproduction, clonality leads to a monoclonal population, which in the long term can increase the risk of extinction [56]. Consequently, sexual reproduction is often balanced with vegetative propagation in clonal plant species [57]. Our results indicate episodic disturbance from human activities including historical harvesting, frequent fires and grazing from livestock such as horses and cattle are likely compounding the capacity for natural regeneration and recovery of the species. These effects have influenced the level of clonality and may have reduced sexual reproduction potential of NPA S. lanceolatum, which in turn has limited seed production.
Genetic diversity in NPA S. lanceolatum was relatively low, with heterozygosity (HO = 0.35–0.56, HE = 0.35–0.50), allelic richness (AR: 2.50–3.42), private allelic richness and frequency of private alleles consistently low across all populations. These diversity measures were similar to the closely related S. insulare (HO: 0.29–0.48, HE: 0.28–0.69, AR: 2.04–5.72), which reported extensive clonality across all populations, with some populations comprised entirely of multiple ramets from a single genet. Despite the low diversity in our study, we found that the two populations on the northern (Somerset West) and southern periphery (Muttee Heads) of the NPA were genetically distinct from the three geographically clustered populations of Bamaga, Seisia and Injinoo.
A wide-ranging review into the genetic diversity of Australian flora [58] presented a number of considerations relevant to the S. lanceolatum populations in the NPA. Importantly, plants in the Australian tropical biome were found to generally have low genetic diversity as a result of life-history strategies, biogeographical factors from climate oscillations and expansion of arid zones more than two million years ago during the Pleistocene [58]. While these factors also influenced plant species in the western and eastern biomes, it was more pronounced in the northern tropical biome and resulted in extreme range contraction to the edges of the continent [58]. This may support the results of higher diversity measures (Na: 7.818, HE: 0.68), of the extensively harvested Western Australian sandalwood (S. spicatum) [32], compared to populations of S. lanceolatum. Genetic diversity appears to vary considerably between sandalwood species. Studies of Indian sandalwood generally report variable diversity of S. album depending on the study location [3,59], with some evidence of clonal structure found among natural populations [22,60]. Inconsistent reporting of diversity measures associated with differing molecular techniques makes direct comparisons difficult. However, the authors of [61] reported low diversity (2–3 alleles per locus and HE = 0.047) from Australian S. album populations, while one population from India was reported to have high diversity based on the high frequency of amplified polymorphic DNA bands on UV visualized agarose gels. In contrast to other widely exploited sandalwoods, genetic diversity of S. austrocaledonicum from islands in the New Caledonian archipelago had more variability in genetic diversity measures (NA = 7.28–16, HE = 0.12–0.79), depending on the island [62]. Santalum insulare from French Polynesian islands (NA = 8.75, HE = 0.28–0.55, [2]) and S. yasi from Fijian and Tongan Islands (NA = 2.88, HE = 0.27–0.40, [63]) had similar diversity features to S. lanceolatum in the NPA. The only other genetic study to use microsatellites on S. lanceolatum populations did not disclose diversity measures at the population level or sampling location but was informative in describing a high level of clonality in two out of ten populations investigated [17]. Markers optimised by [17] for northern sandalwood had HE levels between 0.37 and 0.80 and was the first study to report marker diversity for S. lanceolatum. Despite sampling locations not being reported, the higher levels of heterozygosity compared to our findings provide baseline data to support the fact that NPA populations may be in genetic decline.
The low diversity levels found in our study may be supported by several factors in common with the highly clonal populations of S. leptocladum from Victoria, Australia, and S. insulare from the Pacific region. These are: (1) the small and fragmented nature of populations has enhanced the rate of genetic erosion through loss of alleles from genetic drift; (2) overharvesting in the late 19th to the early 20th century caused a rapid loss of S. lanceolatum resources in the NPA [1], potentially exacerbating a genetic decline; (3) the evidence indicating a significant clonal structure is potentially resulting in limited sexual reproduction [4]; and finally, (4) the overall population decline may be further increased by fire and browsing by free roaming livestock, which can reduce natural seed based regeneration [1] and potential for improvement of genotypic diversity.
Within the adult S. lanceolatum populations, the mean FST indicated that the overall levels of population level genetic differentiation were relatively high (0.242) when compared to another economically important, threatened dry tropical plant species such as frankincense (Boswellia papyrifera), which had a mean FST value of 0.084 [64]. Differentiation is variable among the commercially valuable sandalwood species. Dani et al. (2011) observed high mean FST values (0.549) in three S. album populations with some clonal structures, though clonal levels were not reported. Santalum insulare, which was highly clonal (58%), had high differentiation (mean FST = 0.50) between populations in French Polynesian islands, which is thought to be due to limited geneflow and overexploitation [2]. Santalum spicatum has a long history of commercial extraction of natural populations with low differentiation at the species level (0.087) and strong regional differentiation [11]. The relatively low and consistent differentiation between the NPA populations of Bamaga, Injinoo and Seisia (0.047–0.121) between the three geographically centralised suggest these populations once formed part of a larger, more continuous population prior to historical climate fluctuations and more anthropogenic disturbance. Conversely, our results indicated that populations on the northern (Somerset) and southern (Muttee Heads) periphery could be genetically distinct from the other NPA populations. There are a number of factors likely influencing limited observations of differentiation between the three proximate populations of Bamaga, Seisia and Injinoo compared to the more geographically isolated populations. As S. lanceolatum is pollinated by small insects [10], the potential for effective pollen dispersal from the central populations to the three peripheral populations would be limited due to the large distances and physical barriers such as wetlands, watercourses and small outcrops to the outlying populations. The Carnegie Range and associated rainforest vegetation lies between Somerset populations and the three central populations. Similarly, Cowel Creek and its associated mangrove system (300–400 m wide) may be isolating the Muttee Heads population. Further, the three central NPA populations are all proximate to local towns, which may explain the reports of fires over successive years [10], including during the sampling period in this study. These frequent fires may influence pollinator populations, limiting the dispersal potential outside this main cluster of S. lanceolatum populations. Fires in isolated populations can also have adverse genetic consequences, causing genetic bottlenecks and leading to increased genetic erosion [28]. Finally, while low levels of FST can infer low differentiation, this may be a historical feature, reflecting the structure of a larger, more connected metapopulation under minimal selection pressure before the current populations were fragmented and reduced in size through anthropogenic activities. There are numerous reports of species of Australian flora, with low levels of genetic diversity that are highly adapted to efficiently survive in narrow ecological niches [65,66]. Conclusions drawn from the levels of differentiation must therefore be tempered with the small population sizes and low genetic variation found in this study.
Our population genetic structure results highlighted the three central populations are genetically similar. Conversely, Somerset West and Muttee Heads appear to be genetically distinct from this central group but are still part of the broader NPA population group. Somerset East was an outlier of this group, with the PCoA and the NJ tree suggesting that Somerset East may be a genetic relative of S. lanceolatum from southern Cape York. It is plausible that Somerset East is an artefact population that was grown from seed or plant material transported from outside the NPA. Alternatively, the genetics of the Somerset East population may suggest that there are two distinct Santalum genotypes found in the greater Cape York area. In the adult age class, Seisia had a relatively low clonal structure (16%), indicating that this population may have historically contributed a disproportionate amount of geneflow between some populations. This could be another insight into what may have been a relatively similar structure before the current fragmentation and decline of populations. Muttee Heads is relatively genetically distinct with weak associations with Seisia and Injinoo. Seisia appears to have limited genetic relationships with Injinoo and Bamaga despite the population’s close proximity and lack of physical barriers limiting geneflow, suggesting pollen/seed dispersal has been restricted to the more coastal populations. Somerset East showed virtually no evidence of genetic association with the west coast populations. Interestingly, Somerset is mentioned in previous studies as an area where trees were commercially wild harvested for export [20], suggesting a larger population existed before harvesting commenced and then depleted to a level where only a limited number of individuals (possibly non-commercial size trees and seedlings) remained. To investigate more precise relationships influencing geneflow, a thorough paternal analysis would be required by collecting wild seed. However, seed production across this species in the NPA is limited, with only nine seeds collected over a 3-year period [10].
Generally, our results showed an overall negligible level of inbreeding despite the small number of trees found in the NPA and the isolation of populations. However, a number of studies have reported self-incompatible breeding mechanisms from S. lanceolatum [4,26], which could explain our observations of limited inbreeding values. The limited homozygote excess observed in most populations may be a result of low natural recruitment as a result of frequent fires destroying seedlings, together with a clonal structure. However, FST was relatively high between some age classes, for example, between Seisia adults and juveniles (FST = 0.131), which indicates a recent increase in the extent of drift, causing greater genetic structure among juveniles than was operating on the adult cohort. Seisia is a site observed to be burnt frequently [10] with repeated, intense fires, which may be interrupting flowering and fruiting cycles limiting effective geneflow between unrelated individuals [51]. This is supported by the mean PAR, which was significantly lower in the juvenile class. Therefore, while the overall evidence for inbreeding or loss of diversity is low between generations, the PAR result (reflected in the FST) might provide initial evidence of genetic erosion. Finally, in the context of age class, our results indicated a significant proportion of reproduction is vegetative with over 35% of juvenile trees from asexual reproduction. It may be that the clonal structure of northern sandalwood in the NPA is one feature of a complex life-history strategy to avoid mating between closely related individuals and persistence in an environment under frequent disturbance.
There are several conservation implications that have been identified in this study. One of the most significant findings is the extensive clonal structure of S. lanceolatum in the NPA which may place the species at significant risk in this region. Fire is reported to have impacted adult northern sandalwood trees in the NPA with an overall 19% decline of the regional population of northern sandalwood over the last 8 years [10]. If a severe event were to destroy more mature plants within these populations, the probability of pollen dispersal between unique genets would continue to decrease. The small population size and fragmented distribution of these populations would exacerbate this effect with increases in clonal propagation, decreases in sexual reproduction, further loss of genetic variation, and continued population decline expected. With this is mind, it is unlikely protecting these populations from further human mediated impacts alone will improve seed production and natural regeneration of the species. With the potential for five out of the six northern sandalwood populations in the NPA to be genetically distinct from other northern sandalwood populations, there is evidence to support conservation measures of what may be a genetically unique species.
Therefore, we believe a range of conservation strategies are necessary for northern sandalwood in the NPA. We recommend a genetic translocation program as per [67] that captures 95% of the alleles from multiple source populations. This genetic material can be used to develop seedling stock to be replanted following genetic rescue guidelines [67] into remnant source populations to increase genetic diversity and ultimately sexual reproduction of S. lanceolatum in the NPA. As wild-open pollinated seed is scarce for this species, a clonal seed orchard is the suggested method of producing seedling stock for enrichment plantings into recipient populations.
Specifically, we recommend that the three central populations of Seisia, Bamaga and Injinoo, which are genetically closely related, which likely once formed a larger, continuous population of S. lanceolatum, should be the focus of the initial genetic translocation. Together, these three populations contain 56% (132 out of 234 alleles) of the alleles identified in this study, but only 42–47 alleles in each population. Target genotypes from these three populations should be selected to ensure that 95% of the genetic diversity found in these three combined populations is captured and subsequently distributed within each population to increase local population genetic diversity by 20%. We also recommend that Muttee Heads and Somerset West populations should be managed separately as a conservation priority as there is evidence to suggest they are differentiated from the three central populations. The genetic bank that would result via the initial genetic capture would not only help to protect NPA S. lanceolatum, but would also allow further research aiming to conserve the species. The urgency of these activities is highlighted by the fact that since our study was completed, the Somerset East population has been badly damaged by land clearing during a road-widening project in the area.
Several studies have identified important phylogenetic relationships of the Santalum taxa [16,68]. However, there is evidence from our study to suggest the taxonomy of S. lanceolatum may not yet be resolved and warrants further investigation. Our results indicate that Somerset East may not be a genetic representative of S. lanceolatum from the NPA. All analyses highlight that Somerset East has a genetic profile closely related to southern Cape York populations. This is especially surprising given that Somerset West is only 5.5 km to the west of Somerset East. The PCoA, NJ tree and genetic group cluster analyses highlighted that the five other NPA populations (Bamaga, Seisia, Injinoo, Muttee Heads and Somerset West) may form yet another cryptic, distinct species within the Santalum lanceolatum clade. However, acknowledging the limitations of inferring phylogeny from microsatellite markers, we suggest clearer conclusions of the genetic relationships of S. lanceolatum both in the context of the species and the genus, additional analyses from multiple populations across a much broader range of northern Australia, using genome-wide markers such as SNPs is required.

5. Conclusions

Santalum lanceolatum is a sub-canopy tree found across northern tropical Australia and is of significant scientific and commercial interest. Using twelve microsatellite markers, we found relatively low levels of genetic diversity and a high degree of clonality (>50%) across six remnant populations from the Northern Peninsula Area of Cape York, Australia. There was little evidence of inbreeding, with moderate genetic differentiation detected between the most geographically isolated populations and strong differentiation between two proximate populations at the northern limit of the species range. There is also evidence to suggest some populations of S. lanceolatum in the NPA may be genetically distinct. The genetic structure of the NPA sandalwood populations is likely a result of significant disturbance from human activities, including intense harvesting pressure, with more recent effects of livestock browsing and fire preventing natural seed sourced regeneration. Results from this study further emphasise the case for a conservation and management strategy for S. lanceolatum in the NPA to preserve this culturally and commercially significant resource. Hence, we recommend a genetic capture and rescue strategy to enhance genetic diversity, increase the sexual reproductive potential of S. lanceolatum populations in the NPA and ultimately aid in the recovery of the species. Overall, this research has provided important knowledge on the effects historical and recent anthropogenic activities have had on S. lanceolatum in the Northern Peninsula Area of Cape York, Australia.

Supplementary Materials

The following are available online at https://www.mdpi.com/article/10.3390/f12060741/s1, Figure S1: Principal coordinates analysis (PCoA) of eight Santalum lanceolatum populations using axes 1 and 3 of genetic distance matrices. Eigenvalues at axes 1 and 3 explain 26.77% of variation, Figure S2: Bayesian Information Criterion (BIC) plot from the snapclust command (Adegent, R) displaying BIC values for increasing values of K for eight Santalum lanceolatum populations. The blue dot indicates ‘optimal k’, dashed red line indicates ‘true k’, Figure S3: Output of STRUCTURE validation for increasing values of K for optimal group selection for eight Santalum lanceolatum populations, Figure S4: Individual admixture coefficients at K = 4–6 within and between eight Santalum lanceolatum populations from Cape York (Queensland, Australia) inferred using a discriminant analysis of principal components (DAPC). MH = Muttee Heads; SW = Somerset West; SE = Somerset East; RC = Rocky Creek. Table S1: List of 22 Santalum sp. microsatellite markers (primers) screened for cross-amplification with Santalum lanceolatum, Table S2: Summary of Micro-checker and ML_NULLFREQ analysis across 13 loci and eight population of Santalum lanceolatum Table S3: Characterization of twelve microsatellite loci isolated from 135 unique multilocus genotypes of Santalum lanceolatum from the Northern Peninsula Area (NPA) of Cape York (Queensland, Australia), Table S4: Summary of clonal measures between adult and juvenile Santalum lanceolatum populations across the Northern Peninsula Area (NPA), Cape York (Queensland, Australia), Table S5: Summary of private alleles from Cape York (Queensland, Australia) Santalum lanceolatum populations. Table S6: Summary of Wrights F-statistics between all combined age class populations and adult v juvenile Cape York (Queensland, Australia) populations of Santalum lanceolatum.

Author Contributions

Conceptualisation, A.B., D.J.L. and S.O.; data curation, A.B. and G.C.; formal analysis, A.B., G.C. and S.O.; funding acquisition, D.J.L.; investigation, D.J.L., G.C. and S.O.; methodology, A.B., D.J.L., G.C. and S.O.; project administration, S.O.; resources, S.O.; software, S.O.; supervision, D.J.L. and S.O.; writing—original draft, A.B.; writing—review and editing, A.B., D.J.L., G.C. and S.O. All authors have read and agreed to the published version of the manuscript.

Funding

This research was partially funded by ACIAR Project FST/2014/069 and the University of the Sunshine Coast.

Data Availability Statement

The data presented in this study are available in the body of the article and additional Supplementary Materials.

Acknowledgments

We thank the traditional owners of the NPA the Gudang/Yadhaykenu people: Nicholas Thompson (Deputy Chairman of the Ipima Ikaya Aboriginal Corporation RNTBC), Alex Wymarra, Brendon Wymarra and Meun Lifu Uncle Shorty for permission to undertake this study. As such, precise locations of sampling sites have not been published to respect the cultural significance of northern sandalwood in the NPA. We also thank Anthony Burridge for field assistance and Robert Lamont for technical support.

Conflicts of Interest

The authors declare no conflict of interest. The funders had no role in the design of the study; in the collection, analyses, or interpretation of data; in the writing of the manuscript, or in the decision to publish the results.

References

  1. Applegate, G.B.; Davis, A.G.; Annable, P.; Hamilton, L.; Conrad, C. Eugene, technical coordinators. In Proceedings of the Symposium on Sandalwood in the Pacific, Honolulu, Hawaii, 9–11 April 1990; Gen. Tech. Rep. PSW-GTR-122. Pacific Southwest Research Station, Forest Service, US Department of Agriculture: Berkeley, CA, USA, 1990; pp. 12–18. [Google Scholar]
  2. Lhuillier, E.; Butaud, J.F.; Bouvet, J.M. Extensive clonality and strong differentiation in the insular Pacific tree Santalum insulare: Implications for its conservation. Ann. Bot. 2006, 98, 1061–1072. [Google Scholar] [CrossRef] [PubMed]
  3. Ravikanth, G.; Nageswara Rao, M.; Ganeshaiah, K.N.; Uma Shaanker, R. Genetic diversity of NTFP species: Issues and implications. In Non-Timber Forest Products Conservation, Management and Policies; Uma Shaanker, R., Hiremath, A.J., Joseph, G.C., Rai, N., Eds.; Ashoka Trust for Research in Ecology and Environment, Bangalore and Forestry Research Support Program for Asia and the Pacific, Food and Agriculture Organisation: Bangkok, Thailand, 2009; pp. 53–64. [Google Scholar]
  4. Warburton, C.L.; James, E.A.; Fripp, Y.J.; Trueman, S.J.; Wallace, H.M. Clonality and sexual reproductive failure in remnant populations of Santalum lanceolatum (Santalaceae). Biol. Conserv. 2000, 96, 45–54. [Google Scholar] [CrossRef]
  5. Wakeling, J.L.; Bond, W.J. Disturbance and the frequency of root suckering in an invasive savanna shrub. Dichrostachys cinerea. Afr. J. Range Forage Sci. 2007, 24, 73–76. [Google Scholar] [CrossRef]
  6. Bona, A.; Kulesza, U.; Jadwiszczak, K.A. Clonal diversity, gene flow and seed production in endangered populations of Betula humilis Schrk. Tree Genet. Genomes 2019, 15, 50. [Google Scholar] [CrossRef] [Green Version]
  7. Dering, M.; Chybicki, I.J.; Rączka, G. Clonality as a driver of spatial genetic structure in populations of clonal tree species. J. plant Res. 2015, 128, 731–745. [Google Scholar] [CrossRef]
  8. Harbaugh, D.T.; Baldwin, B.G. Phylogeny and biogeography of the sandalwoods (Santalum, Santalaceae): Repeated dispersals throughout the Pacific. Am. J. Bot. 2007, 94, 1028–1040. [Google Scholar] [CrossRef]
  9. Huish, R.D.; Faka’osi, T.; Likiafu, H.; Mateboto, J.; Huish, K.H. Distribution, population structure, and management of a rare sandalwood (Santalum yasi, Santalaceae) in Fiji and Tonga. Pac. Conserv. Biol. 2015, 21, 27–37. [Google Scholar] [CrossRef] [Green Version]
  10. Lee, D.J.; Burridge, A.J.; Page, T.; Huth, J.R.; Thompson, N. Domestication of northern sandalwood (Santalum lanceolatum, Santalaceae) for Indigenous forestry on the Cape York Peninsula. Aust. For. 2019, 82, 14–22. [Google Scholar] [CrossRef] [Green Version]
  11. Byrne, M.; MacDonald, B.; Broadhurst, L.; Brand, J. Regional genetic differentiation in Western Australian sandalwood (Santalum spicatum) as revealed by nuclear RFLP analysis. Theor. Appl. Genet. 2003, 107, 1208–1214. [Google Scholar] [CrossRef]
  12. Kumar, A.N.A.; Joshi, G.; Ram, H.M. Sandalwood: History, uses, present status and the future. Curr. Sci. 2012, 103, 1408–1416. [Google Scholar]
  13. Rao, M.N.; Soneji, J.R.; Sudarshana, P. Wild Crop. Relatives: Genomic and Breeding Resources; Springer: Berlin/Heidelberg, Germany, 2011; pp. 131–144. [Google Scholar]
  14. Rashkow, E.D. Perfumed the axe that laid it low: The endangerment of sandalwood in southern India. Indian Econ. Soc. Hist. Rev. 2014, 51, 41–70. [Google Scholar] [CrossRef]
  15. Tonts, M.; Selwood, J. Niche Markets, Regional Diversification and the Reinvention of Western Australia’s Sandalwood Industry. J. Econ. Soc. Geogr. 2003, 94, 564–575. [Google Scholar] [CrossRef]
  16. Harbaugh, D.T. A taxonomic revision of Australian northern sandalwood (Santalum lanceolatum, Santalaceae). Aust. Syst. Bot. 2007, 20, 409–416. [Google Scholar] [CrossRef]
  17. Jones, B.L.; Waycott, M.; Robson, H.L.; Calladine, A.; Page, T. Isolation and characterization of microsatellite loci in Santalum lanceolatum and Santalum leptocladum (Santalaceae). Am. J. Bot. 2010, 97, e97–e98. [Google Scholar] [CrossRef] [Green Version]
  18. Applegate, G.; McKinnell, F. Aciar Proceedings; CPN Publications; Australian Centre for International Agricultural Research: Canberra, Australia, 1993; p. 5.
  19. Page, T.; Southwell, I.; Russell, M.; Leakey, R. Evaluation of heartwood and oil characters in seven populations of Santalum lanceolatum from Cape York. In Proceedings of the Regional Workshop on Sandalwood Research, Development and Extension in the Pacific Islands and Asia, Nada, Fiji, 28 November–1 December 2005. [Google Scholar]
  20. Wharton, G. History Transmitted: Connect–consider–challenge. In Proceedings of the Professional Historians Association Queensland Conference, St Lucia, Queensland, Australia, 3–4 September 2009; pp. 21–42. [Google Scholar]
  21. Ralls, K.; Ballou, J.D.; Dudash, M.R.; Eldridge, M.D.B.; Fenster, C.B.; Lacy, R.C.; Sunnucks, P.; Frankham, R. Call for a paradigm shift in the genetic management of fragmented populations. Conserv. Lett. 2018, 11, e12412. [Google Scholar] [CrossRef]
  22. Dani, K.S.; Ravikumar, P.; Kumar, R.P.; Kush, A. Genetic variation within and among small isolated populations of Santalum album. Biol. Plant 2011, 55, 323–326. [Google Scholar] [CrossRef]
  23. James, E.A.; McDougall, K.L. Spatial genetic structure reflects extensive clonality, low genotypic diversity and habitat fragmentation in Grevillea renwickiana (Proteaceae), a rare, sterile shrub from south-eastern Australia. Ann. Bot. 2014, 114, 413–423. [Google Scholar] [CrossRef] [PubMed] [Green Version]
  24. Eckert, C.G. Contributions of autogamy and geitonogamy to self-fertilization in a mass-flowering, clonal plant. Ecology 2000, 81, 532–542. [Google Scholar] [CrossRef]
  25. Veerendra, H.S.; Padmanabha, H.A. The breeding system in sandal (Santalum album L.). Silvae Genet. 1996, 45, 188–189. [Google Scholar]
  26. Tamla, H.; Cornelius, J.; Page, T. Reproductive biology of three commercially valuable Santalum species: Development of flowers and inflorescences, breeding systems, and interspecific crossability. Euphytica 2012, 184, 323–333. [Google Scholar] [CrossRef]
  27. Finger, A.; Kettle, C.J.; Kaiser-Bunbury, C.N.; Valentin, T.; Doudee, D.; Matatiken, D.; Ghazoul, J. Back from the brink: Potential for genetic rescue in a critically endangered tree. Mol. Ecol. 2011, 20, 3773–3784. [Google Scholar] [CrossRef] [PubMed]
  28. Aravanopoulos, F.A.; Alizoti, P.G. Forests of Southeast. Europe Under a Changing Climate; Springer: Berlin/Heidelberg, Germany, 2019; pp. 449–457. [Google Scholar]
  29. Bureau of Meteorology. Average Annual, Seasonal and Monthly Rainfall. Available online: http://www.bom.gov.au/jsp/ncc/climate_averages/rainfall/index.jsp (accessed on 26 February 2019).
  30. Bottin, L.; Vaillant, A.; Sire, P.; Cardi, C.; Bouvet, J.M. Isolation and characterization of microsatellite loci in Santalum austrocaledonicum, Santalaceae. Mol. Ecol. Notes 2005, 5, 800–802. [Google Scholar] [CrossRef]
  31. Lhuillier, E.; Vaillant, A.; Bataud, J.F.; Bouvet, J.M. Isolation and characterization of microsatellite loci in Santalum insulare, Santalaceae. Mol. Ecol. Notes 2006, 6, 653–655. [Google Scholar] [CrossRef]
  32. Millar, M.; Byrne, M.; Barbour, E. Characterisation of eleven polymorphic microsatellite DNA markers for Australian sandalwood (Santalum spicatum) (R. Br.) A. DC. (Santalaceae). Conserv. Genet. Resour. 2012, 4, 51–53. [Google Scholar] [CrossRef]
  33. Peakall, R.; Smouse, P. GENALEX. “6: Genetic analysis in Excel. Population genetic software for teaching and research”. Bioinformatics 2012, 28, 19. [Google Scholar] [CrossRef] [PubMed] [Green Version]
  34. Ivey, C.T.; Richards, J.H. Genotypic diversity and clonal structure of everglades sawgrass, Cladium jamaicense (Cyperaceae). Int. J. Plant Sci. 2001, 162, 1327–1335. [Google Scholar] [CrossRef]
  35. Kamvar, Z.N.; Tabima, J.F.; Grünwald, N.J. Poppr: An R package for genetic analysis of populations with clonal, partially clonal, and/or sexual reproduction. PeerJ 2014, 2, e281. [Google Scholar] [CrossRef] [PubMed] [Green Version]
  36. Bailleul, D.; Stoeckel, S.; Arnaud-Haond, S. RClone: A package to identify MultiLocus Clonal Lineages and handle clonal data sets in r. Methods Ecol. Evol. 2016, 7, 966–970. [Google Scholar] [CrossRef] [Green Version]
  37. Kalinowski, S.T.; Taper, M.L.; Marshall, T.C. Revising how the computer program CERVUS accommodates genotyping error increases success in paternity assignment. Mol. Ecol. 2007, 16, 1099–1106. [Google Scholar] [CrossRef]
  38. Goudet, J. FSTAT, a Program to Estimate and Test GENE Diversities and Fixation Indices, Version 2.9.3. 2001. Available online: http://www2.unil.ch/popgen/softwares/fstat.htm (accessed on 1 March 2019).
  39. Van Oosterhout, C.; Hutchinson, W.F.; Wills, D.P.; Shipley, P. MICRO-CHECKER: Software for identifying and correcting genotyping errors in microsatellite data. Mol. Ecol. Notes 2004, 4, 535–538. [Google Scholar] [CrossRef]
  40. Kalinowski, S.T.; Taper, M.L. Maximum likelihood estimation of the frequency of null alleles at microsatellite loci. Conserv. Genet. 2006, 7, 991–995. [Google Scholar] [CrossRef]
  41. Dąbrowski, M.J.; Bornelöv, S.; Kruczyk, M.; Baltzer, N.; Komorowski, J. ‘True’null allele detection in microsatellite loci: A comparison of methods, assessment of difficulties and survey of possible improvements. Mol. Ecol. Resour. 2015, 15, 477–488. [Google Scholar] [CrossRef]
  42. Wright, S. The interpretation of population structure by F-statistics with special regard to systems of mating. Evolution 1965, 19, 395–420. [Google Scholar] [CrossRef]
  43. Kalinowski, S.T. hp-rare 1.0: A computer program for performing rarefaction on measures of allelic richness. Mol. Ecol. Notes 2005, 5, 187–189. [Google Scholar] [CrossRef]
  44. Jombart, T.J.B. Adegenet: An R package for the multivariate analysis of genetic markers. Bioinformatics 2008, 24, 1403–1405. [Google Scholar] [CrossRef] [PubMed] [Green Version]
  45. Beugin, M.P.; Gayet, T.; Pontier, D.; Devillard, S.; Jombart, T. A fast likelihood solution to the genetic clustering problem. Methods Ecol. Evol. 2018, 9, 1006–1016. [Google Scholar] [CrossRef] [PubMed] [Green Version]
  46. Pritchard, J.K.; Stephens, M.; Donnelly, P.J.G. Inference of population structure using multilocus genotype data. Genetics 2000, 155, 945–959. [Google Scholar] [CrossRef]
  47. Evanno, G.; Regnaut, S.; Goudet, J. Detecting the number of clusters of individuals using the software STRUCTURE: A simulation study. Mol. Ecol. 2005, 14, 2611–2620. [Google Scholar] [CrossRef] [Green Version]
  48. Wickham, H. ggplot2. Wiley Interdiscip. Rev. Comput. Stat. 2011, 3, 180–185. [Google Scholar] [CrossRef]
  49. Paradis, E.; Claude, J.; Strimmer, K. APE: Analyses of phylogenetics and evolution in R language. Bioinformatics 2004, 20, 289–290. [Google Scholar] [CrossRef] [Green Version]
  50. Nei, M. Estimation of average heterozygosity and genetic distance from a small number of individuals. Genetics 1978, 89, 583–590. [Google Scholar] [CrossRef]
  51. Piry, S.; Luikart, G.; Cornuet, J.M. Computer note. BOTTLENECK: A computer program for detecting recent reductions in the effective size using allele frequency data. J. Hered. 1999, 90, 502–503. [Google Scholar] [CrossRef]
  52. Lesica, P.; Allendorf, F.W. Ecological genetics and the restoration of plant communities: Mix or match? Restor. Ecol. 1999, 7, 42–50. [Google Scholar] [CrossRef]
  53. Williams, R.; Cook, G.; Gill, A.; Moore, P. Fire regime, fire intensity and tree survival in a tropical savanna in northern Australia. Aust. J. Ecol. 1999, 24, 50–59. [Google Scholar] [CrossRef]
  54. Price, E.A.; Marshall, C. Clonal plants and environmental heterogeneity—An introduction to the proceedings. Plant Ecol. 1999, 141, 3–7. [Google Scholar] [CrossRef]
  55. Charpentier, A. Consequences of clonal growth for plant mating. Evol. Ecol. 2001, 15, 521–530. [Google Scholar] [CrossRef]
  56. Rossetto, M.; Gross, C.; Jones, R.; Hunter, J. The impact of clonality on an endangered tree (Elaeocarpus williamsianus) in a fragmented rainforest. Biol. Conserv. 2004, 117, 33–39. [Google Scholar] [CrossRef]
  57. Meloni, M.; Reid, A.; Caujapé-Castells, J.; Marrero, A.; Fernández-Palacios, J.M.; Mesa-Coelo, R.A.; Conti, E. Effects of clonality on the genetic variability of rare, insular species: The case of Ruta microcarpa from the Canary Islands. Ecol. Evol. 2013, 3, 1569–1579. [Google Scholar] [CrossRef] [Green Version]
  58. Broadhurst, L.; Breed, M.; Lowe, A.; Bragg, J.; Catullo, R.; Coates, D.; Encinas-Viso, F.; Gellie, N.; James, E.; Krauss, S.; et al. Genetic diversity and structure of the Australian flora. Divers. Distrib. 2017, 23, 41–52. [Google Scholar] [CrossRef] [Green Version]
  59. Azeez, S.A.; Nelson, R.; Prasadbabu, A.; Rao, M.S. Genetic diversity of Santalum album using random amplified polymorphic DNAs. Afr. J. Biotechnol. 2009, 8, 2943–2947. [Google Scholar]
  60. Indrioko, S.; Ratnaningrum, Y.W. Habitat loss caused clonality, genetic diversity reduction and reproductive failure in Santalum album (Santalaceae), an endangered endemic species of Indonesia. Procedia Environ. Sci. 2015, 28, 657–664. [Google Scholar] [CrossRef] [Green Version]
  61. Jones, C.G.; Plummer, J.A.; Barbour, E.L.; Byrne, M. Genetic diversity of an Australian Santalum album collection–implications for tree improvement potential. Silvae Genet. 2009, 58, 279–286. [Google Scholar] [CrossRef] [Green Version]
  62. Bottin, L.; Verhaegen, D.; Tassin, J.; Olivieri, I.; Vaillant, A.; Bouvet, J.M. Genetic diversity and population structure of an insular tree, Santalum austrocaledonicum in New Caledonian archipelago. Mol. Ecol. 2005, 14, 1979–1989. [Google Scholar] [CrossRef] [PubMed] [Green Version]
  63. Bush, D.; Thomson, L.; Broadhurst, L.; Dutt, S.; Bulai, P.; Faka’osi, T.; Havea, M.; Napa’a, S.; Vainikolo, L. Assessing Genetic Diversity of Natural and Hybrid Populations of Santalum yasi in Fiji and Tonga; Australian Centre for International Agricultural Research (ACIAR): Canberra, Australia, 2016.
  64. Addisalem, A.; Bongers, F.; Kassahun, T.; Smulders, M. Genetic diversity and differentiation of the frankincense tree (Boswellia papyrifera (Del.) Hochst) across Ethiopia and implications for its conservation. For. Ecol. Manag. 2016, 360, 253–260. [Google Scholar] [CrossRef]
  65. Lamont, R.; Conroy, G.; Reddell, P.; Ogbourne, S. Population genetic analysis of a medicinally significant Australian rainforest tree, Fontainea picrosperma CT White (Euphorbiaceae): Biogeographic patterns and implications for species domestication and plantation establishment. BMC Plant Biol. 2016, 16, 57. [Google Scholar] [CrossRef] [Green Version]
  66. Conroy, G.C.; Shimizu-Kimura, Y.; Lamont, R.W.; Ogbourne, S.M. A multidisciplinary approach to inform assisted migration of the restricted rainforest tree, Fontainea rostrata. PLoS ONE 2019, 14, e0210560. [Google Scholar] [CrossRef] [PubMed] [Green Version]
  67. Weeks, A.R.; Sgro, C.M.; Young, A.G.; Frankham, R.; Mitchell, N.J.; Miller, K.A.; Byrne, M.; Coates, D.J.; Eldridge, M.D.B.; Sunnucks, P.; et al. Assessing the benefits and risks of translocations in changing environments: A genetic perspective. Evol. Appl. 2011, 4, 709–725. [Google Scholar] [CrossRef] [PubMed] [Green Version]
  68. Fuentes-Cross, P.; Biffin, E.; Waycott, M. Phylogenomics of the Genus Santalum L: Exploring the Sandalwoods Using Next Generation Sequencing. New Approaches to Explore the Past and Present Diversity of Australian Sandalwood Species—From Palaeobotany to Next Generation Sequencing. Ph.D. Thesis, University of Adelaide, Adelaide, Australia, 2015. [Google Scholar]
Figure 1. Main image showing the approximate extent of the Northern Peninsula Area (NPA) region of Cape York (Queensland, Australia), displaying six Santalum lanceolatum sampling locations (green points). Top right map is of Cape York Peninsula (approximate extent of NPA in red) and approximate area (green point) of the two southern populations. Centre right map shows extent of the Cape York Peninsula in red. Bottom right displays the approximate distribution of S.lanceolatum represented by blue points.
Forests 12 00741 g001
Figure 2. Neighbour Joining tree cluster analysis of the eight Cape York (Queensland, Australia) S. lanceolatum populations (indicated on right of tree) and five Santalum congeners. Numbers above branches represent bootstrap support with 999 permutations calculated using Nei’s genetic distance.
Forests 12 00741 g002
Figure 3. Principal coordinates analysis (PCoA) of eight Santalum lanceolatum populations from Cape York (Queensland, Australia) using the axes 1 and 2 of genetic distance matrices. Inset graph represents proportions of Eigenvalues at axes 1 and 2 shown in black, which explain 27.48% of variation.
Forests 12 00741 g003
Table 1. Summary of clonal measures from Santalum lanceolatum populations across the Northern Peninsula Area of Cape York (Queensland, Australia) including all trees classified as either adult or juvenile.
PopulationNGG/N% ClonesNGENRAPsexPsexNgen
Bamaga44240.5545.45520<0.0001<0.0001
Injinoo39150.3861.54524<0.0001<0.0001
Muttee Heads1280.6733.3314<0.0001<0.0001
Seisia46250.5443.19412<0.0001<0.0001
Somerset West1570.4753.3338<0.0001<0.0001
Somerset East21150.7128.5736<0.0001<0.0001
mean29.5015.670.5544.243.5012.33
N—number of sampled trees; G—number of distinct multilocus genotypes; G/N, mean proportion of distinguishable genotypes; NGE—number of genets, NRA—number of ramets within genets; Psex—probability of encountering identical genotype more than once under conditions of sexual reproduction; PsexNgen—probability of finding the MLG in the N sampling units collected and analysed.
Table 2. Summary of genetic measures for the 135 unique MLG individuals sampled from eight populations of S. lanceolatum from Cape York (Queensland, Australia).
Population Age ClassNGAARPARHOHEF
Adults
Bamaga193.3332.7300.1700.4030.4440.084
Injinoo103.4172.9900.0800.3880.4400.086
Muttee Heads72.5832.0400.1300.4550.349−0.243
Seisia213.3332.7500.1400.4420.4610.128
Somerset West42.5002.3900.3100.5630.460−0.208
Somerset East123.4172.1100.5700.4610.383−0.082
Rocky Creek92.5002.1600.3300.3130.3700.148
Price Creek143.7502.6500.8300.5360.496−0.038
mean 3.0212.4760.3200.4400.428−0.003
SE 0.1750.1170.0860.0280.0180.054
Juveniles
Bamaga112.7502.5300.0200.3700.4110.086
Injinoo102.9172.7500.2300.3520.4280.158
Seisia183.2502.6400.4100.4760.420−0.068
mean 2.8892.6400.2200.4100.4270.021
SE 0.1470.0630.1130.0390.0050.067
NG—number of unique MLGs, A—alleles per locus, AR—allelic richness, PAR—private allelic richness, HO—observed heterozygosity, HE—expected heterozygosity, F—inbreeding coefficient.
Table 3. Pairwise population FST values (below diagonal) calculated using Wrights F-statistics between eight populations of S. lanceolatum from Cape York (Queensland, Australia).
BamagaInjinooMuttee HeadsSeisiaSomerset WestSomerset EastRocky CreekPrice Creek
Bamaga0.000
Injinoo0.0470.000
Muttee Heads0.1410.1340.000
Seisia0.1210.0680.1740.000
Somerset West0.1760.1720.3250.2330.000
Somerset East0.3400.2870.2900.3330.3720.000
Rocky Creek0.3170.2680.3080.3140.3550.3190.000
Price Creek0.3620.3250.3250.3620.3730.3190.2280.000
Mean FST = 0.242—p-value above diagonal all ≤ 0.001.
Table 4. Pairwise population FST values (below diagonal) calculated using Wrights F-statistics between regional metapopulations of Santalum lanceolatum from Cape York (Queensland, Australia).
CentralSomersetSouthern
Central0.000
Somerset0.2090.000
Southern0.2730.2090.000
Table 5. Pairwise population FST values (below diagonal) and p-value (above diagonal) calculated using Wrights F-statistics between three adult and juvenile populations of Santalum lanceolatum from the Northern Peninsula Area of Cape York (Queensland, Australia).
Bamaga AdultsBamaga JuvenilesInjinoo AdultsInjinoo JuvenilesSeisia AdultsSeisia Juveniles
Bamaga adults0.0000.4520.1200.0010.0010.001
Bamaga juveniles0.0000.0000.0150.0010.0010.001
Injinoo adults0.0150.0370.0000.1100.0020.001
Injinoo juveniles0.0810.0850.0270.0000.0010.001
Seisia adults0.0980.0990.0750.0720.0000.001
Seisia juveniles0.2130.2080.1530.1520.1310.000
Mean age-class FST = 0.110.
Publisher’s Note: MDPI stays neutral with regard to jurisdictional claims in published maps and institutional affiliations.

