Article

Utilization of Fish Farm Effluent for Irrigation Short Rotation Willow (Salix alba L.) under Lysimeter Conditions

1
Research Center of Irrigation and Water Management, Institute of Environmental Sciences, Hungarian Agricultural and Life Science University, Anna Liget u. 35., H-5540 Szarvas, Hungary
2
Department of Plantation Forestry, Forest Research Institute, University of Sopron, Farkasszigeti u. 3., H-4150 Püspökladány, Hungary
3
Institute of Agronomy, Hungarian Agricultural and Life Science University, Páter Károly utca 1., H-2100 Gödöllő, Hungary
*
Author to whom correspondence should be addressed.
Forests 2021, 12(4), 457; https://doi.org/10.3390/f12040457
Submission received: 26 February 2021 / Revised: 29 March 2021 / Accepted: 6 April 2021 / Published: 9 April 2021

Abstract

:
Efficient utilization, treatment, and disposal of agricultural wastewater and sewage sludge are important environmental risks. In our research, effluent water from intensive aquaculture was evaluated for the irrigation of short rotation energy willow in a lysimeter experiment. Two different water types and their combinations were applied with weekly doses of 15, 30, and 60 mm, respectively. Our results revealed that implementing effluent water instead of fresh water could potentially increase the yield of the willow due to its higher nitrogen content (29 N mg/L). The biomass of irrigated short rotation coppice (SRC) willow plants were between 493–864 g/plant, 226–482 g/plant, and 268–553 g/plant dry weight during experiment period (2015–2017), respectively. However, due to the chemical properties (Na concentration, SAR value) of effluent water, the increase of the soil exchangeable sodium percentage (ESP) was significant and it can lead to soil degradation in the long term. The current study also investigated the relationship between chemical composition of the plant tissue and the irrigation water. In the case of K-levels of willow clones, an increasing trend was observed year-by-year. In terms of N and Na content was localized in leaf parts, especially in samples irrigated with effluent. Less N and Na values were detected in the stem and in the samples irrigated with surface water. In SRC willow plants, phosphorus was mostly localized in the stem, to a lower extent in the leaf part. The difference is mostly observed in the case of the amount of irrigation water, where the P content of the examined plant parts decreased with the increase of the amount of irrigation water. In the case of phenological observations, higher values of plant height were measured during diluted and effluent irrigation. Moreover, the SPAD of the plants irrigated with effluent water exceeded the irrigated ones with surface water.

1. Introduction

Efficient utilization, treatment, and disposal of increasing amounts of wastewater and sewage sludge are major environmental risks in these times. Approximately 4.5 million hectares of arable lands are used for agricultural production in Hungary. Of which, the size of arable lands where the cultivation of traditional crops (wheat, corn, sunflower) is unprofitable can be estimated at 100,000 hectares [1]. These areas are generally waterlogged, prone to inland excess water formation—which is a temporary water inundation on the agricultural lands due to the heavy rainy activities, sudden snow melting, and heavy soil textures with limited water permeability [2]. The cultivation of fast-growing and short rotation woody crops is possible on all types of soils used for agricultural cultivation [3]. Short rotation coppice (SRC) willow species have significant growth potential and biomass product among them [4].
Most of the approximately 400 species of fast-growing and short rotation woody crops live in the northern half of the Earth, the Salix is a characteristic woody genus of the Holarctic realm. Most of them grow on the alluvium soils of streams and riverbanks. White willow (S. alba L.) is a tree of fluvisol soils along the slow-flowing waters of the greater plains. It reaches its climatic optimum in the steppe, wooded steppe, and semi-desert belt. It is a heat-demanding, hygrophytic species that prefers high soil moisture. It also endures prolonged drought when roots reach groundwater. For rapid growth, it requires flooding in early summer. It also tolerates permanent summer flooding. In this case, it develops respiratory roots in the submerged section of its trunk [5]. It grows properly on loose alluvial soil, but it is characterized by more delayed initial development on bound clay soil [6].
Nowadays, the use of biomass energy is appreciating again, thus, it is expected to maintain its share of almost 10% of world energy consumption in the future. The simplest version of bioenergy utilization is the energy use of biomass in its original state or close to its original state. With this in mind, the use of forest and agricultural crops and by-products suitable for direct combustion, as well as woody and herbaceous energy crops from the various biomasses, for the purpose of the most favorable heat and electricity production and bioethanol production [7,8]. Salix spp. can be used for manufacturing, energy production, and medicinal purposes [9]. In case of willow cultivation, yield of up to 25–30 t/ha/year (10–15 t/dry weight/year) can be achieved. As willow tolerates poor air/water conditions of soils well, it would be considered to be the most suitable for regularly flooded areas (floodplains, inland excess water hazarded areas). SRC willow clones can be harvested annually or every 2–3 years in the same crop area, where their cultivation can remain profitable for up to 15–20 years [10]. In this case, it is necessary to ensure nutrient replenishment in order to establish good soil condition and achieve a satisfactory biomass yield [10,11].
In order to reduce the eutrophication of surface water, irrigation utilization of wastewater can provide an alternative solution. SRC plants, as biofilters, can save water, reduce the high organic matter content, micro and macro elements of effluents, especially the concentrations of N and P. Wastewater irrigation provides an opportunity to apply a lower dose of fertilizers or even to eliminate conventional nutrient replenishment as well [12].
The aim of our research was to determine the N and Na content of the soil, determination of phenological parameters and the amount of macroelements (N, K, P) and Na found in the plant parts. Additionally our goal to determine the biomass of energy willow plants in addition to the applied treatments.

2. Materials and Methods

2.1. Study Site and Climatic Conditions

The experiment was carried out at the Lysimeter Research Station (46°51′49″ N 20°31′39″ E Szarvas, Hungary) of the Hungarian Agricultural and Life Science University (HUALS), Institute of Environmental Sciences (IES), Research Center of Irrigation and Water Management (ÖVKI). Sixty-four non-weighing lysimeters (1 m3) were used to determine the effect of effluent water irrigation on the development of willow clones. The lysimeters were 1 m deep and 1 m2 in surface. The soil of the lysimeter is not stratified disturbed soil, where the soil properties in lysimeters where clay texture, 0.08% total salinity, 0.41% calcium carbonate, and 1.172% carbon content. At the bottom of all lysimeters, a 10 cm layer of fine gravel was placed for the collection of leachate water.
The climate of Hungary is influenced by continental and oceanic effects, the specific area of the experimental site is described as warm dry climate region. Based on long term local data (1981–2010), the mean annual air temperature is 10.8 °C (Table 1), while the mean temperatures in July and January are 21.9 °C and −1.0 °C, respectively. The average annual precipitation is 515.3 mm. The meteorological data during the three years experiment (2015–2017) were collected by an automatic weather station maintained by the HUALS ÖVKI in Szarvas. Its distance to the Lysimeter Station is 600 m. In 2015, lower values of temperature were recorded only in October. While in 2016 and in 2017, May, August, October, December, and January were colder, respectively. The year of 2015 was dry, the total precipitation was only 400.6 mm while in the year of 2016, 633 mm was measured. However, the distribution was heterogeneous which a dry spring and a very wet early summer characterized. In 2017, the amount of precipitation was close to the average.

2.2. The Plant Material

The SRC willow (Salix alba L.) ’Naperti’ candidate variety of the National Agricultural Research and Innovation Centre, Forest Research Institute (NARIC FRI), Department of Plantation Forestry was planted into the lysimeters in 2014. Eight lysimeter containers were used for one treatment. Two plants were planted into each lysimeter with 50 cm of plant spacing and 100 cm of row spacing. In order to reduce the edge effects, additional willow clones were planted around the containers with the same plant and row spacing. The first cutting took place in December 2015, the second in January 2017, and the third harvest in January 2018.

2.3. Experimental Design for Effluent Water Irrigation

Two different water types and their combinations were applied for the irrigation experiment of the energy willow clones. Untreated effluent water from a local intensive African catfish farm was used directly collected from the outflow of fish rearing tanks with the weekly doses of 15 mm (E15), 30 mm (E30), and 60 mm (E60) during the vegetation season in eight replications, respectively (Table 2). The flow-through system of the fish tanks is supported by a geothermal well from a confined aquifer. This system has the main role of temperature and water quality maintenance since the African catfish are fed high-protein diet and need warm water (above 16 °C) to grow. The daily amount of effluent water from the farm exceeds 1000 m3. That effluent water contains large amount of metabolites as fish feces, organic materials and rarely chemicals or antibiotics depending on the fish rearing technology [13]. Because of the geothermal origin, the effluent water also carrying high content of total salinity including high percent sodium (Table 3). The type of water meets the classification of sodium hydrogen carbonate.
As an irrigated control treatment, freshwater was applied from the local oxbow lake of the River Körös (46°51′38.6″ N 20°31′28.0″ E, Szarvas, Hungary). Irrigation schedule was planned as weekly doses of 15 mm (K15), 30 mm (K30), and 60 mm (K60) in eight replications, respectively (Table 2). Additionally, a non-irrigated control (C) treatment was also applied with eight replications.
To reduce the negative effects of this high salinity, effluent water was pretreated and it was used with the weekly dose of 60 mm (diluted treatment D) after a pretreatment. Before irrigation, effluent water was diluted four times (1:3) by adding river water to meet the recommended upper limit of total salinity in irrigation water (500 mg/L). Moreover, gypsum (calcium sulfate) was also added (312 mg/L) to reduce the percent sodium for diluted treatment. A micro-sprinkler irrigation system was used for all irrigation treatment.
Soil samples were collected before the first irrigation on 3 July 2015 and after the last irrigation period on 5 October 2017 from all treatments from three soil depths (0–20 cm, 20–40 cm, 40–60 cm) with three replications. Soil analyses were made according to Hungarian standards for five parameters: plant available nitrogen, calcium, potassium, magnesium and exchangeable sodium. The available nitrogen content of the soil was characterized by the sum of the nitrite and nitrate contents of the soil (KCL-NO2 + NO3-N). Nitrite and nitrate were extracted with potassium chloride and the concentration was measured using FIA spectrophotometer (according to Hungarian standard MSZ 20135:1999). Exchangeable cations (K, Na, Ca, Mg) were extracted with barium-chloride and triethanolamine and their concentrations were measured using flame photometer (according to Hungarian standard MSZ-08-0214-2:1978).
From the results of the analyses of soil exchangeable basis, the exchangeable sodium percentage (ESP) and its changes during the experiment was calculated according to the equation
ESP (exchangeable sodium percentage, %) = (Na/(Na + K + Ca + Mg)) × 100
where, Na+, K+, Ca2+ and Mg2+—concentrations are expressed in milliequivalents per 100 g of soil [14].
ΔESP2015–2017 (exchangeable sodium percentage, %) = ESP2017 − ESP2015

2.4. Determination of Phenological Paramteres and Mineral Content

From the plant phenology measurements, plant height (measuring rod) and SPAD values (Konica Minolta SPAD-502) were measured on a weekly basis during the growing seasons. For height measurement, three plants were selected per treatment and the current value was determined from their average. During the determination of the SPAD value, it was also generated from the average of 3-3 measurements. In this case, we analyzed the chlorophyll content of the leaves of the lower, middle, and upper branches. The mineral content of the plant parts was analyzed at the end of the growing season. In all cases assayed by the Hungarian and ISO standard methods. For the determination of the sodium, phosphorus, and potassium were extracted with nitric acid+hydrogen peroxide and their concentrations were measured using Inductively coupled plasma-optical emission spectrometry ICP-OES (according to Hungarian standard MSZ 08 1783 28-30:1985 Use of high capacity equipment in plant analyses—quantitative determination of sodium, phosphorus, and potassium content in plant materials by the ICP methods) and at nitrogen applied (ISO 5983 2:2009 Determination of nitrogen content and calculation of crude protein content. Part 2: Block digestion and steam distillation method) methods. In the analytical studies, we worked with six replicates.

2.5. Statistical Analyses

Statistical analyses were implemented by IBM SPSS Statistics 25.0 software. Applying one-way analysis of variance (ANOVA), we examined the effect of irrigation water quality and quantity on the phenological and important content properties of willow clones per treatment and plant part. The differences were determined significant, where the Tukey’s or Games-Howell tests were considered significant at p ≤ 0.05 or p ≤ 0.01. In soil chemical studies during the statistical evaluation, independent t-test was used for the 15- and 30-mm irrigated samples, and ANOVA (2) test was used for the 60 mm samples (treatment with 60 mm 3 irrigation water quality were applied and compared). Pearson correlation is used in correlation analysis.

3. Results

3.1. Results of Chemical Analyses—Changing of Sodium and Nitrogen Content of Soil

The effect of irrigation water quality on the exchangeable sodium content of the soil can be proved in each soil depth and irrigation water amount, (despite 15 mm in 40–60 cm soil layer which may be due to excessive variance) (Table 4). The increasing sodium content in the soil due to the high sodium concentration of the reused water was demonstrably dependent on the amount of irrigation water, the highest ΔESP2015–2017 (+6.85%) was measured in E60 treatment in the surface layer. This statement is also true for Körös River water, but in the case of K60 the change is already negative, which means that the exchangeable Na content of the soil decreased as a result of irrigation. Examining the results measured in different depths of soil layers, we found that sodium accumulated to a lesser extent in the deeper soil layers compared to the surface layers in treatments irrigated with reused water (Table 4), however it can be proved only in case of ΔESP2015–2017 value of E30 treatment between 0–20 cm and 40–60 cm, (n = 3, p = 0.041, independent t-test). As a result of the improvement of irrigation water, it was possible to reduce the increase of the Na content of the soil in all soil depths (Table 4).
In accordance with the nitrogen content of the effluent water, the available nitrogen content of the soil was higher in all treatment irrigated with reused water than in treatment irrigated with Körös River water (Table 5). At treatment with 30 and 60 mm irrigation water amount differences between the available N values according to the irrigation water quality were statistically proved (Table 5). Comparing the improved water quality (7.52 mg/kg) to Körös River Water (2.96 mg/kg) higher available N values were detected and differences were proved.

3.2. Phenological Results

3.2.1. Changes of Relative Chlorophyll Content

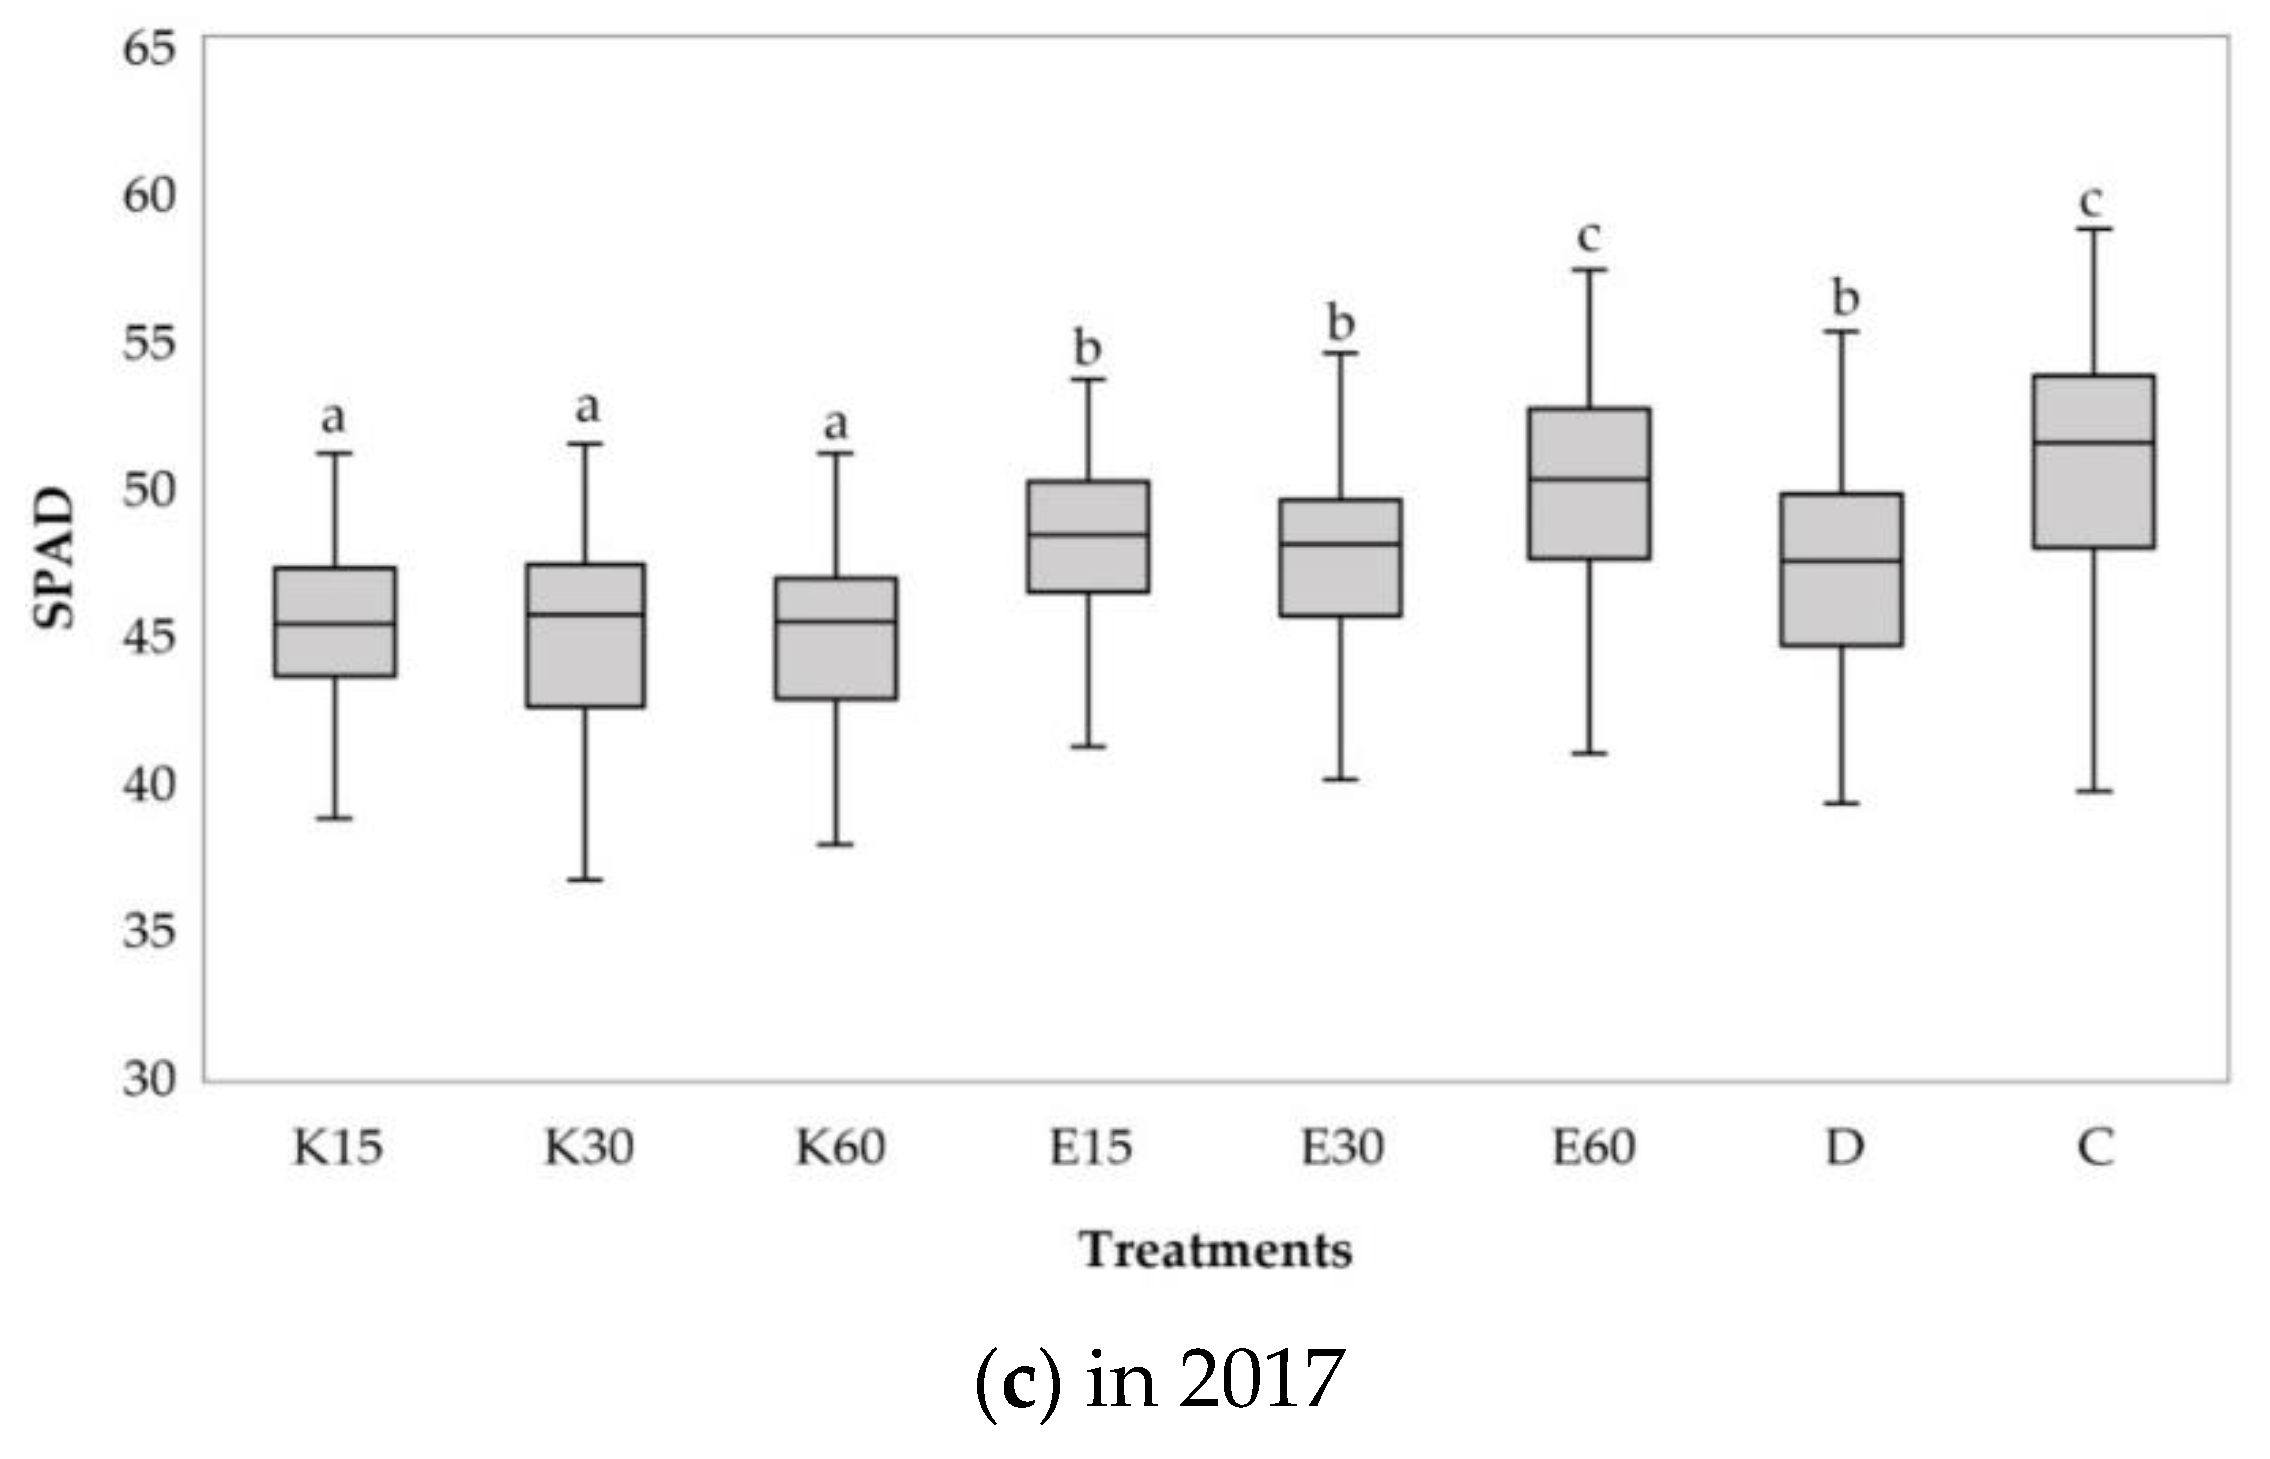
The Figure 1a shows that the values of the energy willow SPAD means ranged from 42.3 to 47.5 during the first growing season. The highest value was measured for E60 treatment. The smallest SPAD values were recorded in the K15 treatment. With the exception of treatment K15, all treatments exceeded the SPAD values of treatment C. In the following growing year (Figure 1b) it can be seen that the chlorophyll values of the irrigated treatments did not reach the control. The highest SPAD mean was 51.5 for the control, while the lowest for K15 treatment was 45.3. In addition, except for the first year, compared to Körös River irrigated treatments, higher values were found in the samples irrigated with effluent water. This difference is due to the excess nutrient content of the effluent.
This trend is no longer observed in 2017 (Figure 1c). Compared to control SPAD values, samples irrigated with surface water show a lower rate. In this case, the K30 plants had the lowest chlorophyll means (43.5), while the E30 treatment had the highest value (49.0).
During the one-way analysis of variance in the 2015 production year, the SPAD values of the willow K15 treatment differed significantly from the chlorophyll values of the other irrigated treatments (K30 p = 0.021, K60 p = 0.001, E15 p = 0.030, E30 p = 0.003, E60 = 0.000, D p = 0.019). Significantly higher SPAD values were recorded for treatments E60 (p = 0.000), D (p = 0.000), and K60 (p = 0.022) compared to treatment C. In year of 2016, the SPAD values of the treatments showed a significant difference. There was a strong significant value (p ˂ 0.001) between the control and the irrigated treatments, where, with the exception of E60 treatment, plants contained significantly less chlorophyll (Figure 1b). In 2017, the SPAD values of plants irrigated with K60 treatment showed a significant difference compared to the other treatments, except for the K15 and K30 samples. In the case of E60 treatment the p = 0.003, they had a significantly higher (p < 0.001) chlorophyll value with respect to the ones listed above. Comparing the irrigated treatments to the control values, it can be observed that the E30 (p = 0.042) treatment had a significantly higher SPAD value, while the K30 (p = 0.001) and K60 (p = 0.000) treatments had significantly lower chlorophyll values.

3.2.2. Growth of Test Plants during the Seasons

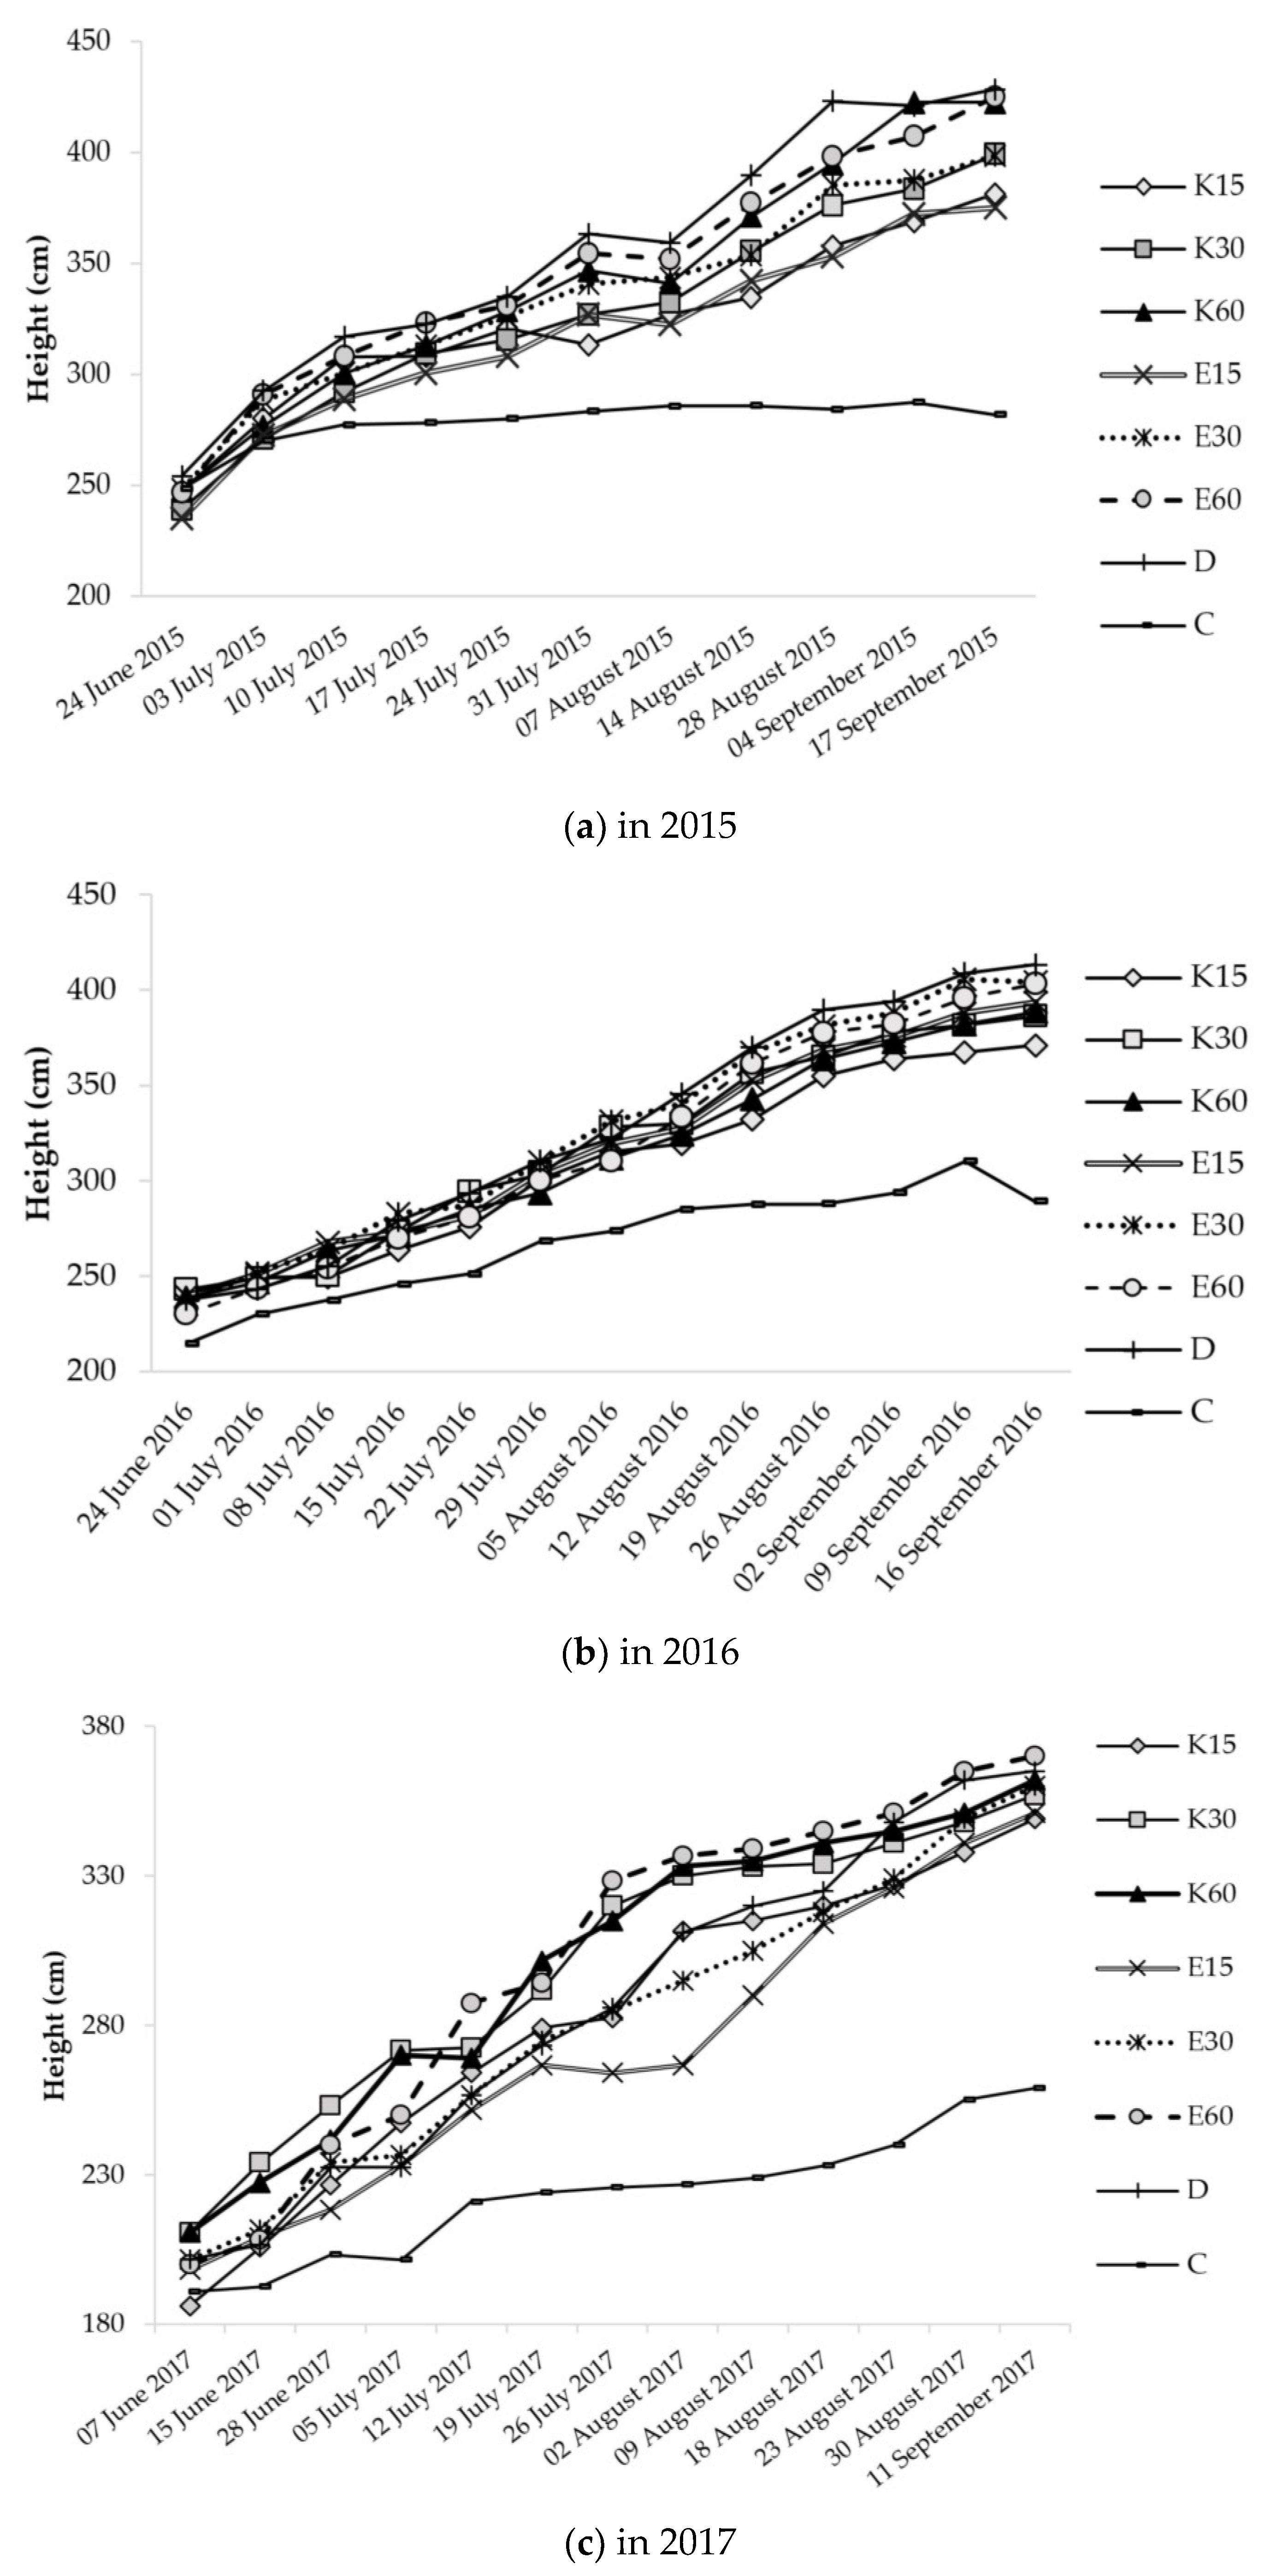
Data from the 2015 cultivation year show that the values of irrigated treatments exceeded the height of the control plants (Figure 2a). From the data measured on 17 September, it can be concluded that at the last measurement the tallest energy willows grew to height of 428 cm with D treatment, while the control plants reached 282 cm. During the examined period, compared to the first measurement at the last the control plants grew by 34 cm while in E60 treatment by 178 cm. Throughout the last height determination, in the one-way analysis of variance of the data, all treatments proved to be significantly higher (p = 0.00) compared to the control plants (n = 6, Tukey’s test).
In Figure 2b, plant height values for 2016 developed similarly as in 2015. Throughout the time of last measurement, control proved to be the lowest (289 cm), while treatment D showed the highest (413 cm) values. Following the analysis period, it can be observed that the control willows increased by 75 cm and the plants irrigated with 60 mm effluent water by 176 cm. In a year of 2016 during the final measurement compared to control plants in height, irrigated treatments grew significantly higher (p < 0.001, n = 6, Tukey’s test).
In the 2017 growing year, a slowdown in productivity growth was detected (Figure 2c). The growth rate of control willows is lower than that of treated plants, where by the end of the analysis only 259 cm had been reached. The highest plants in this case were also observed in E60 treatment (370 cm). In the analysis of variance in 11 September, there was a significant difference between the control and the irrigated treatments (p = 0.000, n = 6, Tukey’s test).

3.3. Results of Mineral Content

3.3.1. Changing of Nitrogen Content in Plant Parts

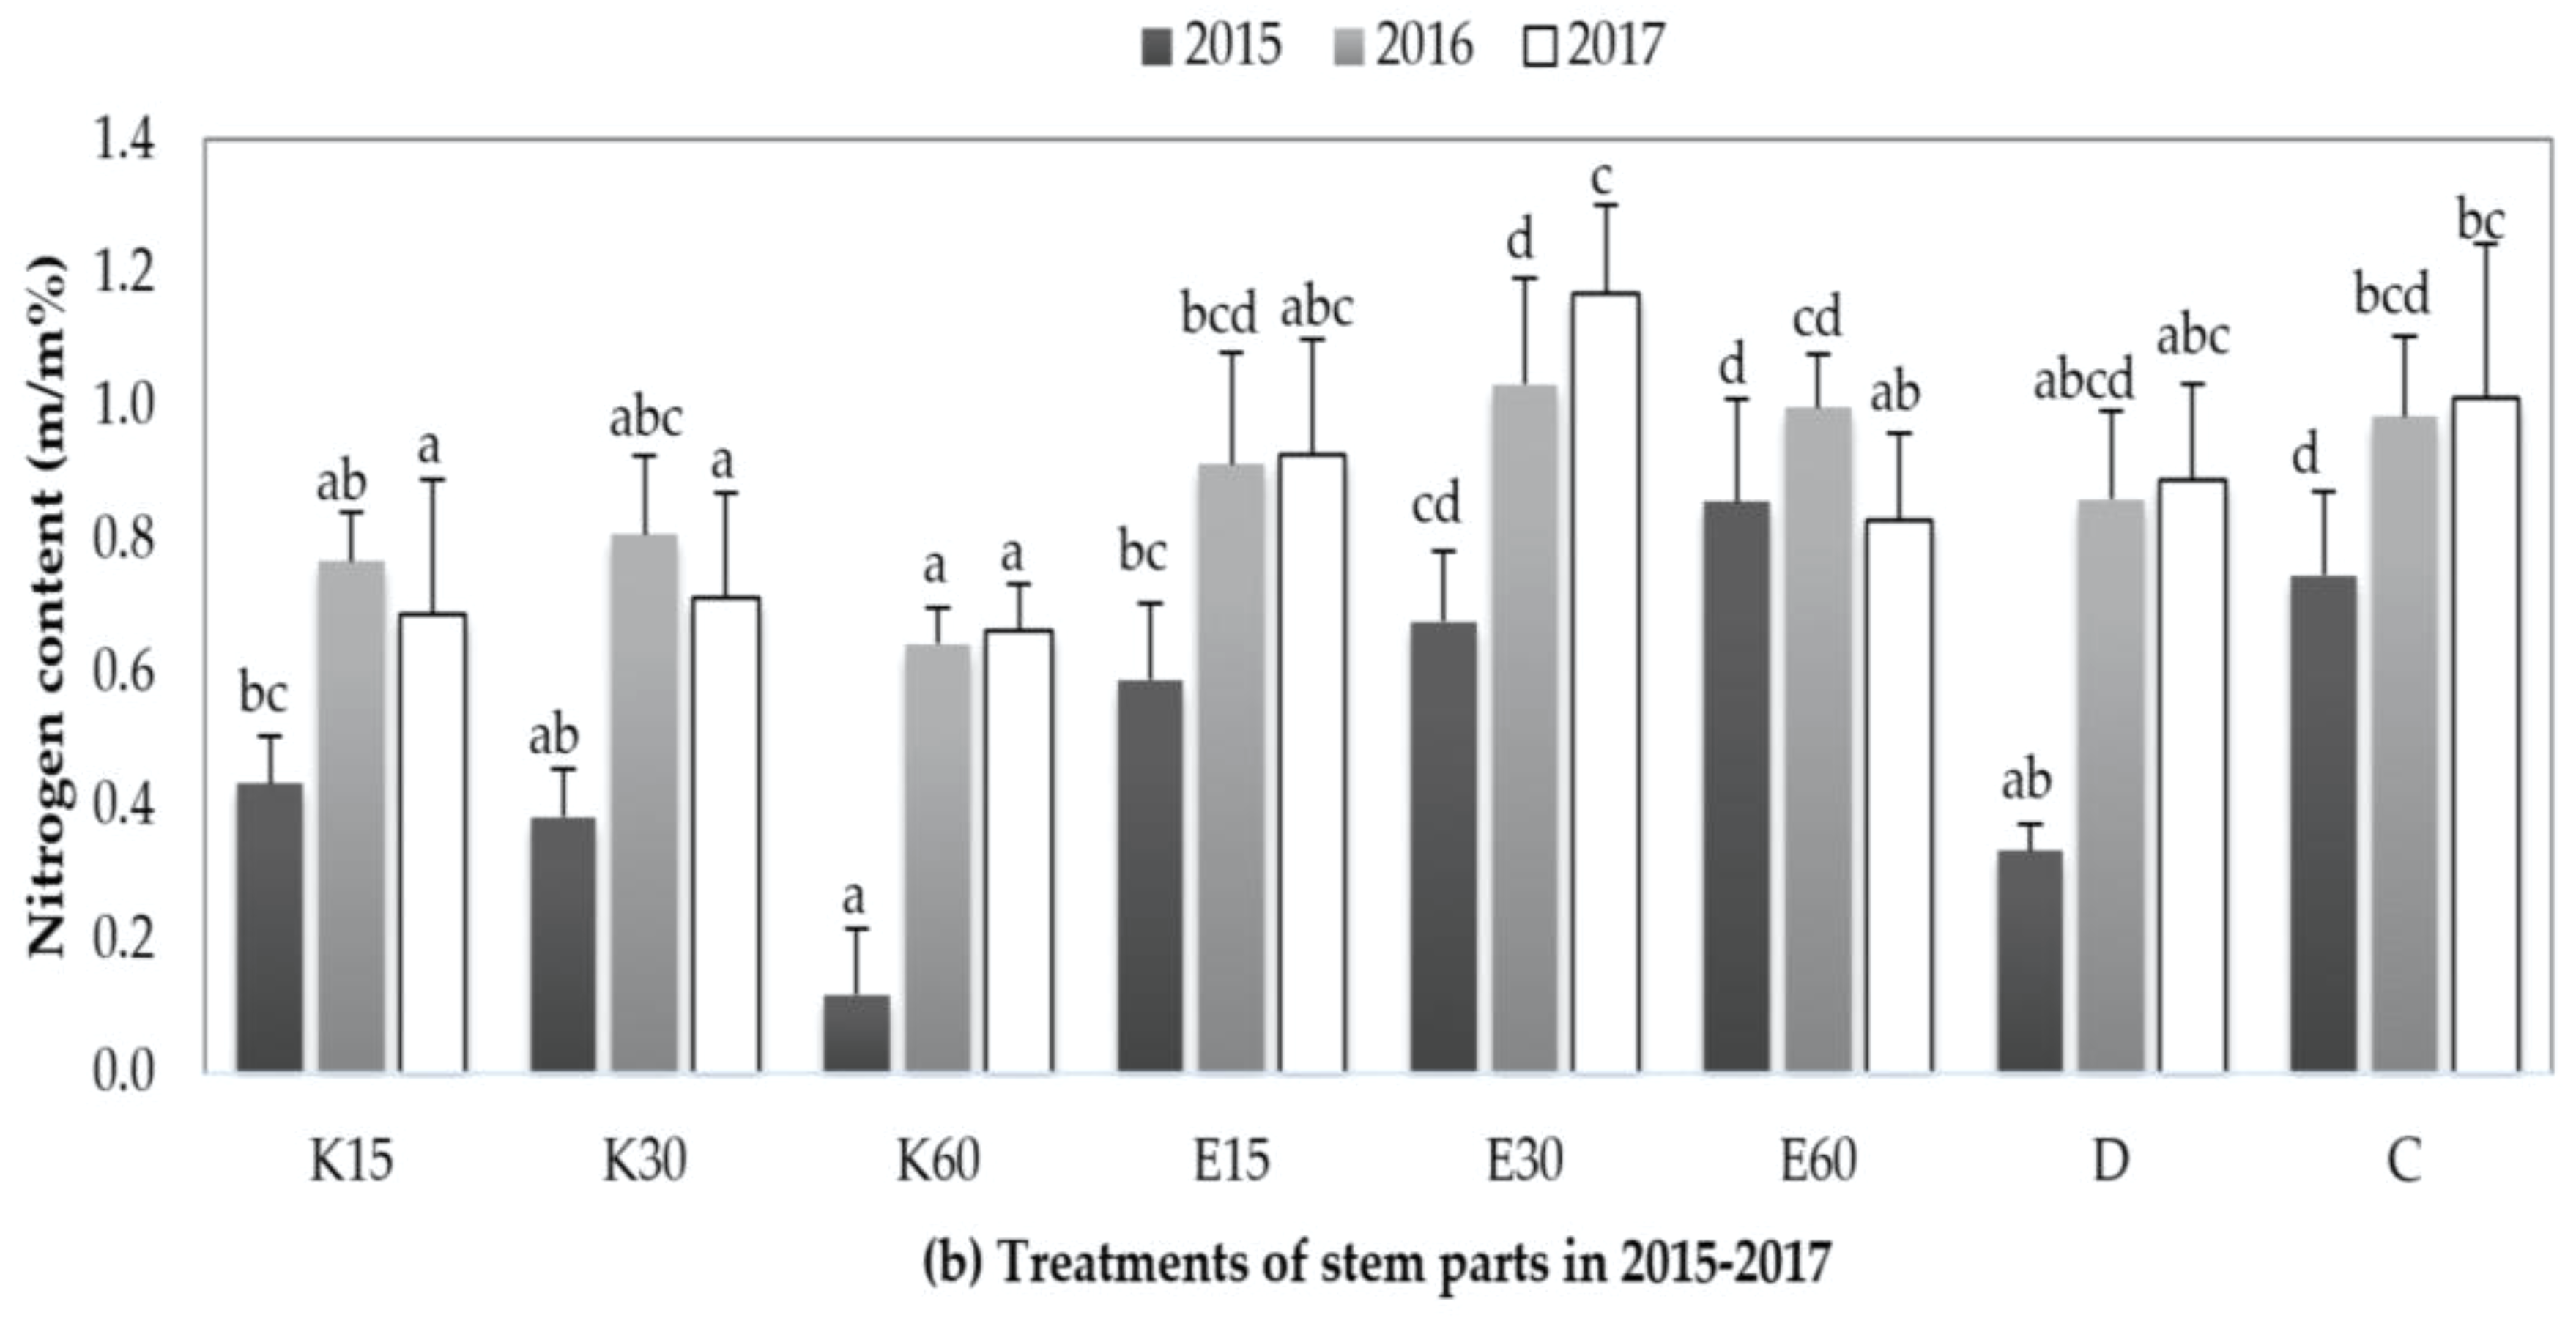
When comparing the treatments in the 2015 growing year (Figure 3a), it can be seen that the N content measured in the leaf part was significantly higher in the E60 treatment than in the E15, D, K30, and K60 treatments. The highest N (3.5 m/m%) content was found in willows E30 treatment while the lowest values were measured in the K60 (1.6 m/m%) treatment. Leaves contained significantly more N in E60 (p = 0.015), E30 (p = 0.000), K15 (0.005), and C (p = 0.001) treatments than in K60 treatment. In addition, in the case of the stem, the K60 treatment had the lowest N content, where the samples irrigated with effluent, K15 and C contained significantly more N.
In 2016, the N content measured in the leaves showed a decrease. The E15 (p = 0.018), K15 (p = 0.002), and C (p = 0.029) leaf samples had significantly more N content than the cases of willows irrigated with K60 treatment. In the case of the stem, it can be seen (Figure 3b) that the values moved in almost the same range in 2016 and 2017. The measurement results of both years exceeded the N content measured in 2015. In the third experimental year—in the case of samples D, C, K30 and irrigated with effluent water—it can be stated that significantly more N was stored in the leaves of willows than in the case of those irrigated with K60 treatment.

3.3.2. Changing of Potassium Content in Plant Parts

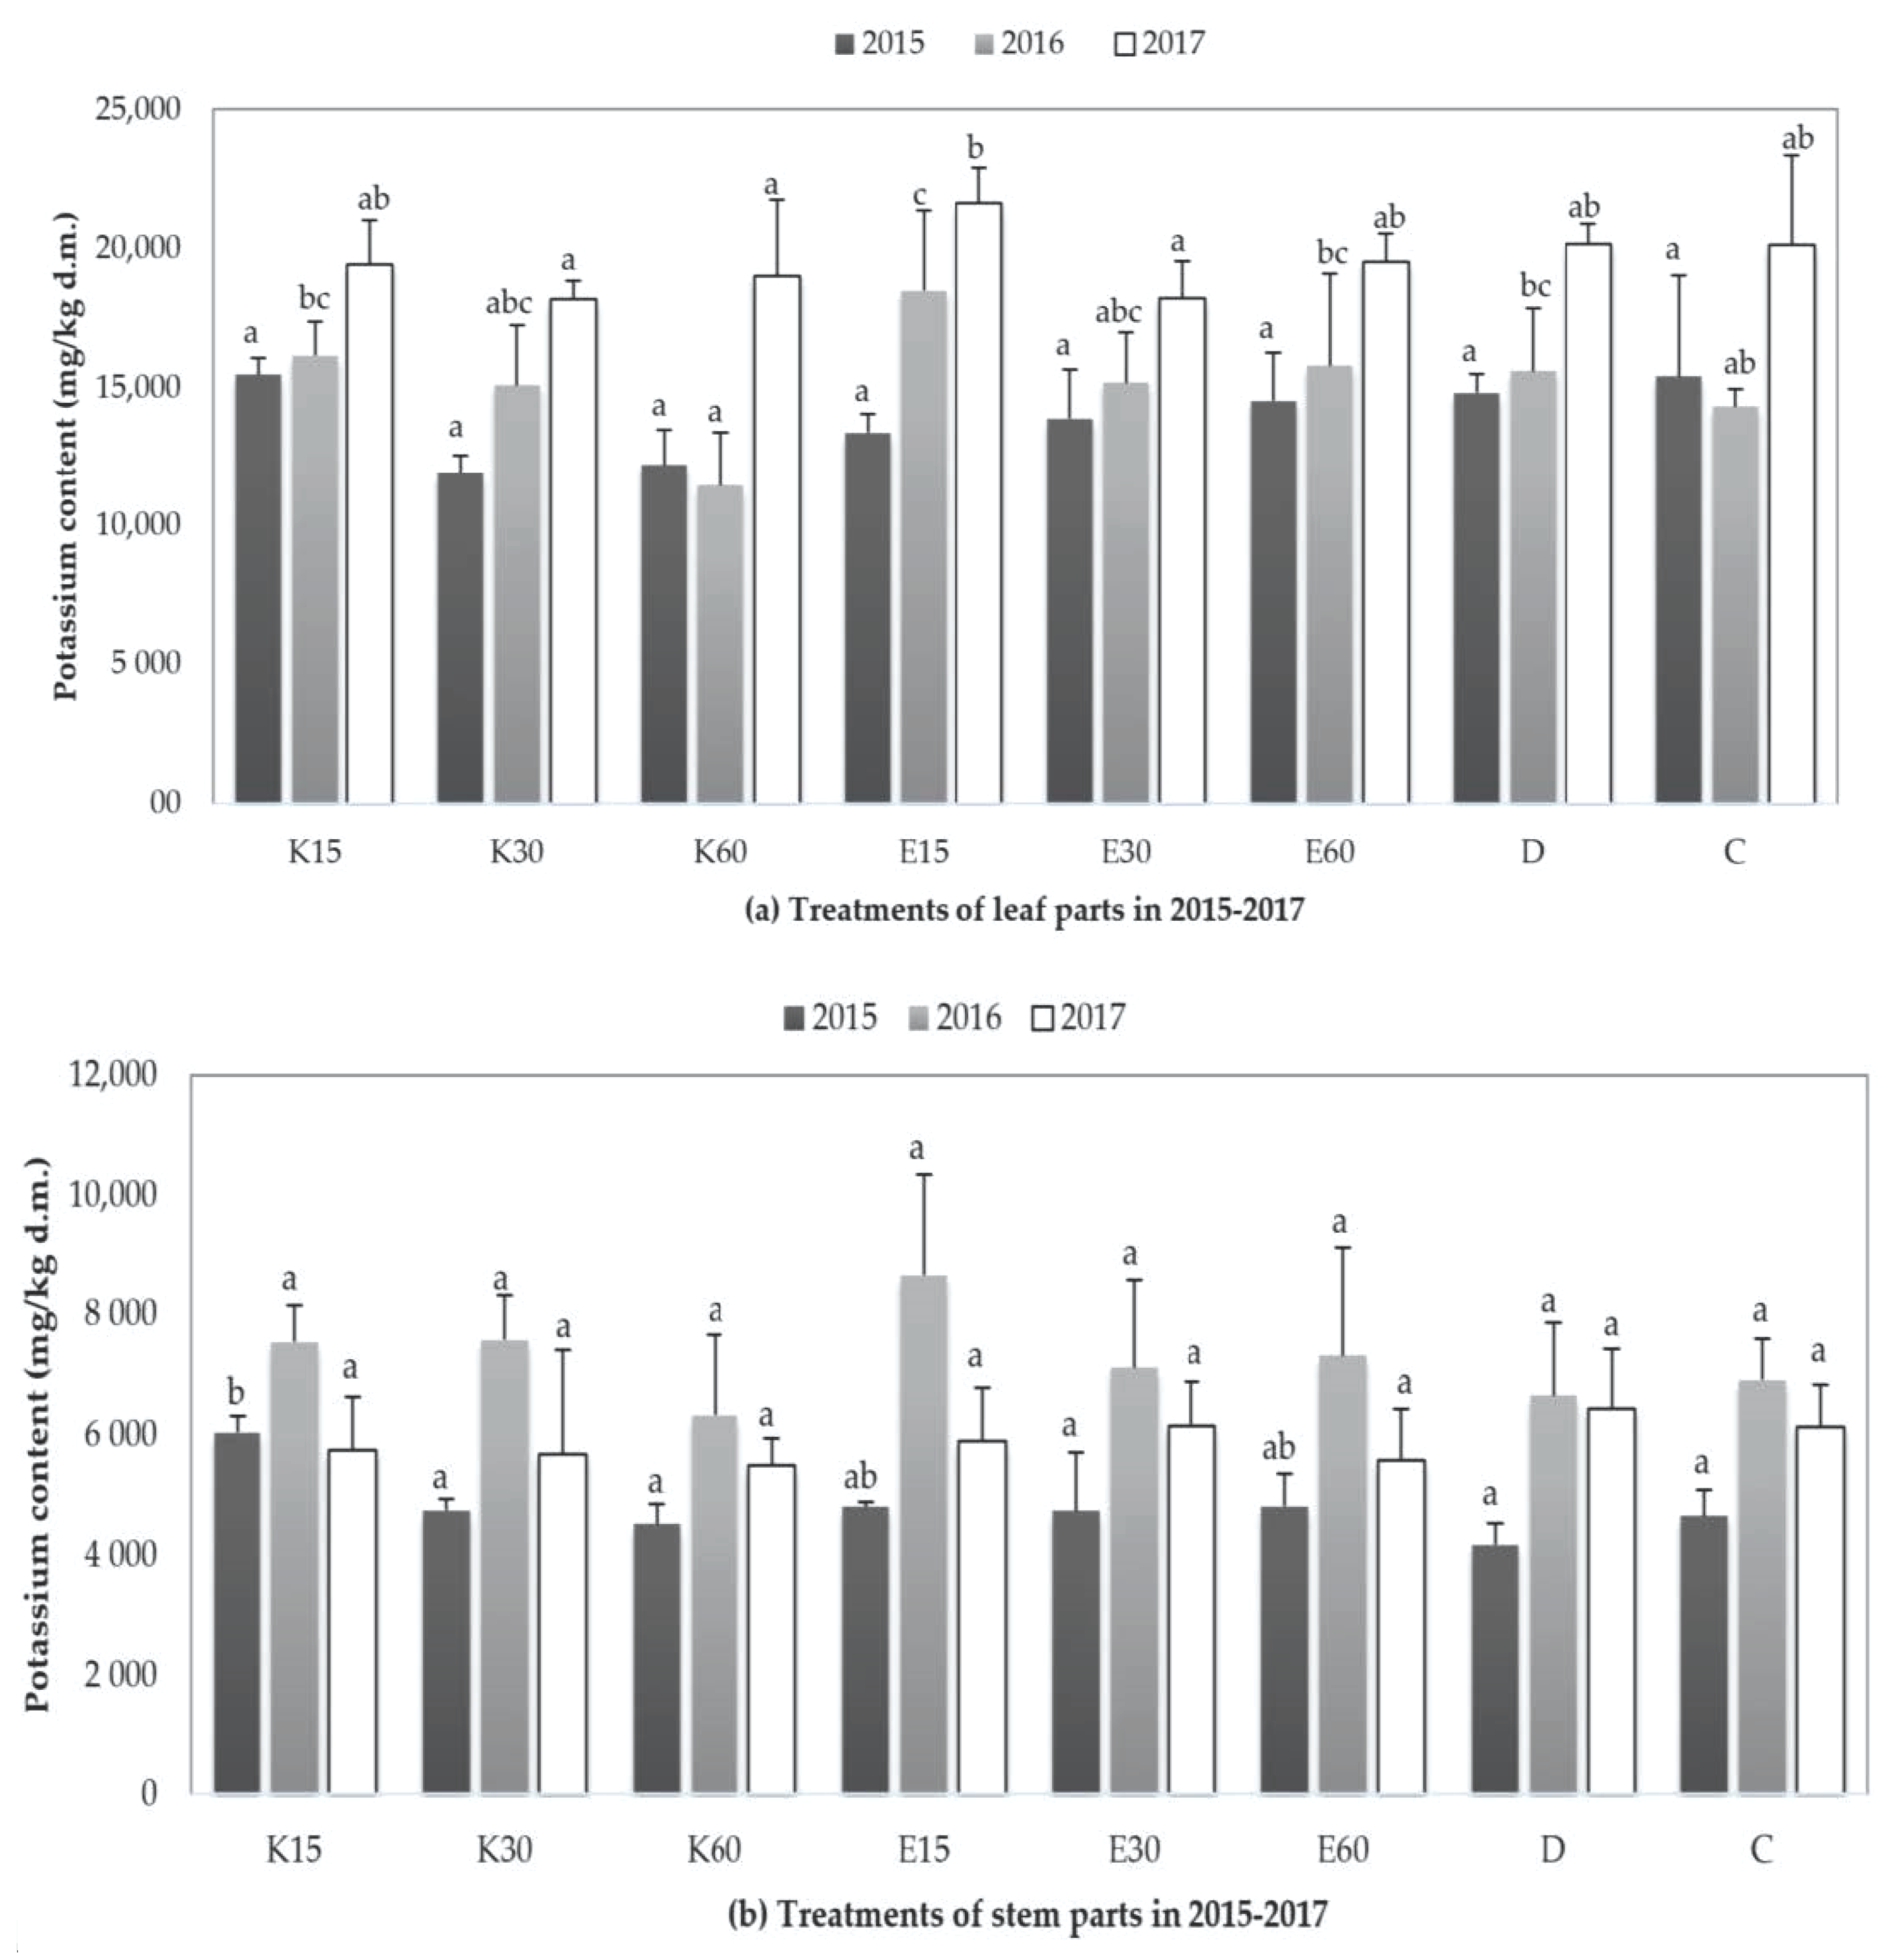
In the macronutrient analysis of plant parts of SRC willow clones, most K was concentrated in the leaves (Figure 4a). The comparison of the annual data shows that we measured the lowest K content in 2015 and the highest in 2017. In the case of leaves part at the first year, the K value ranged from 11,880 to 15,465 mg/kg d.m., while in the second year, the measured element content was 11,445–18,492 mg/kg d.m., and finally in 2017, 18,187 and 21,627 mg/kg d.m. were detected.
It should be noted that in the leaf samples irrigated with E15, significant increase in K level was observed in the last two years of the experiment. During the annual Tukey’s multiple comparisons, there were no significant differences between the treatments in 2015; however, in the second year of the study, compared to the K60 treatment values, E15 (p = 0.000), E60 (p = 0.023), D (p = 0.034) and K15 (p = 0.010) leaf samples had significantly higher K levels. Furthermore, in 2017, E15 (p = 0.013) had significantly higher K levels compared to data from K30 samples. In the case of stems part, the same trend is observed as for the leaves. However, the K level of the stem parts was very high in 2016, where the E15 treatment reached 8640 mg/kg d.m. value. In the first and last irrigation years, the K content of the stem parts of SRC willow clones ranged from about 4100 to 6400 mg/kg d.m (Figure 4b). During the one-way analysis of variance, there was a significant difference between the 2015 measurement data. Compared to D analysis, treatments of K15 (p = 0.001) had significantly higher K content. There was no detectable significant difference in the other two years.

3.3.3. Changing of Sodium Content in Plant Parts

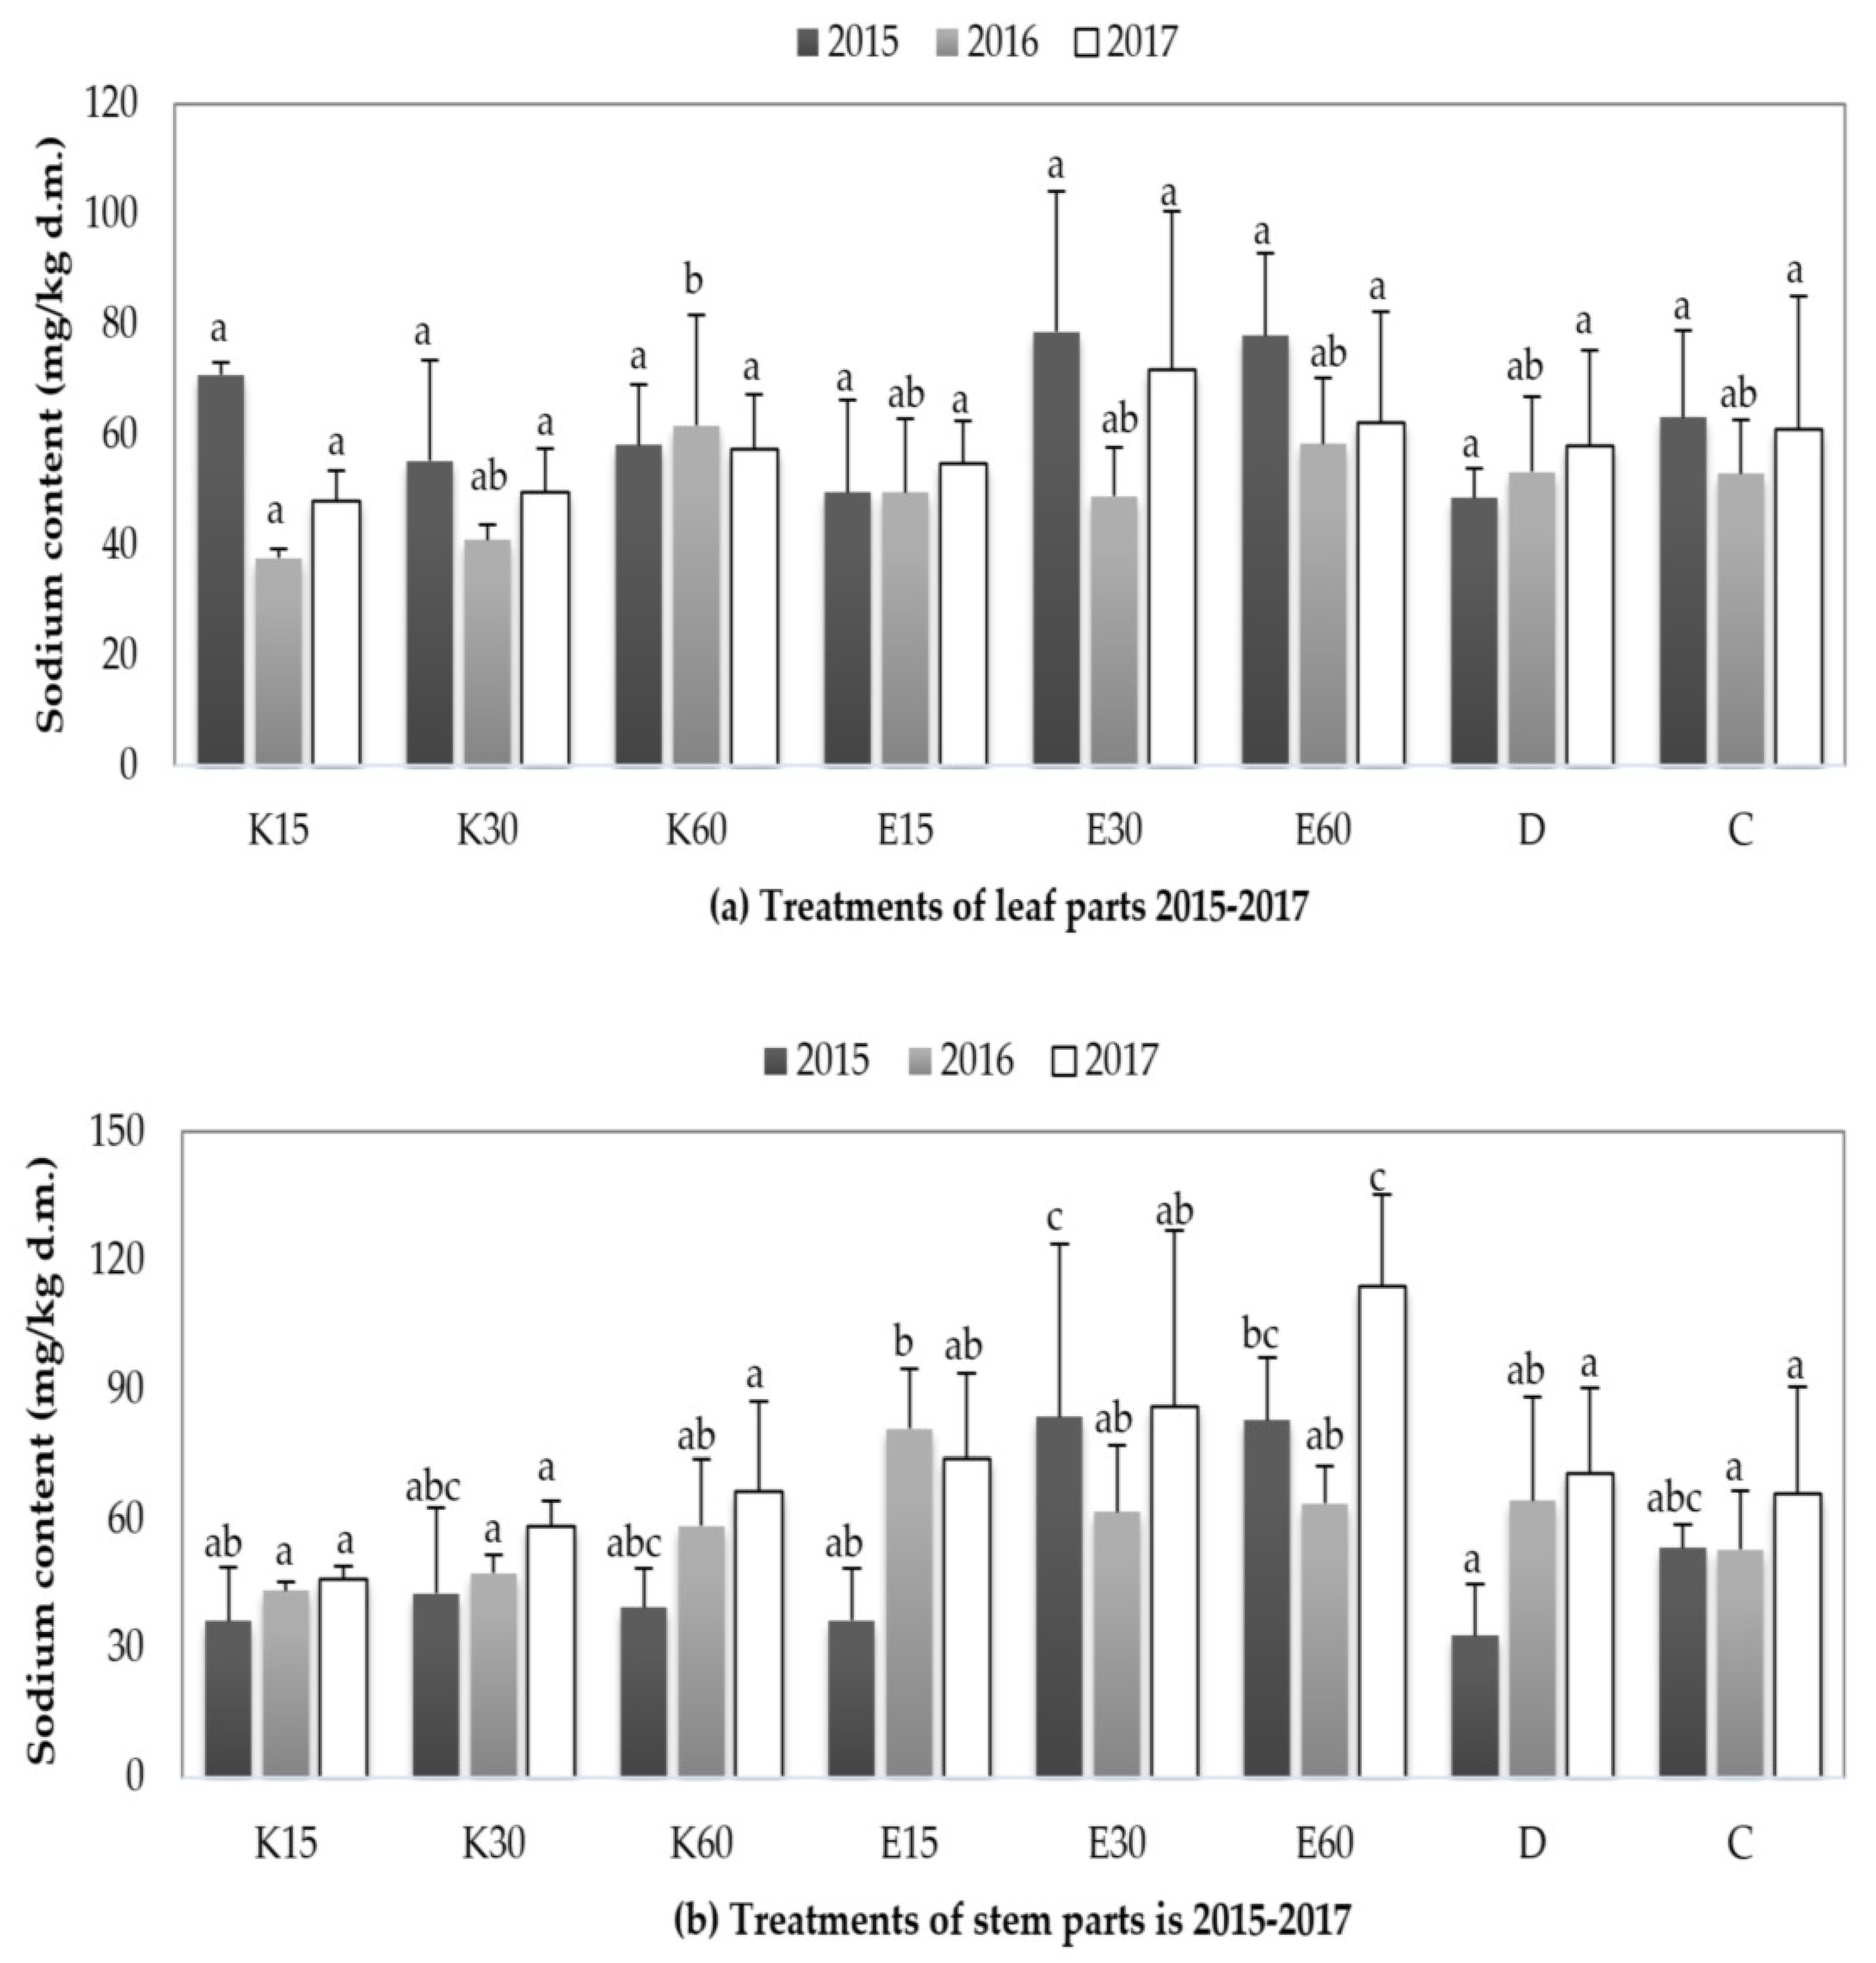
In the first experimental year, the Na content measured in the leaf parts of the test plant ranged from 49 to 79 mg/kg d.m. (Figure 5a). The lowest value was measured for treatment D, while the highest value was detected for sample E30 (Figure 5b). In 2016 and 2017 growing years, the Na level in the leaf parts was similar, where the lower values were recorded by the Körös River water-irrigated samples and the higher values by the effluent irrigation. Statistical analysis in a second year at leaf parts showed significant difference between K15 and K60 treatments (p = 0.025).
In case of the stems, it can be observed that, except for 2015, the lowest Na level was measured in the D treatment, while the highest value was analyzed in the E 30 samples (Figure 5b). At the same time, it can be discovered that the Na content of the stem parts shows an increasing trend from year to year, especially of the samples irrigated with effluent water. The values measured in 2017 are remarkable, where the Na content of the E60 samples reached 114 mg/kg d.m., which is 137% higher than in 2015. In the first study year the one-way analysis of variance E15, D, and K15 treatments contained significantly less (p < 0.1) Na compared to the values measured in E30 treatment. During the one-way analysis of variance, significantly lower Na levels were detected in the second vegetation period for stem samples with K15 and K30 treatments. This trend can also be observed in 2017, where the stems of the clones also contained significantly less Na than the samples irrigated with oxbow lake water (15, 30, 60 mm doses).

3.3.4. Changing of Phosphorus Content in Plant Parts

The P content of the effluent and diluted water irrigated leaves of the willows in 2015 and 2017 growing years moved between in range 1990 and 3023 mg/kg d.m. In 2015, control had significantly more P content than treatments E60 (p = 0.004) and D (p = 0.001) (Table 6). In 2016, most of the P content was detected in the samples irrigated D treatment, where significantly lower P levels were observed in the leaves of E30 (p = 0.046) and C (p = 0.043) samples. In the last experimental year, significantly less P content was detected for the control treatment (p = 0.033) compared to the D irrigation. Concerning the P element content measured in the stem part of the energy willows in the three vegetation years, it is identifiable that the measured level was between 813 and 2457 mg/kg dm. In the first year, compared to the control value, the P content was significantly lower in the D (p = 0.000) and E30 (p = 0.005) treatments.
In the second year, significantly less P content was measured in the stem part of SRC willows compared to D irrigation in the E30 (p = 0.004), E60 (p = 0.000), and control (p = 0.000) treatments. In 2017, with the exception of treatment D, the stem samples of the clones contained significantly fewer P elements.

3.4. Biomass Changing over the Three Years of the Experiment

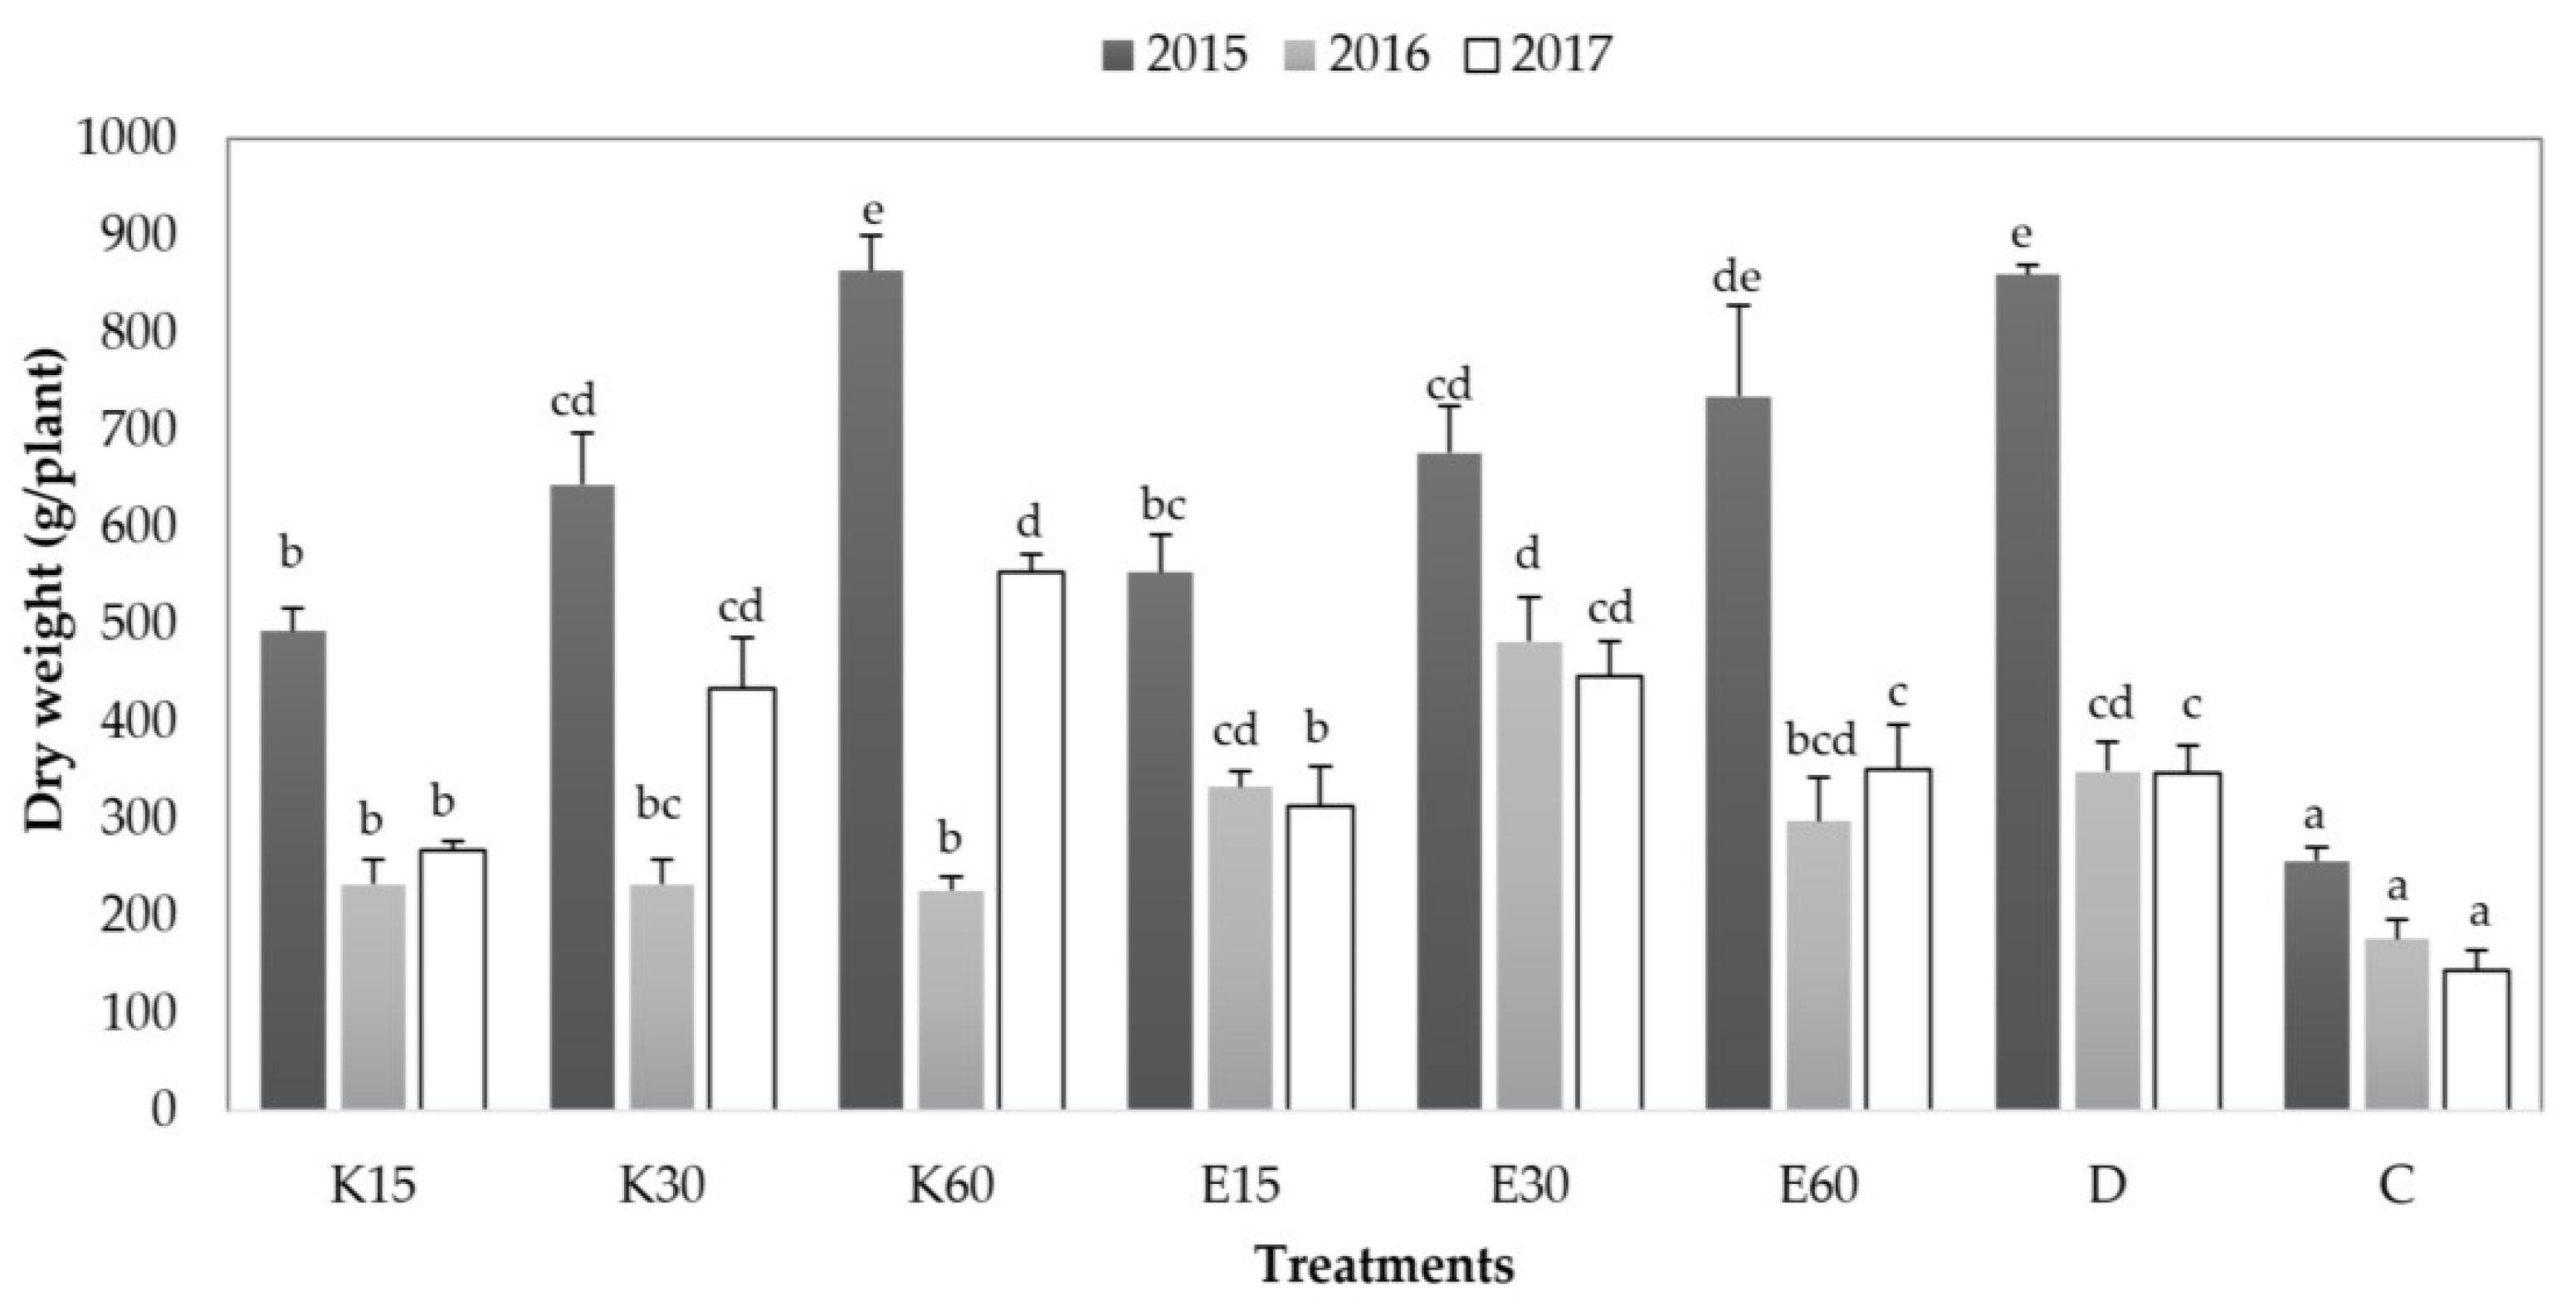
The willows had the highest biomass in 2015, where it reached 864 g/plant dry weight in case of K60 (Figure 6). It can be observed that in all three experimental years the biomass product of the control plants became the lowest. Furthermore, the decreasing trend that occurred in the crop year by year is clearly visible.
In terms of control by experimental years, this resulted in a 56% yield reduction. This decrease was due to the physical limitations of the lysimeters. Namely, the volume of 1 m3 restrained the root growth of the two- and three-year-old willows (Figure 6). At the same time, the trend that irrigation had a positive effect on biomass compared to control values is appeared. It can be observed that each year the plants treated with effluent water had an average higher g/plant dry weight value. In 2015 it was 554–734 g/plant, in 2016 it was 298–482 g/plant), and the last year the data show 313–447 g/plant dry weight. While in the case of those irrigated with Körös River water the harvested dry weight.
During statistical study the examining the differences between the treatments in each experimental year, it can be stated that compared to the biomass production of the control plants, all irrigated treatments had significantly higher (p = 0.000) product.

4. Discussion

We investigated the irrigation utilization of effluent water from an intensive African catfish farm in short-rotation energy willow plants in 2015–2017. Within agricultural water expection can provide an ideal solution for the conservation of water resources, as the irrigation utilization of nutrient-rich effluent from freshwater aquaculture systems can be used in many plantations [15,16]. At the same time, the organic matter load of natural recipients and the doses of fertilizer applied during cultivation can also be reduced [17]. Dhawan and Sehdev [18] described in their research that irrigation cultivation experiments with effluent from fish farms show higher yields.
As expected, the sodium content of the soil irrigated with reused water was increased in all treatments and depths (Table 4). Similary, Jahany and Rezapour [19] stated that the high values of exchangeable Na and ESP in the treated effluent water irrigated soil could be associated with the chemistry of the effluent water used. According to Jahany and Rezapour [19], conditions were probably favorable to Na accumulation on the exchange complexes because of the high amounts of Na+ and HCO3– supplied by effluent water, the combined effects of the increase in bicarbonate from irrigation and evapotranspiration process are likely to help the depletion of Ca+2 and Mg+2 ions as insoluble carbonates (such as calcite and magnesite) while the more soluble Na remains in the solution and subsequently, results in the over-accumulation of exchangeable Na as well as an increase in the ESP values. In order to reduce sodium increase in soil, in the reused water gypsum was applied as amendments to improve its quality after diluted it with Körös River water in our experiment. According to the results, the sodium accumulation was reduced compared to water from catfish farm due to improved water quality (Table 4). These results in accordance with previous works recording that dilution of irrigation water [20,21,22] or amendments (mainly materials with calcium) [23,24,25] for irrigated soil could be appropriate solution to reuse effluent water for irrigation.
The beneficial effect of the reused water on the available N content of the soil can be demonstrated. In addition to the nitrogen concentration of the water from fish farm, the effect of irrigation on nitrogen mineralization may also cause of the increase of the mineral [26]. All this advocates its agricultural reuse thus, irrigation supports water retention and water conservation and helps to protect surface waters from nutrient loading. One of the reasons for the high N content observed in the control soil (compared to the treatments irrigated with Körös River) (Table 5) may be caused by reduced nutrient uptake due to the lower biomass, which was limited by water and/or tree roots habitat [27]. The dilution of the reused water also resulted in a significant increase in nitrogen in the soil (Table 5).
Chlorophyll content is one of the indicators that can provide information on the health status of a plantation. Examining the chlorophyll content of the foliage of the test plants gives a more accurate picture of the changes caused by natural and anthropogenic stressors, as these affect the amount of chlorophyll. The change in the nitrogen content of the plant is also reflected in the chlorophyll content of the leaves. For this reason, a linear relationship is observed between the chlorophyll content and the nitrogen content of the leaves [28,29]. The change in our plant nitrogen content is reflected (r = 0.351, Pearson correlation) in the chlorophyll content of the leaves. Consequently, a linear relationship is observed between the SPAD value of the leaves and the nitrogen content [30]. The SPAD of the plants irrigated with effluent water exceeded the irrigated ones with Körös river water. However, it can be perceived that the quality of irrigation water also influenced this value. In the three years of irrigation, it can be observed that the leaves of willows irrigated with 60 mm of effluent water had the highest chlorophyll content.
The data show that the height of the willows has been decreasing year by year. At the same time, irrigation had a positive effect on plant growth, as we measured higher values in the latest measurement. In 2015, the plants reached 428 cm for treatment D, in 2016 the willows for treatment D were also the highest at 414 cm, and in the last year we measured the highest height data in E60 at 370 cm. Comparing the average highest and lowest plant height data, the difference between plant stands was 141 cm in 2015, 124 cm in 2016, and 120 cm in 2017, which also appears in the biomass product.
The trend is also observed in the N-level of willow leaves. Nitrogen stress is always reflected in the chlorophyll content of the leaves, because in general the chlorophyll content of the leaves is linearly related to the N content of the leaves [31,32]. It also serves as a reliable result for woody plants [33,34]. Furthermore, in the case of effluent irrigation, higher N concentrations are observed in the plant parts.
Potassium is the most abundant cation in plants. Plants actively accumulate large amounts of potassium, and are able to absorb significant amounts even from small concentrations of solution. It is found in greater amounts in meristems in organs with a vigorous metabolism. The K content of older organs decreases. The K-demand and K-content of plants thus change during the vegetation period [35]. In the case of K-levels measured in the plant parts of willow clones, an increasing trend can be observed every year. At the same time, higher element content is more characteristic in the leaf parts, the reason for which can be explained by the Na+/K+ ratio [36].
Sodium does not specifically activate many enzymes, in which K elements can be substituted; however, the effect of K is specific [37]. The C4 plants require microelement amounts of Na; however, it does not cause deficiency symptoms in C3 plants (SRC) [38]. Sodium is not essential even for extreme halophytes, only required in microelement amounts by C4 and CAM-type plants. Sodium becomes toxic to glycophytons when translocated into the sprout in significant amounts [39]. The development of the Na concentration of the plants was closely monitored, as significant amount Na is released into the area through the effluent water of the intensive African catfish farm. In the case of willow clones irrigated with effluent water, the Na content was most localized in the stem parts, during which an increase from year to year can be observed. The Na content of 114 mg/kg d.m. measured in the E60 treatment in 2017 is remarkable, which was 50% higher than the values measured in the control. However, this amount did not prove to be toxic for SRC plants.
The effluent with a higher P content had correlated (r = −0.579, Pearson correlation) negative effect on the P content of the plants. In SRC willow plants, phosphorus was mostly localized in the stem, to a lower extent in the leaf part. The difference is mostly observed in the case of the amount of irrigation water, where the P content of the examined plant parts decreased with the increase of the amount of irrigation water.
Our hypothesis that irrigation has a positive effect on biomass product has been confirmed. For both irrigation water qualities, the biomass product of non-irrigated control SRC willow clones exceeded [40,41]. Under lysimeter conditions, the biomass and irrigation water quality do not correlate with each other. However, some decrease in biomass production is observed from year to year. This reduction was due to the limited living space, as the 1 m3 vessel size of the lysimeters proved to be small over the years [42]. Although, the limited water supply caused a significant decrease in the biomass product. In the first year the biomass product of irrigated SRC willow plants was between 493–864 g/plant dry weight, in the second year 226–482 g/plant dry weight, in the third year 268–553 g/plant dry weight. Which is 170–250% higher than the average yield of the non-irrigated control.

5. Conclusions

The main objective of our study is the yield-enhancing effect of the irrigation utilization of effluent water from an intensive African catfish breeding farm in a short-cut energy willow plantation.
The experiment shows that N content of the effluent provably increased the nitrogen supply of the soil. These provides confidence that application of alternative water sources as irrigation water may reduce the nutrient load on surface waters and at could increase soil quality at the place of use. At the same time, it must be pointed out that the increase of the soil ESP due to the effluent water chemical properties (Na concentration, SAR value) was significant and in the long term it can lead to soil degradation (anthropogenic salinization). Nevertheless, it is suggested to improve the effluent water quality instead of ignore it, because an interesting finding of the present work was that improving the quality of the effluent water (by dilution and adding gypsum) is an effective method to reduce soil sodium accumulation.
Assessing to SPAD values and plant heights of the willow based on irrigation water quality it can be concluded that the sodium content of the effluent water do not cause any harmful effect on plants. In the leaf part of the willow, more N and Na were measured in the tissues than in stems and plant irrigated with effluent water had higher N and Na concentration than those irrigated with surface water. Further research may be required to examine the long term effect of the irrigation water salinity on the elements of the plant to explore the cause of the from year to year decline in biomass independently from the restricted habitat due to lysimeters volume.
The application of irrigation water had a positive effect on the biomass of the plants, significantly higher biomass was produced compared to the non-irrigated control willows.
In summary, the agronomic consequences are that alternative waters can provide an excellent opportunity for water-scarce regions, but paying attention to water quality parameters that limit use (salinization of the soil, nitrate leaching from the soil, salt stress of the cultivated plants etc.) is important.

Author Contributions

Conceptualization, I.K., Á.K., B.B., C.B., and M.J.; Data curation, I.K., Á.K., Formal analysis, I.K.; Funding acquisition, C.B.; Supervision, C.G., Methodology, I.K., Á.K., C.B. and M.J.; Writing—original draft preparation, I.K.; Á.K.; Writing—review and editing, I.K., Á.K. and M.J. All authors contributed critically to the drafts and gave final approval for publication. All authors have read and agreed to the published version of the manuscript.

Funding

This work was supported by the Hungarian Ministry of Agriculture under Project no. OD001 and by the National Research, Development and Innovation Office (GINOP-2.3.3-15-2016-00042 pro-ject), and by the Ministry of Innovation and Technology within the framework of the Thematic Excellence Programme 2020, Institutional Excellence Subprogramme (TKP2020-IKA-12). We gratefully acknowledge the staff of ÖVKI Lysimeter Station.

Institutional Review Board Statement

Not applicable.

Informed Consent Statement

Not applicable.

Data Availability Statement

The data presented in this study are available on request from the corresponding author. The data are not public, as this study is part of a forthcoming PhD dissertation.

Conflicts of Interest

The authors declare no conflict of interest.

References

  1. Barczi, A.; Joó, K.; Pető, Á.; Bucsi, T. Survey of the buried paleosoil under the Lyukas-mound in Hungary. Eurasian Soil Sci. 2006, 39, 133–140. [Google Scholar] [CrossRef]
  2. Bosco, C.; de Rigo, D.; Dewitte, O.; Poesen, J.; Panagos, P. Corrigendum to modelling soil erosion at European scale: Towards harmonization and reproducibility. Nat. Hazards Earth Syst. Sci. 2015, 15, 225–245. [Google Scholar] [CrossRef] [Green Version]
  3. Mikó, P.; Kovács, G.P.; Alexa, L.; Balla, I.; Póti, P.; Gyuricza, C. Biomass production of energy willow under unfavourable field conditions. Appl. Ecol. Environ. Res. 2014, 12, 1–11. [Google Scholar] [CrossRef]
  4. Hanley, S.J.; Karp, A. Genetic strategies for dissecting complex traits in biomass willows (Salix spp.). Tree Physiol. 2014, 34, 1167–1180. [Google Scholar] [CrossRef] [Green Version]
  5. Gencsi, L.; Vancsura, R. Dendrology; Mezőgazda Publisher: Budapest, Hungary, 1992. (In Hungarian) [Google Scholar]
  6. Koop, H. Vegetative reproduction of trees in some European natural forests. Vegetatio 1987, 72, 103–110. [Google Scholar]
  7. Blaskó, L.; Balogh, I.; Ábrahám, É.B. Possibilities of sweet sorghum production for ethanol on the Hungarian plain. Cereal Res. Commun. 2008, 36, 1251–1254. [Google Scholar]
  8. Szalay, D.; Papp, V.; Hodúr, C.; Czupy, I. Examination of bark content for different species of short rotation coppice. In Proceedings of the IOP Conference Series: Earth and Environmental Science, 5th International Conference on Environment and Renewable Energy, Ho Chi Minh City, Vietnam, 25–28 February 2019; Volume 307. [Google Scholar] [CrossRef] [Green Version]
  9. Shara, M.; Stohs, J.S. Efficacy and safety of white willow bark (Salix alba) extracts. Phytother. Res. 2015, 29, 1112–1116. [Google Scholar] [CrossRef]
  10. Gyuricza, C.; Nagy, L.; Ujj, A.; Miko, P.; Alexa, L. The impact of composts on the heavy metal content of the soil and plants in energy willow plantations (Salix sp.). Cereal Res. Commun. 2008, 36, 279–282. Available online: https://www.jstor.org/stable/90002695 (accessed on 12 March 2021).
  11. Smart, B.L.; Cameron, K.D. Shrub willow. In Handbook of Bioenergy Crop Plants; Kole, C., Joshi, C.P., Shonnard, D.R., Eds.; CRC Press: Boca Raton, FL, USA; London, UK; New York, NY, USA, 2012; pp. 687–708. [Google Scholar]
  12. Aronsson, P.; Perttu, K. Willow vegetation filters for wastewater treatment and soil remediation combined with biomass production. For. Chonicle 2001, 77, 293–299. [Google Scholar] [CrossRef] [Green Version]
  13. Tóth, F.; Zsuga, K.; Kerepeczki, É.; Nagy-Berzi, L.; Körmöczi, L.; Lövei, L.G. Seasonal differences in taxonomic diversity of rotifer communities in a Hungarian lowland oxbow lake esposed to aquaculture effluent. Water 2020, 12, 1300. [Google Scholar] [CrossRef]
  14. Richards, L.A. Diagnosis and improvement of saline and alkali soils. Agric. Handb. 1954, 60. [Google Scholar] [CrossRef]
  15. Castro, R.S.; Borges Azevedo, C.M.S.; Bezerra-Neto, F. Increasing cherry tomato yield using fish effluent as irrigation water in Northeast Brazil. Sci. Hortic. 2006, 110, 44–50. [Google Scholar] [CrossRef]
  16. Miranda, F.R.; Lima, R.N.; Crisóstomo, L.A.; Santana, M.G.S. Reuse of inland low-salinity shrimp farm effluent for melon irrigation. Aquac. Eng. 2008, 39, 1–5. [Google Scholar] [CrossRef]
  17. Al-Jaloud, A.A.; Hussain, G.; Alsadon, A.A.; Siddiqui, A.Q.; Al-Najada, A. Use of aquaculture effluent as a supplemental source of nitrogen fertilizer to wheat crop. Arid Soil Res. Rehabil. 1993, 7, 233–241. [Google Scholar] [CrossRef]
  18. Dhawan, A.; Sehdev, R.S. Present status and scope of integrated fish farming in the north-west plains of India. In Integrated Fish Farming; Mathias, J.A., Charles, A.T., Baotong, H., Eds.; CRC Press: Boca Raton, FL, USA; New York, NY, USA, 1994; pp. 295–306. [Google Scholar]
  19. Jahany, M.; Rezapour, S. Assessment of the quality indices of soils irrigated with treated wastewater in a calcareous semi-arid environment. Ecol. Indic. 2020, 109, 105800. [Google Scholar] [CrossRef]
  20. Malash, N.; Flowers, T.J.; Ragab, R. Effect of irrigation systems and water management practices using saline and non-saline water on tomato production. Agric. Water Manag. 2005, 78, 25–38. [Google Scholar] [CrossRef]
  21. Yu, Y.; Wen, B.; Yang, Y.; Lu, Z.H. The effects of treated wastewater irrigation on soil health. Adv. Mater. Res. 2011, 393–395, 1545–1549. [Google Scholar] [CrossRef]
  22. Shilpi, S.; Seshadri, B.; Sarkar, B.; Bolan, B.; Lamb, D.; Naidu, R. Comparative values of various wastewater streams as a soil nutrient source. Chemosphere 2018, 192, 272–281. [Google Scholar] [CrossRef]
  23. Purves, D. Waste materials deliberately added to the soil. In Trace-Element Contamination of the Environment; Elsevier: Amsterdam, The Netherlands, 1977; Volume 93. [Google Scholar]
  24. Hopkins, B.G.; Horneck, D.A.; Stevens, R.G.; Ellsworth, J.W.; Sullivan, D.M. Managing Irrigation Water Quality for Crop Production in the Pacific Northwest; Technical Report; Oregon State University Extension Service: Corvallis, OR, USA, 2007; Available online: https://catalog.extension.oregonstate.edu/sites/catalog/files/project/pdf/pnw597.pdf (accessed on 8 April 2021).
  25. Sheoran, P.; Basak, N.; Kumar, A.; Yadav, R.K.; Singh, R.; Sharma, R.; Kumar, S.; Singh, R.K.; Sharma, P.C. Ameliorants and salt tolerant varieties improve rice-wheat production in soils undergoing sodification with alkali water irrigation in Indo–Gangetic Plains of India. Agric. Water Manag. 2021, 243, 106492. [Google Scholar] [CrossRef]
  26. Truua, M.; Truua, J.; Heinsoo, K. Changes in soil microbial community under willow coppice: The effect of irrigation with secondary-treated municipal wastewater. Ecol. Eng. 2009, 35, 1011–1020. [Google Scholar] [CrossRef]
  27. Kun, Á.; Bozán, C.; Oncsik, B.M.; Barta, K. Calculation nitrogen and sodium budget from lysimeter-grown short-rotation willow coppice experiment. Columella 2018, 5, 43–51. [Google Scholar] [CrossRef]
  28. Carter, G.A. Ratios of leaf reflectances in narrow wavebands as indicators of plant stress. Int. J. Remote Sens. 1994, 15, 697–703. [Google Scholar] [CrossRef]
  29. Yoder, B.J.; Pettigrew-Crosby, R.E. Predicting nitrogen and chlorophyll content and concentrations from reflectance spectra (400–2500 nm) at leaf and canopy scales. Remote Sens. Environ. 1995, 53, 199–211. [Google Scholar] [CrossRef]
  30. Peng, Y.; Gitelson, A.A. Application of chlorophyll-related vegetation indices for remote estimation of maize productivity. Agric. For. Meteorol. 2011, 151, 1267–1276. [Google Scholar] [CrossRef]
  31. Niinemets, U.; Tenhunen, J.D. A model separating leaf structural and physiological effects on carbon gain along light gradients for the shade-tolerant species Acer saccharum. Plant Cell Environ. 1997, 20, 845–866. [Google Scholar] [CrossRef]
  32. Evans, J.R. Photosynthesis and nitrogen relationships in leaves of C3 plants. Oecologia 1989, 78, 9–19. [Google Scholar] [CrossRef]
  33. Pinkard, E.A.; Patel, V.; Mohammed, C. Chlorophyll and nitrogen determination for plantation-grown Eucalyptus nitens and E. globulus using a non-destructive meter. For. Ecol. Manag. 2006, 223, 211–217. [Google Scholar] [CrossRef]
  34. Chang, S.X.; Robinson, D.J. Nondestructive and rapid estimation of hardwood foliar nitrogen status using the SPAD-502 chlorophyll meter. For. Ecol. Manag. 2003, 181, 331–338. [Google Scholar] [CrossRef]
  35. Geirth, M.; Mäser, P. Potassium transporters in plants—Involvement in K+ acquisition, redistribution and homeostasis. FEBS Lett. 2007, 581, 2348–2356. [Google Scholar] [CrossRef] [Green Version]
  36. Freitas, S.W.; Oliveira, B.A.; Mesquita, O.R.; Carvalho, H.H.; Prisco, T.J.; Gomes-Filho, E. Sulfur-induced salinity tolerance in lettuce is due to a better P and K uptake, lower Na/K ratio and an efficient antioxidative defense system. Sci. Hortic. 2019, 257, 108764. [Google Scholar] [CrossRef]
  37. Nieves-Cordones, M.; Al Shiblawi, F.R.; Sentenac, H. Roles and transport of sodium and potassium in plants. In The Alkali Metal Ions: Their Role for Life; Sigel, A., Sigel, H., Sigel, R., Eds.; Springer: Cham, Switzerland, 2016; Volume 16, pp. 291–324. [Google Scholar] [CrossRef]
  38. Maathuis, F.J.M. Sodium in plants: Perception, signalling, and regulation of sodium fluxes. J. Exp. Bot. 2014, 65, 849–858. [Google Scholar] [CrossRef] [PubMed]
  39. Kronzucker, H.J.; Coskun, D.; Schulze, M.L.; Wong, J.R.; Britto, T.D. Sodium as nutrient and toxicant. Plant Soil 2013, 369, 1–23. [Google Scholar] [CrossRef] [Green Version]
  40. Jerbi, A.; Brereton, N.J.B.; Sas, E.; Amiot, S.; Lacsapelle-T, X.; Comeau, Y.; Pitre, F.E.; Labrecque, M. High biomass yield increases in a primary effluent wastewater phytofiltration are associated to altered leaf morphology and stomal size in Salix miyabeana. Sci. Total Environ. 2020, 738, 139728. [Google Scholar] [CrossRef] [PubMed]
  41. Aasamaa, K.; Heinsoo, K.; Holm, B. Biomass production, water use and photosynthesis of Salix clones grown in a wastewater purification system. Biomass Bioenergy 2010, 34, 897–905. [Google Scholar] [CrossRef]
  42. Oddiraju, V.G.; Beyl, C.A.; Barker, P.A.; Stutte, G.W. Container size alters root growth of western black cherry as measured via image analysis. Hort. Sci. 1994, 29, 910–913. [Google Scholar] [CrossRef] [Green Version]
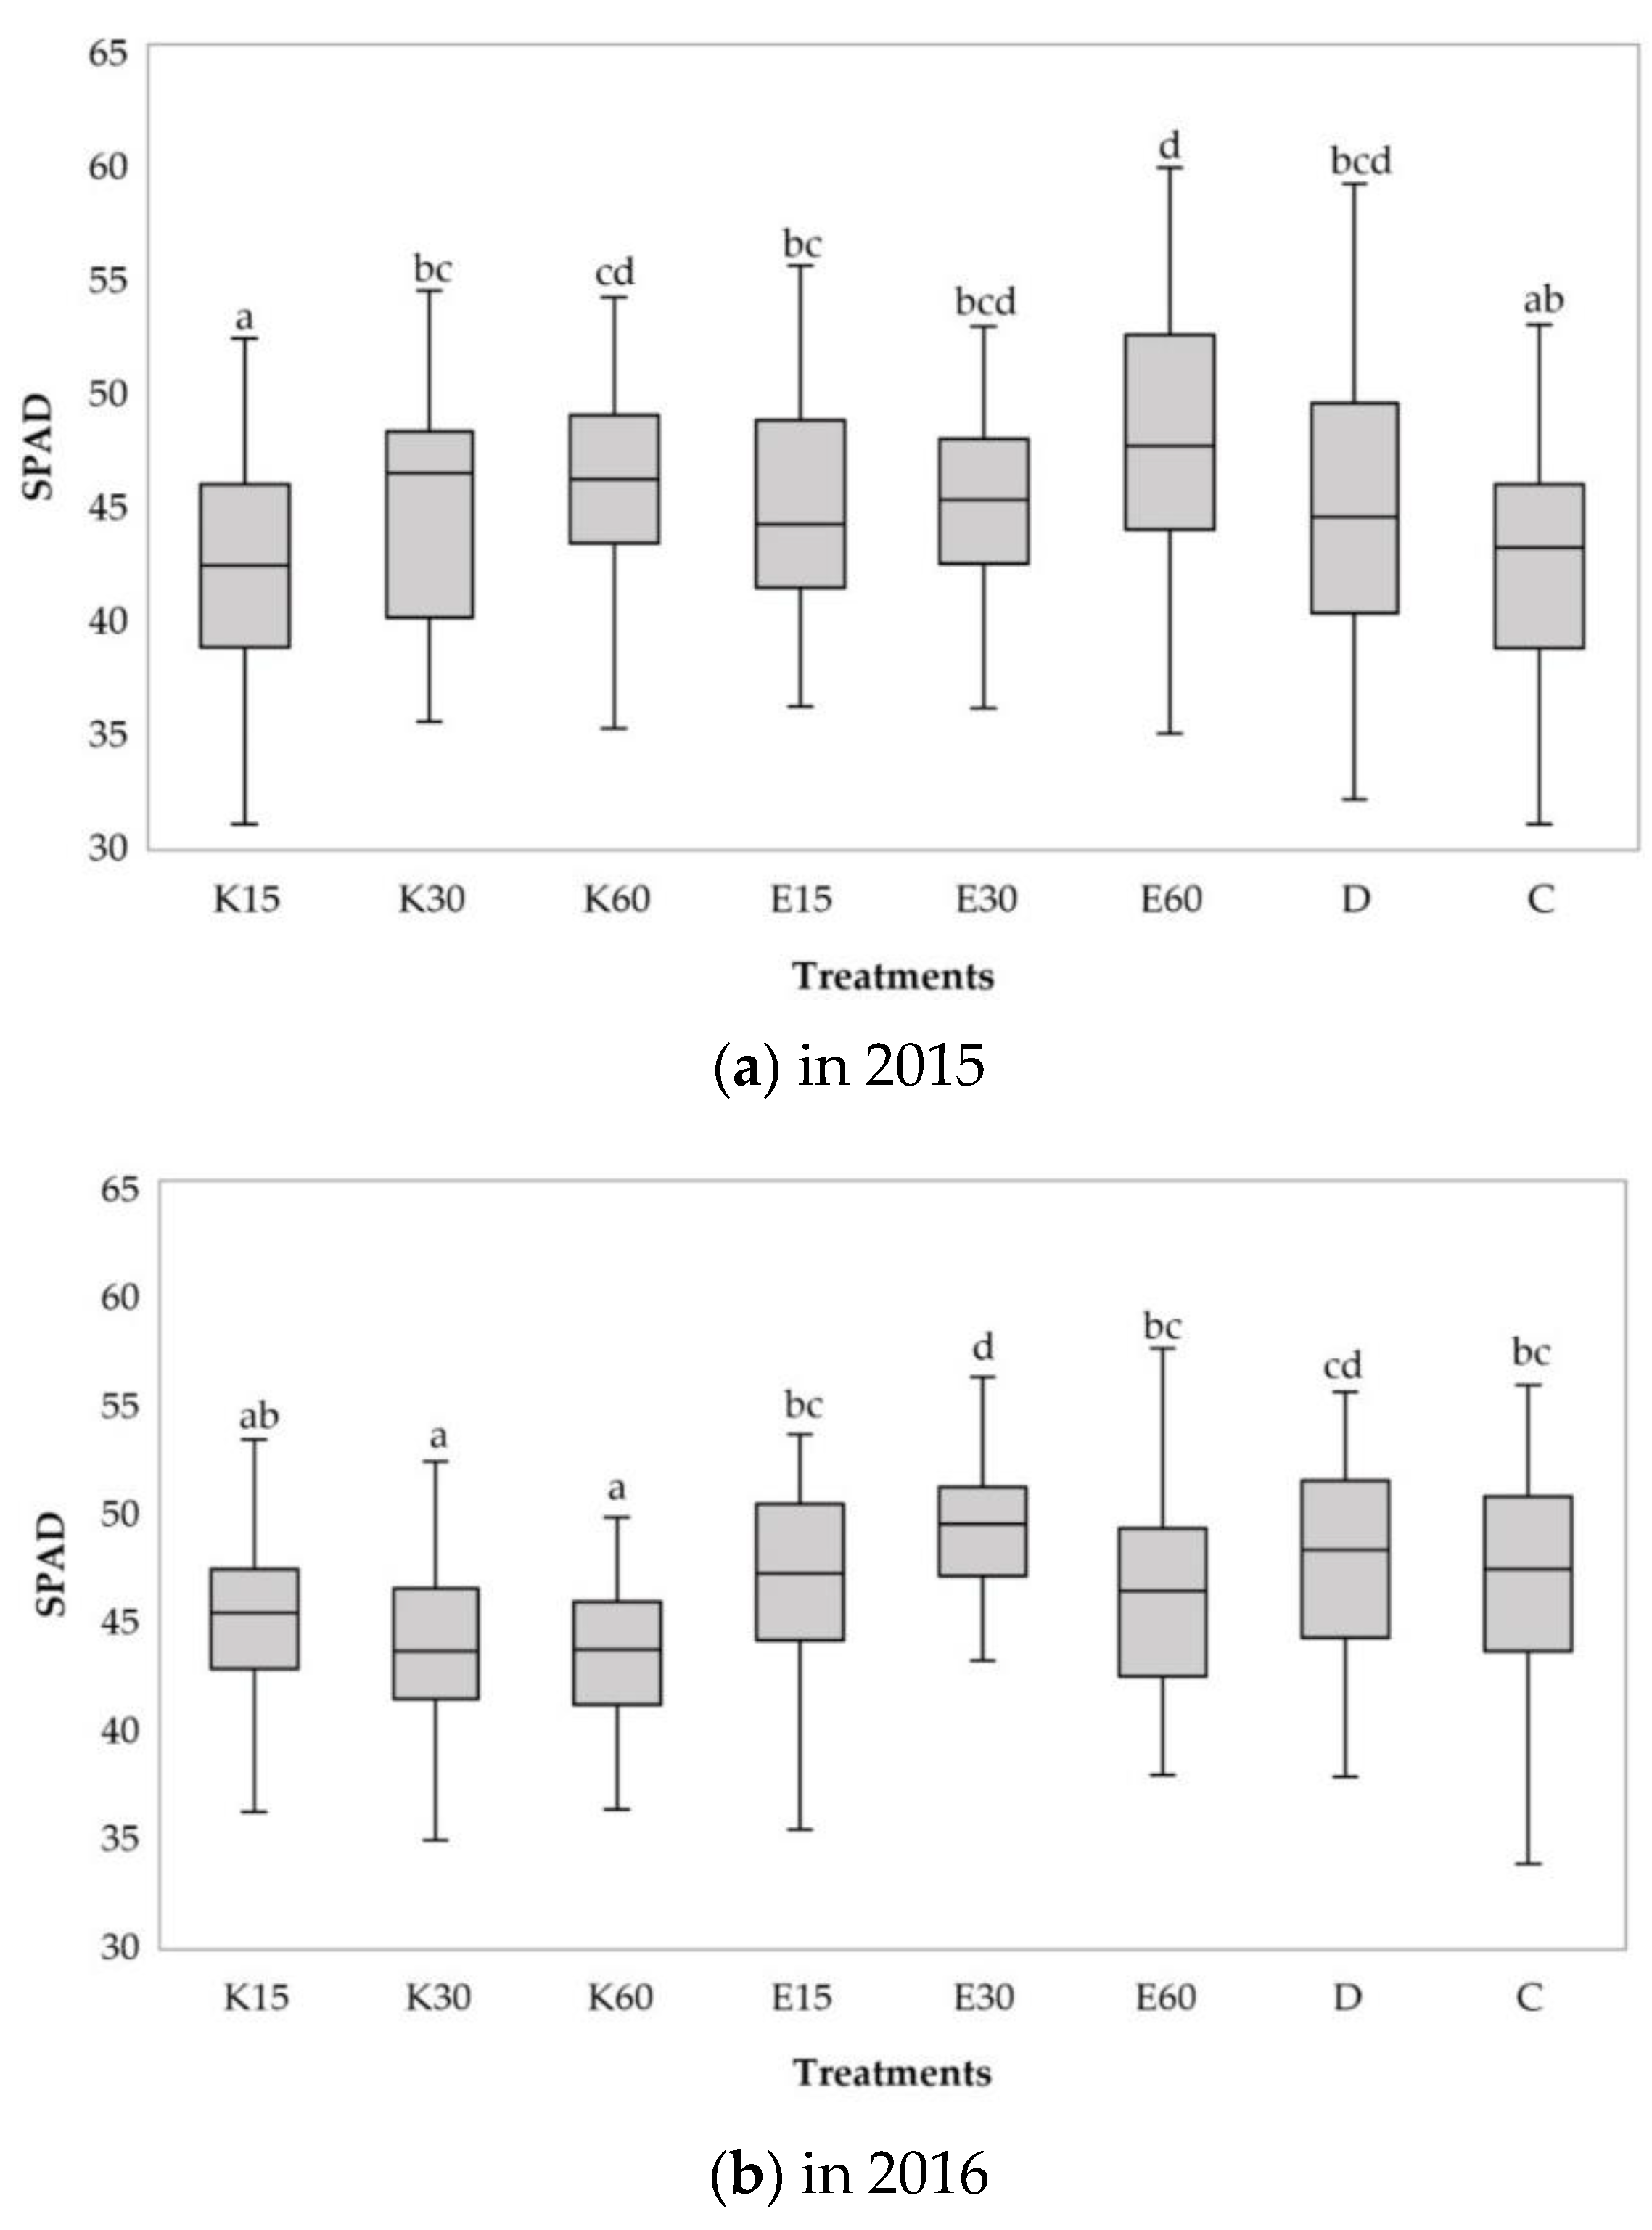
Figure 1. Chlorophyll values from 2015 to 2017 growing years: (a) SPAD values of S. alba energy willow coppice in a year of 2015; (b) SPAD values of S. alba energy willow coppice in a year of 2016; (c) SPAD values of S. alba. energy willow coppice in a year of 2017. Average chlorophyll content data are presented from eight treatments. Results are means ± SD, n = 6. Different letters introduce significant differences among irrigation water qualities for the three vegetation season, in year of 2015 and 2016 confirming to the Tukey’s test at p ≤ 0.05, and in year of 2017 corroborating to the Games-Howell test at p ≤ 0.05.
Forests 12 00457 g001aForests 12 00457 g001b
Figure 2. Plant height values from 2015 to 2017 growing years: (a) height values of S. alba energy willow coppice in a year of 2015; (b) height values of S. alba energy willow coppice in a year of 2016; (c) height values of S. alba energy willow coppice in a year of 2017.
Forests 12 00457 g002
Figure 3. Nitrogen content values of leaf and stem parts from 2015 to 2017: (a) nitrogen content values of leaf parts in a year of 2015–2017; (b) nitrogen content values of stem parts in a year of 2015–17. Average nitrogen content data are presented from eight treatments. Results are means ± SD, n = 6. Treatments were compared annually. Different letters introduce significant differences among irrigation water qualities for the three vegetation season, confirming to the Tukey’s test at p ≤ 0.05.
Forests 12 00457 g003aForests 12 00457 g003b
Figure 4. Potassium content values of leaf and stem parts from 2015 to 2017: (a) potassium content values of leaf parts in a year of 2015–2017; (b) potassium content values of stem parts in a year of 2015–2017. Average potassium content data are presented from eight treatments. Results are means ± SD, n = 6. Different letters introduce significant differences among irrigation water qualities for the three vegetation season, confirming to the Tukey’s test at p ≤ 0.05.
Forests 12 00457 g004
Figure 5. Sodium content values of leaf and stem parts from 2015 to 2017 growing years: (a) sodium content values of leaf parts in a year of 2015–2017; (b) sodium content values of stem parts in a year of 2015–2017. The year of 2015 average sodium content data are presented from eight treatments. Results are means ± SD, n = 3. The letters introduce significant differences among irrigation water qualities for the three vegetation season, confirming to the Tukey’s test at p ≤ 0.1. The year of 2016 and 2017 average sodium content data are presented from six samples per treatment. Results are means ± SD, n = 6. Different letters introduce significant differences among irrigation water qualities for the three vegetation season, confirming to the Games-Howell’s test at p ≤ 0.05.
Forests 12 00457 g005
Figure 6. Biomass dry weight of short rotation willow coppice from 2015 to 2017. Average dry weight data are presented from eight treatments after harvesting. Results are means ± SD, n = 8. Different letters introduce significant differences among irrigation water qualities for the three vegetation seasons, confirming to the Games-Howell’s test at p ≤ 0.05.
Forests 12 00457 g006
Table 1. Meteorological data of 2015–2017 during the irrigation period.
Average Temperature (°C)Precipitation Amount (mm)
1981–20102015201620171981–2010201520162017
January−1.02.2−0.9−6.729.158.861.628.3
February0.52.46.02.629.917.388.530.2
March5.67.47.39.427.825.520.013.4
April11.511.513.411.042.08.212.349.7
May16.817.116.617.250.653.718.840.9
June19.821.221.322.161.321.0124.469.3
July21.924.422.522.857.531.4123.631.8
August21.424.221.123.750.740.950.533.3
September16.618.718.316.647.864.09.874.2
October11.210.49.811.632.4105.272.733.7
November5.06.35.06.041.33.249.639.6
December0.32.6−1.22.744.84.51.089.2
Average/Summa10.812.411.611.6515.3433.7633.6533.6
Table 2. The amount of irrigation water applied per year and distribution of precipitation during studied vegetation period.
Irrigation Water DosesPossibility of Irrigation during the Investigated PeriodAmount of Water Applied by Irrigation (mm)Precipitation during the Investigated Period (mm)Amount of Available Water Quantity during the Investigated Period (mm)
201515 mm15 *310105415
30 mm520625
60 mm9401045
201615 mm690308398
30 mm180488
60 mm360668
201715 mm9135184319
30 mm270454
60 mm540724
* During the first irrigation, each treatment received uniformly 100 mm of River Körös irrigation water.
Table 3. Average major quality parameters of irrigation water used under experiment.
ECNH4-NNPKNaSAR
(µS/cm)(mg/L)(mg/L)(mg/L)(mg/L)(mg/L)
Effluent water1306.721.9293.97.2273.511.9
Körös River water388.30.41.20.24.331.31.2
Diluted water1073.010.313.31.75.4132.33.5
Table 4. Changes of the exchangeable sodium adsorption ratio between 2015 (before experiment) and 2017 (after experiment).
Exchangeable Sodium Percentage ΔESP (2015–2017)
Depth of Soil LayerIrrigation WaterIrrigation Water Amount
15 mmp-Value 130 mmp-Value 160 mmp-Value 2Non-Irrigated
Mean ± Std. Deviation
0–20 cmEffluent water4.66 ± 0.6***5.9 ± 0.77***6.85 ± 0.10 c***Non-irrigated
0–20 cm:
0.36 ± 0.2
Körös River water0.05 ± 0.10.5 ± 0.35−0.62 ± 0.16 a
Diluted water----2.19 ± 0.30 b
20–40 cmEffluent water2.85 ± 1.1*3.5 ± 1.10**5.82 ± 0.64 c***Non-irrigated
20–40 cm:
0.33 ± 0.1
Körös River water0.14 ± 0.10.4 ± 0.36−0.68 ± 0.08 a
Diluted water----1.85 ± 0.45 b
40–60 cmEffluent water1.02 ± 0.8n.s.1.8 ± 0.05***4.38 ± 0.74 c***Non-irrigated
20–40 cm:
0.32 ± 0.4
Körös River water0.02 ± 0.20.4 ± 0.09−0.53 ± 0.23 a
Diluted water----1.19 ± 0.13 b
Comment: * p < 0.05; ** p < 0.01; *** p < 0.001. The negative values means the decrease during three experimental year. For each treatment, soil sampling was collected from three (0–20, 20–40, 40–60 cm) depth levels. During the statistical evaluation, an independent t-test (1) was used for the 15 mm and 30 mm irrigated samples, and an ANOVA (2) test was used for the 60 mm samples. Results are means ± SD, n = 3. Different letters introduce significant difference confirming to the Tukey’s post hoc test at p ≤ 0.05.
Table 5. Available nitrogen (KCl-NO2+NO3-N) content of soil in 2017.
Available N2017 (mg/kg)
Irrigation waterIrrigation water amount
15 mm30 mm60 mm
Mean ± Std. Deviation
Effluent water13.43 ± 7.71 a16.65 ± 4.04 b15.46 ± 3.29 c
Diluted water--7.52 ± 3.85 b
Körös River water7.02 ± 3.85 a3.65 ± 0.78 a *2.96 ± 0.28 a *
Non-irrigated control11.70 ± 4.53
For each treatment, soil sampling was collected from three (0–20, 20–40, 40–60 cm) depth levels. During the statistical evaluation, an independent t-test (1) was used for the 15 and 30 mm irrigated samples, and an ANOVA (2) test was used for the 60 mm samples. Results are means ± SD, n = 9 (the values of the samples from different depths were considered as repetitions of each other). Different letters introduce significant difference among different treatment, confirming to the Tukey’s test at p ≤ 0.05 at 60 mm. The stars are indicated the significant difference from the non-irrigated control (p < 0.01).
Table 6. Phosphorus content measured in the plant parts of SRC willow clones irrigated with effluent water from an intensive catfish farm. Average phosphorus content data are presented from five treatments. Results are means ± SD, n = 6. Different letters introduce significant differences among irrigation water qualities for the three vegetation seasons, confirming to the Tukey’s test at p ≤ 0.05.
E15E30E60DC
2015leaf3023 ± 241 b2737 ± 95 ab2180 ± 370 a1990 ± 144 a3340 ± 419 b
20162643 ± 57 ab1865 ± 210 a2007 ± 519 ab2850 ± 365 b1855 ± 219 a
20172428 ± 19 ab2272 ± 127 ab2532 ± 196 ab2723 ± 118 b2123 ± 66 a
2015stem1537 ± 35 c1050 ± 221 ab1330 ± 193 bc813 ± 79 a1647 ± 146 c
20162192 ± 201 bc2010 ± 172 ab1788 ± 244 a2457 ± 201 c1740 ± 146 a
20171616 ± 209 a1596 ± 169 a1422 ± 266 a2003 ± 239 b1693 ± 90 ab
Publisher’s Note: MDPI stays neutral with regard to jurisdictional claims in published maps and institutional affiliations.