Article

Productivity of Black Locust (Robinia pseudoacacia L.) Grown on a Varying Habitats in Southeastern Poland

by
Artur Kraszkiewicz
Department of Machinery Exploitation and Management of Production Processes, University of Life Sciences in Lublin, Głęboka Street 28, 20-612 Lublin, Poland
Forests 2021, 12(4), 470; https://doi.org/10.3390/f12040470
Submission received: 25 February 2021 / Revised: 8 April 2021 / Accepted: 8 April 2021 / Published: 12 April 2021

Abstract

:
This study investigated growth performances of black locust (Robinia pseudoacacia L.) tree species in various soil and agro-climatic conditions in Poland. Implementing of research was based on monoculture black locust stands in which it was possible to carry out dendrometric tests allowing us to learn about their volume. These stands were located on marginal soils. In the sample plots selected for the study, the parameters of stands (main and secondary) were determined, such as number and social structure of trees, average tree height, average diameter at breast height (DBH), and volume. The volume was determined with division into trunks and branches and wood thickness classes (0.0–1.0 cm, 1.1–5.0 cm, 5.1–10.0 cm and then every 5 cm). During the research, it was found that sunlight and moisture conditions mainly affect the volume. It has been noticed that the content of nutrients in the soil plays a minor role because black locust grows very well in poorly fertile soils, often subject to erosion processes. Black locust grows well on damp, shaded slopes with northern exposures. In such areas, the stand volume was the highest (353.8 m3 ha−1), exceeding the average volume of the remaining 35-year-old stands on sandy soils by 60%. Along with the increase in the age of stands, the share of trunk wood increased with the wood of branches. The share of wood up to 5.0 cm was small in older stands, at most a dozen or so percent. However, in young stands (4- and 8-year-old), the share of the thickness class up to 5 cm was even 65% of the stand volume. In 35-year-old stands, wood fractions of 15.1–20.0 cm were dominant. In the oldest, 64-year-old stand, over 30 cm thick wood constituted 44% of the stand volume. However, statistical analysis showed, with p = 0.1644, no differences existed between the thickness of the individual thickness classes.

1. Introduction

The black locust (Robinia pseudoacacia L.) in Europe is an introduced species from North America [1]. It was initially used for ornament purpose in parklands or as melliferous [2,3]. Later the species has been grown for economic uses specially woods (venial wood, utility wood, mine wood, and firewood) [4,5,6,7,8] and environmental conservation (soil erosion control) [9,10,11,12,13,14,15,16,17]. Recently, there has been an increase in interest in this species for cultivation in short rotation energy crops [18,19,20,21,22,23,24]. This approach is to reduce the use of forest wood for energy purposes [25,26]. In line with the concept of sustainable development, the possibility of establishing plantations in degraded, erosion-endangered, and unsuitable areas for agriculture should be increased [27,28]. In depth knowledge on the species growth performances under different soil and agroclimatic conditions would help policy decision makes, tree growers, and farmers to make right decision of growing and managing the tree species.
The results of these studies indicate that the production and properties of wood depend on the habitat conditions and coexistence of trees in the group. Black locust grows best on moisture, fertile, calcareous clay soils [1]. Also optimum for black locust is tufted and brown soils: plump, airy, fresh, rich in calcium, with a pH in the range of 4.6–8.2, but also grows well on others (except marshland), including on stony, non-cariogenic, sand and dry ones [2,3,4,11,13]. Additionally, studies by Mantovani et al. [29,30] indicate that this species is not from the group of water-savers, and with its abundance it corresponds to an increase in weight gain—most intensively in August. In addition to the habitat, the productivity and structure of forest stand classes is affected by coexistence in the context of tree competition. These studies indicate that, along with the deterioration of the biosocial position of trees in the stand, in the shade under the canopy of the main trees, the annual growth rate of wood decreases [31,32,33,34,35].
In research on the productivity of black locust stands relating to the habitat and biosocial position of trees, there is often no reference to their impact on the structure of individual wood thickness classes. Much attention in the literature is devoted to the creation of mathematical models to estimate the abundance of stands [35,36,37,38,39,40,41,42,43]. The most popular method of creating biomass models is combining the biomass data of a tree or its components, such as stems, branches, leaves or roots, with one or more easily measurable dendrometric variables, e.g., breast height diameter, wood thickness. Therefore, under the conditions of the Polish agroclimatic, it was decided to conduct research updating the knowledge on the thickness of the black locust stands. Taking into account also factors such as moisture and soil fertility. It is also important to what extent age cause changes in the thickness of individual classes of wood biomass. Such data should supplement the pool of information forming the basis for the development of mathematical models estimating the amount of biomass produced.
The study aimed to assess the productivity and quantitative structure in individual thickness classes of the black locust wood biomass obtained in 14 stands of different age and habitat conditions of marginal soils.

2. Materials and Methods
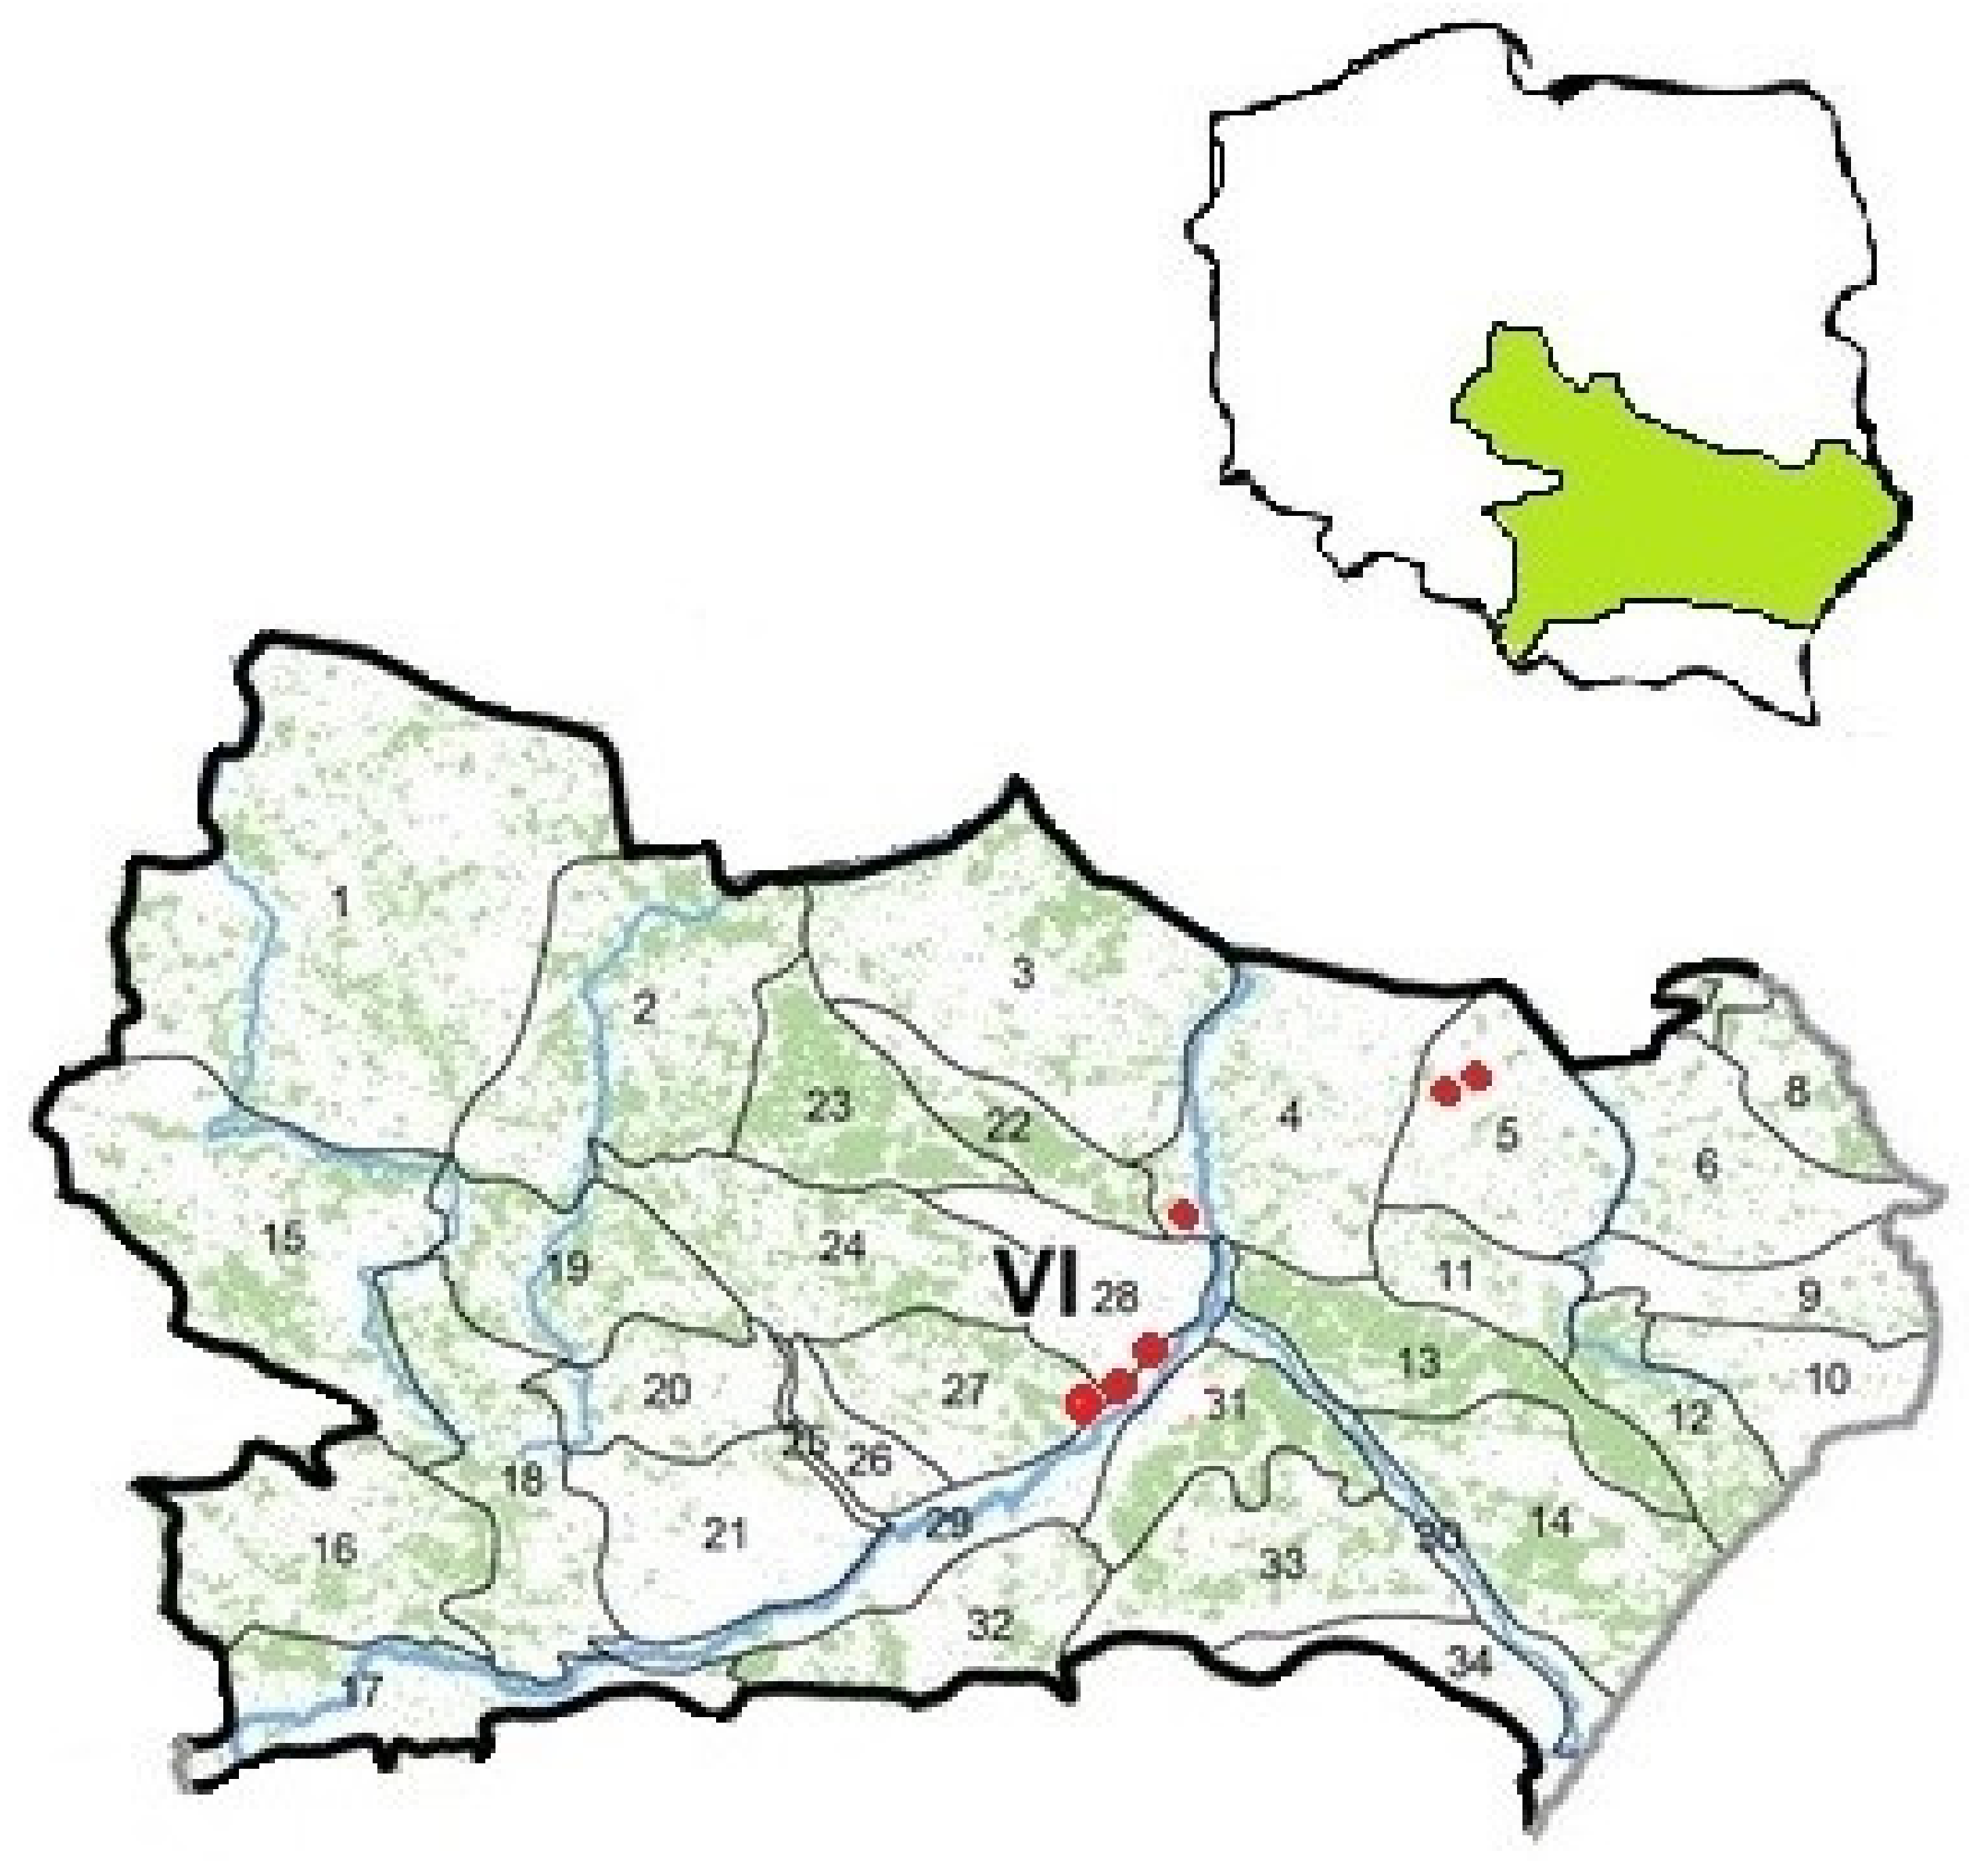
2.1. Study Sites

The research was carried out based on monoculture black locust stands in six sites (including single or groups of stands) in the Małopolska Kraina (according to the nature and forest regionalization of Poland [44])—Figure 1. Monoculture stands guided the selection of sites with an area and number of trees enabling separation of representative sample areas and collection of representative sample trees, and the existence of source materials enabling the reconstruction of the history of stands.
Upland areas dominate in the Małopolska Kraina (VI), but there are also significant areas of valley bottoms and terraces with dunes. The climate is relatively diversified due to the diversification of the topography, with the features of continentalism increasing to the east. The average annual air temperature in the western and southern parts of the region ranges from 8.0 to 8.5 °C, and in the eastern part—Up to 7.5 °C. In most areas, the growing season lasts 200–210 days, and the average annual rainfall amounts to 650 mm [44].
Due to the diversity of the topography, soil formation, and moisture in the Małopolska Kraina, there is a large diversity of stands. The subcontinental oak–hornbeam forests are characteristic for this land—i.e., linden, oak, and hornbeam forests, mainly in the Lesser Poland variety. They are located in half of the area of this region. Mixed forests are more numerous in its western part. Forests are mainly found in upland areas and wet and marshy areas. The forest cover in the region is 24.9%. At the same time, in the mesoregions, it ranges from 2%–4% in Podgórze Rzeszowskie (VI.34) and the Lower San River Valley (VI.30) to 60% in the Świętokrzyski Forest (VI.23) and 65% in Solski Forest (VI.13). The average stand volume is 239 m3 ha−1. In mesoregions, it ranges from 166 m3 ha−1 in Górny Śląsk to 287 m3 ha−1 in the West-Lublin Upland mesoregion. In the Małopolska Kraina, protective forests (mainly water-proof, damaged, and around towns) constitute over 63% of the forest area of the State Forests (SF). Damaged forests are over 80% of the SF areas in mesoregions with well-developed industries, including Górny Śląsk (VI.16) [44].
The research sites were located in several mesoregions of the natural and forest districts marked with the numbers VI.4, VI.5, VI.27, VI.28, and VI. 29 (Figure 1), differing in the natural conditions of forest production.
The Dębno site is located in the West-Lublin Upland mesoregion (VI.4). The forest cover is small and amounts to 16%. The forests form small and medium-sized complexes; they occupy about 516 km2, 45% of which is on the Regional Directorate of State Forests (RDSF) board in Lublin. Snopków and Lublin sites are located in the East-Lublin Upland mesoregion (VI.5)—Figure 1. It is distinguished by fertile soils made of loess and “loess-like” dusts and, therefore, the lowest forest cover amounting to 14%. The forests form small complexes; they occupy about 291 km2, of which over 73% is managed by RDSF in Lublin [44].
The Skrzypaczowice and Zawidza sites are located in the Opatowski (VI.28) and Chmielnicko-Staszowski (VI.27) mesoregions. The Opatów area is covered with loess, which is the dominant geological formation. In the southern part of the mesoregion, there are Pleistocene tills, sands, and glacial gravels of the South Polish Glaciation, and occasionally—Cambrian deposits, on small areas mainly sandstones, claystones, conglomerates, and duststones. The mesoregion is dominated almost exclusively by broadleaf vegetation with the participation of luminous oak trees. The forest cover is very low, amounting to 4%. Forests in the form of very small complexes cover about 52 km2, of which RDSF Radom manages 51%. However, the Chmielnik–Staszów area is covered with Pleistocene tills, sands, and glacial gravels of the South Polish Glaciation. Much smaller areas are occupied by the formations of the Neogene period—Organo-detritus and sulfur-bearing limestones, gravel, sandstone, and gypsum. Besides, eolian sands—locally in the dunes and loess—occur sporadically. The forest cover is average and amounts to 30%. The forests form small and medium-sized complexes; the largest are located in the eastern part of the mesoregion. The forests cover approximately 476 km2, of which 67% is managed by the RDSF in Radom.
Piaseczno site is located in the Vistula Lowland mesoregion (VI.29). There are definitely Holocene geological formations—sands, gravels, river bogs, peat, and dust. The dominant vegetation landscape in this area is the ash and riparian elm forests. The mesoregion’s forest cover is low and amounts to 6%. About 93 km2 area covered by forests, 39% of which is managed by the State Forests. The mesoregion is narrow and elongated, and within its borders, there is a small area of RDSF in Radom [42]. However, it should be noted that the Piaseczno site is an artificial structure—an external dump of the sulfur mine in Piaseczno, 40 m high, and slope inclination 60%–80%, built of various formations and with a large variety of habitats [11,45].
In each of the sites, tree stands with one or more features influencing wood production’s natural and economic conditions were selected: habitat factors, age, origin, the intensity of care, and breeding treatments. Fourteen stands were distinguished, including:
five on sands (loose sands)—No. 1–5—All in the Piaseczno site, derived from planting, at the age of 35, on the slopes of the dump with various exposures (N—Surfaces No. 1 and 2 located in the upper and lower parts of the slope, respectively, SE—No. 3 and 4—The upper and lower part of the slope, S—No. 5—The upper part of the slope), without felling (without harvesting);
three in the clay—No. 6–8—two in the Piaseczno site, derived from planting, at the age of 35, (located in the upper parts of the slopes, No. 6—N exposure, and No. 7—S exposure) under development conditions such as stands No. 1–5, and one in the Zawidza site (No. 8) in the managed forest (with intermediate cutting—Breeding cuts), at the age of 41, in the plain;
six on dust formations (loess and loess-like)—In the sites: Dębno (No. 9, the lower part of the valley slope, with S exposure and 40% slope)—33-year-old stand from self-seeding, systematically cut; Skrzypaczowice (No. 10)—A 64-year-old commercial stand, planted, located in the central part of the eroded slope with an SE exposure and a 15% slope; Lublin (No. 11)—4-year self-seeding trees located on a plain area; Snopków (No. 12–14)—3-row mid-field, 8-year-old plantings, No. 12 and 13 located in a flat area, and No. 14 in the upper part of the valley slope, with S exposure and a 15% slope.
Detailed characteristics of the Piaseczno site and the history of tree stands are provided in the publications of Ziemnicki et al. [45], Węgorek [34], and Kraszkiewicz and Węgorek [46]. Developing tree stands in the Snopków site are described by Orlik et al. [39] and Węgorek and Kraszkiewicz [40]. The data on stands in the Zawidza and Skrzypaczowice sites were given according to the source materials of the Zawidza forestry in the Dębno site—according to information from the farm owner, and in the Lublin site—based on own observations.

2.2. Biomass Sampling

In the black locust stands selected for research to assess fertility, the following was determined:
(a).
Stand parameters—By the method of sample plots of 500 m2 (20 × 25 m2) in stands No. 1–11 and 400 m2 in stands No. 12–14 (rows of trees 80 m long and 5 m wide):
­the number and social structure of trees according to the tree biological classification of Kraft, considering the main and secondary stands;
average height of trees (in main and secondary stands)—as the arithmetic mean of DBH measured with the SUUNTO altimeter with an accuracy of 0.25 m;
mean DBH (in main and secondary stands)—as the arithmetic mean of DBH measured with a precision HAGLOF caliper with an accuracy of 0.5 cm;
(b).
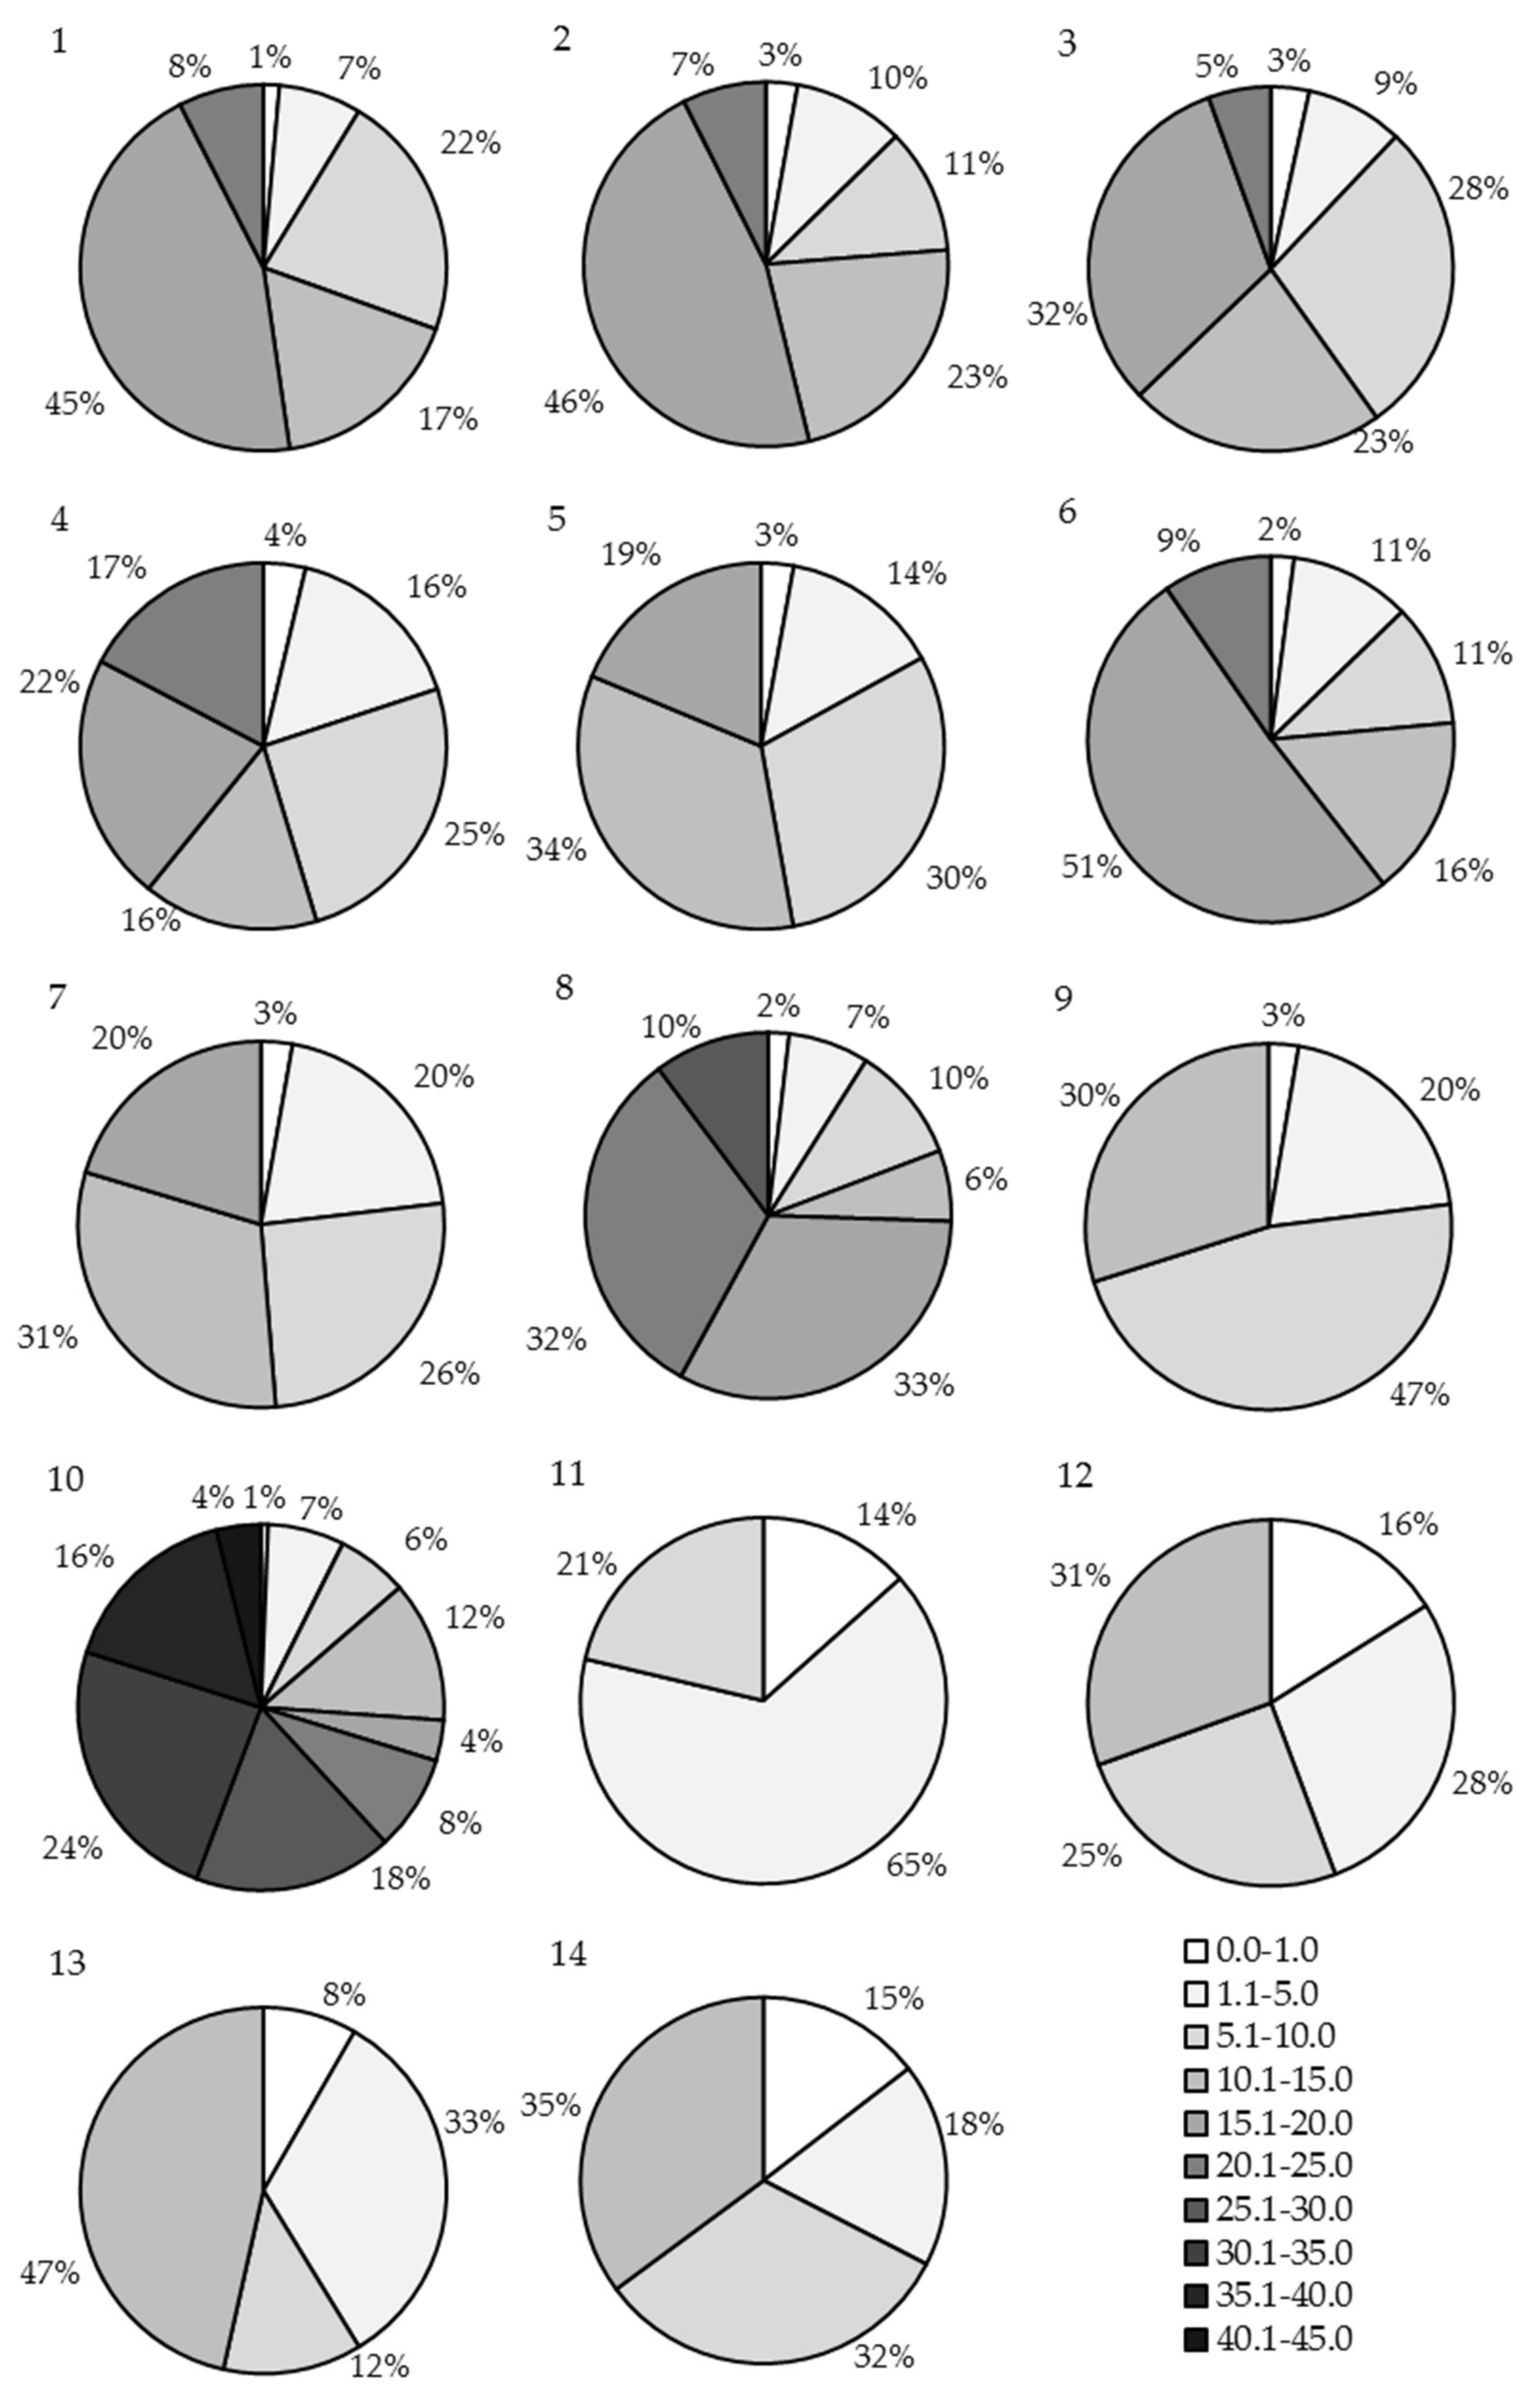
Volume with division into trunks and branches and wood thickness classes (0.0–1.0 cm, 1.1–5.0 cm, 5.1–10.0 cm and then every 5 cm)—using the sample tree’s method. One tree of average height and DBH each and average conformation from each sample plot (main and secondary stands) [47]; a conductor was considered as a trunk from the point of cut (5–10 cm above the ground) to a diameter of 5 cm in the bark (in the upper end); the remaining, thinner part (top) was classified as a branch; the sample trees were cut with a chainsaw at the end of December:
trunk volume in the bark—sectional method (section length 1 m);
branch volume in the bark—using the xylometric method.

2.3. Statistical Analysis

The obtained results, were subjected to analysis of variance (ANOVA) analysis for factorial systems. The qualitative factors were the age of the stands as well as the individual thickness classes. Statistical analyzes verifying differences in wood volume in individual thickness classes were carried out individually within a single age group (where there was an appropriate amount of data—only stands at the age of 8 and 35), as well as in the following groups: all together; 4 and 8; 35 and 41; 33 and 35; 33, 35, and 41 as well as 33, 35, 41 and 64. Additionally, the probability of differences between the volume of wood in all stands between the following pairs of thickness classes was determined: 0.0–1.0 cm and 1.1–5.0 cm; 1.1–5.0 cm and 5.1–10.0 cm; etc. Prior to these analyses, the consistency of results with the normal distribution was verified using the Shapiro–Wilk method, and the homogeneity of variance was estimated using the Brown–Forsyth test. The observed differences were considered statistically significant at the significance level of p-value < 0.05. Additionally, for the distribution of wood volume in individual stands with division into thickness classes, trend lines were determined, which were described with a second-degree polynomial and the coefficient of determination R2.

3. Results

3.1. Characteristics of Soils

Table 1 shows the surface coverage by layers of vegetation (covering plant layers) and the soil profiles’ basic features under the stands.
The layer of trees was generally characterized by good compactness. The most common surface coverage was 80%, and in the stands in the Snopków site (No. 12–14)—90%. It should be noted, however, that the compactness in stands No. 12–14 was so high only in the rows of trees, and there was full access of sunlight on both sides of the rows. The lowest coverage (50%) of the tree layer was in stands used for pole-cuts (No. 8 and 10). The shrubs (as an under-emergent layer) cover from 20% to 60% of the area, and the ground cover—30%–100%. In the four-year-old stand in the Lublin site (No. 11), the layer of trees has not yet developed—from the viewpoint of the height achieved by black locust trees—and they constituted a shrub layer (Table 1).
The litter was 1–5 cm thick, depending on the site in the relief, species composition, and the degree of surface coverage by plant layers (Table 1). The humus layer of the soil under very young tree stands established on agricultural land exceeded 20 cm, in old stands (No. 8 and 10), it was 10 cm, and in stands in the wasteland (depending on the site)—2–8 cm (Table 1).
Table 2 shows the abundance of soils determined based on the average content of basic nutrients in a layer of 0–50 cm. The nitrogen volume was determined by the Kowalkowski method [48] and the phosphorus and potassium content according to the scale provided by Baule and Fricker [49].
On the sand slopes of the sulfur mine dump (tree stands No. 1–5), the soil abundance in nutrients was insufficient, and the organic carbon content was very low, ranging from slightly over 2 to almost 3 g kg−1. In clay formations, only nitrogen supply was at an average level, and there was twice as much carbon as in sand formations. Forest stands on agricultural land with soils made of dusty formations (No. 12–14) were supplied with nutrients, usually at a good level (others at an average level), with a soil carbon content of about 4 to over 10 g kg−1 (Table 2). The ratio of carbon to nitrogen (C:N) was low (below 10—Table 2), which indicates the rapid mineralization of organic matter [50], and the insufficient nitrogen content in the soil indicates this element was incorporated quickly into the stand production process.

3.2. Characteristics of Forest Stands

Table 3 presents the characteristics of the tree stands influencing their volume.
In the 35-year-old stands No. 1–7 (Piaseczno), where no compacting treatments were performed (no felling was performed), under the canopy of trees forming the main stands (under the conditions of the research, these were trees belonging to biological class II and III), secondary tree stands formed composed of captured, jammed and dead trees (IV and V biological classes). The number of trees in the main stands ranged from 580 to 1029, and in the secondary stands—575–1525 pcs. ha−1. In more than half of the stands, the numbers of trees in the secondary stands were greater than in the main stands, and in stands No. 3 and 4, they constituted 67% and 71% of the total number of trees, respectively. The average height of the main stands was 15.5–19.0 m. The trees reached the highest heights on clay soils (stands No. 6 and 7). Average tree heights in the secondary stands were 4–7 m lower than in the main stands. The average DBH in the main stands ranged from 16.0 cm on the sand slope with southern exposure (stand No. 5) to 23.5 cm on the lower part of the sand embankment with the south-eastern exposure. The mean DBH in the secondary stands was even—8.5–10.0 cm (Table 3).
In stands No. 8–14, there were no secondary stands due to intensive thinning (stands No. 8 and 10), the ongoing removal of mastered trees (stand No. 9), or too young age (stands No. 11–14). In these stands, as in stands No. 1–7 in the Piaseczno site, there were no towering trees (biological class I) and dominant trees (biological class II) with a small share of co-dominant trees (biological class III). The stands No. 8 and 10 (41- and 64-year-old) were characterized by a minimal number of trees per 1 ha; they reached similar heights (24.5 and 24.0 m), and the average DBH was 26.5 and 38.5 cm, respectively (Table 3). The tree stand No. 9 (33-year-old) was characterized by very many trees—1840 pcs. ha−1 (all in the main stand), and therefore, compared to 35-year-old stands (No. 1–7), it was characterized by a small DBH but also a small height (Table 3). The 4-year-old stand (No. 11) had a small population—There were fewer trees per 1 ha than in the 33-year-old stand. For this reason, the average height of the trees was small (2.0 m), and they were heavily branched. Row stands No. 12–14 (8-year-old) occupied 5 m wide strips of land, and therefore, after calculating the number of trees per 1 ha, they were characterized by a small density—1715–1905 pcs. ha−1, comparable to stand No. 9 (33-year-old). Average dimensions of the trees were even and amounted to 11.5–12.0 cm DBH; 7.5–8.0 m high.

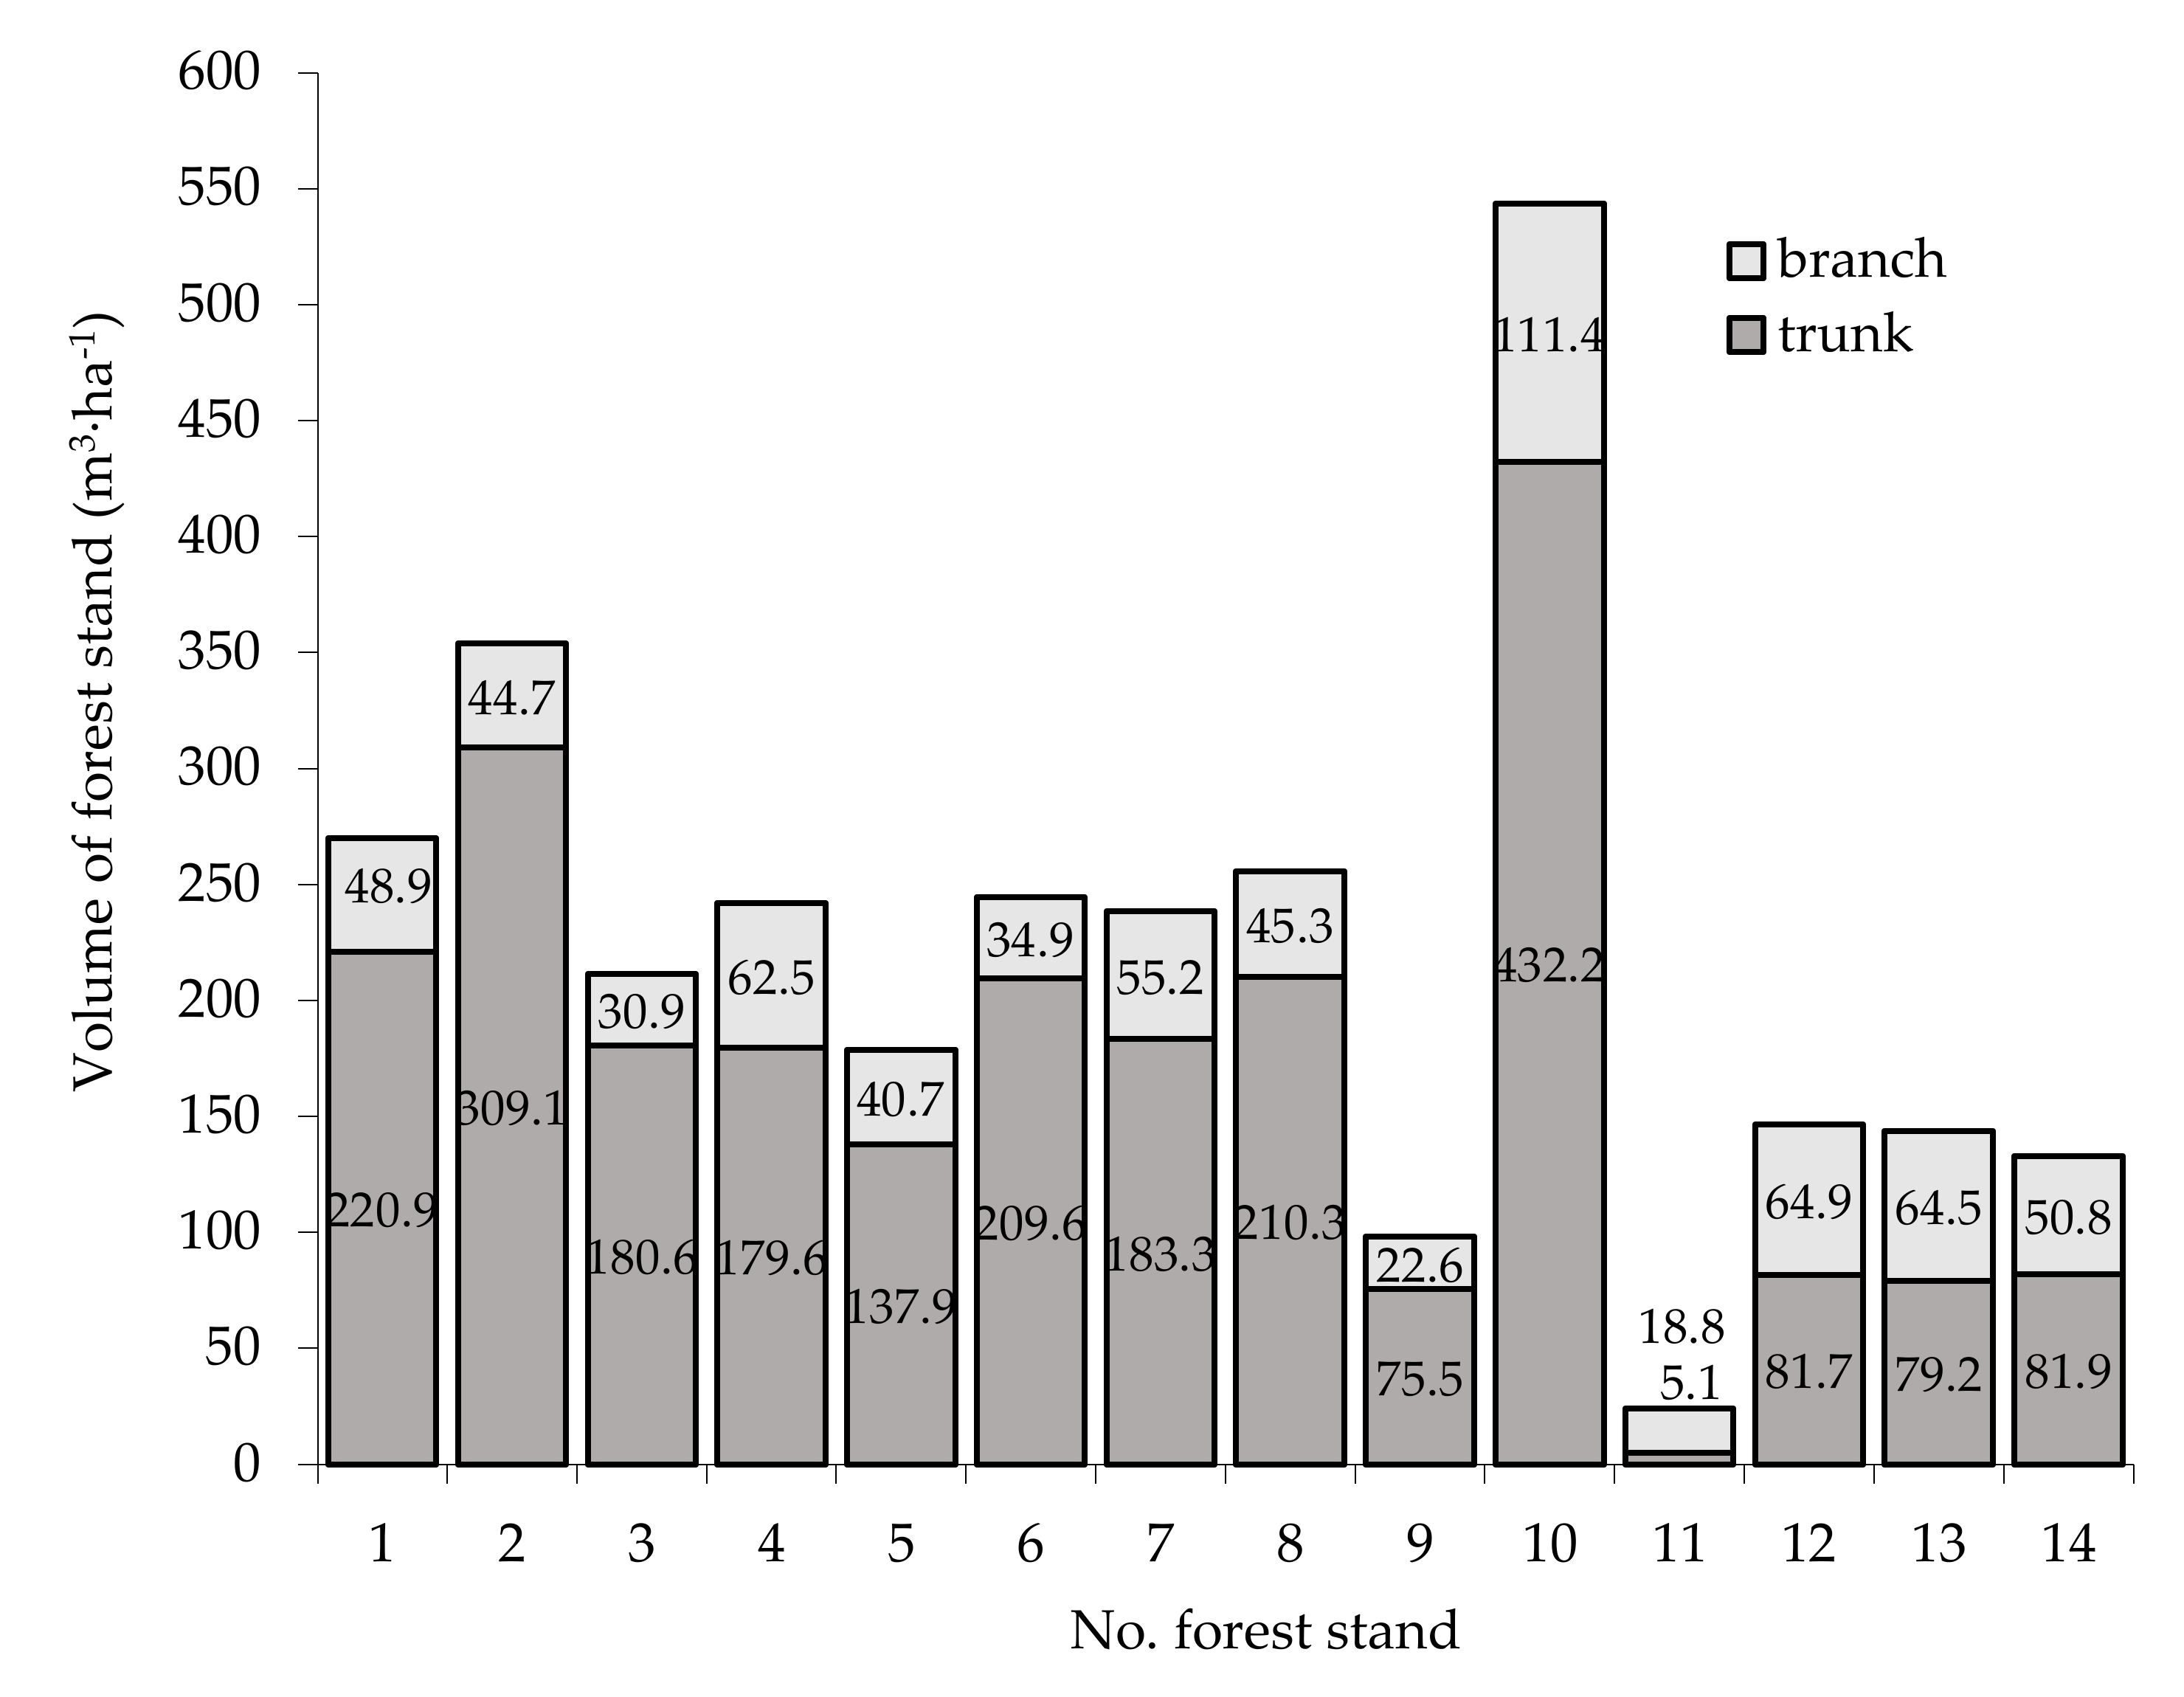
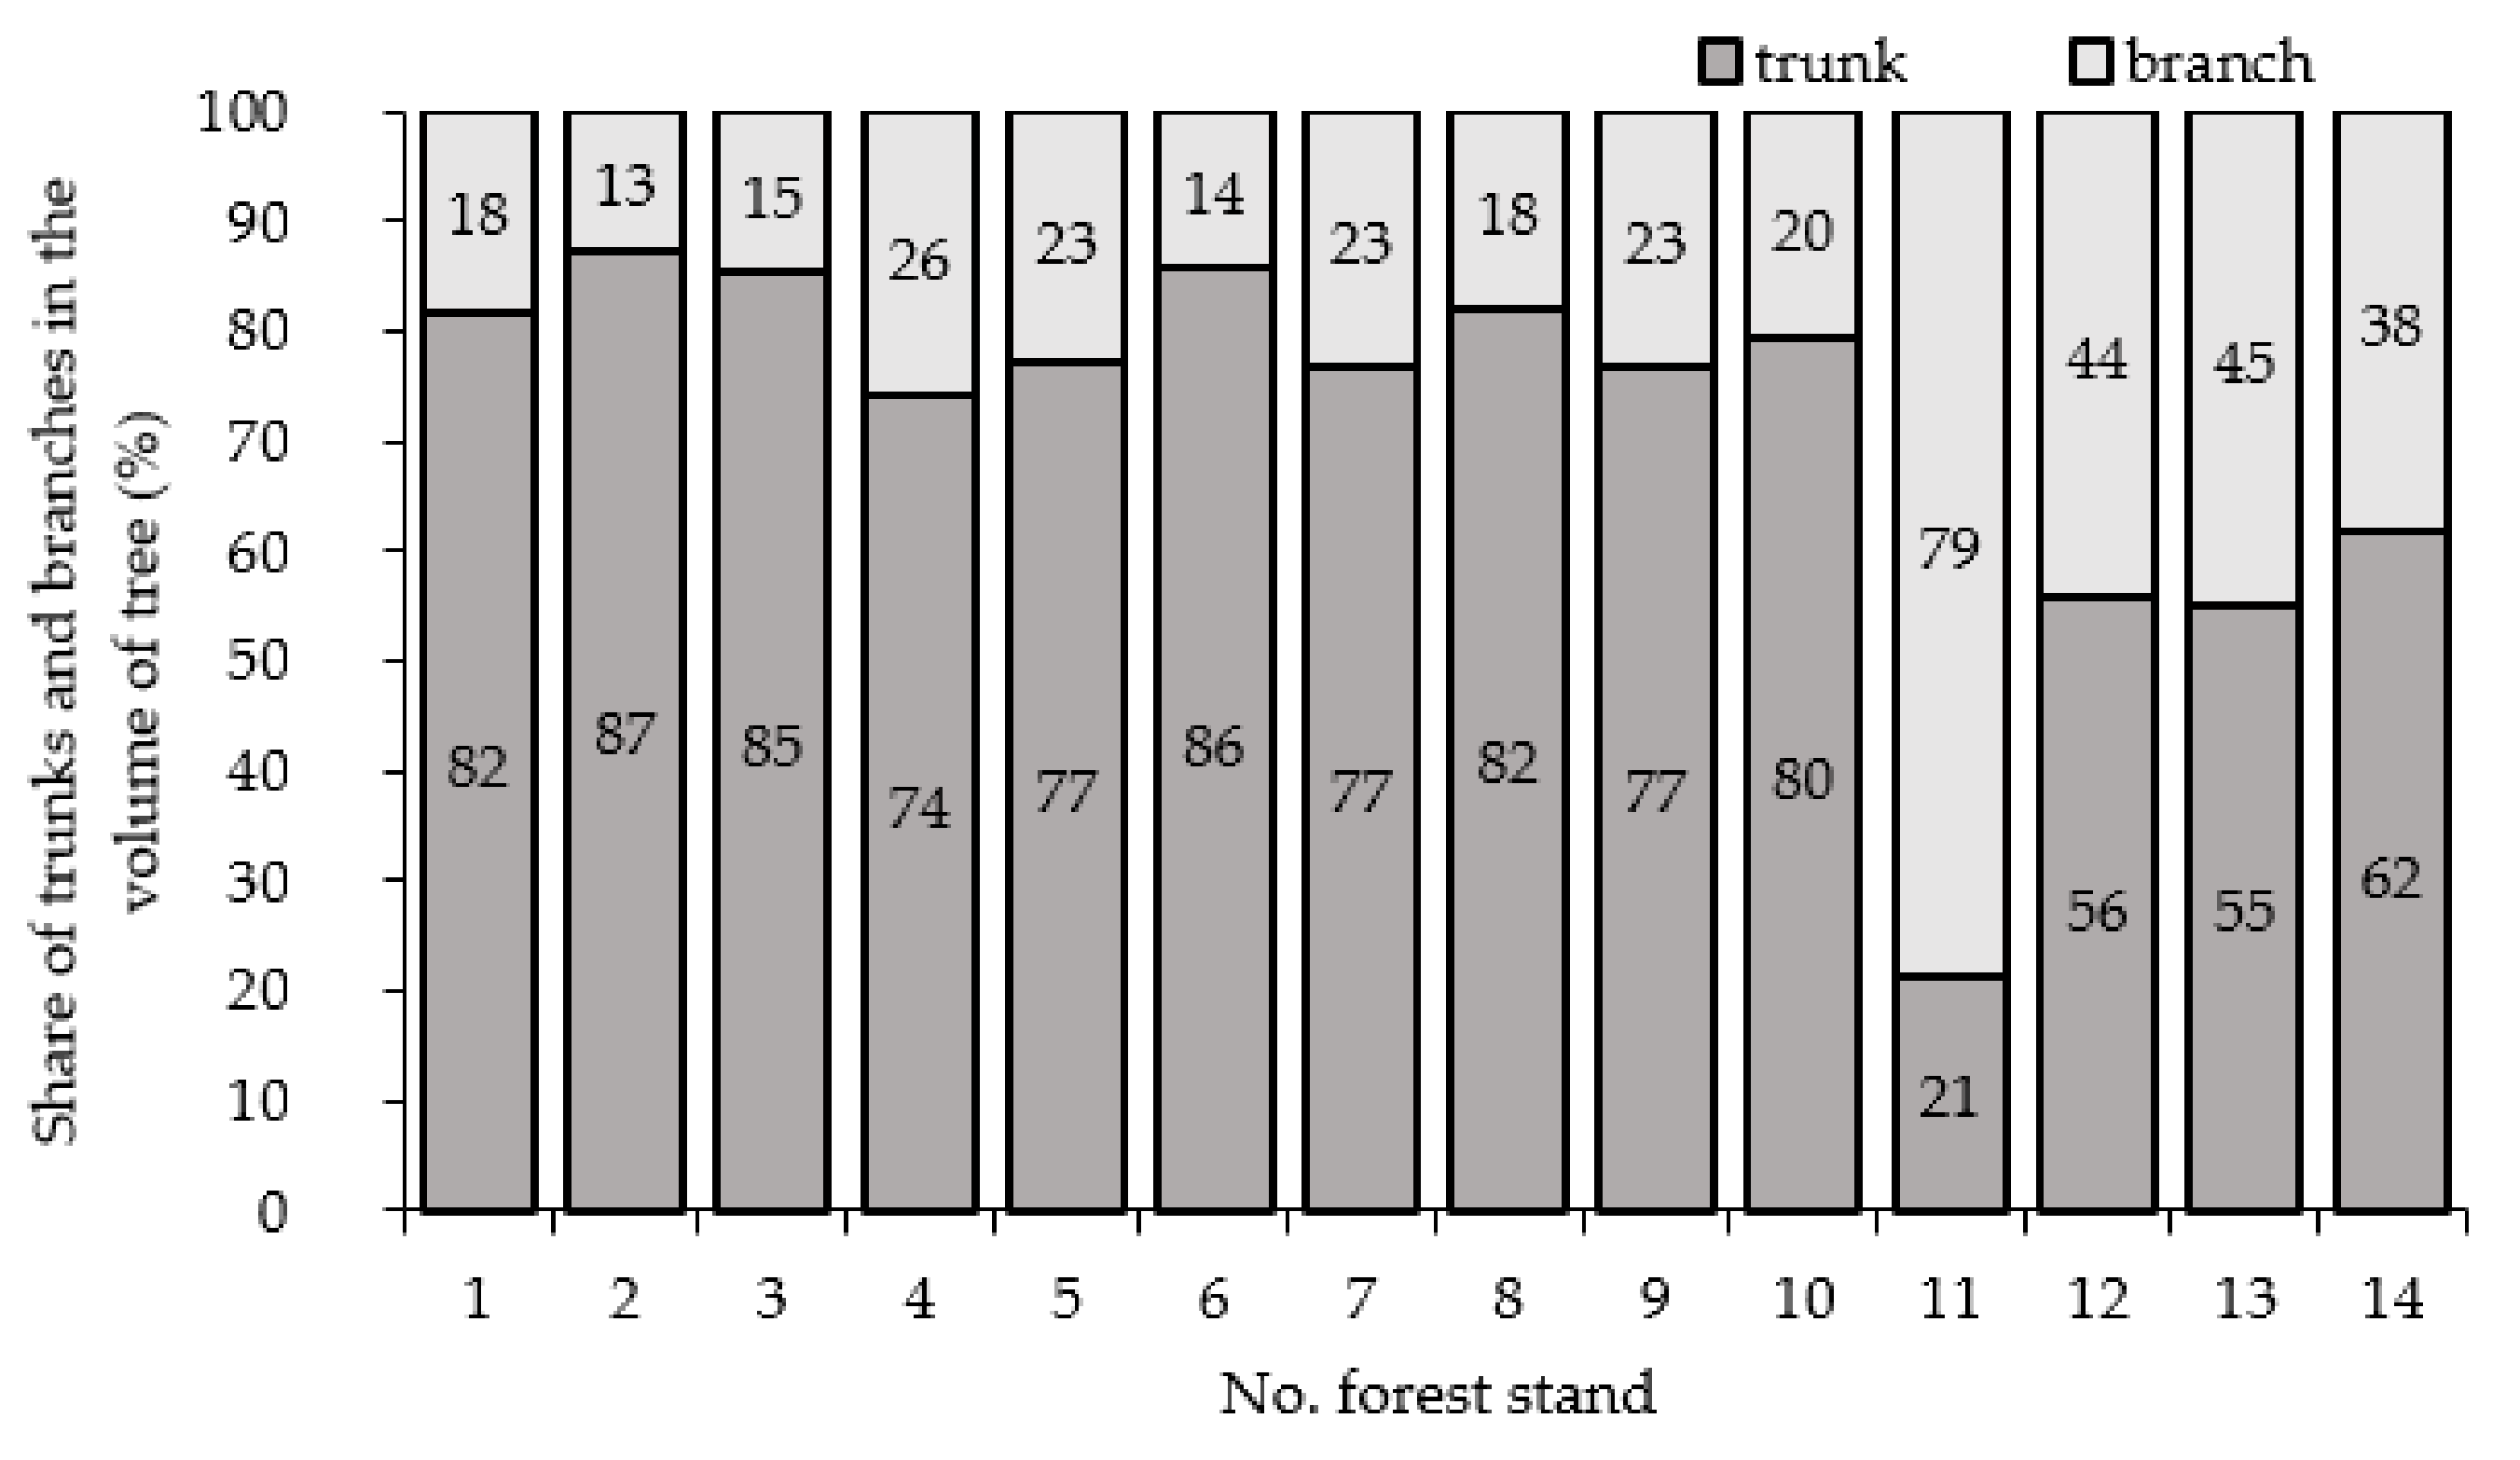
3.3. Characteristics Volume of Forest Stand

The volume of forest stands (main and secondary stands together), including the volume of trunks and branches, as shown in Figure 2—Full numerical data with the breakdown of the volume of trunks and branches (in m3 ha−1) into thickness classes are given in Table A1 (Appendix).
The research was carried out in tree stands of different ages and origins, in very different habitats, and with different intensities of breeding treatments (loosening cuts). For this reason, the volumes of stands are very diverse. In stands where no breeding treatments were performed, and due to their age, thinning should be performed several times—stands No. 1–7. The volume is ‘overstated’ relating to stands where intensive cuts were made—stands No. 8 and 10.
With such a high variability of the factors determining the volume, this parameter can be compared within stands No. 1–7 and No. 12–14, while within the remaining stands with the probability of making significant errors, despite considering the differences in age and intensity of breeding treatments. The stands No. 1–7 (35-year-old) had a volume of about 180 to 355 (on average almost 250 m3 ha−1, including the volume of the branches ranging from about 31 to 62 m3 ha−1 (Figure 2). Tree stand No. 2, occupying a lower part of the sand slope with northern exposure, with the highest soil moisture, had the largest volume—354 m3 ha−1 (142% of the average volume of stands No. 1–7). The lowest volume was found in stand No. 5, located in the upper part of the sand slope with southern exposure, with the lowest soil moisture—179 m3 ha−1 (72% of the average volume).
In the 8-year-old stands (No. 12–14), the volume was relatively even—133–147 m3 ha−1, with the average being 141 m3 ha−1. It results from excellent habitat conditions, and slight differences in the volume may result from the diverse tree density (Table 3). The branch volume ranged from 51 to 65 m3 ha−1.
Stand No. 9 (33-year-old) had a surprisingly low volume—Only 98 m3 ha−1 (Figure 2). This stand grew on a slope with soils formed from dust deposits. It was only two years younger than stands in a sulfur mine dump (stands No. 1–7), and despite this, its volume accounted for less than 40% of the average volume of stands No. 1–7. The reason was very poor or lack of nursing procedures in youth and destitute breeding procedures. Despite the currently conducted clearing cuts and removal of mastered trees (therefore the lack of a secondary tree stand), the tree density in the main stand was very high—1840 pcs. ha−1 (Table 3). This forest stand was created from a very dense self-seeding, and competition for food caused the increments of trees to be very small—as evidenced by the average height and DBH (Table 3), which directly translated into the stand volume.
In stand No. 8 (41-year-old), the volume—256 m3 ha−1—Was almost the same as the average volume of 35-year-old stands (No. 1–7), amounting to 250 m3 ha−1. However, it should be noted that the volume mentioned above of 35-year-old stands includes the main and secondary stands, while the volume of the main stands themselves is on average 206 m3 ha−1. After considering age differences (between stands No. 1–7 and 8), it can be considered comparable with the volume of a 41-year-old stand.
The volume of the tree stand No. 10 (64-year-old)—544 m3 ha−1 (Figure 2)—was more than twice (112%) higher than that of No. 8 (41-year-old). Considering that both stands grew on good soils, had the same density, both exceeded the age of peak growth, and the age of stand No. 10 was only 50% higher than that of stand No. 8, the volume of stand No. 10 should be considered high.
The youngest (four-year-old), stand No. 11, had very low fertility, despite good habitat conditions. It was almost six times smaller than the volume of eight-year-old stands (no. 12–14)—Figure 2. To a large extent, these differences result from a minimal tree density relating to the age of stand No. 11 (Table 3). Due to the loose density, in the four-year-old stand, sections of conductors over 5 cm thick (trunks) in the amount of slightly over 5 m3 ha−1 have developed (Figure 2).
The shares of branches and trunks in the volume of stands in the bark, expressed as a percentage, are presented in Figure 3.
In the youngest (four- and eight-year-old) tree stands, the share of branches in their volume was very large. In the four-year-old stand (No. 11), the volume of branches reached 80% of that of the entire stand. In the 8-year-old stands (No. 12–14), the share of branches was 38%–45%. In older stands (33–64 years old), the share of branches was much smaller and accounted for 13%–26% of their total volume. The very large volume of branches relating to the volume of trunks in a four-year-old stand (3.7:1.0) results partly from loose compactness and partly from the principle adopted in this paper—related to the purpose of the study—that sections of trunks with a thickness of less than 5.1 cm are included in the branches. There was a significant amount of thinner stem sections in a specific stand (No. 11), with an average DBH of 4.5 cm (Table 3). The relatively large share of branches in the mass of eight-year-old stands (No. 12–14) is the effect of crown expansion due to the lack of lateral cover—these are row plantings. The ratio of the volume of branches to the volume of trunks was 0.6-0.8:1. In older stands, the proportions were 0.15–0.35:1 (Figure 3).

3.4. Stand Thickness Classes

Table A1 shows the wood volume in the bark according to thickness classes, and Figure 4 shows the share of wood of individual thickness classes in the volume of stands.
In older stands (33–64-year-old), the share of the 0.0-1.0 cm class was small and amounted to 1%–4% of the stand volume, and in the 1.1–5.0 cm class—7%–20%. However, in the young (four- and eight-year-old) stands, the share of the thickness class 0.0–1.0 cm was higher and amounted to 8%–16%, and in class 1.1–5.0 cm—18%–65% of the stand volume.
Considering the thickness structure of the main stands No. 1–7 (excluding the secondary ones)—Table A1—The share of the class 15.1–20.0 cm was 32%–61%, and the share of the class 20.1–25.0 cm—9%–29%. In the 41-year-old stand (No. 8), almost one-third of the volume was in the classes 15.1–20.0 and 20.1–25.0 cm, and 11% of the volume was 25.1–30.0 cm thick. The significant share of wood with a thickness of 5.1–15.0 cm (17% in total) was because more than half of the volume of these fractions were branches (Table A1). In the oldest, a 64-year-old stand (No. 10), the stems of the trunks exceeded the thickness of 40 cm (the share of the 40.1–45.0 cm class was 4%), and the timber over 30 cm thick accounts for 44% of the stand volume (Figure 4). The branches (limbs) were over 20 cm thick, and their share in the thickness of the fraction 20.1–25.0 cm, was over 40% (Table A1). Stand No. 9 differed from the general tendency to expand the range of wood with the age of the stand, in which, for the reasons described above, the thickness of the trunks in the butt part (thickest) did not exceed 15 cm, although the stand was 33 years old.
When analyzing the volume of the stands, it can be concluded that the productivity of black locust is mainly affected by sunlight and moisture conditions. For this species, the abundance of nutrients plays a less important role, while black locust grows well on poorly abundant soils, often subject to erosion processes. Studies in equate-age stands located on the same soils with slight differences in the nutrient content (stands No. 1–5, Table 2) indicated sunlight and moisture conditions as factors determining the growth of stands. Black locust grows well on damp, shaded slopes with northern exposure, an example of which is the volume of the stand No. 2 growing in the lower part of the slope (good moisture conditions) with northern exposure (Figure 2). The stand volume in this area was the highest—354 m3 ha−1, exceeding the average volume of the remaining 35-year-old stands on sandy soils (No. 1 and 3–5) by 60%. In stand No. 1, growing in similar sunlight conditions, but in the upper part of the slope (worse moisture conditions), the volume was lower, amounting to 270 m3 ha−1, and higher than the average (by 20%). The same trends in the differentiation of stand volume depending on the location on the slope (at the same exposure) were found in stands No. 3 and 4 (Figure 2).
The performed statistical analysis confirmed differences in the volume between stands. Also, this analysis showed the significance of differences between the volume of individual thickness classes in stands of the same age with the probability of p = 0.0000. However, when comparing the wood volume between all of them individual thickness classes, regardless of age, no significant differences were found at the level of p = 0.1644. On the other hand, in the group of stands aged 33, 35, 41, and 64 years, the probability was p = 0.1226. In groups 33, 35, and 41—p = 0.3719. In the group of stands aged 35 and 41, p = 0.2198, while in the group of 33 and 35—p = 0.6289. The highest probability was in the group of 4 and 8 years—p = 0.80331. Probability (p) of differences in wood volume in all stands between the following pairs of thickness classes: 0.0–1.0 and 1.1–5.0; 1.1–5.0 and 5.1–10.0; etc. were respectively: 0.8048; 0.5165; 0.1004; 0.2265; 0.2760 and further in the next four pairs below 0.05. The wood volume distributions in individual thickness classes for each of the analyzed stands showed a second-degree polynomial trend with the coefficient of determination from slightly over 30% (stand 6) to 100% (stand 11). The resulting equations of the trend line are presented in Table 4.

4. Discussion

The research was conducted in 14 stands of different ages (from 4 to 64 years old) and different origins, in very different soils and with different intensities of nursery treatments (loosening cuts). Under the conditions of the research, the volume of tree stands in the discussed areas varied. The number of trees in the main stands ranged from 580 to 1029 and in the secondary—575–1525 pcs. ha−1. The main stands’ average height was 15.5-19.0 m, while the average DBH in the main stands ranged from 16.0 cm on the sand slope with southern exposure (stand No. 5) to 23.5 cm on the lower part of the sand embankment with the south-eastern exposure.
During the study, it was found that sunlight and moisture conditions mainly influenced the volume of stands. The black locust grows remarkably in less fertile soils, often subject to erosion processes. The studies in stands of equal age located on the same soils with slight differences in the content of nutrients (stands No. 1–5, Table 2) indicated light and moisture conditions as factors determining the growth of stands. Black locust grows well on damp, shaded slopes with northern exposure, an example of which is the volume of the stand No. 2 growing in the lower part of the slope (good moisture conditions) with northern exposure. The stand volume in this area was the highest—353.8 m3 ha−1, exceeding the average volume of the remaining 35-year-old stands on sandy soils (No. 1 and 3–5) by 60%. In stand No. 1, growing in similar light conditions, but in the upper part of the slope (worse moisture conditions), the volume was lower, amounting to 270 m3 ha−1, and higher than the average (by 20%). The same trends in the differentiation of the volume of stands depending on the location on the slope (at the same exposure) were found in stands No. 3 and 4. The same dependencies in terms of location on the slope and soil moisture were observed by Ziemnicki et al. [45] and Węgorek [11]. Their research was carried out on the same stands, but they were carried out in the earlier years of growth. Montovani et al. [29,30] write extensively about the demand for water when the black locust grows in their works. However, excessive soil moisture is not advisable. Huntley and Pacyniak indicate poor tolerance of black locust to heavy and wet soils. The fact that this species performs very well in marginal soils was shown in their research by Ziemnicki et al. [45] and Gilewska [10].
The volume of the analyzed stands, due to their different age, was very diversified and ranged from less than 30 (No. 11, 4-year-old stand) to less than 550 m3 ha−1 (No. 10, 64-year-old stand). However, the values observed were comparable to those reported in the literature. According to research by Huntley [1], 126 m3 of wood per 1 ha in the USA are obtained from 27-year-old plantations. In the study by Andrašev [3] carried out in 15 stands of black locust in predominant age of 21–43 years, located in Vojvodina (Serbia) on the chernozem subtype (A), the minimum volume was 160 m3 ha−1 and the highest 459 m3 ha−1. However, on the chernozem subtype (B), the smallest thickness was 145 m3 ha−1 and the highest 368 m3 ha−1. According to the research by Pacyniak [4], the volume of 50-year-old tree stands (in forest habitats in Poland) amounted to slightly over 292 m3 ha−1.
Among woody plants used for energy, willows and poplars are the most widespread in Poland [51,52,53,54]. Hence, an attempt was made to relate the research results to the relevant yields of wood obtained from energy plantations of these plants given in the literature. However, these comparisons should be considered approximate, especially in assessing black locust productivity under the conditions of own research, due to the different nature of the habitats, production conditions, and production cycle. In Poland, a significant yield of bush willows was obtained by Szczukowski et al. [51] in the experiments carried out on the wheat complex’s brown soil, where the average dry matter yield of shrub willow wood in the four-year production cycle was 79.31 Mg ha−1. Zajączkowski et al. [52] and Niemczyk et al. [53] indicate that the average dry matter yield of willow wood in two three-year production cycles on the soil made of lightweight clay was 30.92–42.48 Mg ha−1, and the dry weight yield of poplar wood (in three-year cycles) 43.45–50.11 Mg ha−1, while for poplars in the five-year cutting cycle, it was from 10 to 40 Mg ha−1. These results indicate, however, that the black locust under the research conditions is a species with lower productivity.
Own research shows that as the age of stands increased, the share of trunk wood relating to the wood of branches increased. The share of wood up to 5.0 cm was small in older stands, at most a dozen or so percent. However, in young stands (4 and 8 years old), the share of the thickness class up to 5 cm was even 65% of the stand volume. In 35-year-old stands, wood fractions of 15.1–20.0 cm were dominant. In the oldest, the 64-year-old stand, over 30 cm thick wood constituted 44% of the stand volume. It is not easy to compare these results with the works of other researchers in terms of the wealth identified and assessed in individual classes. The results of the studies by Cui et al. [36] as cited by Dimobe [55] and Júnior et al. [56] indicate that the amount of biomass in terms of thickness, e.g. branches and trunks, is very dependent on the age of the trees. Additionally, Dong et al. [57] showed that the share of trunks and branches is very dependent on the DBH. On the other hand, Riofrío et al. [58] show that different soils and age of stands influence the differentiation of the share of biomass in each element of trees. Own research shows that between the same classes repeated in stands of different ages, the variation in the amount of wood in m3 ha−1 was statistically insignificant with p = 0.1644. The strongest relationship was between the two smallest classes with p = 0.8048. The designated trend lines and the equations describing them indicate a polynomial distribution of the second degree of wood volume in individual thickness classes. The matching coefficients take values over 50%, only in some cases they were values close to 30%.

5. Conclusions

The black locust grows well in degraded habitats subject to erosion processes. The biomass volume from such stands was comparable to that of forest habitats. Importantly, these tests made it possible to show the share of thickness in individual classes of wood thickness. The results of the research indicate that between individual stands, different habitats and age, the individual thickness of the individual classes did not differ statistically significantly. The smallest differences in volume were noted for stands aged 4 and 8 years, as well as between thicknesses classes 0.0–1.0 cm and 1.1–5.0 cm. Additionally, the distribution of wood thickness in individual thickness classes for the stands in question was described by the trend line equations.
Considering the habitat conditions, competition for agricultural production space, using marginal soils, and the intensity of breeding energy plantations of willow and poplar faced with the growth conditions of the stands based on which the research was carried out, it seems that black locust can be recommended for establishing tree stands and energy crops on various forms of wasteland to obtain medium-sized timber. This species does better than other similar purpose species in these site conditions.
It would be advisable to extend the research to other types of wastelands and to determine the optimal felling age (length of the production cycle) and the method of renewing black locust plantations (stem suckers, root suckers), which would verify the dendrometric measurements made and increase the accuracy of the developed models for estimating the biomass volume as a function of wood thickness.

Funding

This research was co-financed under the research topics of the by the Polish Ministry of Science and Higher Education No. 2 P06S 047 30 and TKR/S/4/2021. Additionally funded from the ’Excellent science’ program of the Ministry of Education and Science as a part of the contract no. DNK/SP/465641/2020 “The role of the agricultural engineering and environmental engineering in the sustainable agriculture development”.

Data Availability Statement

Acknowledgments

I want to sincerely thank the employees of the Department of Environmental Engineering and Geodesy of the University of Life Sciences in Lublin for their assistance during data collection.

Conflicts of Interest

The authors declare no conflict of interest.

Appendix A

Table A1. Abundance of forest stand bark (m3 ha−1).
No. Forest StandThickness Classes (cm)Main Forest StandSecondary Forest StandTotal Forest Stand
TrunkBranchΣTrunkBranchΣTrunkBranchΣ
10.0-1.0-3.13.1-0.70.7-3.83.8
1.1–5.0-17.717.7-2.02.0-19.719.7
5.1–10.013.825.439.219.5-19.533.325.458.7
10.1–15.043.2-43.23.3-3.346.5-46.5
15.1–20.0120.8-120.8---120.8-120.8
20.1–25.020.3-20.3---20.3-20.3
Σ198.146.2244.322.82.725.5220.948.9269.8
20.0-1.0-7.57.5-2.42.4-9.99.9
1.1–5.0-24.924.9-9.99.9-34.834.8
5.1–10.017.7-17.721.6-21.639.3-39.3
10.1–15.070.9-70.98.5-8.579.4-79.4
15.1–20.0164.1-164.1---164.1-164.1
20.1–25.026.3-26.3---26.3-26.3
Σ279.032.4311.430.112.342.4309.144.7353.8
30.0-1.0-4.14.1-3.13.1-7.27.2
1.1–5.0-10.410.4-7.97.9-18.318.3
5.1–10.09.25.414.644.8-44.854.05.459.4
10.1–15.038.7-38.79.3-9.348.0-48.0
15.1–20.066.9-66.9---66.9-66.9
20.1–25.011.7-11.7---11.7-11.7
Σ126.519.9146.454.111.065.1180.630.9211.5
40.0-1.0-3.33.3-5.75.7-9.09.0
1.1–5.0-29.429.4-9.99.9-39.339.3
5.1–10.011.914.226.135.3-35.347.214.261.4
10.1–15.037.5-37.5---37.5-37.5
15.1–20.052.9-52.9---52.9-52.9
20.1–25.042.0-42.0---42.0-42.0
Σ144.346.9191.235.315.650.9179.662.5242.1
50.0-1.0-4.14.1-1.01.0-5.15.1
1.1–5.0-22.822.8-2.52.5-25.325.3
5.1–10.011.810.322.131.8-31.843.610.353.9
10.1–15.060.8-60.8---60.8-60.8
15.1–20.033.5-33.5---33.5-33.5
Σ106.137.2143.331.83.535.3137.940.7178.6
60.0-1.0-4.34.3-0.70.7-5.05.0
1.1–5.0-20.320.3-5.85.8-26.126.1
5.1–10.06.33.810.116.4-16.422.73.826.5
10.1–15.037.6-37.61.3-1.338.9-38.9
15.1–20.0124.5-124.5---124.5-124.5
20.1–25.023.5-23.5---23.5-23.5
Σ191.928.4220.317.76.524.2209.634.9244.5
70.0-1.0-4.94.9-1.71.7-6.66.6
1.1–5.0-42.542.5-6.16.1-48.648.6
5.1–10.018.5-18.542.5-42.561.0-61.0
10.1–15.073.7-73.7---73.7-73.7
15.1–20.048.6-48.6---48.6-48.6
Σ140.847.4188.242.57.850.3183.355.2238.5
80.0-1.0-4.74.7----4.74.7
1.1–5.0-18.218.2----18.218.2
5.1–10.011.514.826.3---11.514.826.3
10.1–15.08.47.616.0---8.47.616.0
15.1–20.082.9-82.9---82.9-82.9
20.1–25.081.4-81.4---81.4-81.4
25.1–30.026.1-26.1---26.1-26.1
Σ210.345.3255.6---210.345.3255.6
90.0-1.0-2.62.6----2.62.6
1.1–5.0-20.020.0----20.020.0
5.1–10.046.2-46.2---46.2-46.2
10.1–15.029.3-29.3---29.3-29.3
Σ75.522.698.1---75.522.698.1
100.0-1.0-3.43.4----3.43.4
1.1–5.0-36.736.7----36.736.7
5.1–10.04.229.934.1---4.229.934.1
10.1–15.057.010.867.8---57.010.867.8
15.1–20.08.211.419.6---8.211.419.6
20.1–25.026.619.245.8---26.619.245.8
25.1–30.095.7-95.7---95.7-95.7
30.1–35.0131.2-131.2---131.2-131.2
35.1–40.087.9-87.9---87.9-87.9
40.1–45.021.4-21.4---21.4-21.4
Σ432.2111.4543.6---432.2111.4543.6
110.0-1.0-3.23.2----3.23.2
1.1–5.0-15.615.6----15.615.6
5.1–10.05.1-5.1---5.1-5.1
Σ5.118.823.9---5.118.823.9
120.0-1.0-23.623.6----23.623.6
1.1–5.0-41.341.3----41.341.3
5.1–10.037.0-37.0---37.0-37.0
10.1–15.044.7-44.7---44.7-44.7
Σ81.764.9146.6---81.764.9146.6
130.0-1.0-11.911.9----11.911.9
1.1–5.0-47.447.4----47.447.4
5.1–10.012.45.217.6---12.45.217.6
10.1–15.066.8-66.8---66.8-66.8
Σ79.264.5143.7---79.264.5143.7
140.0-1.0-19.319.3----19.319.3
1.1–5.0-23.923.9----23.923.9
5.1–10.035.37.642.9---35.37.642.9
10.1–15.046.6-46.6---46.6-46.6
Σ81.950.8132.7---81.950.8132.7

References

  1. Huntley, J.C. Robinia pseudoacacia L. black locust. In Silvics of North. America: Volume 2—Hardwoods; Agriculture Handbook 654; United States Department of Agriculture: Washington, DC, USA, 1990; pp. 755–761. [Google Scholar]
  2. Rédei, K.; Csiha, I.; Keserû, Z.; Gál, J. Influence of Regeneration Method on the Yield and Stem Quality of Black Locust (Robinia pseudoacacia L.) Stands: A Case Study. Acta Silv. Lign. Hung. 2012, 8, 103–111. [Google Scholar] [CrossRef] [Green Version]
  3. Andrašev, S.; Rončević, S.; Ivanišević, P.; Pekeč, S.; Bobinac, M. Productivity of black locust (Robinia pseudoacacia L.) stands on chernozem in Vojvodina. Bull. Fac. For. 2014, 10, 9–32. [Google Scholar] [CrossRef]
  4. Pacyniak, C. Black locust (Robinia pseudoacacia L.) in the conditions of the forest environment in Poland. Rocz. AR Pozn. Rozpr. Nauk. 1981, 111, 1–85. (In Polish) [Google Scholar]
  5. Strączyńska, S.; Strączyński, S. Characteristics of the habitat conditions of black locust (Robinia pseudacacia L.) planting in a combustion waste landfill. Zesz. Probl. Post. Nauk Rol. 2004, 501, 417–423. (In Polish) [Google Scholar]
  6. Kraszkiewicz, A. Chemical composition and selected energy properties of black locust bark (Robinia pseudoacacia L.). Agric. Eng. 2016, 20, 117–124. [Google Scholar] [CrossRef]
  7. Kraszkiewicz, A. The Combustion of Wood Biomass in Low Power Coal-Fired Boilers. Combust. Sci. Technol. 2015, 188, 389–396. [Google Scholar] [CrossRef]
  8. Bilkic, B.; Haykiri-Acma, H.; Yaman, S. Combustion reactivity estimation parameters of biomass compared with lignite based on thermogravimetric analysis. Energy Sources Part A Recover. Util. Environ. Eff. 2020, 1–14. [Google Scholar] [CrossRef]
  9. Bender, J.; Gilewska, M.; Wójcik, A. Usefulness of black locust for woodlot in post-mining land. Arch. Ochr. Środow. 1985, 3–4, 113–133. (In Polish) [Google Scholar]
  10. Gilewska, M. Biological reclamation of ash landfills from lignite. Rocz. Glebozn. 2004, 55, 103–110. (In Polish) [Google Scholar]
  11. Węgorek, T. Changes in some properties of the earth material and development of phytocoenoses in the external dump of sulfur mine as a result of target forest reclamation. Rozpr. Nauk. AR Lublinie 2003, 275, 1–140. (In Polish) [Google Scholar]
  12. Carl, C.; Biber, P.; Veste, M.; Landgraf, D.; Pretzsch, H. Key drivers of competition and growth partitioning among Robinia pseudoacacia L. trees. For. Ecol. Manag. 2018, 430, 86–93. [Google Scholar] [CrossRef]
  13. Seserman, D.M.; Veste, M.; Freese, D. Optimisation of biomass productivity of black locust (Robinia pseudoacacia L.) on marginal lands—A case study in Lower Lusatia, NE Germany. In Proceedings of the 19th EGU General Assembly (EGU2017), Vienna, Austria, 23–28 April 2017. [Google Scholar]
  14. Nicolescu, V.N.; Buzatu-Goant, C.; Bakti, B.; Keserű, Z.; Antal, B.; Rédei, K. Black locust (Robinia pseudoacacia L.) as a multi-purpose tree species in Hungary and Romania: A review. J. For. Res. 2018, 29, 1449–1463. [Google Scholar] [CrossRef]
  15. González, I.; Sixto, H.; Rodríguez-Soalleiro, R.; Oliveira, N. Nutrient Contribution of Litterfall in a Short Rotation Plantation of Pure or Mixed Plots of Populus alba L. and Robinia pseudoacacia L. Forests 2020, 11, 1133. [Google Scholar] [CrossRef]
  16. Orlik, T.; Węgorek, T.; Zubala, T. Efficiency and growth of warty birch, European larch and black locust in mid-field strip plantations. Folia Univ. Agric. Stetin., Agric. 2001, No. 87(217). 167–170. (In Polish) [Google Scholar]
  17. Węgorek, T.; Kraszkiewicz, A. Growth dynamics of false acacia (Robinia pseudacacia L.) in middle-field shelterbelt on loess soils. Acta Agrophys. 2005, 5, 211–218. (In Polish) [Google Scholar]
  18. European Commission. Communication from The Commission to The European Parliament, The Council, The European Economic and Social Committee and The Committee of The Regions Energy Roadmap 2050. Available online: https://eur-lex.europa.eu/legal-content/PL/TXT/PDF/?uri=CELEX:52011DC0885&from=EN (accessed on 28 December 2020).
  19. Renewable Energy Development Strategy, 2000: Report of the Ministry of the Environment Republic of Poland, Warsaw. Available online: https://ieo.pl/pl/raporty/82-strategia-rozwoju-energetyki-odnawialnej/file (accessed on 27 January 2021). (In Polish).
  20. Poland’s Energy Policy until 2030. Ministry of Economy: Warsaw, Poland, 10 November 2009. Available online: http://nfosigw.gov.pl/download/gfx/nfosigw/pl/nfoopisy/1328/1/4/polityka_energetyczna_polski_do_2030r.pdf (accessed on 11 January 2021). (In Polish)
  21. Abbasi, T.; Abbasi, S.A. Biomass energy and the environmental impacts associated with its production and utilization. Renew. Sust. Energ. Rev. 2010, 14, 919–937. [Google Scholar] [CrossRef]
  22. Evans, A.; Strezov, V.; Evans, T.J. Sustainability considerations for electricity generation from biomass. Renew. Sust. Energ. Rev. 2010, 14, 1419–1427. [Google Scholar] [CrossRef]
  23. Ferrè, C.; Comolli, R. Comparison of soil CO2 emissions between short-rotation coppice poplar stands and arable lands. iForest Biogeosci. For. 2018, 11, 199–205. [Google Scholar] [CrossRef] [Green Version]
  24. Landgraf, D.; Carl, C.; Neupert, M. Biomass Yield of 37 Different SRC Poplar Varieties Grown on a Typical Site in North Eastern Germany. Forests 2020, 11, 1048. [Google Scholar] [CrossRef]
  25. Cichy, W. Wood in combined heat and power plants—Innovation or sabotage? Ekopartner 2005, 2, 8–9. (In Polish) [Google Scholar]
  26. Szpil, Z. Energy prices, market—Ecology—Diversification. Aura 2006, 3, 18–19. (In Polish) [Google Scholar]
  27. Update of the National Program for Increasing Forest Cover 2014. Ministry of the Environment, Sękocin Stary 2014. Available online: https://nfosigw.gov.pl/download/gfx/nfosigw/pl/nfoekspertyzy/858/184/1/2013-772.pdf (accessed on 19 January 2021). (In Polish)
  28. Lewandowski, P. Renewable Energy in Western Pomerania; Wyd. Hogben: Szczecin, Poland, 2005; p. 326. (In Polish) [Google Scholar]
  29. Mantovani, D.; Veste, M.; Freese, D. How Much Water is Used by a Black Locust (Robinia pseudoacacia L.) Short-Rotation Plantation on Degraded Soil? Tagungsbeitrag zu: Jahrestagung der DBG Kommission IV Titel der Tagung: Böden verstehen—Böden nutzen—Böden fit machen Veranstalter: DBG, September 2011, Berlin Berichte der DBG. Available online: https://www.researchgate.net/publication/235695650 (accessed on 1 April 2021).
  30. Mantovani, D.; Veste, M.; Freese, D. Black locust (Robinia pseudoacacia L.) ecophysiological and morphological adaptations to drought andtheir consequence on biomass production and water-use efficiency. N. Z. J. For. Sci. 2014, 44, 29. [Google Scholar] [CrossRef] [Green Version]
  31. Plomion, C.; Leprovost, G.; Stokes, A. Wood Formation in Trees. Plant. Physiol. 2001, 127, 1513–1523. [Google Scholar] [CrossRef] [PubMed]
  32. Fabisiak, E. Variability of basic anatomical elements and wood density of selected tree species. Rocz. AR Poznaniu. Rozpr. Nauk. 2005, 369, 1–176. (In Polish) [Google Scholar]
  33. Rocha, M.F.V.; Veiga, T.R.L.A.; Soares, B.C.h.D.; Araújo, A.C.C.; Carvalho, A.M.M.; Hein, P.R.G. Do the Growing Conditions of Trees Influence the Wood Properties? Floresta Ambient. 2019, 26, e20180353. [Google Scholar] [CrossRef]
  34. Bach, E.M.; Ramirez, K.S.; Fraser, T.D.; Wall, D.H. Soil Biodiversity Integrates Solutions for a Sustainable Future. Sustainability 2020, 12, 2662. [Google Scholar] [CrossRef] [Green Version]
  35. Bruchwald, A. Natural basics of building growth models. Sylwan 1988, 11, 1–10. (In Polish) [Google Scholar]
  36. Cui, Y.; Bi, H.; Liu, S.; Hou, G.; Wang, N.; Ma, X.; Zhao, D.; Wang, S.; Yun, H. Developing Additive Systems of Biomass Equations for Robinia pseudoacacia L. in the Region of Loess Plateau of Western Shanxi Province, China. Forests 2020, 11, 1332. [Google Scholar] [CrossRef]
  37. Dong, L.; Zhang, L.; Li, F. Developing Two Additive Biomass Equations for Three Coniferous Plantation Species in Northeast China. Forests 2016, 7, 136. [Google Scholar] [CrossRef] [Green Version]
  38. Yuen, J.Q.; Fung, T.; Ziegler, A.D. Review of allometric equations for major land covers in SE Asia: Uncertainty and implications for above- and below-ground carbon estimates. For. Ecol. Manag. 2016, 360, 323–340. [Google Scholar] [CrossRef]
  39. Chave, J.; Réjou-Méchain, M.; Búrquez, A.; Chidumayo, E.; Colgan, M.S.; Delitti, W.B.; Duque, A.; Eid, T.; Fearnside, P.M.; Goodman, R.C.; et al. Improved allometric models to estimate the aboveground biomass of tropical trees. Glob. Change Biol. 2014, 20, 3177–3190. [Google Scholar] [CrossRef] [PubMed]
  40. Luo, Y.; Wang, X.; Ouyang, Z.; Lu, F.; Feng, L.; Tao, J. A review of biomass equations for China’s tree species. Earth Syst. Sci. Data 2020, 12, 21–40. [Google Scholar] [CrossRef] [Green Version]
  41. Paul, K.I.; Roxburgh, S.H.; Chave, J.; England, J.R.; Zerihun, A.; Specht, A.; Lewis, T.; Bennett, L.T.; Baker, T.G.; Adams, M.A.; et al. Testing the generality of above-ground biomass allometry across plant functional types at the continent scale. Glob. Chang. Biol. 2016, 22, 2106–2124. [Google Scholar] [CrossRef] [PubMed]
  42. Basuki, T.; Van Laake, P.; Skidmore, A.; Hussin, Y. Allometric equations for estimating the above-ground biomass in tropical lowland Dipterocarp forests. For. Ecol. Manag. 2009, 257, 1684–1694. [Google Scholar] [CrossRef]
  43. Kuyah, S.; Dietz, J.; Muthuri, C.; Jamnadass, R.; Mwangi, P.; Coe, R.; Neufeldt, H. Allometric equations for estimating biomass in agricultural landscapes: I. Aboveground biomass. Agric. Ecosyst. Environ. 2012, 158, 216–224. [Google Scholar] [CrossRef]
  44. Zielony, R.; Kliczkowska, A. Poland’s Natural and Forest Regionalization 2010; CILP: Warsaw, Poland, 2012; pp. 1–359. (In Polish) [Google Scholar]
  45. Ziemnicki, S.; Fijałkowski, D.; Repelewska-Pękalowa, J.; Węgorek, T. Reclamation of an Opencast Mine Heap (on the Example of Piaseczno); PWN: Warsaw, Poland, 1980; pp. 1–100. (In Polish) [Google Scholar]
  46. Kraszkiewicz, A.; Węgorek, T. Structure of robinia stands on sandy slopes threatened with erosion. Zesz. Nauk. Akad. Rol. Poznaniu. CCCLXXV Rol. 2006, 65, 69–74. (In Polish) [Google Scholar]
  47. Bruchwald, A. Dendrometry; Wyd. SGGW: Warsaw, Poland, 1999; pp. 1–261. (In Polish) [Google Scholar]
  48. Kowalkowski, A. Mineral. Fertilization of Stands; SGGW-AR: Warsaw, Poland, 1982; pp. 1–86. (In Polish) [Google Scholar]
  49. Baule, H.; Fricker, C. Fertilization of Forest Trees; PWRiL: Warsaw, Poland, 1971; pp. 1–314. (In Polish) [Google Scholar]
  50. Pokojska, U. The role of humus in shaping the reaction, buffer properties and ion-exchange capacity of forest soils. Rocz. Glebozn. 1986, 37, 249–262. (In Polish) [Google Scholar]
  51. Szczukowski, S.; Tworkowski, J.; Stolarski, M.; Grzelczyk, M. Productivity of willow (Salix spp.) and characterization of willow biomass as fuel. Zesz. Probl. Post. Nauk Rol. 2005, 507, 495–503. [Google Scholar]
  52. Zajączkowski, K.; Kwiecień, R.; Zajączkowska, B.; Wajda, T.; Zawadzki, M. Production Possibilities of Selected Varieties of Poplar and Willow in Plantations with a Shortened Cycle; IBL: Warsaw, Poland, 2001; pp. 1–66. (In Polish) [Google Scholar]
  53. Niemczyk, M.; Wojda, T.; Kantorowicz, W. The breeding usefulness of selected poplar varieties in energy plantations with a short production cycle. Sylwan 2016, 160, 292–298. (In Polish) [Google Scholar]
  54. Szostak, A.; Bidzińska, G.; Ratajczak, E.; Herbeć, M. Wood biomass from plantations of fast-growing trees as an alternative source of wood raw material in Poland. Drewno 2013, 56, 85–112. [Google Scholar] [CrossRef]
  55. Dimobe, K.; Mensah, S.; Goetze, D.; Ouédraogo, A.; Kuyah, S.; Porembski, S.; Thiombiano, A. Aboveground biomass partitioning and additive models for Combretum glutinosum and Terminalia laxiflora inWest Africa. Biomass Bioenergy 2018, 115, 151–159. [Google Scholar] [CrossRef]
  56. Júnior, L.R.N.; Engel, V.L.; Parrotta, J.A.; De Melo, A.C.G.; Ré, D.S. Allometric equations for estimating tree biomass in restored mixed-species Atlantic Forest stands. Biota Neotrop. 2014, 14, 1–9. [Google Scholar]
  57. Dong, L.H.; Zhang, L.J.; Li, F. Additive Biomass Equations Based on Di_erent Dendrometric V ariables for Two Dominant Species (Larix gmelini Rupr. and Betula platyphylla Suk.) in Natural Forests in the Eastern Daxing’an Mountains, Northeast China. Forests 2018, 9, 261. [Google Scholar] [CrossRef] [Green Version]
  58. Riofrío, J.; Herrero, C.; Grijalva, J.; Bravo, F. Aboveground tree additive biomass models in Ecuadorian highland agroforestry systems. Biomass Bioenergy 2015, 80, 252–259. [Google Scholar] [CrossRef]
Figure 1. Location of the Małopolska Kraina (VI) on the territory of Poland with marked mesoregions (Arabic numerals) and research stands (red dots). Important markings mesoregion: 4—West-Lublin Upland, 5—East-Lublin Upland, 27—Chmielnicko-Staszowski, 28—Opatowski, 29—Vistula Lowland. Prepared on the basis of [44].
Forests 12 00470 g001
Figure 2. Volume of forest stand.
Forests 12 00470 g002
Figure 3. Share of trunks and branches in the volume of forest stands.
Forests 12 00470 g003
Figure 4. Share of thickness classes in the volume of forest stands (numbers from 1-14 correspond to the numbering of forest stands).
Forests 12 00470 g004
Table 1. Covering plant layers and selected soil characteristics.
Forest Stand/Area NumberSoilSurface Coverage (%)Litter (cm)Humus Layer
(cm)
TreesShrubsUndergrowth
1sand80603024
280603022
380207045
480207057
5802010058
6clay70503015
780307026
8505080310
9dust80208038
10505060510
117090120
12906090124
13906090124
14906090122
Table 2. Content of nutrients and soil abundance.
Forest Stand/Area NumberContent of Nutrients (g·kg−1)
and Soil Abundance
C:N
NtotalPKCorganic
10.36
insufficient
0.004
insufficient
0.021
insufficient
2.095.81
20.38
insufficient
0.005
insufficient
0.027
insufficient
2.596.82
30.24
insufficient
0.004
insufficient
0.024
insufficient
2.219.21
40.57
insufficient
0.004
insufficient
0.023
insufficient
2.714.75
50.41
insufficient
0.005
insufficient
0.024
insufficient
2.907.07
60.77
medium
0.054
medium
0.142
good
6.608.57
70.84
medium
0.004
insufficient
0.030
insufficient
4.325.14
80.78
medium
0.007
insufficient
0.025
insufficient
6.057.76
9xxxxx
101.23
medium
0.015
medium
0.028
insufficient
6.795.52
110.43
insufficient
0.059
medium
0.063
medium
3.628.42
121.95
good
0.176
good
0.260
good
10.375.32
131.34
good
0.101
good
0.126
good
8.746.52
140.57
insufficient
0.109
good
0.087
medium
4.187.33
Abbreviations: x—Was not done.
Table 3. Number of trees per 1 ha and average tree dimensions in stands.
Forest Stand/Area NumberAge
(Years)
Number of Trees (Pcs. ha−1)Average Height (m)Average Diameter at Breast Height (cm)
MainSecondaryMainSecondaryMainSecondary
13591958816.512.519.09.5
235102988218.013.019.510.0
335750152515.511.017.58.5
435580144017.011.523.58.5
535943105715.510.016.08.5
63565057519.012.021.09.0
735870111118.011.518.09.0
841410-24.5-26.5-
9331840-11.5-11.0-
1064320-24.0-38.5-
1141720-2.0-4.5-
1281905-7.5-12.0-
1381828-8.0-11.5-
1481715-7.5-12.0-
Table 4. Trendline equations of the volume distribution in individual thickness classes.
Forest Stand/Area NumberAge
(Years)
SoilTrendline EquationCoefficient of Determination R2
135sandy = −6.2696x2 + 55.296x − 57.730.4264
235y = −6.6857x2 + 62.937x − 66.980.3563
335y = −3.7768x2 + 33.055x − 34.010.4516
435y = −1.9679x2 + 21.644x − 14.040.8575
535y = −3.7571x2 + 32.223x − 26.680.6532
635clayy = -3.5107x2 + 37.035x − 39.660.3206
735y = −3.3x2 + 31.66x − 21.040.5409
841y = −2.8286x2 + 31.457x − 32.7430.4643
933dusty = −8.575x2 + 53.505x − 44.9250.8645
1064y = −1.9674x2 + 28.404x − 26.1170.3982
114y = −11.45x2 + 46.75x − 32.11
128y = −2.5x2 + 18.4x + 9.40.775
138y = 3.425x2 − 3.635x + 19.3250.4789
148y = −0.225x2 + 11.215x + 6.8250.9203
Abbreviations: x—variable wood thickness, y—correlation equation, wood volume depending on its thickness.
Publisher’s Note: MDPI stays neutral with regard to jurisdictional claims in published maps and institutional affiliations.

