
Climate Differently Impacts the Growth of Coexisting Trees and Shrubs under Semi-Arid Mediterranean Conditions

 ,
,  , ,
, ,  and
and
Abstract
1. Introduction
2. Materials and Methods
2.1. Study Sites and the Tree and Shrub Species
2.2. Field Sampling
2.3. Xylem Formation: Intra-Annual Growth Rates
2.4. Climate Data
2.5. Dendrochronological Data
2.6. Statistical Analyses
2.7. VS-Lite Growth Model
3. Results
3.1. Intra-Annual Growth Patterns
3.2. Tree Ring Width Series and Statistics
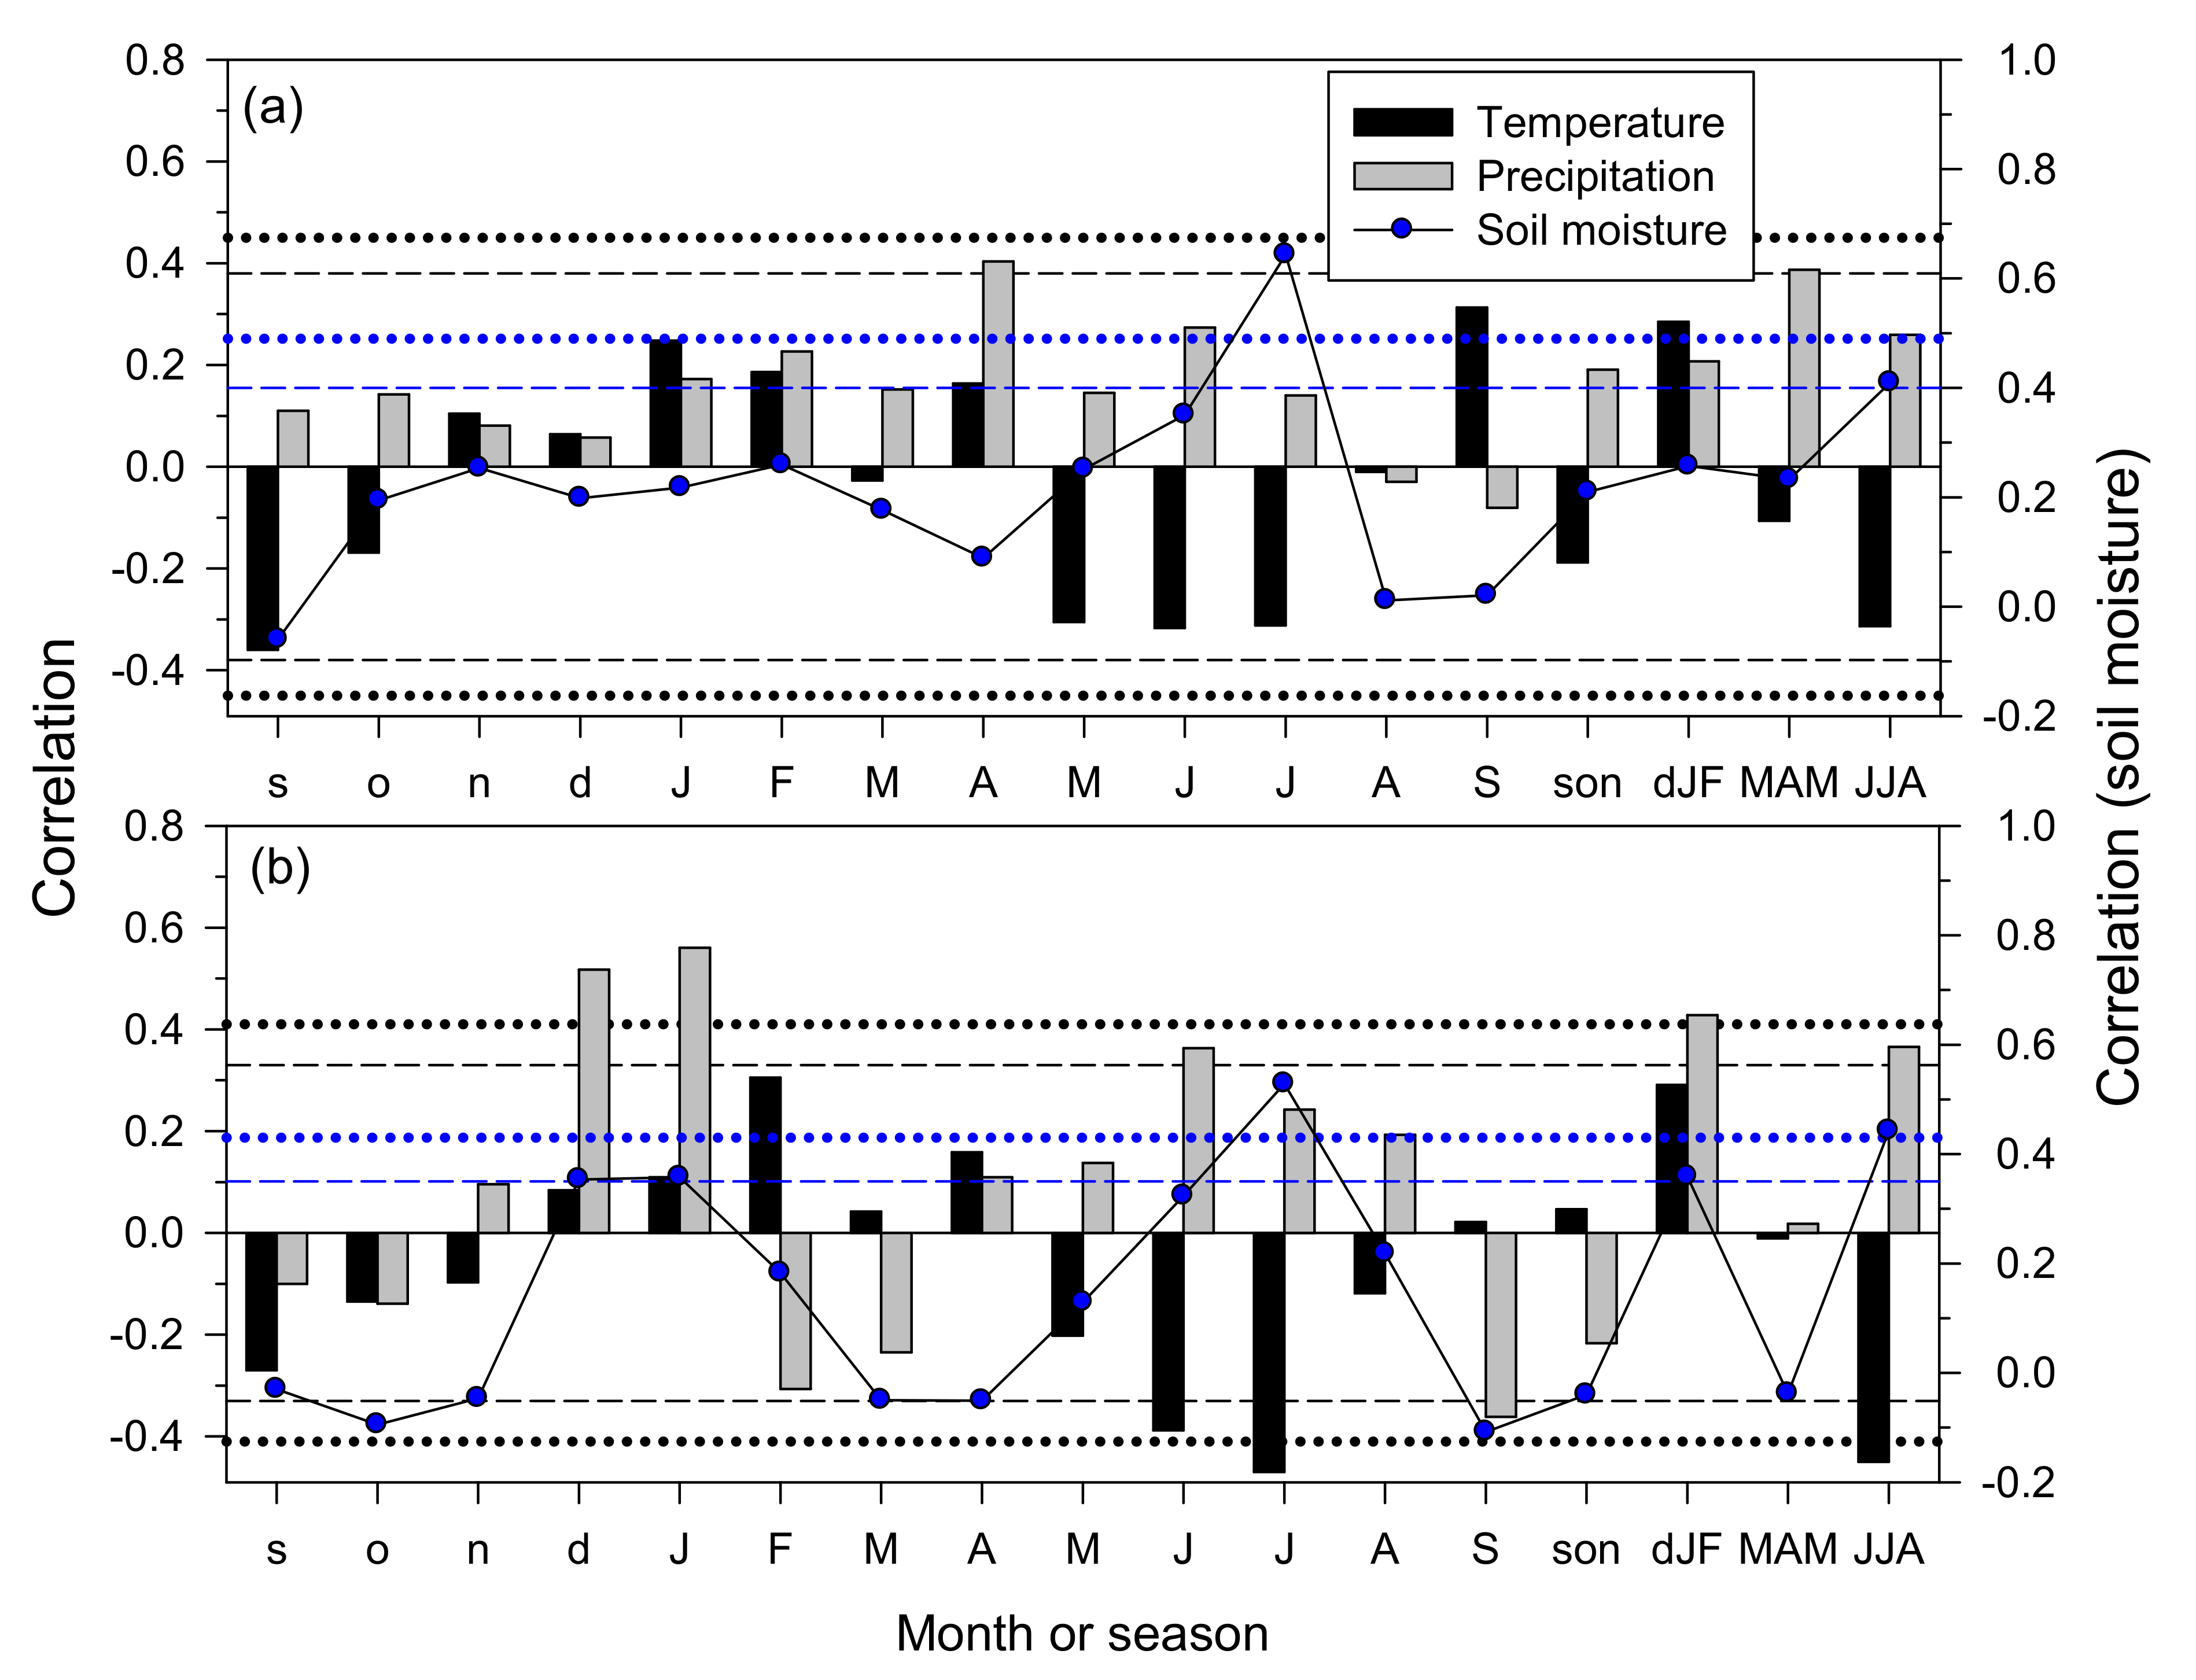
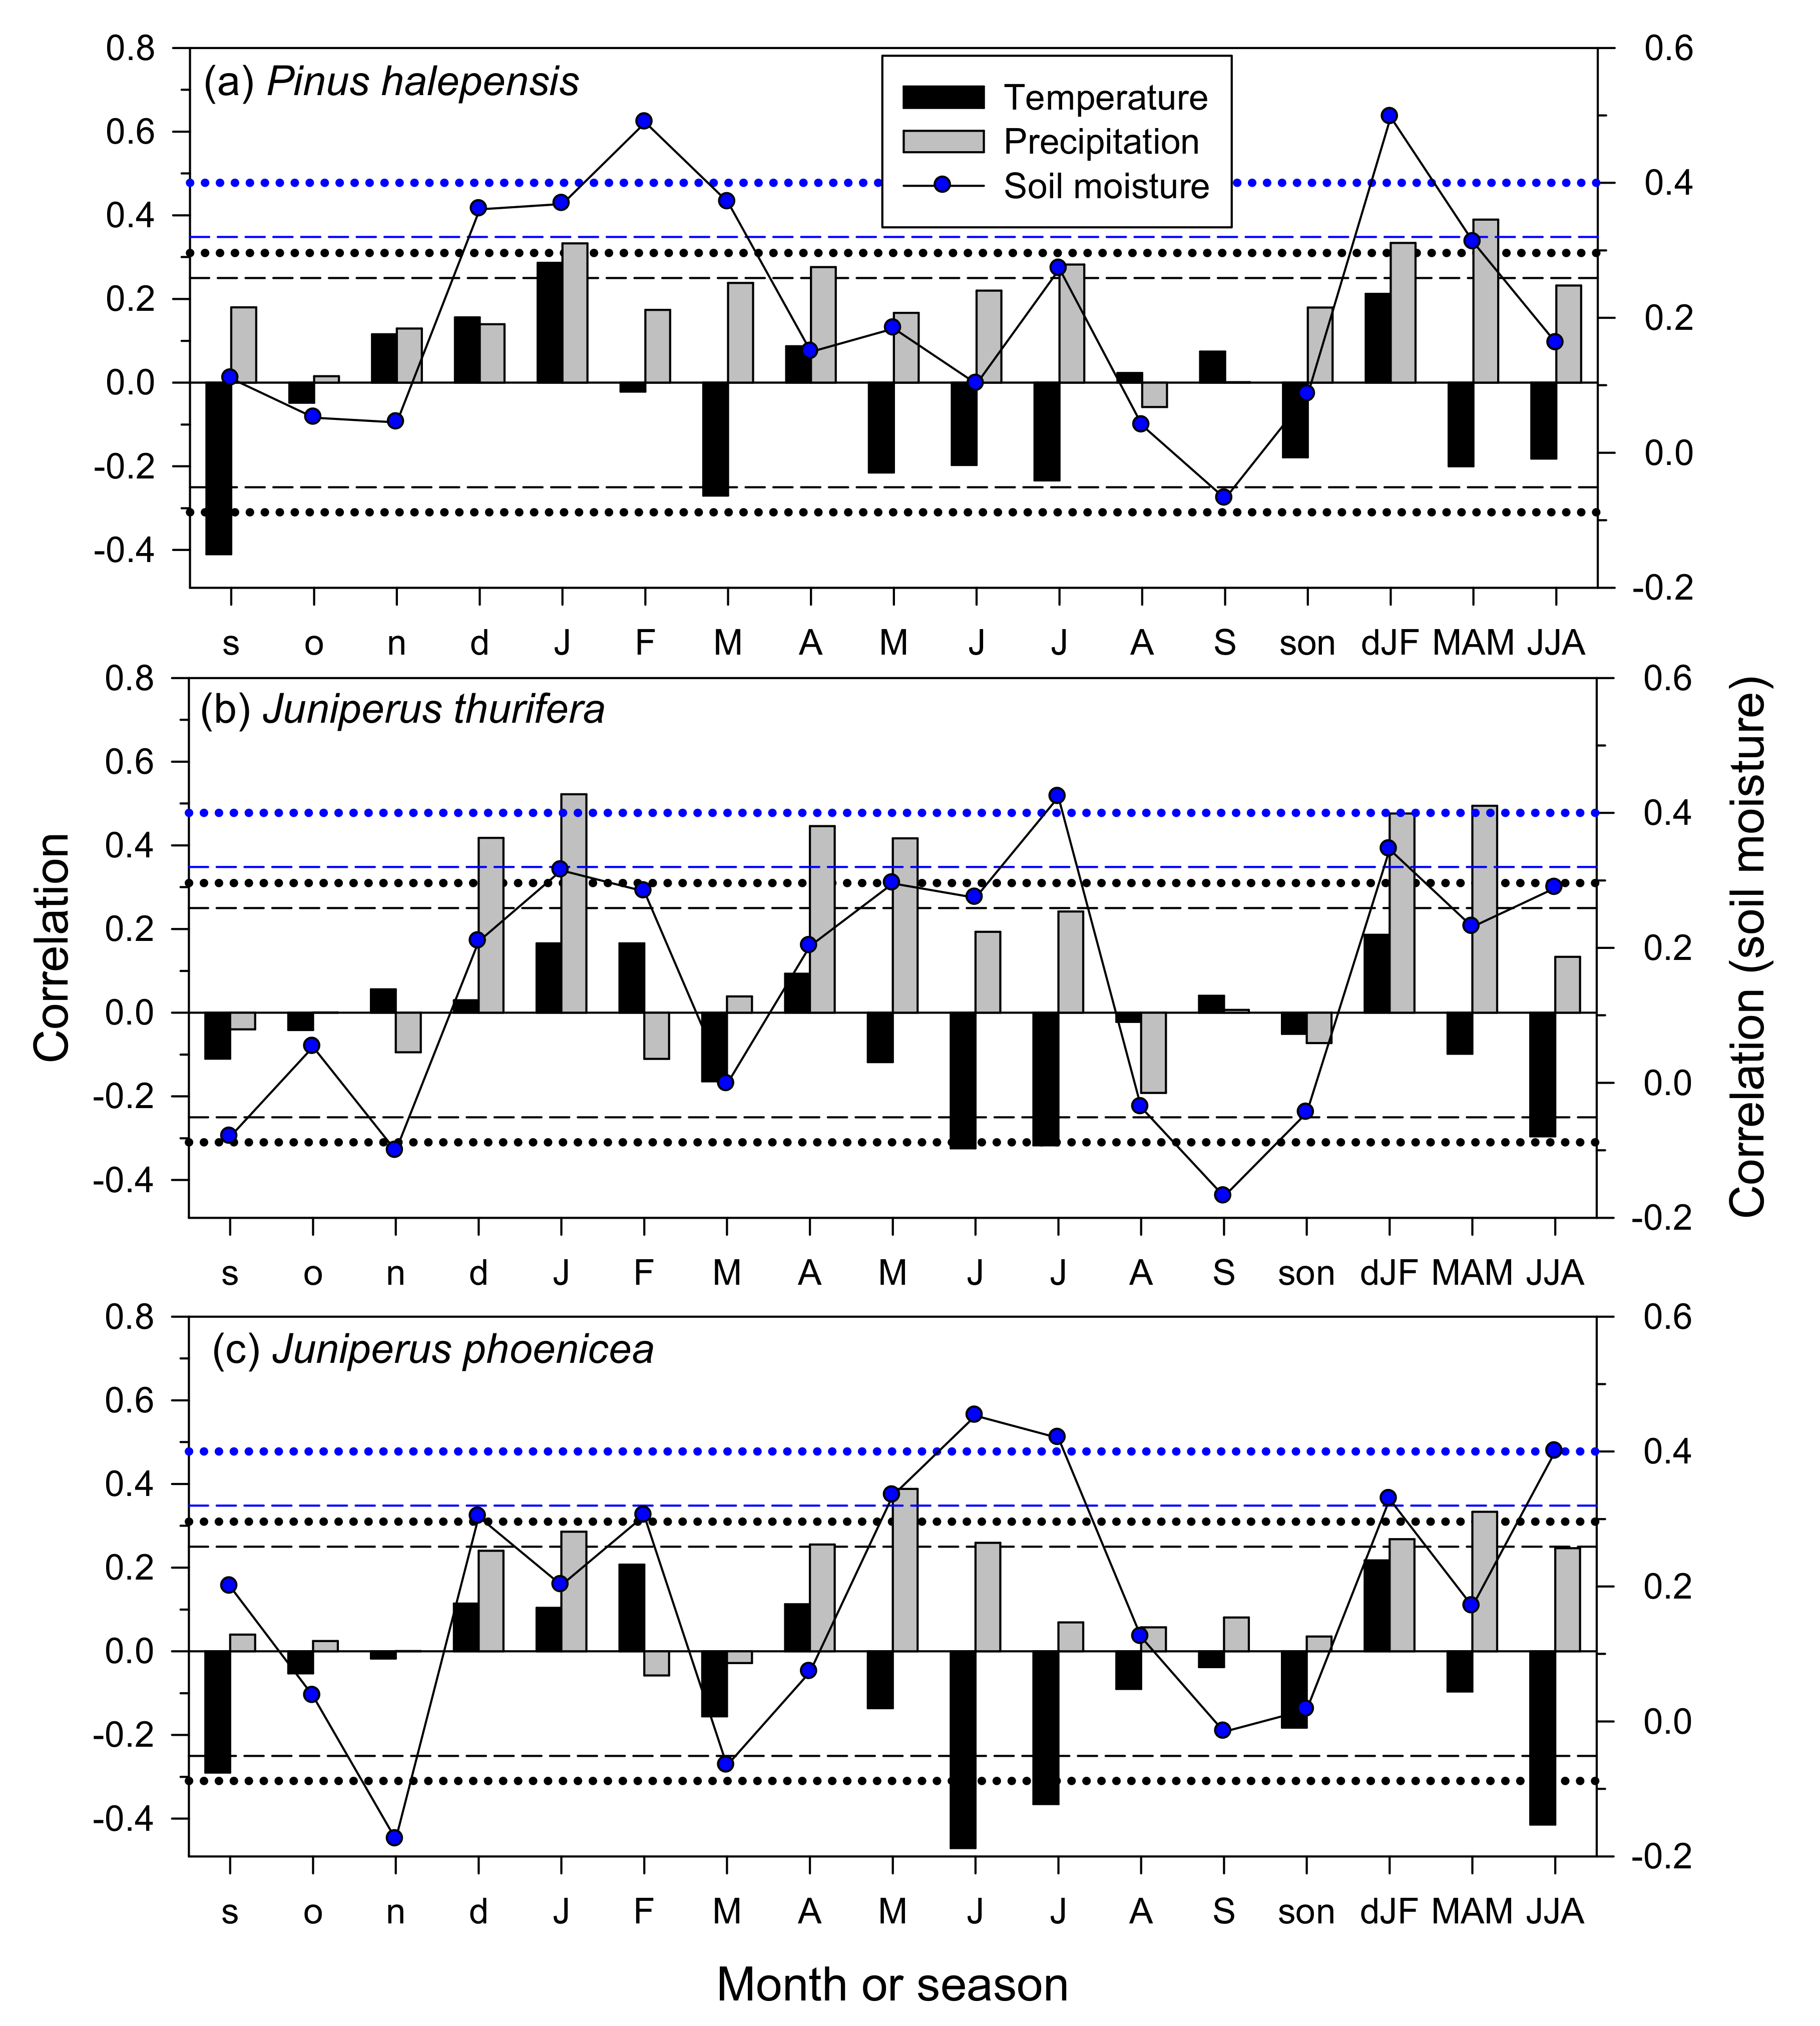
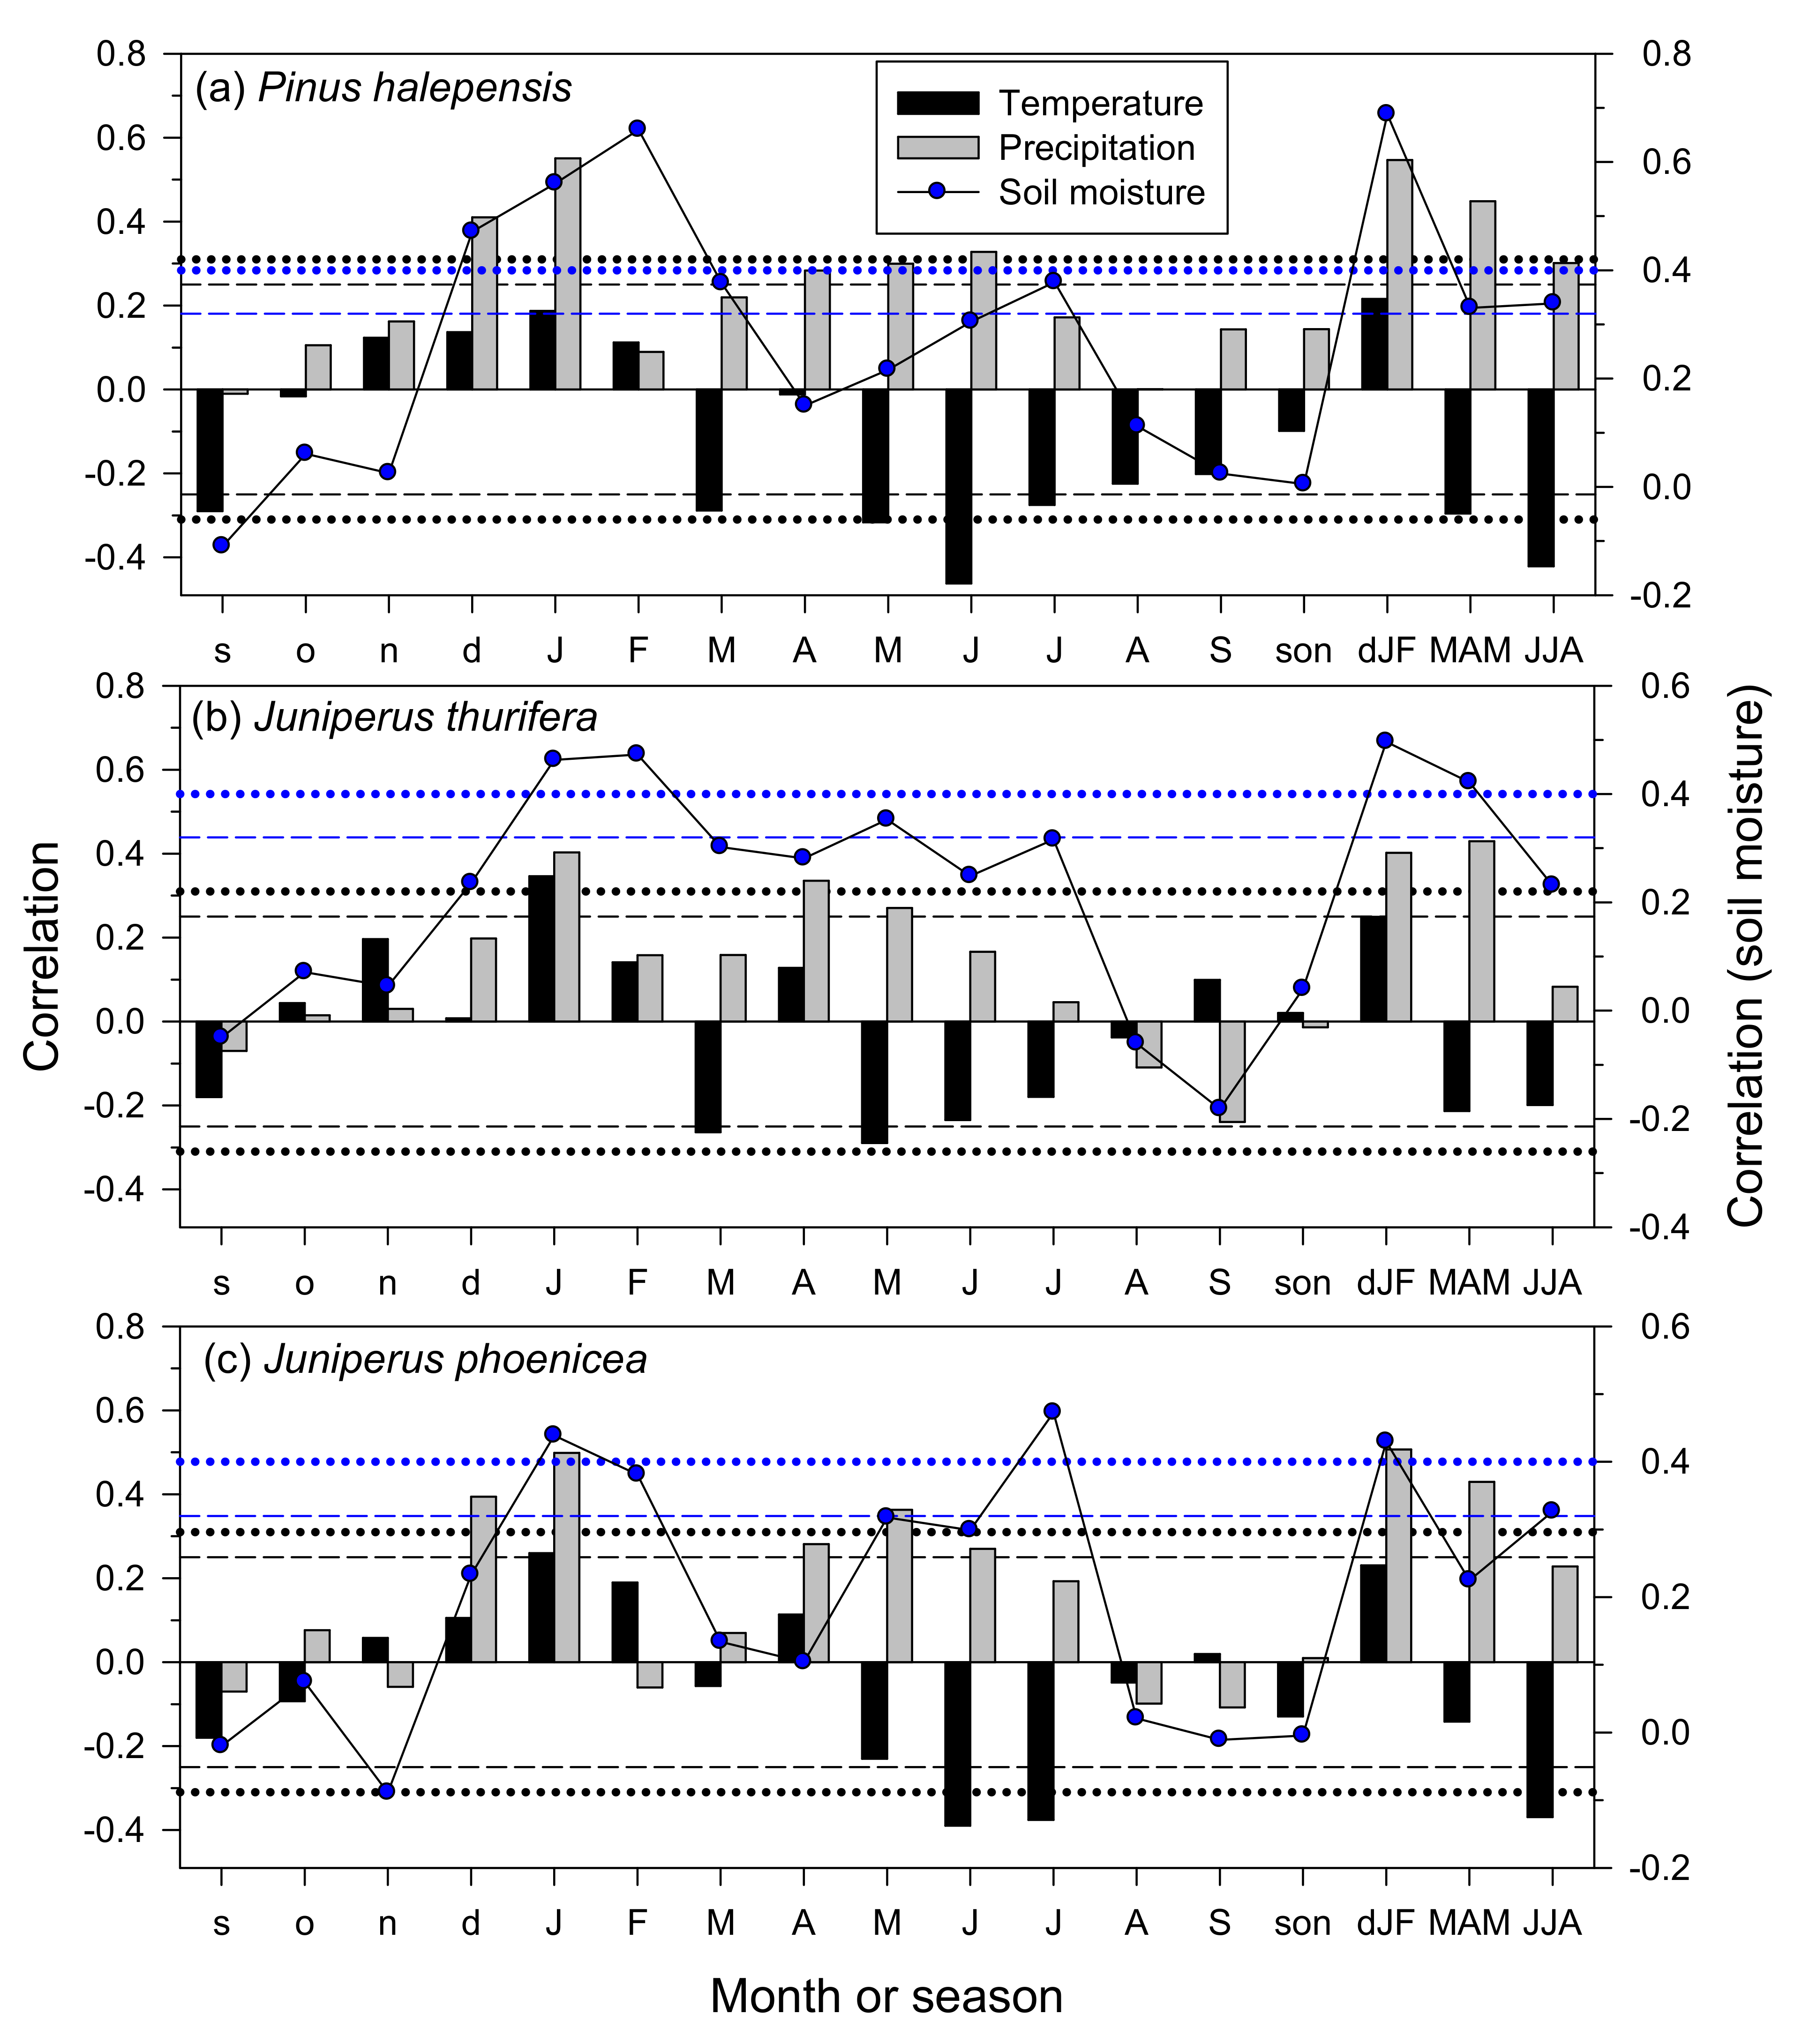
3.3. Climate–Growth Relationships in Trees and Shrub Species at the Monthly Scale
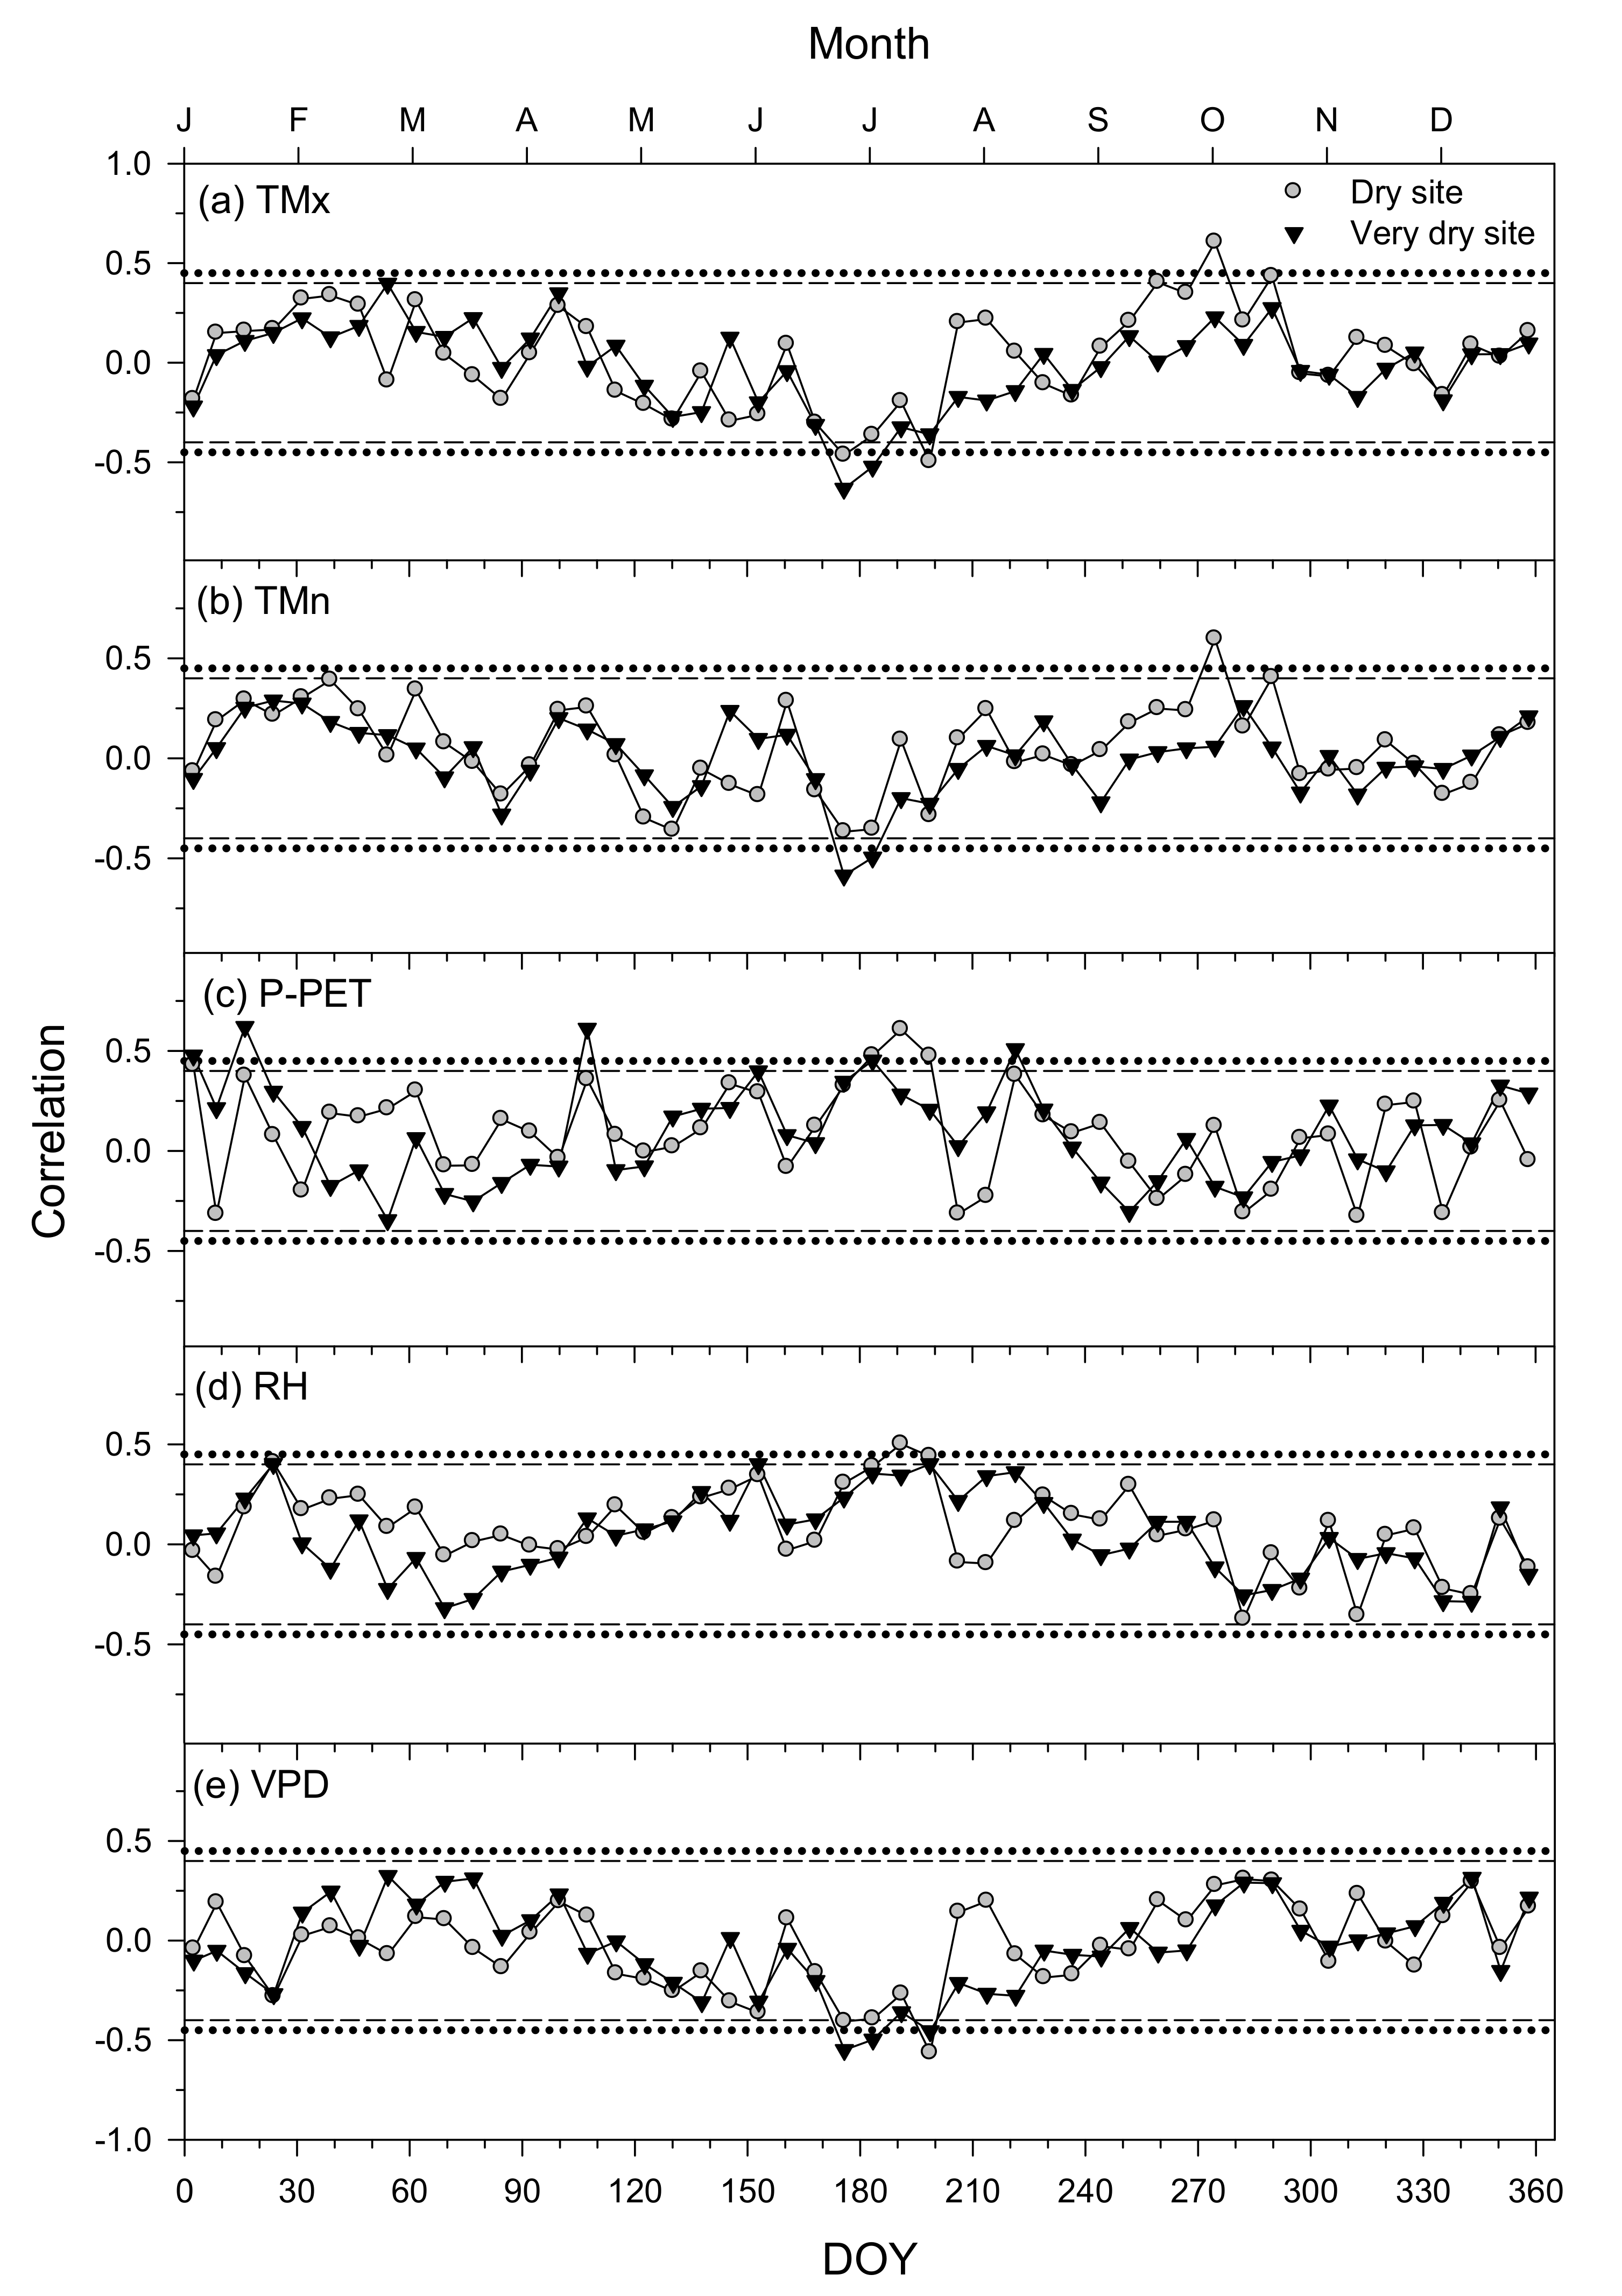
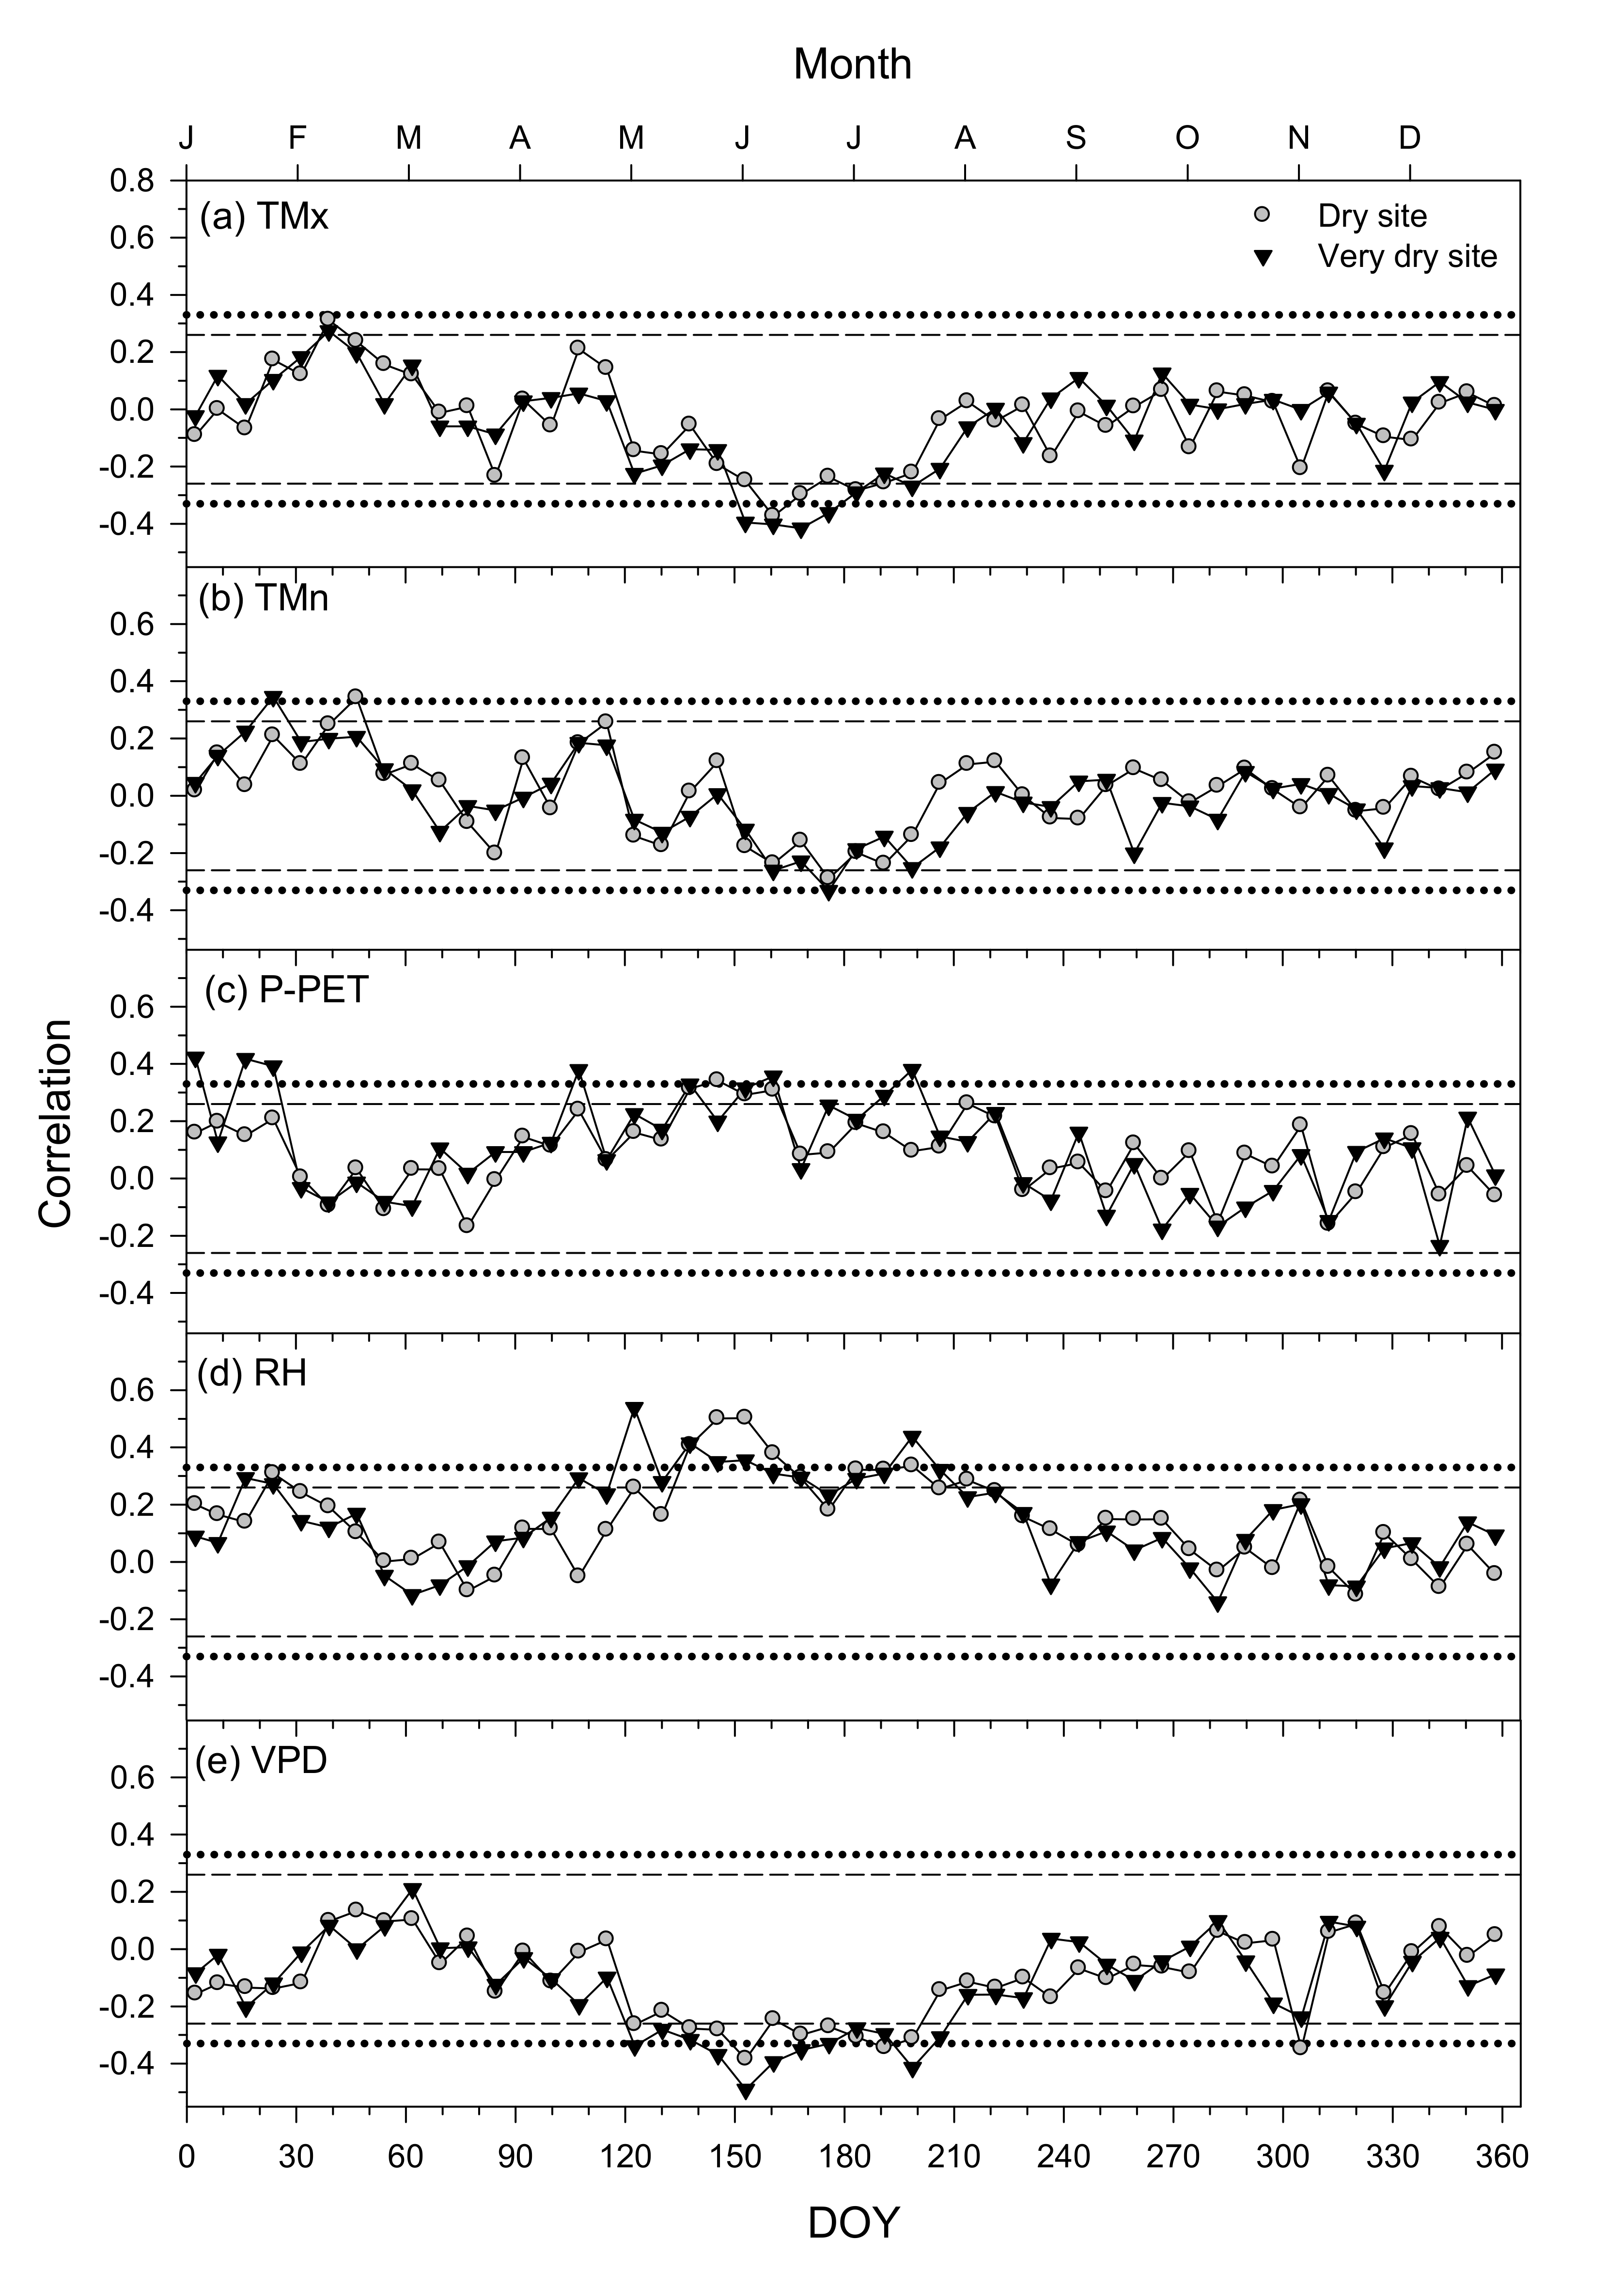
3.4. Climate–Growth Relationships in Trees and Shrub Species at Weekly Scales
3.5. Climatic Constraints of Growth Inferred from the VS-Lite Model
4. Discussion
5. Conclusions
Supplementary Materials
Author Contributions
Funding
Institutional Review Board Statement
Informed Consent Statement
Data Availability Statement
Acknowledgments
Conflicts of Interest
References
- Giorgi, F.; Lionello, P. Climate change projections for the Mediterranean region. Glob. Planet. Chang. 2008, 63, 90–104. [Google Scholar] [CrossRef]
- Touchan, R.; Anchukaitis, K.J.; Meko, D.M.; Attalah, S.; Baisan, C.; Aloui, A. Spatiotemporal drought variability in northwestern Africa over the last nine centuries. Clim. Dyn. 2011, 37, 237–252. [Google Scholar] [CrossRef]
- Sánchez-Salguero, R.; Camarero, J.J.; Gutiérrez, E.; González Rouco, F.; Gazol, A.; Sangüesa-Barreda, G.; Andreu-Hayles, L.; Linares, J.C.; Seftigen, K. Assessing forest vulnerability to climate warming using a process-based model of tree growth: Bad prospects for rear-edges. Glob. Chang. Biol. 2017, 23, 2705–2719. [Google Scholar] [CrossRef] [PubMed]
- Camarero, J.J.; Gazol, A.; Sangüesa-Barreda, G.; Oliva, J.; Vicente-Serrano, S.M. To die or not to die: Early-warning signals of dieback in response to a severe drought. J. Ecol. 2015, 103, 44–57. [Google Scholar] [CrossRef]
- De Luis, M.; Čufar, K.; Di Filippo, A.; Novak, K.; Papadopoulos, A.; Piovesan, G.; Rathgeber, C.B.K.; Raventós, J.; Angel Saz, M.; Smith, K.T. Plasticity in dendroclimatic response across the distribution range of Aleppo pine (Pinus halepensis). PLoS ONE 2013, 9, e83550. [Google Scholar] [CrossRef]
- Touchan, R.; Anchukaitis, K.J.; Meko, D.M.; Kerchouche, D.; Slimani, S.; Ilmen, R.; Hasnaoui, F.; Guibal, F.; Camarero, J.J.; Sánchez-Salguero, R.; et al. Climate controls on tree growth in the Western Mediterranean. Holocene 2017, 27, 1429–1442. [Google Scholar] [CrossRef]
- Pasho, E.; Camarero, J.J.; Vicente-Serrano, S.M. Climatic impacts and drought control of radial growth and seasonal wood formation in Pinus halepensis. Trees 2012, 26, 1875–1886. [Google Scholar] [CrossRef]
- Quero, J.L.; Sterck, F.J.; Martínez-Vilalta, J.; Villar, R. Water-use strategies of six co-existing Mediterranean woody species during a summer drought. Oecologia 2011, 166, 45–57. [Google Scholar] [CrossRef]
- Gazol, A.; Sangüesa-Barreda, G.; Granda, E.; Camarero, J.J. Tracking the impact of drought on functionally different woody plants in a Mediterranean scrubland ecosystem. Plant Ecol. 2017, 218, 1009–1020. [Google Scholar] [CrossRef]
- Gazol, A.; Camarero, J.J. Mediterranean dwarf shrubs and coexisting trees present different radial-growth synchronies and responses to climate. Plant Ecol. 2012, 213, 1687–1698. [Google Scholar] [CrossRef]
- Gazol, A.; Camarero, J.J. The performance of Mediterranean subshrubs depends more on microsite than on regional climate conditions. J. Veg. Sci. 2012, 23, 1062–1070. [Google Scholar] [CrossRef]
- Camarero, J.J.; Gazol, A.; Sánchez-Salguero, R.; Sangüesa-Barreda, G.; Díaz-Delgado, R.; Casals, R. Dieback and mortality of junipers caused by drought: Dissimilar growth and wood isotope patterns preceding shrub death. Agric. For. Meteorol. 2020, 291, 108078. [Google Scholar] [CrossRef]
- Sánchez-Salguero, R.; Camarero, J.J. Greater sensitivity to hotter droughts underlies juniper dieback and mortality in Mediterranean shrublands. Sci. Tot. Environ. 2020, 721, 137599. [Google Scholar] [CrossRef] [PubMed]
- Farjon, A. The Kew Review: Conifers of the World. Kew Bull. 2018, 73, 8. [Google Scholar] [CrossRef]
- Rydin, C.; Pedersen, K.R.; Friis, E.M. On the evolutionary history of Ephedra: Cretaceous fossils and extant molecules. Proc. Natl. Acad. Sci. USA 2004, 101, 16571–16576. [Google Scholar] [CrossRef]
- Ivanov, L.A.; Ivanova, L.A.; Ronzhina, D.A.; Chechulin, M.L.; Tserenkhand, G.; Gunin, P.D.; P’yankov, V.I. Structural and functional grounds for Ephedra sinica expansion in Mongolian steppe ecosystems. Russ. J. Plant Physiol. 2004, 51, 469–475. [Google Scholar] [CrossRef]
- Carlquist, S. Wood and bark anatomy of the New World species of Ephedra. Aliso 1989, 12, 441–483. [Google Scholar] [CrossRef][Green Version]
- Carlquist, S. Wood, bark and pith anatomy of Old World species of Ephedra and summary for the genus. Aliso 1992, 13, 255–295. [Google Scholar] [CrossRef][Green Version]
- Motomura, H.; Noshiro, S.; Mikage, M. Variable wood formation and adaptation to the alpine environment of Ephedra pachyclada (Gnetales: Ephedraceae) in the Mustang district, western Nepal. Ann. Bot. 2007, 100, 315–324. [Google Scholar] [CrossRef]
- Oladi, R.; Emaminasab, M.; Eckstein, D. The dendroecological potential of shrubs in north Iranian semi-deserts. Dendrochronologia 2017, 44, 94–102. [Google Scholar] [CrossRef]
- Opała, M.; Niedźwiedź, T.; Rahmonov, O. Dendrochronological potential of Ephedra equisetina from Zaravshan Mountains (Tajikistan) in climate change studies. Contemp. Trends Geosci. 2013, 2, 48–52. [Google Scholar] [CrossRef]
- Cuxart, J.; Jiménez, M.A. Deep radiation fog in a wide closed valley: Study by numerical modeling and remote sensing. Pure Appl. Geophys. 2012, 169, 911–926. [Google Scholar] [CrossRef]
- KNMI Climate Explorer. Available online: https://climexp.knmi.nl/start.cgi (accessed on 18 December 2020).
- Vicente-Serrano, S.M.; Tomas-Burguera, M.; Beguería, S.; Reig, F.; Latorre, B.; Peña-Gallardo, M.; Yolanda Luna, M.; Morata, A.; González-Hidalgo, J.C. A high resolution dataset of drought indices for Spain. Data 2017, 2, 22. [Google Scholar] [CrossRef]
- Pan, N.; Wang, S.; Liu, Y.; Zhao, W.; Fu, B. Global surface soil moisture dynamics in 1979–2016 observed from ESA CCI SM dataset. Water 2019, 11, 883. [Google Scholar] [CrossRef]
- Fritts, H.C. Tree-Rings and Climate; Academic Press: London, UK, 1976. [Google Scholar]
- Holmes, R.L. Computer-assisted quality control in tree-ring dating and measurement. Tree-Ring Bull. 1983, 43, 69–78. [Google Scholar]
- Cook, E.R.; Krusic, P. A Tree-Ring Standardization Program Based on Detrending and Autoregressive Time Series Modeling, with Interactive Graphics; Tree-Ring Laboratory, Lamont Doherty Earth Observatory, Columbia University: New York, NY, USA, 2005. [Google Scholar]
- Briffa, K.R.; Jones, P.D. Basic Chronology Statistics and Assessment. In Methods of Dendrochronology: Applications in the Environmental Sciences; Kluwer Academic Publishers: Dordrecht, The Netherlands, 1990; pp. 137–152. [Google Scholar]
- Wigley, T.M.; Briffa, K.R.; Jones, P.D. On the average value of correlated time series, with applications in dendroclimatology and hydrometeorology. J. Clim. Appl. Meteorol. 1984, 23, 201–213. [Google Scholar] [CrossRef]
- Venables, W.N.; Ripley, B.D. Modern Applied Statistics with S.; Springer: Berlin/Heidelberg, Germany, 2002. [Google Scholar]
- Pinheiro, J.; Bates, D.; DebRoy, S.; Sarkar, D. R Core Team _nlme: Linear and Nonlinear Mixed Effects Models_. R Package Version 3.1-151. 2020. Available online: https://CRAN.R-project.org/package=nlme (accessed on 1 March 2021).
- R Core Team. R: A Language and Environment for Statistical Computing; R Foundation for Statistical Computing: Vienna, Austria, 2020; Available online: https://www.R-project.org/ (accessed on 18 December 2020).
- Vaganov, E.A.; Hughes, M.K.; Shashkin, A. Growth Dynamics of Conifer Tree Rings: Images of Past and Future Environments; Springer: Berlin/Heidelberg, Germany, 2006. [Google Scholar]
- Tolwinski-Ward, S.E.; Anchukaitis, K.J.; Evans, M.N. Bayesian parameter estimation and interpretation for an intermediate model of tree-ring width. Clim. Past 2013, 9, 1481–1493. [Google Scholar] [CrossRef]
- Tolwinski-Ward, S.E.; Evans, M.N.; Hughes, M.; Anchukaitis, K. An efficient forward model of the climate controls on interannual variation in tree-ring width. Clim. Dyn. 2011, 36, 2419–2439. [Google Scholar] [CrossRef]
- Touchan, R.; Shishov, V.V.; Meko, D.M.; Nouiri, I.; Grachev, A. Process based model sheds light on climate sensitivity of Mediterranean tree-ring width. Biogeosciences 2012, 9, 965–972. [Google Scholar] [CrossRef]
- De Luis, M.; Gričar, J.; Čufar, K.; Raventós, R. Seasonal dynamics of wood formation in Pinus halepensis from dry and semi-arid ecosystems in Spain. IAWA J. 2007, 28, 389–404. [Google Scholar] [CrossRef]
- Camarero, J.J.; Olano, J.M.; Parras, A. Plastic bimodal xylogenesis in conifers from continental Mediterranean climates. New Phytol. 2010, 185, 471–480. [Google Scholar] [CrossRef]
- Moreno-Gutiérrez, C.; Dawson, T.E.; Nicolás, E.; Querejeta, J.I. Isotopes reveal contrasting water use strategies among coexisting plant species in a Mediterranean ecosystem. New Phytol. 2012, 196, 489–496. [Google Scholar] [CrossRef]
- Voltas, J.; Lucabaugh, D.; Chambel, M.R.; Ferrio, J.P. Intraspecific variation in the use of water sources by the circum-Mediterranean conifer Pinus halepensis. New Phytol. 2015, 208, 1031–1041. [Google Scholar] [CrossRef] [PubMed]
- West, A.G.; Hultine, K.R.; Burtch, K.G.; Ehleringer, J.R. Seasonal variations in moisture use in a piñon–juniper woodland. Oecologia 2007, 153, 787–798. [Google Scholar] [CrossRef]
- West, A.; Hultine, K.; Jackson, T.; Ehleringer, J. Differential summer water use by Pinus edulis and Juniperus osteosperma reflects contrasting hydraulic characteristics. Tree Physiol. 2008, 27, 1711–1720. [Google Scholar] [CrossRef] [PubMed]
- Williams, D.G.; Ehleringer, J.R. Intra- and interspecific variation for summer precipitation use in Pinyon-juniper woodlands. Ecol. Monogr. 2000, 70, 517–537. [Google Scholar]
- Antunes, C.; Díaz-Barradas, M.C.; Zunzunegui, M.; Vieira, S.; Máguas, C. Water source partitioning among plant functional types in a semi-arid dune ecosystem. J. Veg. Sci. 2018, 29, 671–683. [Google Scholar] [CrossRef]
- Ehleringer, J.R.; Dawson, T.E. Water uptake by plants: Perspectives from stable isotope composition. Plant Cell Environ. 1992, 15, 1073–1082. [Google Scholar] [CrossRef]
- Borghetti, M.; Cinnirella, S.; Magnani, F.; Saracino, A. Impact of long-term drought on xylem embolism and growth in Pinus halepensis Mill. Trees 1998, 12, 187–195. [Google Scholar] [CrossRef]
- Wilcox, C.S.; Ferguson, J.W.; Fernandez, G.C.J.; Nowak, R.S. Fine root growth dynamics of four Mojave Desert shrubs as related to soil moisture and microsite. J. Arid. Environ. 2004, 56, 129–148. [Google Scholar] [CrossRef]
- Sarris, D.; Christodoulakis, D.; Körner, C. Recent decline in precipitation and tree growth in the eastern Mediterranean. Glob. Chang. Biol. 2007, 13, 1187–1200. [Google Scholar] [CrossRef]
- Klein, T.; Cohen, S.; Yakir, D. Hydraulic adaptations underlying drought resistance of Pinus halepensis. Tree Physiol. 2011, 31, 637–648. [Google Scholar] [CrossRef] [PubMed]
- Camarero, J.J.; Sánchez-Salguero, R.; Ribas, M.; Touchan, R.; Andreu-Hayles, L.; Dorado-Liñán, I.; Meko, D.M.; Gutiérrez, E. Biogeographic, atmospheric and climatic factors influencing tree growth in Mediterranean Aleppo pine forests. Forests 2020, 11, 736. [Google Scholar] [CrossRef]
- De Luis, M.; Novak, K.; Čufar, K.; Raventós, J. Size mediated climate–growth relationships in Pinus halepensis and Pinus pinea. Trees 2009, 23, 1065–1073. [Google Scholar] [CrossRef]
- Dorman, M.; Perevolotsky, A.; Sarris, D.; Svoray, T. The effect of rainfall and competition intensity on forest response to drought: Lessons learned from a dry extreme. Oecologia 2015, 177, 1025–1038. [Google Scholar] [CrossRef] [PubMed]
- Hevia, A.; Campelo, F.; Chambel, R.; Vieira, J.; Alía, R.; Majada, J.; Sánchez-Salguero, R. Which matters more for wood traits in Pinus halepensis Mill, provenance or climate? Ann. For. Sci. 2020, 77, 55. [Google Scholar] [CrossRef]
- Preisler, Y.; Tatarinov, F.; Grünzweig, J.M.; Bert, D.; Ogée, J.; Wingate, L.; Rotenberg, E.; Rohatyn, S.; Her, N.; Moshe, I.; et al. Mortality versus survival in drought-affected Aleppo pine forest depends on the extent of rock cover and soil stoniness. Funct. Ecol. 2019, 33, 901–912. [Google Scholar] [CrossRef]
- Baquedano, F.J.; Castillo, F.J. Drought tolerance in the Mediterranean species Quercus coccifera, Quercus ilex, Pinus halepensis and Juniperus phoenicea. Photosynthetica 2007, 45, 229–238. [Google Scholar] [CrossRef]


| Site Type | Site | Latitude (N) | Longitude (W) | Elevation (m a.s.l.) | Aspect | Sampled Species | Mean Annual Temperature (°C) | Total Annual Precipitation (mm) |
|---|---|---|---|---|---|---|---|---|
| Mid-elevation dry sites | Lanaja | 41°44′16″ | 0°23′31″ | 483 | N–NE | Pinus halepensis, Juniperus thurifera, Juniperus phoenicea, Ephedra nebrodensis | 8.5 | 463 |
| Monegrillo | 41°38′50″ | 0°21′50″ | 540 | E–NE | Ephedra nebrodensis | 8.4 | 394 | |
| Low-elevation very dry site | Peñaflor | 41°47′01″ | 0°43′19″ | 358 | E, S | Pinus halepensis, Juniperus thurifera, Juniperus phoenicea, Ephedra nebrodensis | 14.4 | 353 |
| Site Type | Species | Diameter (cm) | Height (m) | No. of Measured Individuals (No. of Radii) | Best Replicated Period | Mean Ring Width (mm) | AC1 | MS | Rbar |
|---|---|---|---|---|---|---|---|---|---|
| Dry site | Pinus halepensis | 28.7 ± 2.3 | 6.9 ± 1.3 | 32 (47) | 1939–2020 | 1.27 ± 0.23 | 0.72 | 0.36 | 0.78 |
| Juniperus thurifera | 17.0 ± 1.8 | 5.8 ± 0.4 | 16 (28) | 1957–2020 | 1.19 ± 0.69 | 0.41 | 0.43 | 0.52 | |
| Juniperus phoenicea | 11.2 ± 1.6 | 1.9 ± 0.5 | 17 (31) | 1943–2020 | 0.56 ± 0.27 | 0.46 | 0.39 | 0.58 | |
| Ephedra nebrodensis | 10.0 ± 1.8 | 1.1 ± 0.1 | 20 (40) | 1989–2019 | 0.73 ± 0.30 | 0.41 | 0.35 | 0.34 | |
| Very dry site | Pinus halepensis | 32.3 ± 4.6 | 7.8 ± 1.8 | 23 (46) | 1917–2020 | 0.99 ± 0.66 | 0.64 | 0.47 | 0.80 |
| Juniperus thurifera | 17.5 ± 2.9 | 6.1 ± 0.6 | 21 (42) | 1941–2020 | 1.21 ± 0.87 | 0.62 | 0.41 | 0.60 | |
| Juniperus phoenicea | 11.7 ± 1.5 | 1.8 ± 0.2 | 14 (28) | 1934–2020 | 0.51 ± 0.24 | 0.32 | 0.51 | 0.61 | |
| Ephedra nebrodensis | 8.7 ± 0.7 | 0.9 ± 0.1 | 20 (39) | 1985–2019 | 0.44 ± 0.21 | 0.45 | 0.36 | 0.38 |
| Site Type | Species | r | T1 (°C) | T2 (°C) | M1 (v/v) | M2 (v/v) |
|---|---|---|---|---|---|---|
| Dry site | Pinus halepensis | 0.69 | 3.22 | 11.02 | 0.026 | 0.235 |
| Juniperus thurifera | 0.58 | 8.46 | 20.01 | 0.015 | 0.361 | |
| Juniperus phoenicea | 0.49 | 6.66 | 17.62 | 0.094 | 0.146 | |
| Ephedra nebrodensis | 0.65 | 7.56 | 10.38 | 0.007 | 0.316 | |
| Very dry site | Pinus halepensis | 0.78 | 5.72 | 12.76 | 0.096 | 0.352 |
| Juniperus thurifera | 0.58 | 4.69 | 12.80 | 0.014 | 0.289 | |
| Juniperus phoenicea | 0.67 | 5.20 | 15.01 | 0.001 | 0.284 | |
| Ephedra nebrodensis | 0.38 | 6.17 | 17.39 | 0.003 | 0.235 |
Publisher’s Note: MDPI stays neutral with regard to jurisdictional claims in published maps and institutional affiliations. |
© 2021 by the authors. Licensee MDPI, Basel, Switzerland. This article is an open access article distributed under the terms and conditions of the Creative Commons Attribution (CC BY) license (http://creativecommons.org/licenses/by/4.0/).
Share and Cite
Camarero, J.J.; Valeriano, C.; Gazol, A.; Colangelo, M.; Sánchez-Salguero, R. Climate Differently Impacts the Growth of Coexisting Trees and Shrubs under Semi-Arid Mediterranean Conditions. Forests 2021, 12, 381. https://doi.org/10.3390/f12030381
Camarero JJ, Valeriano C, Gazol A, Colangelo M, Sánchez-Salguero R. Climate Differently Impacts the Growth of Coexisting Trees and Shrubs under Semi-Arid Mediterranean Conditions. Forests. 2021; 12(3):381. https://doi.org/10.3390/f12030381
Chicago/Turabian StyleCamarero, Jesús Julio, Cristina Valeriano, Antonio Gazol, Michele Colangelo, and Raúl Sánchez-Salguero. 2021. "Climate Differently Impacts the Growth of Coexisting Trees and Shrubs under Semi-Arid Mediterranean Conditions" Forests 12, no. 3: 381. https://doi.org/10.3390/f12030381
APA StyleCamarero, J. J., Valeriano, C., Gazol, A., Colangelo, M., & Sánchez-Salguero, R. (2021). Climate Differently Impacts the Growth of Coexisting Trees and Shrubs under Semi-Arid Mediterranean Conditions. Forests, 12(3), 381. https://doi.org/10.3390/f12030381