Article

Tree Height Measurements in Degraded Tropical Forests Based on UAV-LiDAR Data of Different Point Cloud Densities: A Case Study on Dacrydium pierrei in China

1
Research Institute of Forest Resource Information Techniques, Chinese Academy of Forestry, Beijing 100091, China
2
College of Forestry, Sichuan Agricultural University, Chengdu 611130, China
3
Key Laboratory of Forestry Remote Sensing and Information System, National Forestry and Grassland Administration, Beijing 100091, China
*
Author to whom correspondence should be addressed.
These authors contributed equally to this work.
Forests 2021, 12(3), 328; https://doi.org/10.3390/f12030328
Submission received: 22 January 2021 / Revised: 4 March 2021 / Accepted: 8 March 2021 / Published: 11 March 2021
(This article belongs to the Special Issue Forestry Applications of Unmanned Aerial Vehicles (UAVs) 2020)

Abstract

:
Tropical forest degradation is a major contributor to greenhouse gas emissions. Tree height can be used as an important predictor of forest growth, and yield models can provide basic data for forest degradation assessments. As an important parameter of unmanned aerial vehicle-light detection and ranging (UAV-LiDAR), it is not clear how the point cloud density affects the extraction accuracy of tree height in degraded tropical rain forests. To solve this problem, we collected UAV-LiDAR data at a flight altitude of 150 m, and then resampled the UAV-LiDAR data obtained according to the point cloud density percentage resampling method and obtained UAV-LiDAR data for five different point cloud densities, namely, 12, 17, 28, 64, and 108 points/m2. On the basis of the resampled LiDAR data, we generated a canopy height model (CHM) to extract the height of Dacrydium pierrei (D. pierrei). The results show that (1) With the increase in the point cloud density, the accuracy of tree height extraction gradually increased, with a maximum accuracy at 108 points/m2 (root mean squared error (RMSE)% = 22.78%, bias% = 14.86%). The accuracy (RMSE%) increased by 6.92% as the point cloud density increased from 12 points/m2 to 17 points/m2, but only increased by 0.99% as the point cloud density increased from 17 points/m2 to 108 points/m2, indicating that 17 points/m2 is a critical point for tree height extraction of D. pierrei. (2) Compared with the results from broad-leaved forests, the accuracy of D. pierrei height extraction from coniferous forest was higher. With the increase in point cloud density, the difference in the accuracy of D. pierrei height between two stands gradually increased. When the point cloud density was 108 points/m2, the differences in RMSE% and bas% were 3.55% and 6.22%, respectively. When the point cloud density was 12 points/m2, the differences in RMSE% and bias% were 2.71% and 4.69%, respectively. Our research identified the lowest LiDAR data point cloud density required to ensure a certain accuracy in tree height extraction, which will help scholars formulate UAV-LiDAR forest resource survey plans.

1. Introduction

Degradation occurs when forests remain forests but lose their ability to provide ecosystem services or suffer major changes in species composition due to overexploitation, exotic species invasion, pollution, fires, or other factors [1]. The State of the World’s Forests 2020 confirmed that extensive forest degradation can lead to a loss of biodiversity. In addition [2], carbon emissions from forest degradation are considered to be one of the main causes of climate change [3]. Dacrydium pierrei (D. pierrei) is a species of Pinaceae. As a result of artificial logging in the 1980s, its distribution has been actively reduced, and it has been listed as a third-level protected plant in China [4,5]. Currently, it is only distributed in degraded forest areas of Hainan Island, China. D. pierrei, as the most important coniferous species in tropical forests in Hainan, China, plays an important role in maintaining species diversity and improving the forest environment [6,7]. Therefore, it is very important to carry out forest resource inventories of D. pierrei in degraded forests.
Tree height, as one of the most important attributes of a tree [8,9,10], can directly reflect its living conditions and can be used together with other attributes (e.g., diameter at breast height (DBH)) to predict important tree attributes that cannot be directly measured, such as wood volume, biomass, and carbon storage [11,12,13,14]. A study [14] has shown that adding tree height to allometric growth equations can significantly improve the estimation accuracy of aboveground biomass (AGB), especially in tropical forests. However, it is often difficult to obtain high-accuracy tree height values in the field, especially in tropical forests, where the forest canopy is dense, thus limiting people’s judgment [15]. In addition, an excessive tree height error will affect the assessment of the survival status of a tree. Therefore, it is very important to develop a rapid and accurate method to measure tree height.
For decades, with the rapid development of remote sensing technology, light detection and ranging (LiDAR) technology has been used to measure the height of trees. Various studies [16,17,18] have used airborne laser scanning (ALS) data to extract tree height values with good results. Sibona et al. [18] reported that, based on the destructively measured tree heights of 100 felled trees in an alpine forest, the ALS (10 points/m2) estimates of tree heights were closer to the ground truth than non-destructive field-measured heights. However, the digital elevation model (DEM) error obtained from ALS data may be larger under dense stand conditions. For example, Leckie et al. [19] reported that errors in the ALS-derived measurement of tree base elevation caused by ground vegetation and terrain microrelief could easily introduce up to 0.5 m of variability in height measurements. Increasing the point cloud density of ALS data is a practical approach. A recent study [20] used ALS data of approximately 450 points/m2 to extract tree height, which can be accurately extracted from canopy trees even under complex stand conditions. However, this requires the use of the most advanced ALS configuration currently on the market, which greatly increases the cost of tree height measurements.
Terrestrial laser scanning (TLS) was introduced for basic forest measurements, such as tree height and DBH, in the early 2000s. TLS tree height estimates from co-registered point clouds [21] have been obtained as the difference between the highest and lowest points of tree point clouds [22,23] or as the value of the 99.9th percentile of height [24]. Several studies [23,25,26] have reported underestimates for TLS-based tree height, although accurate height measurements have been reported when compared with destructively felled trees. Wang et al. [20] found that when measuring the height of trees taller than 20 m, underestimates became increasingly pronounced with the increase in tree height. The possible reason is that TLS cannot capture information about the top part of the canopy. In addition, TLS data cannot be currently collected in a large area.
In recent years, with the development of unmanned aerial vehicle (UAV) technology, LiDAR sensors have been integrated with UAV systems. Because of their reliable security and low cost, they have received extensive attention in academic and commercial circles. Various studies have applied UAV-LiDAR to tree height measurement with good results [27,28,29]. There are two main ways to measure tree height using UAV-LiDAR data: directly from the point cloud [30,31] or from the canopy height model (CHM) generated by LiDAR data [32,33,34]. The majority of studies on height extraction are based on the CHM and have proved that the UAV-LiDAR-derived grids are an objective and valuable source of forest information [35,36,37,38]. Compared with original point cloud data, raster data are very fast in terms of processing speed and are conducive to the judgment of tree canopy information, making them very popular.
The quality of CHM data directly affects the extraction accuracy of the final tree height. Various studies [16,17,18,39] have found that high-density LiDAR data can obtain a more accurate tree height because they determine the CHM resolution and raster value information. However, higher-density LiDAR data requires more expensive data acquisition equipment. Reducing the flight altitude and increasing the pulse energy can improve the density of LiDAR data [40,41,42]; however, this will reduce the data collection area and will ultimately increase the cost of data collection. At present, the cost of UAV-LiDAR data collection is relatively high [43,44], and reducing this cost will help research in this field. In addition, as far as we know, when using UAV-LiDAR data to extract tree heights, few studies have been conducted on the influence of point cloud density on the accuracy of tree height extraction. Therefore, it is particularly important to find the required minimum cloud density on the premise of ensuring a certain tree height extraction accuracy.
In order to solve these problems, we set up 12 field survey plots in tropical forests containing D. pierrei in Hainan, China, including five plots with coniferous forest and seven plots with broad-leaved forest. UAV-LiDAR data were collected at a flight altitude of 150 m and were resampled. Finally, five types of LiDAR data with different point cloud densities were obtained, and the influence of different point cloud densities on the accuracy of D. pierrei height extraction was assessed. In addition, we analyzed the extraction accuracy of D. pierrei height based on UAV-LiDAR data under different vegetation types.

2. Materials and Methods

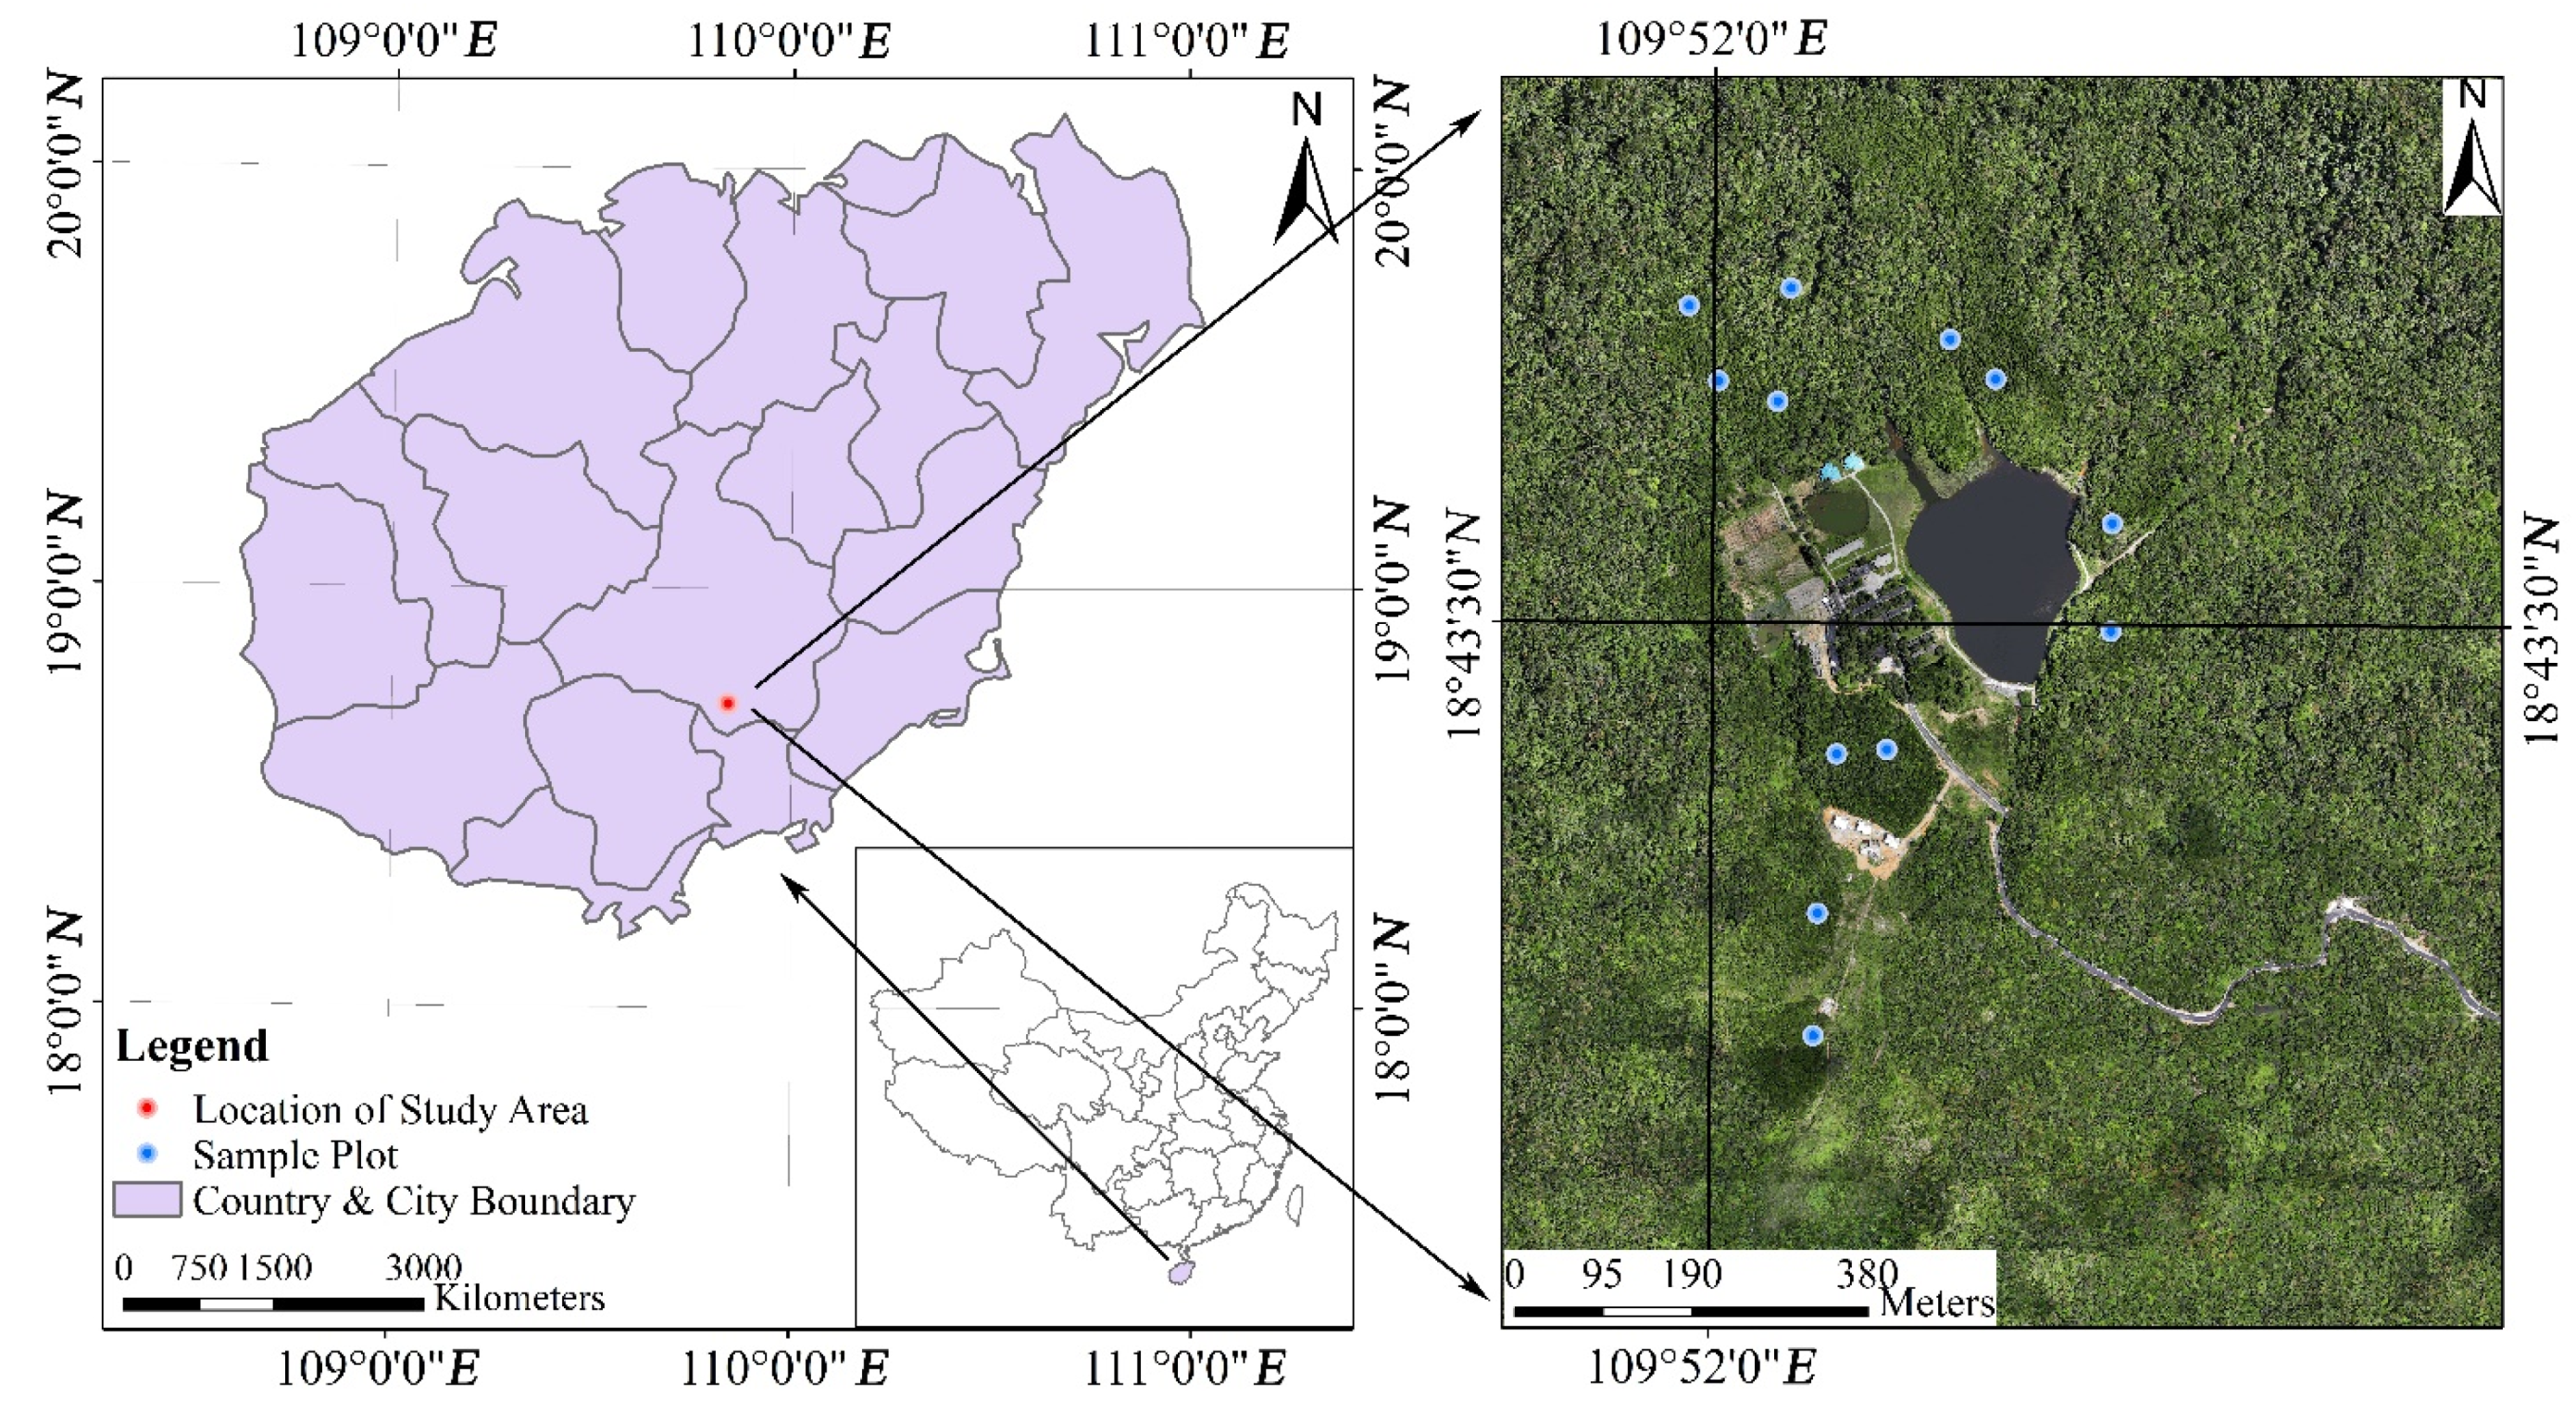
2.1. Overview of the Study Sites

The study area is located in Diaoluoshan National Forest Park (DLS), in Hainan Province, China (Figure 1), which has a total area of about 37,900 hectares. The altitude is 50–1499 m, and the area is characterized by a tropical monsoon climate, with an annual rainfall of 1870–2760 nm and an annual average temperature of 20.8 °C. As a result of artificial logging in the 1980s, most of the natural virgin forest has been destroyed. Therefore, the vegetation types in the study area are composed of coniferous forest, broad-leaved forest, and mixed coniferous and broad-leaved forest, with the main tree species including D. pierrei, Podocarpus imbricatus, Symplocos poilanei, Pentaphyllax euryoides, Alniphyllum fortunei, and Schima superba.

2.2. Data

2.2.1. Ground Data

In May 2018, a total of 12 square plots (d = 30 m, area = 900 m2) were arranged in the degraded forest area of Diaoluoshan Forest Park. These plots, which included five coniferous forest plots and seven broad-leaved forest plots, were replanted after artificial logging. Each plot was divided into 36 5 m × 5 m quadrats, and the relative position of each D. pierrei tree in the quadrats was recorded by a laser rangefinder. Specifically, the vertical distance between the center point of the tree stem and the northern, southern, eastern, and western boundaries of the quadrats was measured by a laser rangefinder. In each plot, we investigated all D. pierrei trees with a DBH greater than 10 cm and recorded the DBH, tree height, and position information; DBH was measured by a DBH tape and tree height by a laser altimeter. Finally, the plot coordinates were measured using a real-time kinematic global navigation satellite system (RTK-GNSS) based on the qianxun continuously operating reference station (CORS) network. As a result of the high stand density of tropical rain forests, this type of RTK-GNSS, based on a qianxun CORS network positioning performance, is affected to a degree, but it can still reach sub-meter accuracy. For certain sample plots with a poor signal, we used the lead point method. Firstly, the coordinate of the point with the best RTK-GNSS signal was measured around the corner of the sample site, and then the coordinate of the corner of the sample plot was obtained using the electronic total station. Detailed statistics of all measured trees are shown in Table 1.

2.2.2. LiDAR Data

In May 2018, UAV-LiDAR data from the study area were acquired using an LiAir1000 sensor mounted on a GV2000 (Green Valley, Beijing, China). In view of the complexity of stand conditions in tropical forests, it is difficult to match ground data based on a CHM. Therefore, we installed a visible light sensor (Sony ILCE-6000, Tkoyo, Japan) on the UAV to assist the matching of D. pierrei data from the ground survey with D. pierrei data extracted by LiDAR. The maximum resolution of the visible light sensor was 6000 × 4000, and the spatial resolution of each image was 2 cm. The LiDAR sensor had a wavelength of 1550 nm, a laser divergence of 0.5 mrad, a laser pulse length of 3 ns, and a vertical accuracy of 0.15 m. We collected LiDAR data and visible light data at an altitude of 150 m, and the point cloud density was 108 points/m2.

2.3. Methods

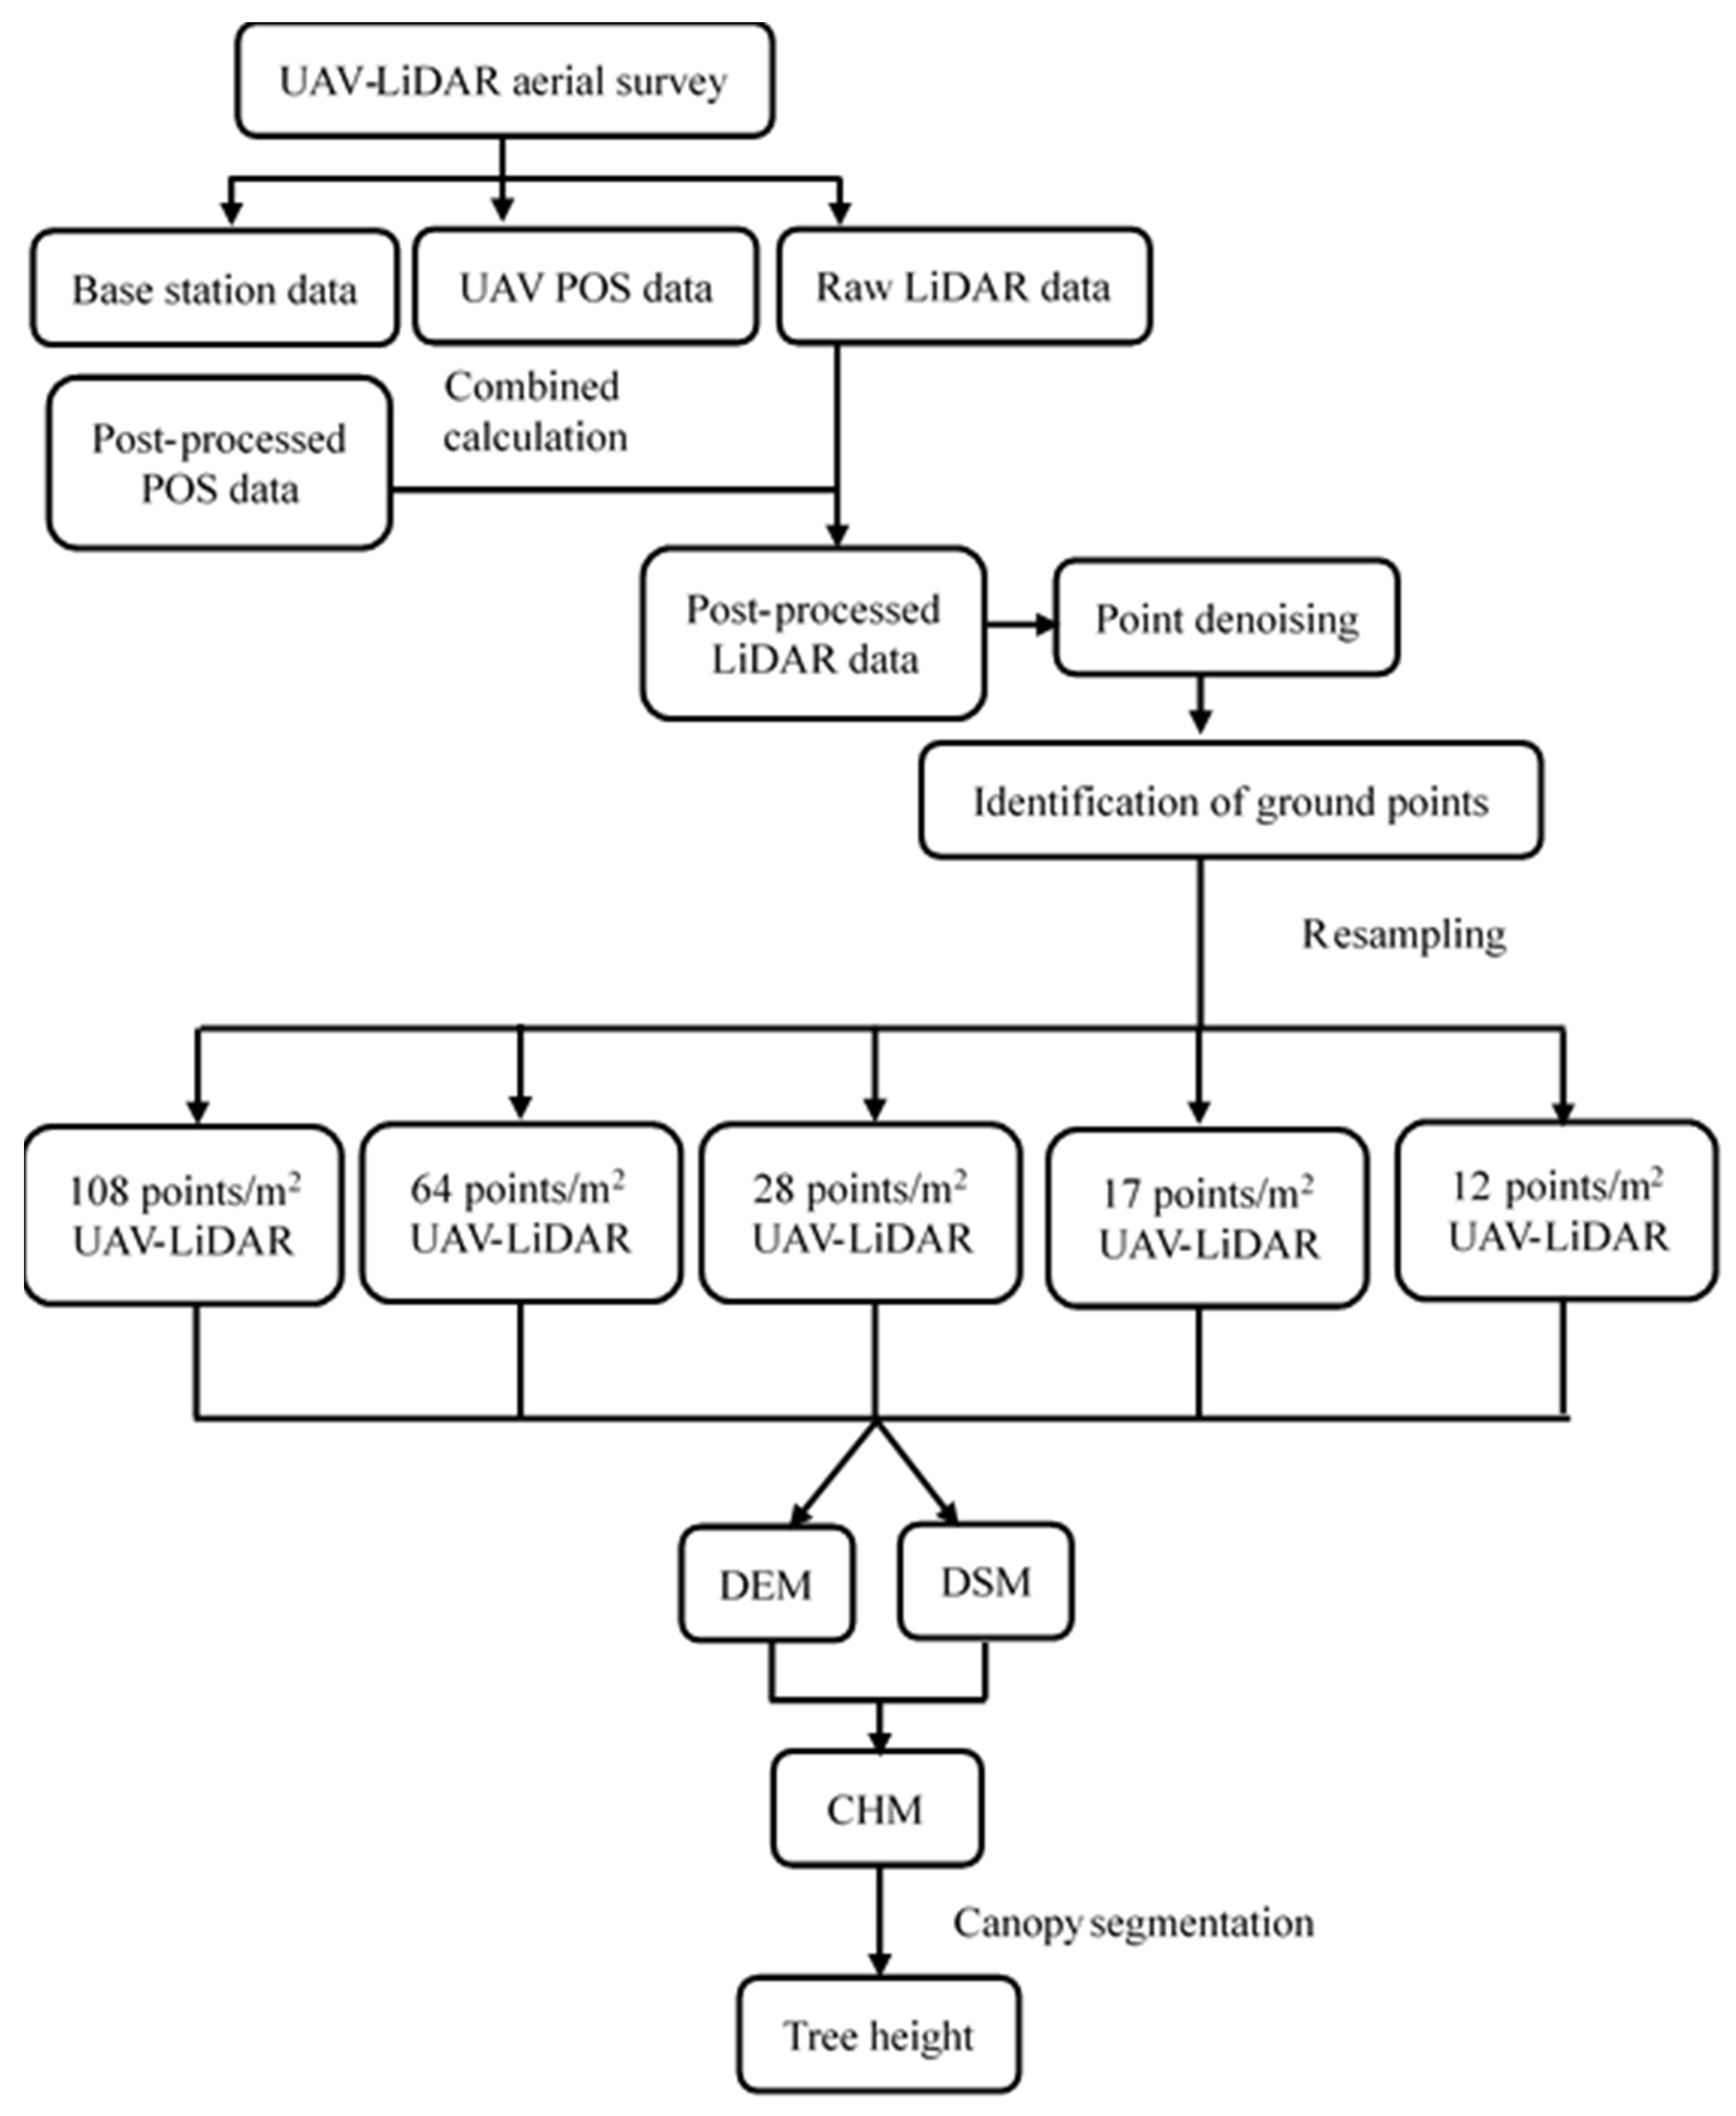
2.3.1. LiDAR Preprocessing

After the UAV-LiDAR survey, we first input the original inertial measurement unit (IMU) data and base station data into the Inertial Explorer 8.50 software and obtained a smoothed best estimate of the trajectory (SBET) as post-processed position orientation system (POS) data. We then added the post-processed POS data and the original point cloud to the Li-Acquire2 software to obtain the calculated LiDAR data. Secondly, the calculated LiDAR data and the post-processed POS data were added to LiDAR360 4.0 for point cloud data strip matching. Subsequently, the post-processed POS data were denoised using LiDAR360 4.0 software (Green Valley, Beijing, China). Finally, an improved progressive triangulated irregular network (TIN) densification (IPTD) filtering algorithm [45] was used to divide the LiDAR data into ground points and non-ground points and to perform the denoising process. This algorithm has been proven to be superior to seven other commonly used wave rate algorithms.

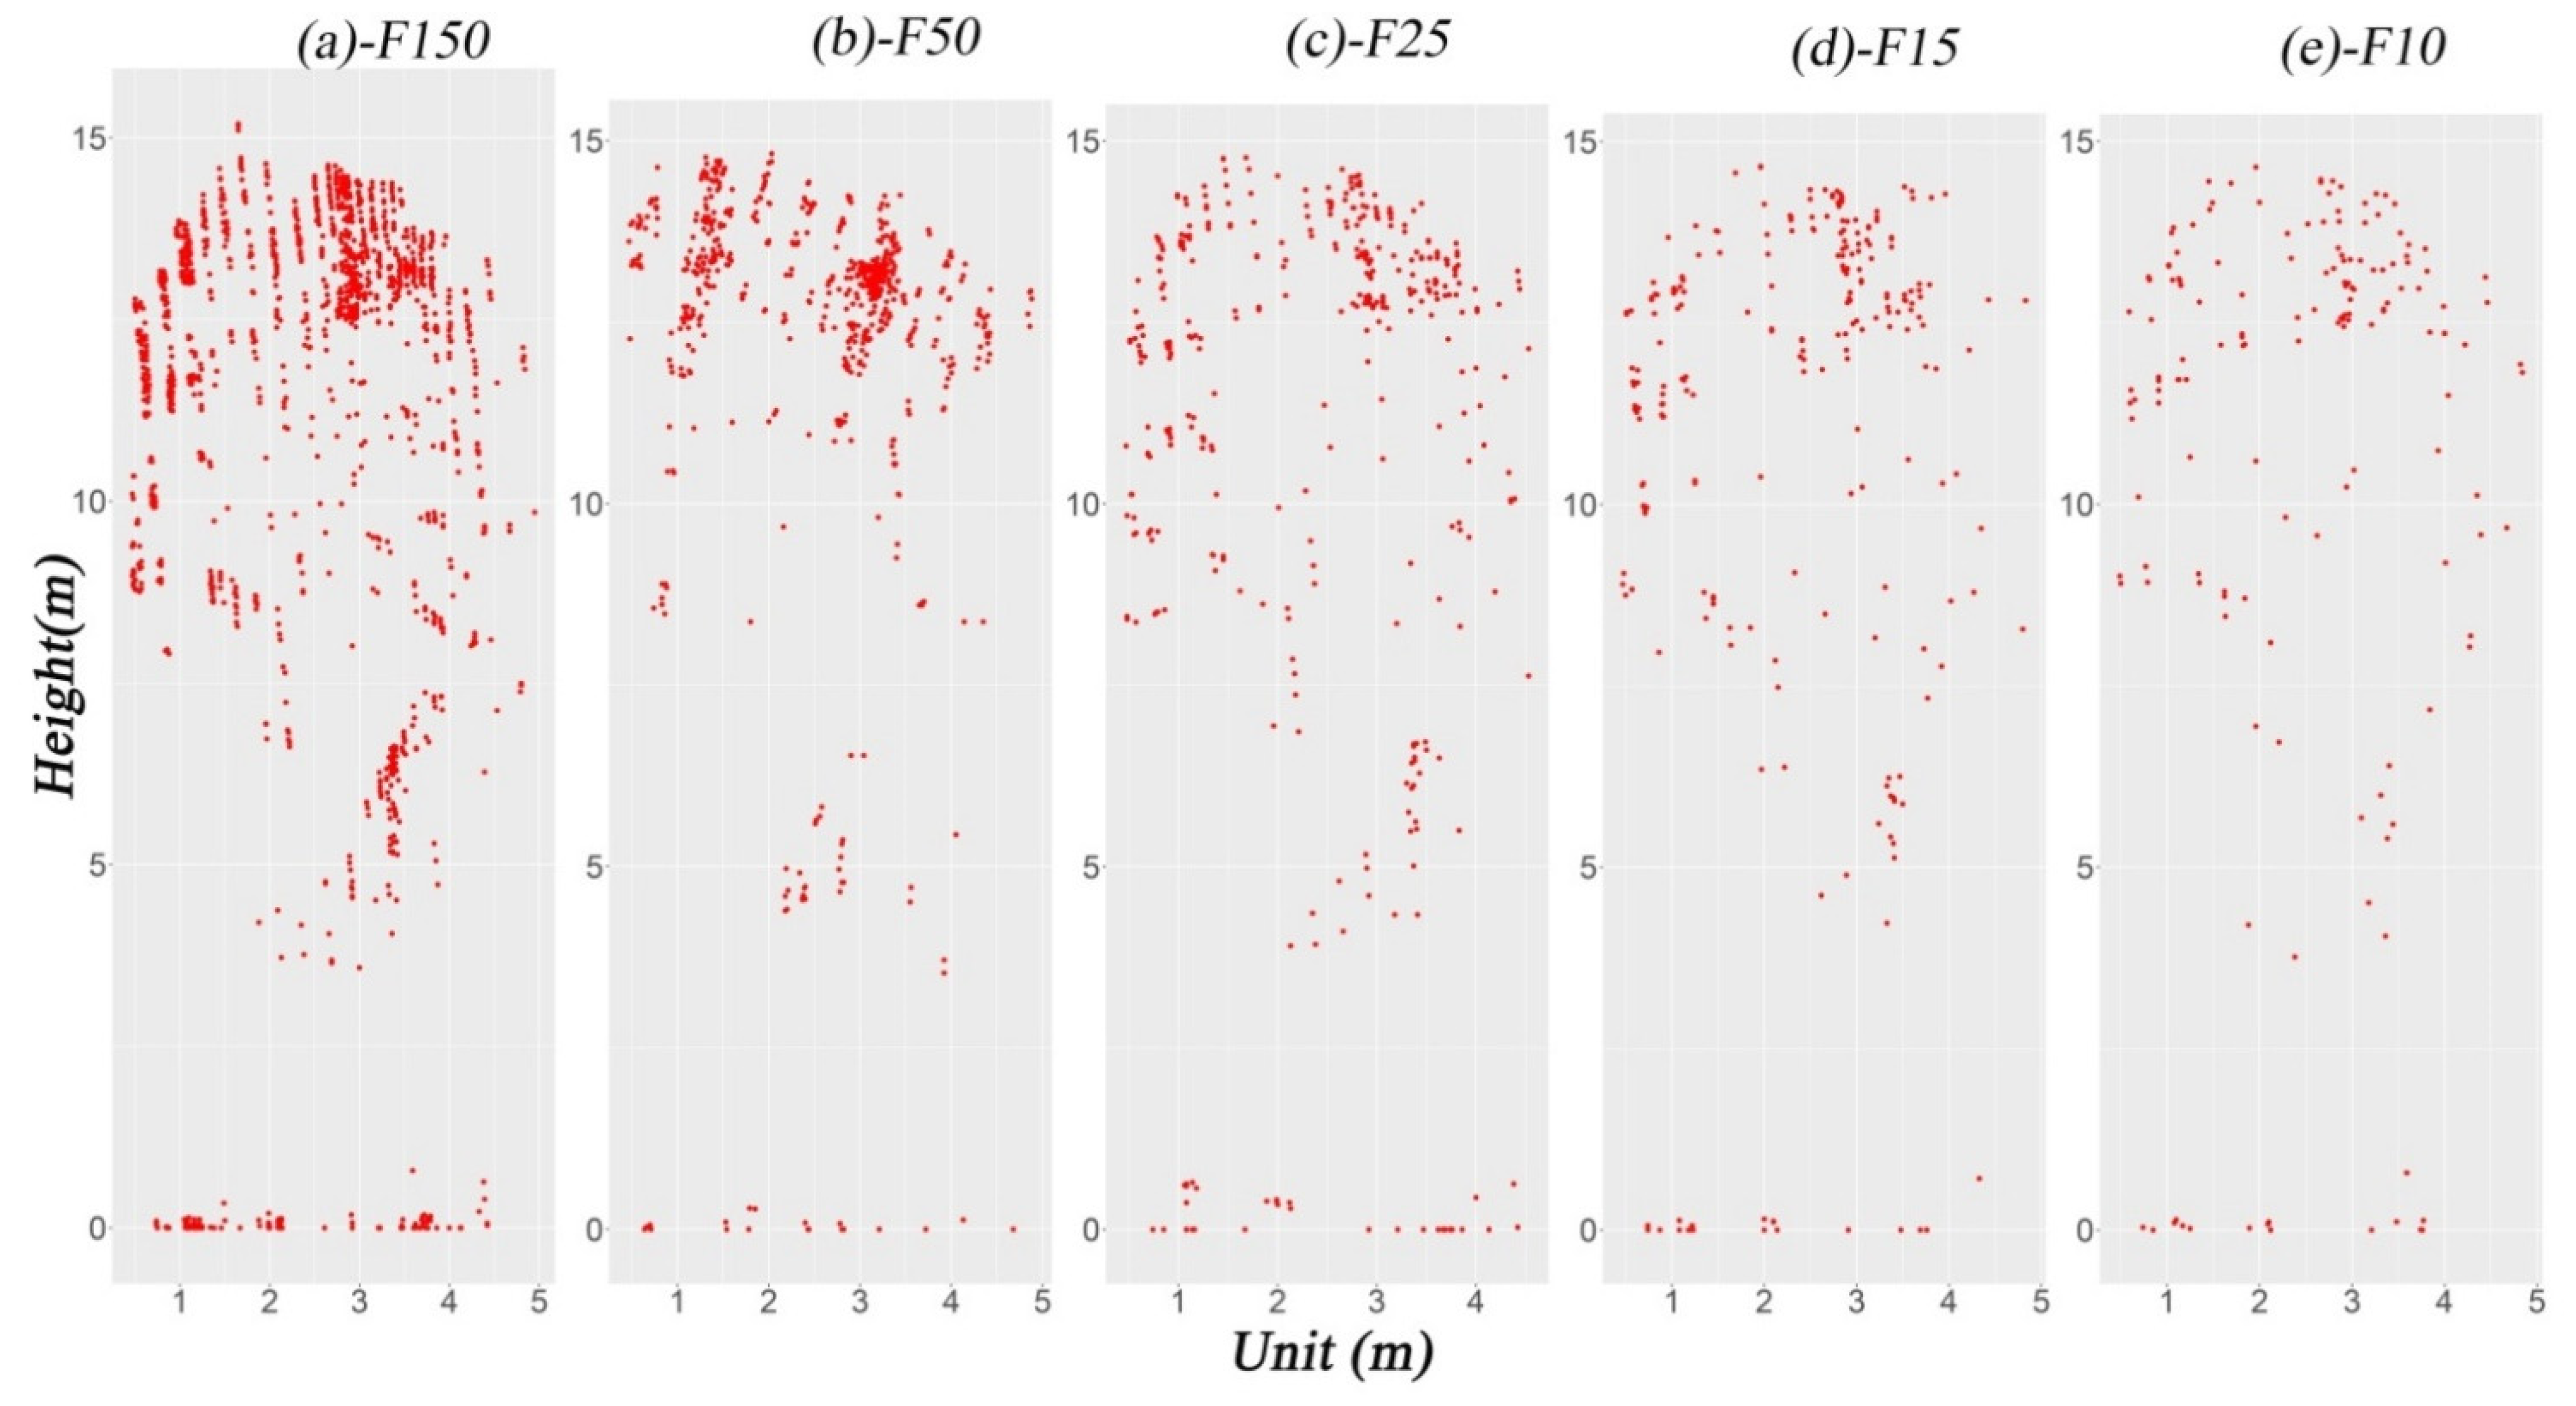
2.3.2. Reduced LiDAR Density

In this study, on the basis of UAV-LiDAR data, we evaluated the accuracy of D. pierrei heights obtained under different point cloud densities and compared these heights with field measurements. In order to obtain LiDAR data with the low cloud density, we resampled the LiDAR data (F150) obtained at the flight altitude of 150 m according to the point cloud density percentage resampling method and obtained resampled data with five different point cloud densities using sampling rates of 10% (R10), 15% (R15), 25% (R25), and 50% (R50). See Table 2 for the specific LiDAR data parameters with different densities. Figure 2 shows the two-dimensional image of single trees LiDAR under different point cloud densities. Some studies have found [46,47] that resampling method can be used to simulate LiDAR data obtained at different flight altitudes. Even if flight footprints cannot be completely simulated, the data obtained in this case differs little from those obtained at different flight altitudes [48]. Compared with the minimum point distance and the octree resampling method, the percentage resampling method basically does not change the density difference between the track edge and the middle region caused by the scanning angle and can more truly simulate the LiDAR data acquired at different flight heights [46,47,48,49,50]. In addition, it can also obtain the required point cloud density data at will. The lowest point cloud density set in this study is 12 points/m2, because the ALS point cloud density in most studies is about 10 points/m2.

2.3.3. Acquisition of D. Pierrei Height with LiDAR Data

Our research did not directly obtain D. pierrei height from the point cloud data, mainly because it was very difficult to match the D. pierrei information extracted from the point cloud data directly with the D. pierrei information from the ground survey in tropical forests, and CHM could help in matching with the ground data. Various studies [16,17] have found that a high-resolution CHM can achieve higher accuracy than a low-resolution CHM in tree height extraction. In this study, we could not obtain a CHM with a resolution higher than 0.5 m because obtaining a higher resolution CHM would cause more black holes to appear. For this reason, we extracted the tree height using a CHM with a 0.5 m resolution. Firstly, to obtain the LiDAR data with different point densities, a digital surface model (DSM) and a DEM with a resolution of 0.5 m were obtained using the Kriging algorithm. The CHM was obtained by subtracting the DEM from the DSM. Thereafter, the obtained CHM was processed by Gaussian smoothing in order to reduce the influence of abnormal points in the CHM for crown segmentation. Subsequently, the watershed algorithm [51] was used to segment the CHM to obtain the tree crown data. Finally, the local maximum method [36] was used to search for the maximum value of the height in the tree crown, and the value and its position were the D. pierrei height and position. It is worth noting that the 12 points/m2 LiDAR data could not obtain a DEM with a resolution of 0.5 m. Therefore, when extracting tree height with 12 points/m2 LiDAR data, we used the DSM generated with 12 points/m2 LiDAR data and the DEM generated with 108 points/m2 LiDAR data. LiDAR data processing was performed in LiDAR360.
The basis for judging the accuracy of single tree segmentation is that only one D. pierrei tree is included in the crown vector data obtained from LiDAR data, with no overlap between adjacent crowns. Finally, 201 trees with accurate segmentation were obtained for tree height analysis. Figure 3 briefly describes our tree height acquisition process.

2.4. Evaluation

The accuracy of measuring D. pierrei height with LiDAR data was evaluated using the root mean square error (RMSE) and bias. The specific formulas are as follows (Equations (1)–(4)):
RMSE = i = 1 n ( y i y i ^ ) 2 n
RMSE % = RMSE y ¯ × 100 %
bias = i = 1 n y i ^ y i n
bias % = bias y ¯ × 100 %
In the formulas, y ¯ is the average tree height obtained from the field survey, y i is the tree height obtained from different point cloud density data, and y i ^ is the tree height obtained from the field survey.
In addition, linear regression analysis was used to describe the relationship between the LiDAR data and the field-measured D. pierrei height. The correlation coefficient (R2) was used to describe the fitting degree of the model.

3. Results

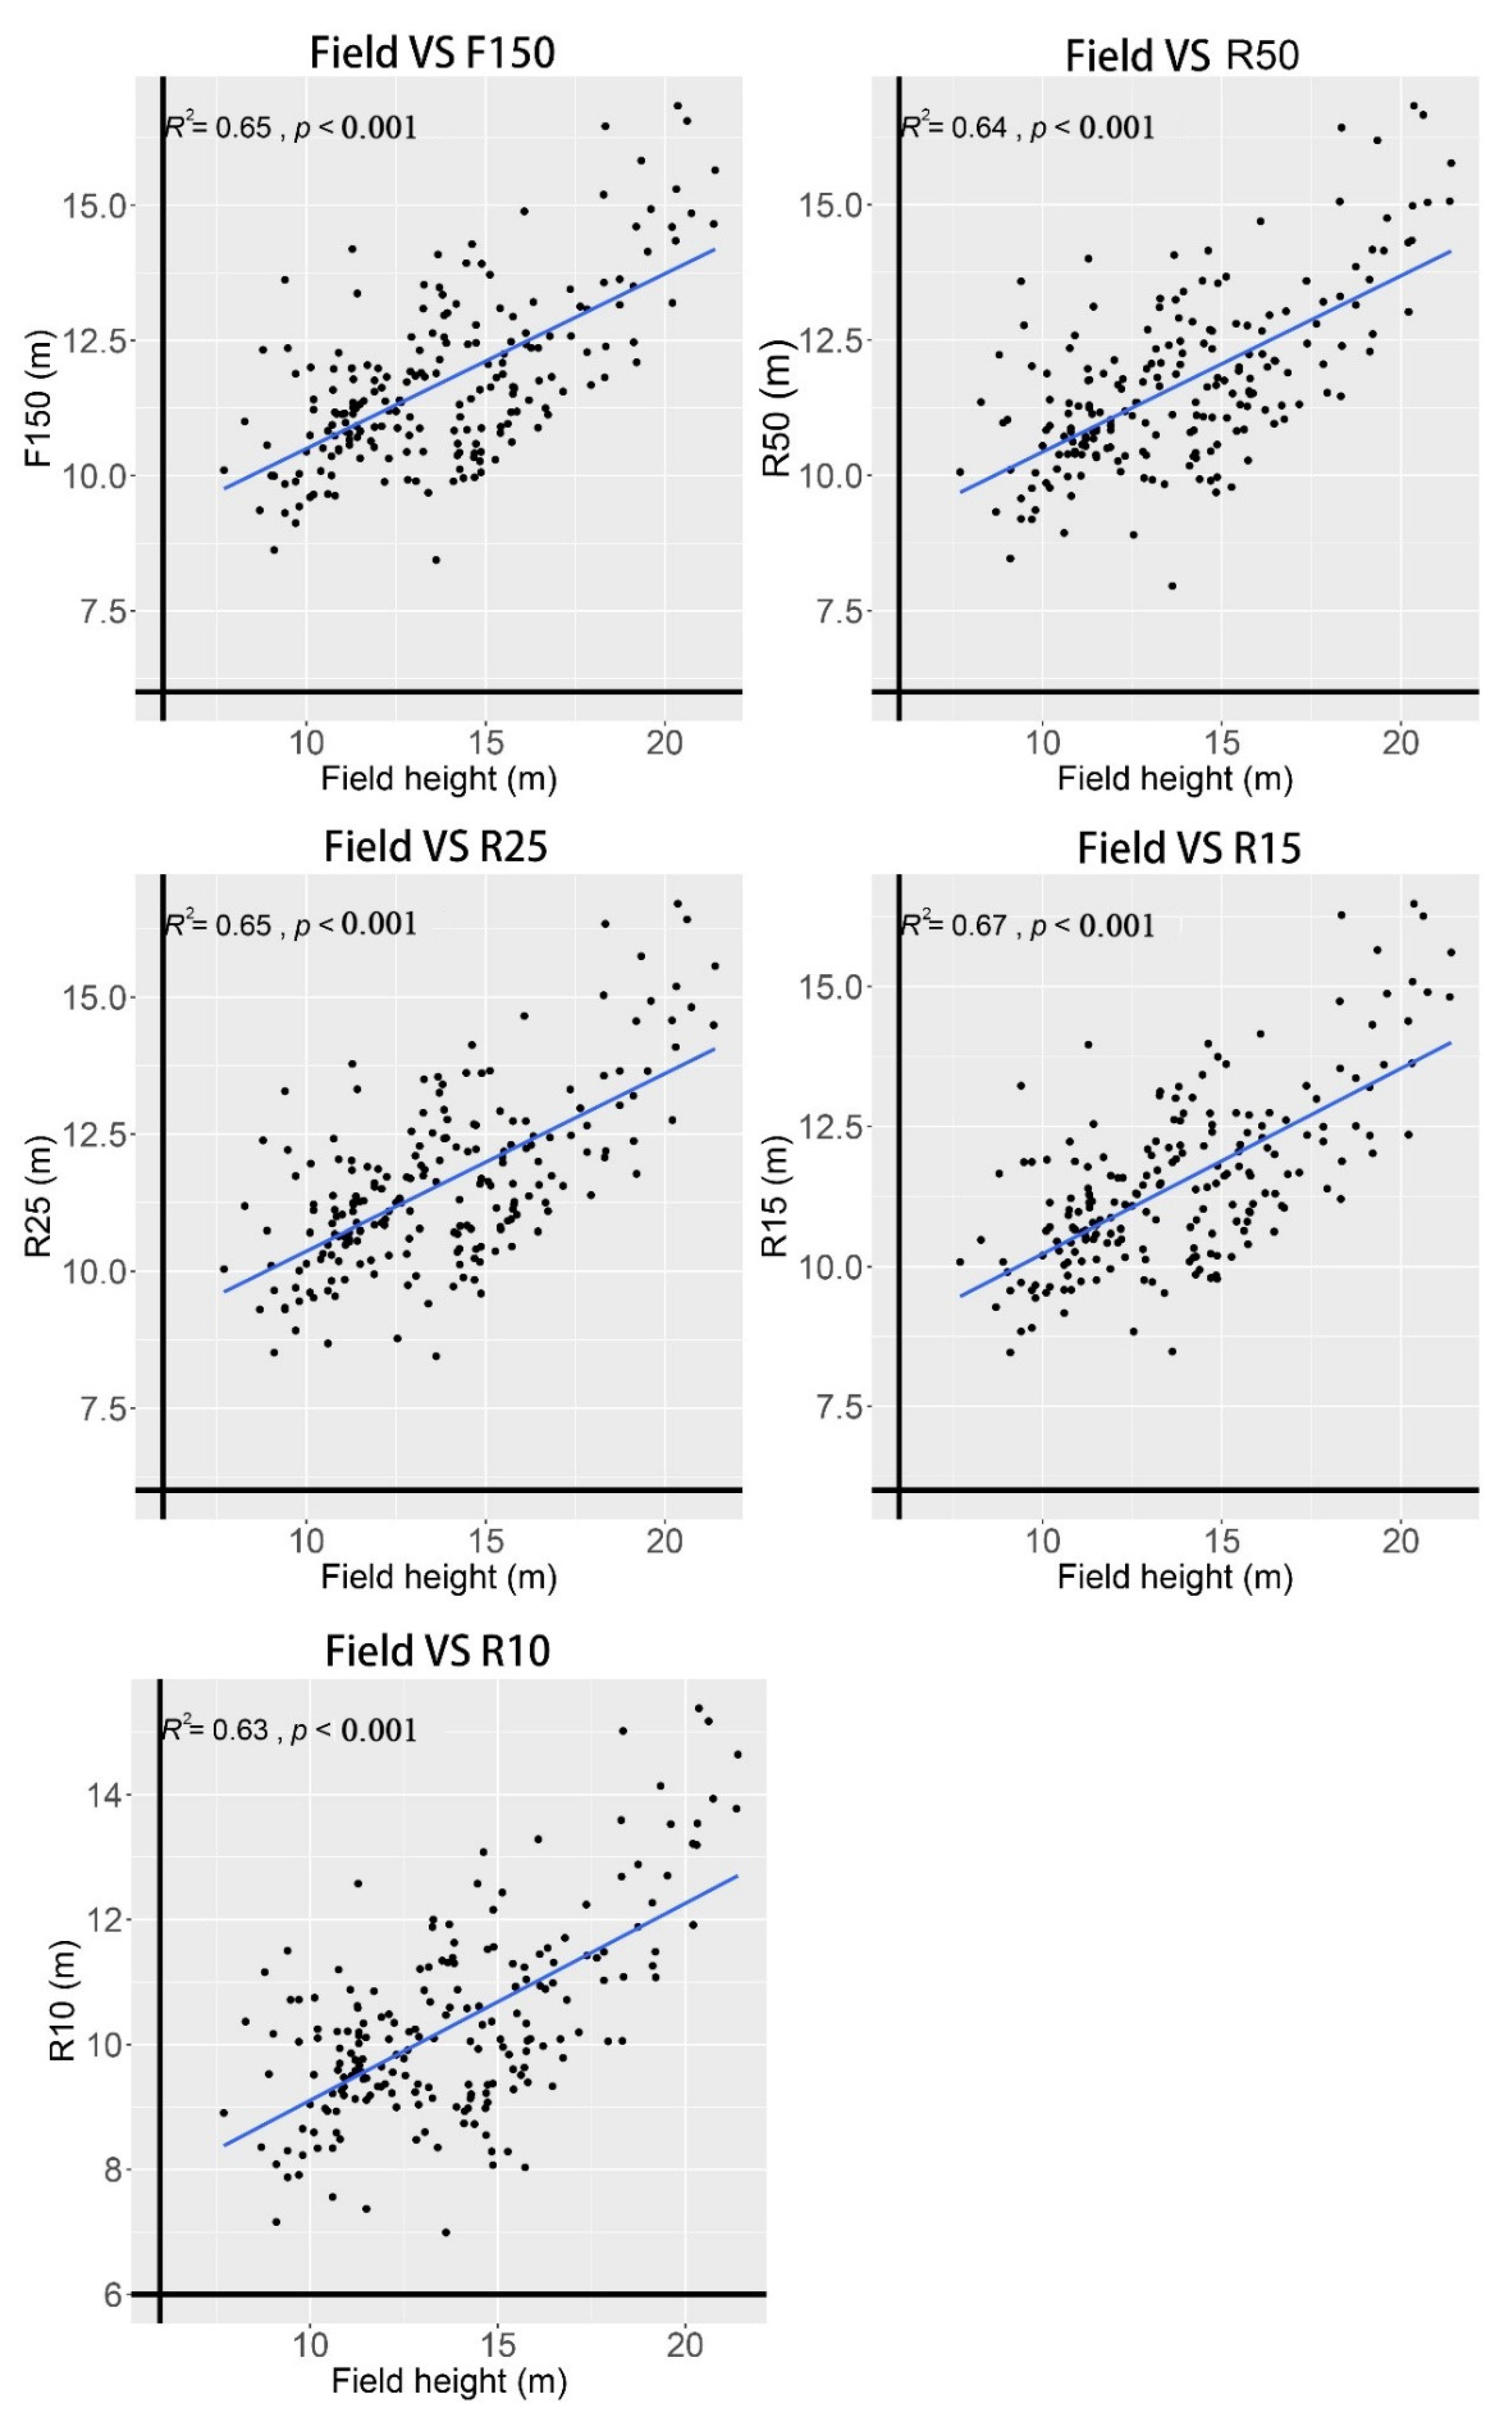
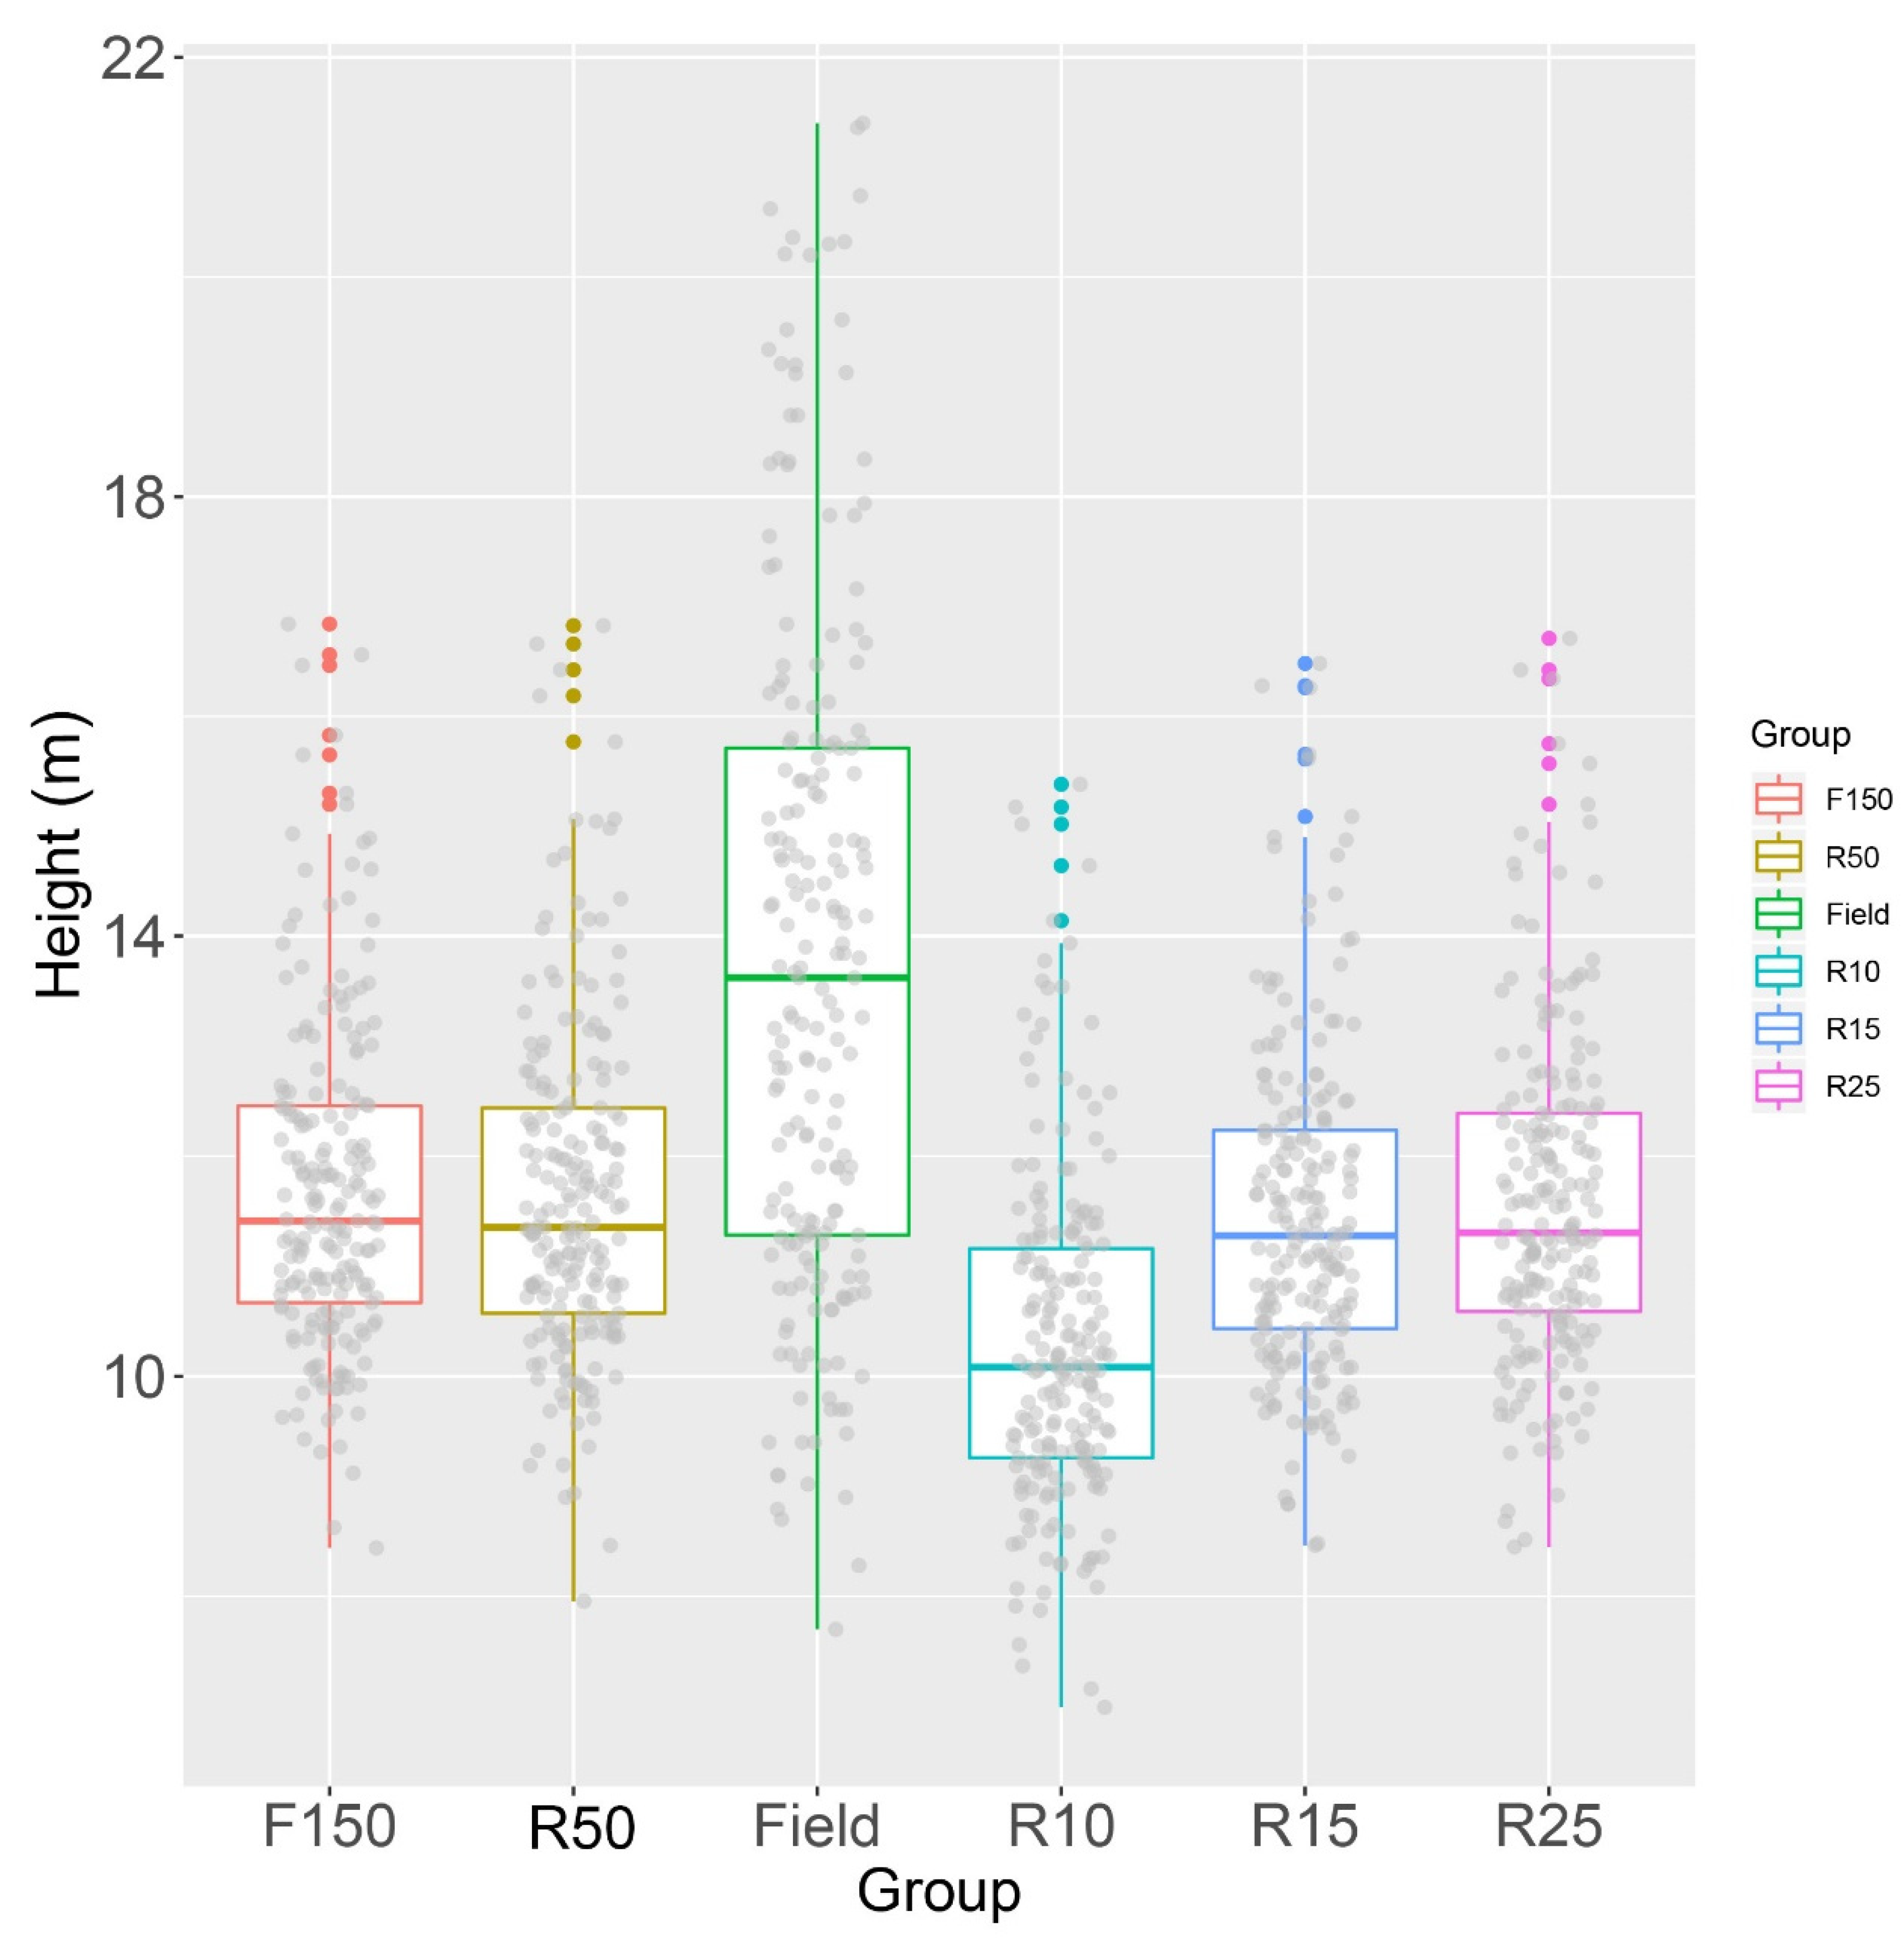
3.1. Accuracy of D. pierrei Height Obtained under Different Point Cloud Densities

The accuracy of D. pierrei height acquisition under different point cloud densities is shown in Table 3 and Figure 4. R10 had the highest RMSE (RMSE%) and bias (bias%) values, which were 4.22 m (30.69%) and 3.47 m (25.22%), respectively, indicating that R10 had the lowest accuracy in terms of D. pierrei height acquisition. The RMSD% and bias% were the relative versions of the RMSD and bias, respectively. F150 had the lowest RMSE and bias values, indicating that F150 had the highest accuracy in terms of D. pierrei height acquisition. With the increase in point cloud density, the accuracy of the extracted D. pierrei height increased gradually; however, there was little difference between R15, R25, R50, and F150. In addition, the D. pierrei heights measured under the five point cloud densities were lower than those obtained in the field survey (Table 3 and Figure 5), and R10 underestimated D. pierrei height to the greatest degree. Our results (Figure 6) also show that with the increase in D. pierrei height, the associated height errors obtained under the five point cloud densities gradually increased.

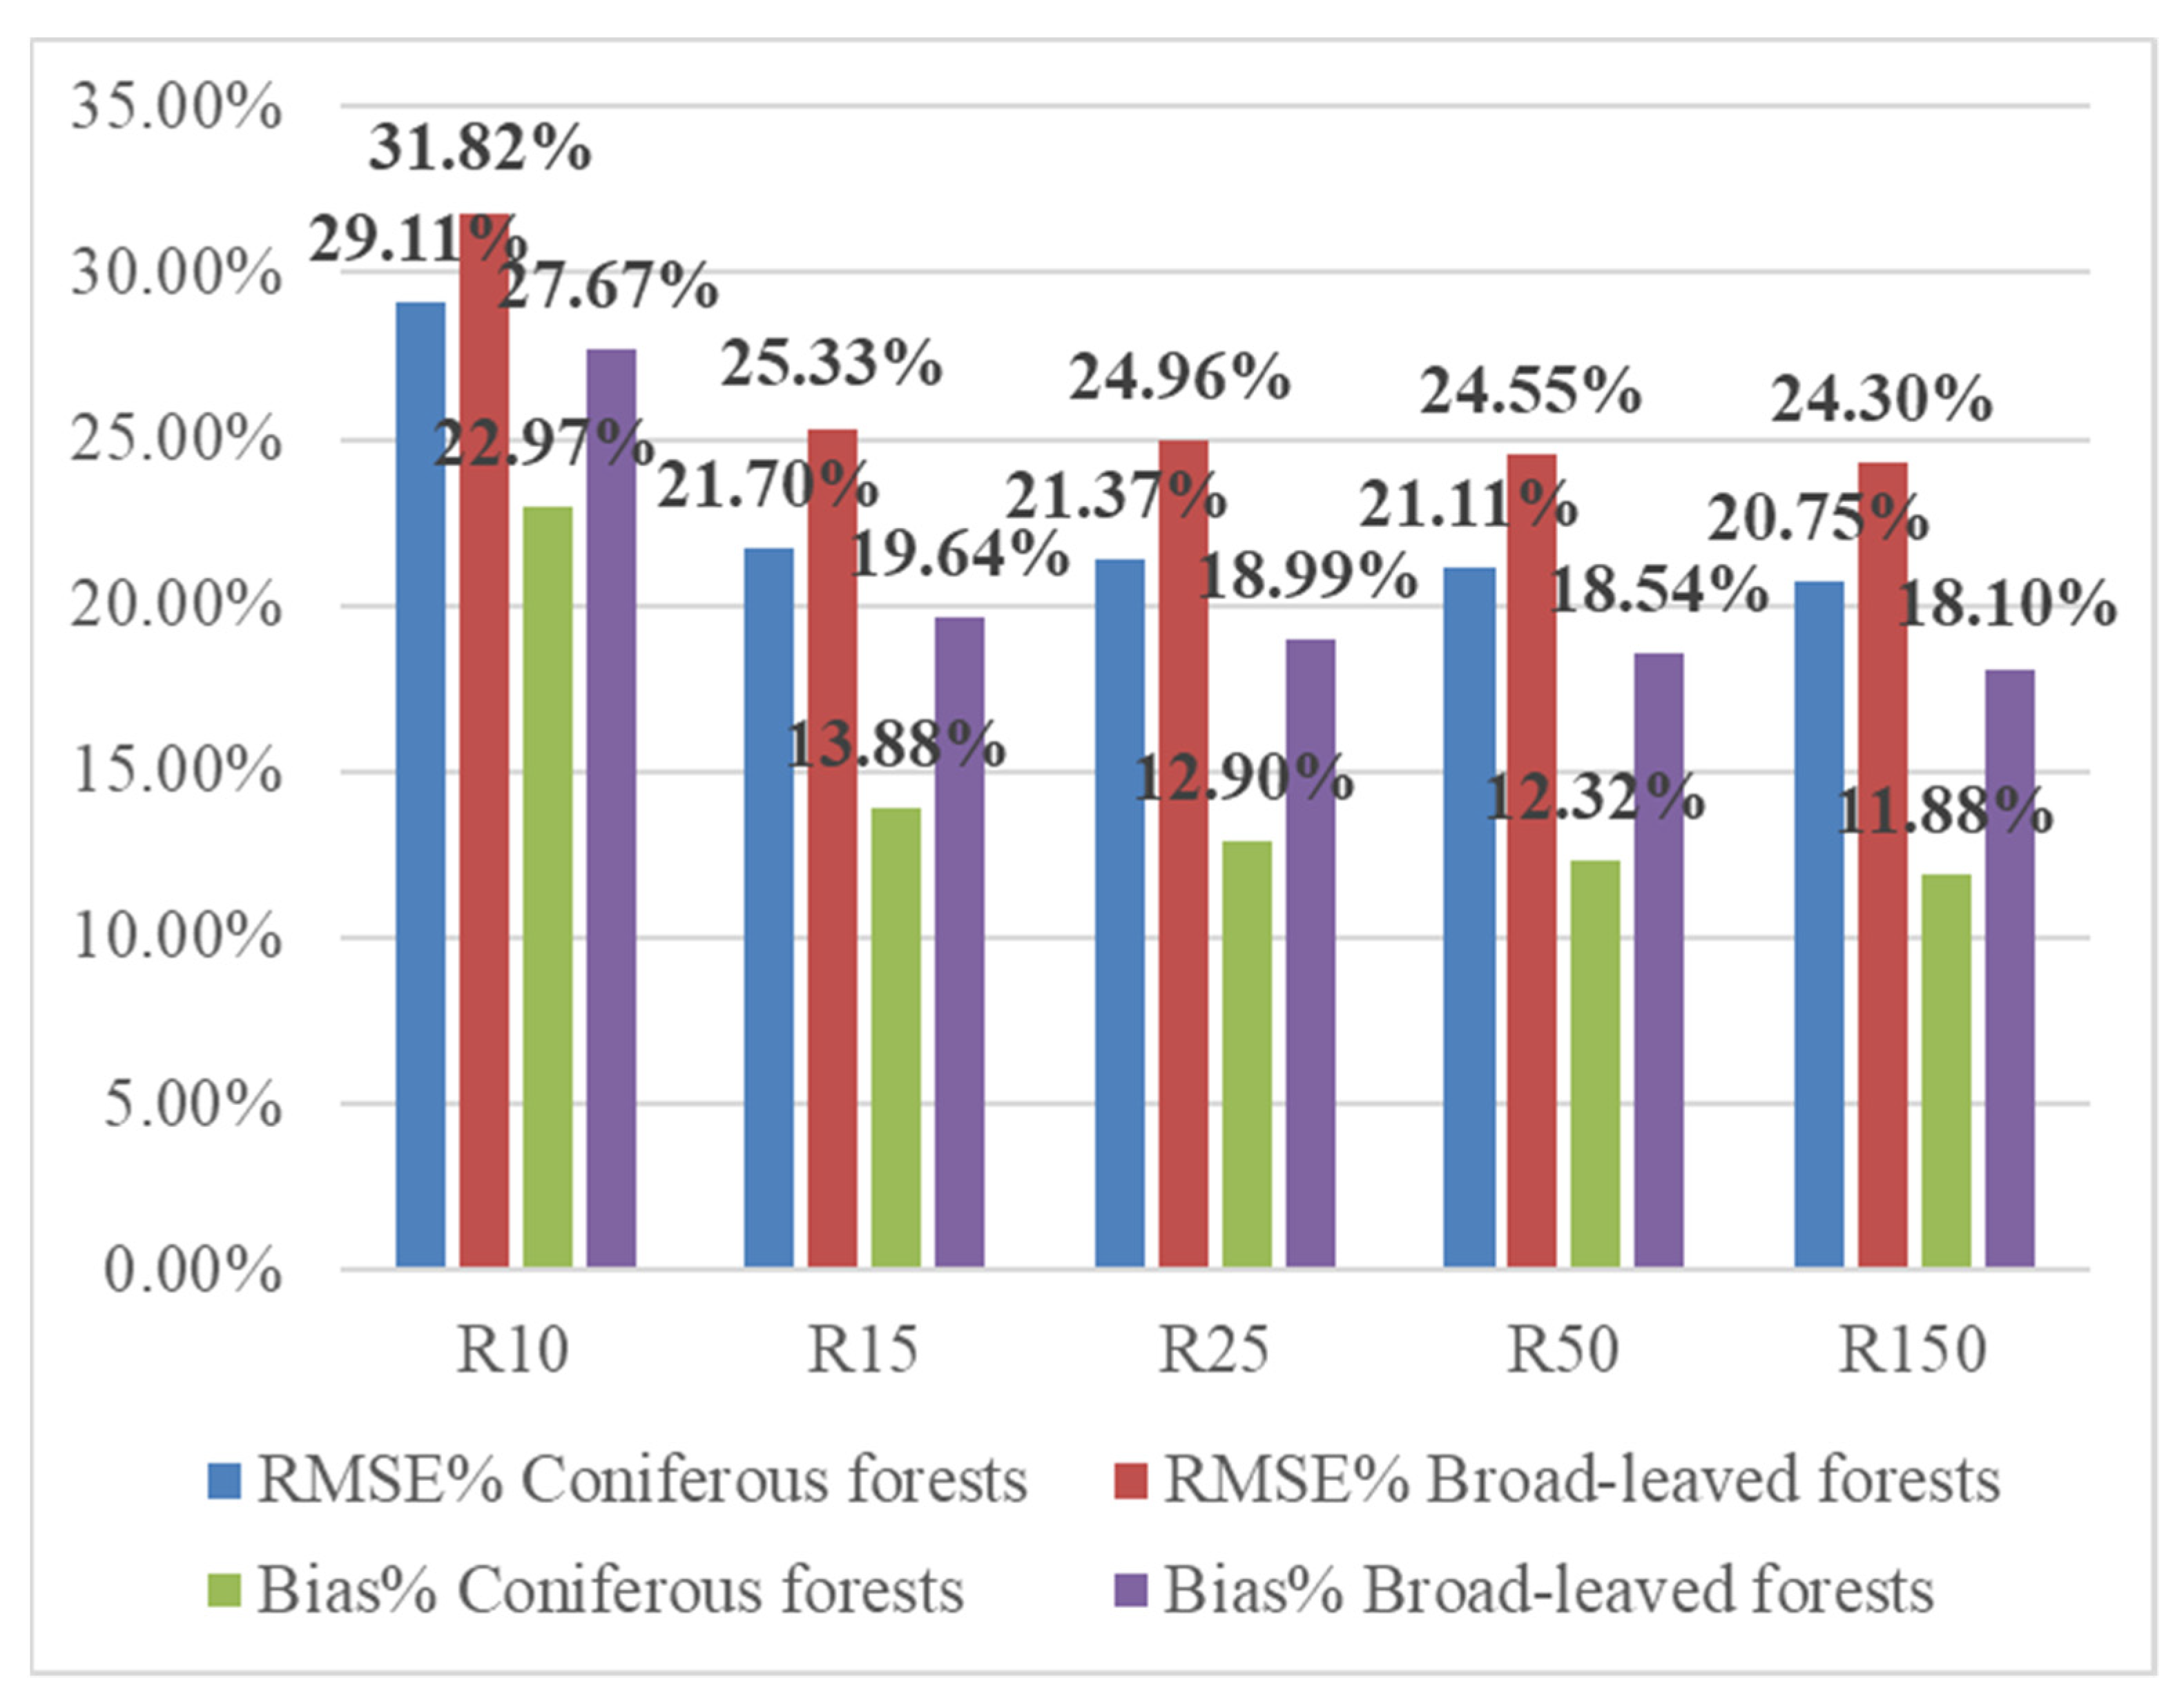
3.2. Accuracy of D. pierrei Height Obtained under Different Vegetation Types

A comparison of the accuracy of D. pierrei height extraction under different vegetation types (Figure 7), obtained using the five point cloud densities, showed that the accuracy of D. pierrei height varied among the different vegetation types, and the D. pierrei height difference was the largest under R15 (RMSE% = 3.63%). In summary, the accuracy of D. pierrei height acquisition was higher in coniferous forests. Irrespective of coniferous or broad-leaved forests, as the point cloud density increased, the accuracy of D. pierrei height extraction also gradually increased (Figure 7), and the difference in the accuracy of D. pierrei height between different stands also gradually increased (Figure 8). It is worth noting that after the point cloud density reached R15, the accuracy of the extracted D. pierrei height was not significantly different. By analyzing the D. pierrei height accuracy of R15, R25, R50, and F150 relative to R10 (Figure 9), we can see that with the increase in point cloud density, the accuracy of the D. pierrei height extracted from the coniferous forest increased further.

4. Discussion

There are always challenges in carrying out forest resource inventories in tropical forests due to the high cost of traditional field surveys. The rapidly developing UAV-LiDAR technology may be able to replace traditional forest resource inventory methods.

4.1. Point Cloud Density and D. pierrei Height Accuracy Extracted by UAV-LiDAR

Our results show that, compared with other studies [18,20,52], D. pierrei height extracted from UAV-LiDAR data in tropical forests had a lower accuracy, especially the height obtained under R10. The tree height extraction method could affect the accuracy to a certain extent. A study [17] has found that the RMSE% value of tree height obtained directly from point cloud data was about 3% lower than that obtained from a CHM. The tree height directly obtained from the point cloud data is the difference between the highest value and the lowest value of a single tree point cloud. In general, the highest value of a single tree point cloud is the tree height, while in this study, the local maximum method was adopted to take the maximum pixel value in the tree crown, which is the tree height [36]. This pixel value is the average of multiple point cloud data, which will cause the tree height obtained based on a CHM to be lower than that obtained based on the original point cloud to a certain extent [17]. In addition, it has been reported that the use of Gaussian wave filters affects all pixel values in the CHM grid, ultimately reducing the accuracy of the tree height estimation [53,54,55]. It should be kept in mind, however, that using Gaussian wave filters could prove useful at other stages of the work, e.g., tree segmentation and visual observation. Our results also confirm that the tree height obtained by Gaussian smoothing was lower than the actual tree height.
The quality of CHM data directly affected the height accuracy of the extracted trees. To a certain extent, the resolution of raster data affects the final tree height result [17]. A previous study [16] found that tree height accuracy extracted by a high-resolution CHM was higher than that extracted by a low-resolution CHM. Previous research [56] suggested using a high-resolution CHM (−10 cm) to extract tree height. Therefore, compared with other studies [16,17,18], the tree accuracy we obtained was comparatively low. Various studies [53,54,57] indicate that such pitfalls in the CHM may also lead to canopy height underestimation. CHMs consist of points generated by lasers reflected from different tree parts, i.e., laser beams penetrate the tree crowns and the first returns are often registered from beneath the forest canopy, which may result in a low tree height estimation by the CHM [32].
The raster value of the CHM was directly affected by the DSM and DEM. The canopy density in the study area was very high, and there were fewer point cloud data that finally penetrated the forest to reach the ground, which reduced the DEM accuracy. In addition, the complex ground environment might have caused the LiDAR to detect only the shrub layer on the ground, which was illustrated by the fact that D. pierrei heights extracted by LiDAR data were greatly underestimated in this study. Leckie et al. [19] reported that errors in the ALS-derived measurement of tree base elevation due to ground vegetation and terrain microrelief could easily introduce a variability in height measurements of up to 0.5 m. Studies have found [46,58,59] that increasing the point cloud density of LiDAR data improves the accuracy of DEMs and DSMs, and thus the accuracy of tree height extraction. Our results show that increasing the point cloud density can improve the accuracy of tree height extraction under any stand condition. By comparing the tree height accuracy obtained under R10 and F150, the DSM could also greatly influence the tree height extraction accuracy, which is consistent with other research results [60]. Various studies have also found that the detailed description of the crown affects the accuracy of tree height extraction [20,28] and at the same time leads to an underestimation of the tree height [20,56]. Therefore, the accuracy of tree height extraction could be improved by increasing the point cloud density.
Further analysis shows that after the point cloud density reached 17 points/m2, although the accuracy of tree height extraction increased slightly with the increase in point cloud density, the accuracy of tree height extraction was not significantly improved, which shows that the 17 points/m2 LiDAR data were able capture the information around the tree top. As a coniferous species, D. pierrei has a small tree top area. To accurately capture tree top information, it may be necessary to use a higher point cloud density than the LiDAR data in this study [28]. Our results also show that the low-density ALS data of about 10 points/m2 may not be suitable for extracting tree height in tropical forests.

4.2. Extraction Accuracy of D. pierrei Height under Different Vegetation Types

Regardless of the point cloud density used to extract tree height, the accuracy of the tree height obtained in the broad-leaved forest was lower than that in the coniferous forest. Generally speaking, as a result of the differences in stand conditions as compared with the coniferous forest, fewer point clouds reached the ground in the broad-leaved forest, so it is difficult to reproduce the true DEM using the interpolation method. In addition, the ground condition in the broad-leaved forest is complex, and the lowest point in the LiDAR data might fall above the real ground, which also increases the DEM error [19]. In this study, the bias% obtained in the broad-leaved forest was higher than that in the coniferous forest, which also shows this point. In the process of analyzing the results, we found that the error in D. pierrei tree height obtained in the broad-leaved forest was large. In addition, the D. pierrei trees in the broad-leaved forest were older, and the tree shapes were similar to those of broad-leaved trees. Various studies [17,34,61] have found that the RMSE of broad-leaved trees is higher than that of coniferous trees, which is consistent with the results of this study. In general, mushroom-shaped D. pierrei are difficult to measure with LiDAR due to the characteristics of the canopy, and irregular canopy traits can affect the accuracy of tree height measurements [62]. This situation can also be explained by problems arising from ground surveys, in which the shape of the canopy is often irregular and complex; thus, it is often difficult to determine a dominant top. In this study, the older D. pierrei crowns were complex and irregular, where even for a single tree growing alone (outside stands), it can be difficult to determine the location of the highest crown point, even when standing quite far from the tree. In addition, in our study, stand density and canopy coverage were very high, and the trees could be surrounded by other individuals of the same species, which made it difficult to correctly identify the highest point of the individuals being measured [63].
The analysis of the improvement in tree height accuracy of R15, R25, R50, and F150 relative to R10 indicated a lower improvement in the broad-leaved forest compared with the coniferous forest, which is consistent with our expectation. D. pierrei trees in the broad-leaved forest were older. According to their unique characteristics, it is known that the crowns of tall D. pierrei are mushroom-shaped, while the crowns of shorter D. pierrei are pagoda-shaped, similar to other coniferous species. The pagoda-shaped D. pierrei needed a higher density point cloud to detect the crown (Figure 10). With the decrease in point cloud density, the difference in tree height accuracy between the coniferous forest and the broad-leaved forest gradually decreased, which also indirectly illustrates this point. Therefore, in the coniferous forest, the tree height extraction of D. pierrei was more precise. And compared with the accuracy of the D. pierrei height from broad-leaved fores, with the increase in density, there was a greater improvement in the D. pierrei height extraction accuracy from the coniferous forest.
This study did not investigate other tree species in the study area, so it is not clear whether the results are applicable to other tree species. It would be valuable to include other broad-leaved tree species in our future research. In addition, as a result of the complex conditions in tropical forests, which can make it difficult for UAV applications, we did not choose to extract tree height directly from the point cloud data; whether our results are applicable to this method remains to be studied.

5. Conclusions

Our results show that the D. pierrei height surveyed in the field was underestimated when using UAV-LiDAR data in the Hainan tropical forest; however, this effect could be reduced by increasing the point cloud density. In addition, the accuracy of the tree height extracted from a coniferous forest was higher than that from broad-leaved forests. With the increase in point cloud density, the improvement of tree height extraction accuracy in coniferous forests was higher than that in broad-leaved forests. Our research shows that the point cloud density of 17 points/m2 is the critical point, and further increasing the point cloud density of UAV-LiDAR data did not significantly increase the extraction accuracy of D. pierrei data. The results of this study are helpful for setting UAV-LiDAR parameters during forest inventories in tropical forests.

Author Contributions

Conceptualization, Y.C. and Q.C.; data curation, Q.C., A.Z. and H.L.; formal analysis, X.P. and A.Z.; funding acquisition, Q.C.; investigation, Y.C., Q.C. and H.L.; methodology, X.P. and Q.C.; writing—original draft, X.P.; writing—review and editing, A.Z., Y.C. and Q.C. All authors have read and agreed to the published version of the manuscript.

Funding

This research was funded by the fundamental research funds for the Central Nonprofit Research Institution of the Chinese Academy of Forestry (CAF) (grant no. CAFBB2017ZB004).

Institutional Review Board Statement

Ethical review and approval were waived for this study, since the study did not involve humans or animals.

Informed Consent Statement

Not applicable.

Data Availability Statement

The data presented in this study are available on request from the corresponding author. The data are not publicly available due to the confidentiality of the data.

Acknowledgments

We thank Liyong Fu, Qiuwang Liu, Guangyu Zhu, Jiazheng Liu, Qingqing Yang, and Yihui Chen et al. for assisting in the field work. We thank the Diaoluoshan Natural Reserve and the Bawangling Natural Reserve of Hainan Island, China, for their support in the experiments.

Conflicts of Interest

The authors declare no conflict of interest.

References

  1. Millennium Ecosystem Assessment. Ecosystems and Human Well-Being: Synthesis; Island Press: Washington, DC, USA, 2005. [Google Scholar]
  2. UNEP; FAO. The State of the World’s Forests 2020. Forests, Biodiversity and People; FAO: Rome, Italy, 2020. [Google Scholar]
  3. Parker, C.; Mitchell, A.; Trivedi, M.; Mardas, N.; Parker, C.; Mitchell, A.; Trivedi, M.; Mardas, N. The Little REDD Book: A Guide to Governmental and Non-Governmental Proposals for Reducing Emissions from Deforestation and Degradation; Global Canopy Programme: Oxford, UK, 2008. [Google Scholar]
  4. Keppel, G.; Prentis, P.J.; Biffin, E.; Hodgskiss, P.D.; Tuisese, S.; Tuiwawa, M.; Lowe, A.J. Diversification history and hybridisation of Dacrydium (Podocarpaceae) in remote Oceania. Aust. J. Bot. 2011, 59, 262–273. [Google Scholar] [CrossRef] [Green Version]
  5. Su, Y.J.; Wang, T.; Deng, F. Population genetic variation, differentiation and bottlenecks of Dacrydium pectinatum (Podocarpaceae) in Hainan Island, China: Implications for its conservation. Aust. J. Bot. 2010, 58, 318–326. [Google Scholar] [CrossRef]
  6. Liu, H.; Chen, Q.; Liu, X.; Xu, Z.; Dai, Y.; Liu, Y.; Chen, Y. Variation patterns of plant composition/diversity in Dacrydium pectinatum communities and their driving factors in a biodiversity hotspot on Hainan Island, China. Glob. Ecol. Conserv. 2020, 22, e01034. [Google Scholar] [CrossRef]
  7. Liu, H.; Chen, Q.; Xu, Z.; Liu, Y.; Jiang, Y.; Chen, Y. Effects of topographical factors on species diversity across Dacrydium pectinatum natural community in Hainan Island. Chin. J. Ecol. 2020, 39, 394–403. (In Chinese) [Google Scholar]
  8. Andersen, H.; Reutebuch, S.E.; Mcgaughey, R.J. A rigorous assessment of tree height measurements obtained using airborne LiDAR and conventional field methods. Can. J. Remote Sens. 2006, 32, 355–366. [Google Scholar] [CrossRef]
  9. Balenovic, I.; Seletkovic, A.; Pernar, R.; Jazbec, A. Estimation of the mean tree height of forest stands by photogrammetric measurement using digital aerial images of high spatial resolution. Ann. For. Res. 2015, 58, 125–143. [Google Scholar] [CrossRef] [Green Version]
  10. Lutz, J.A.; Furniss, T.J.; Johnson, D.J.; Davies, S.J.; Allen, D.; Alonso, A.; Anderson-Teixeira, K.J.; Andrade, A.; Baltzer, J.; Becker, K.M.L.; et al. Global importance of large-diameter trees. Glob. Ecol. Biogeogr. 2018, 27, 849–864. [Google Scholar] [CrossRef] [Green Version]
  11. Tompalski, P.; Coops, N.C.; White, J.C.; Wulder, M.A. Simulating the impacts of error in species and height upon tree volume derived from airborne laser scanning data. For. Ecol. Manag. 2014, 327, 167–177. [Google Scholar] [CrossRef]
  12. Ali, A.; Lin, S.; He, J.; Kong, F.; Yu, J.; Jiang, H. Big-sized trees overrule remaining trees’ attributes and species richness as determinants of aboveground biomass in tropical forests. Glob. Chang. Biol. 2019, 25, 2810–2824. [Google Scholar] [CrossRef] [PubMed]
  13. Feldpausch, T.R.; Lloyd, J.; Lewis, S.L.; Brienen, R.J.; Gloor, M.; Mendoza, A.M.; Lopez-Gonzalez, G.; Banin, L.; Salim, K.A.; Affum-Baffoe, K.; et al. Tree height integrated into pantropical forest biomass estimates. Biogeosciences 2012, 9, 3381–3403. [Google Scholar] [CrossRef] [Green Version]
  14. Kearsley, E.; De Haulleville, T.; Hufkens, K.; Kidimbu, A.; Toirambe, B.; Baert, G.; Baert, G.; Huygens, D.; Kebede, Y.; Defourny, P.; et al. Conventional tree height–diameter relationships significantly overestimate aboveground carbon stocks in the Central Congo Basin. Nat. Commun. 2013, 4, 2269. [Google Scholar] [CrossRef] [Green Version]
  15. Rennie, J.C. Comparison of Height-Measurement Techniques in a Dense Loblolly Pine Plantation. South. J. Appl. For. 1979, 3, 146–148. [Google Scholar] [CrossRef]
  16. Vaglio, L.G.; Ding, J.; Disney, M.; Bartholomeus, H.; Herold, M.; Papale, D.; Valentini, R. Tree height in tropical forest as measured by different ground, proximal, and remote sensing instruments, and impacts on above ground biomass estimates. Int. J. Appl. Earth Obs. Geoinf. 2019, 82, 101899. [Google Scholar] [CrossRef]
  17. Mielcarek, M.; Stereńczak, K.; Khosravipour, A. Testing and evaluating different LiDAR-derived canopy height model generation methods for tree height estimation. Int. J. Appl. Earth Obs. Geoinf. 2018, 71, 132–143. [Google Scholar] [CrossRef]
  18. Sibona, E.; Vitali, A.; Meloni, F.; Caffo, L.; Dotta, A.; Lingua, E.; Motta, R.; Garbarino, M. Direct Measurement of Tree Height Provides Different Results on the Assessment of LiDAR Accuracy. Forests 2016, 8, 7. [Google Scholar] [CrossRef]
  19. Leckie, D.; Gougeon, F.; Hill, D.; Quinn, R.; Armstrong, L.; Shreenan, R. Combined high-density LiDAR and multispectral imagery for individual tree crown analysis. Can. J. Remote Sens. 2003, 29, 633–649. [Google Scholar] [CrossRef]
  20. Wang, Y.; Lehtomäki, M.; Liang, X.; Pyörälä, J.; Kukko, A.; Jaakkola, A.; Liu, J.; Feng, Z.; Chen, R.; Hyyppä, J. Is field-measured tree height as reliable as believed—A comparison study of tree height estimates from field measurement, airborne laser scanning and terrestrial laser scanning in a boreal forest. ISPRS J. Photogramm. Remote Sens. 2019, 147, 132–145. [Google Scholar] [CrossRef]
  21. Wilkes, P.; Lau, A.; Disney, M.; Calders, K.; Burt, A.; de Tanago, J.G.; Bartholomeus, H.; Brede, B.; Herold, M. Data acquisition considerations for terrestrial laser scanning of forest plots. Remote Sens. Environ. 2017, 196, 140–153. [Google Scholar] [CrossRef]
  22. Saarinen, N.; Kankare, V.; Vastaranta, M.; Luoma, V.; Pyörälä, J.; Tanhuanpää, T.; Liang, X.; Kaartinen, H.; Kukko, A.; Jaakkola, A.; et al. Feasibility of Terrestrial laser scanning for collecting stem volume information from single trees. ISPRS J. Photogramm. Remote Sens. 2017, 123, 140–158. [Google Scholar] [CrossRef]
  23. Calders, K.; Newnham, G.; Burt, A.; Murphy, S.; Raumonen, P.; Herold, M.; Culvenor, D.; Avitabile, V.; Disney, M.; Armston, J.; et al. Nondestructive estimates of above-ground biomass using terrestrial laser scanning. Methods Ecol. Evol. 2015, 6, 198–208. [Google Scholar] [CrossRef]
  24. Stovall, A.E.L.; Vorster, A.G.; Anderson, R.S.; Evangelista, P.H.; Shugart, H.H. Non-destructive aboveground biomass estimation of coniferous trees using terrestrial LiDAR. Remote Sens. Environ. 2017, 200, 31–42. [Google Scholar] [CrossRef]
  25. Liang, X.; Kankare, V.; Hyyppä, J.; Wang, Y.; Kukko, A.; Haggrén, H.; Yu, X.; Kaartinen, H.; Jaakkola, A.; Guan, F.; et al. Terrestrial laser scanning in forest inventories. ISPRS J. Photogramm. Remote Sens. 2016, 115, 63–77. [Google Scholar] [CrossRef]
  26. Liang, X.; Hyyppä, J.; Kaartinen, H.; Lehtomäki, M.; Pyörälä, J.; Pfeifer, N.; Holopainen, M.; Brolly, G.; Francesco, P.; Hackenberg, J.; et al. International benchmarking of terrestrial laser scanning approaches for forest inventories. ISPRS J. Photogramm. Remote Sens. 2018, 144, 137–179. [Google Scholar] [CrossRef]
  27. Moe, K.T.; Owari, T.; Furuya, N.; Hiroshima, T. Comparing Individual Tree Height Information Derived from Field Surveys, LiDAR and UAV-DAP for High-Value Timber Species in Northern Japan. Forests 2020, 11, 223. [Google Scholar] [CrossRef] [Green Version]
  28. Ganz, S.; Kaber, Y.; Adler, P. Measuring Tree Height with Remote Sensing—A Comparison of Photogrammetric and LiDAR Data with Different Field Measurements. Forests 2019, 10, 694. [Google Scholar] [CrossRef] [Green Version]
  29. Fu, L.; Duan, G.; Ye, Q.; Meng, X.; Luo, P.; Sharma, R.P.; Sun, H.; Wang, G.; Liu, Q. Prediction of Individual Tree Diameter Using a Nonlinear Mixed-Effects Modeling Approach and Airborne LiDAR Data. Remote Sens. 2020, 12, 1066. [Google Scholar] [CrossRef] [Green Version]
  30. Wang, Y.; Weinacker, H.; Koch, B.; Sterenczak, K. LiDAR point cloud based fully automatic 3D single tree modelling in forest and evaluations of the procedure. Int. Arch. Photogramm. Remote Sens. Spat. Inf. Sci. 2008, 37, 45–51. [Google Scholar]
  31. Zhang, C.; Zhou, Y.; Qiu, F. Individual tree segmentation from LiDAR Point clouds for urban forest inventory. Remote Sens. 2015, 7, 7892–7913. [Google Scholar] [CrossRef] [Green Version]
  32. Persson, A.; Holmgren, J.; Söderman, U. Detecting and measuring individual trees using an airborne LiDAR. Photogramm. Eng. Remote Sens. 2002, 68, 925–932. [Google Scholar]
  33. Brandtberg, T.; Warner, T.A.; Landenberger, R.E.; McGraw, J.B. Detection and analysis of individual leaf-off tree crowns in small footprint, high sampling density LiDAR data from the eastern deciduous forest in North America. Remote Sens. Environ. 2003, 85, 290–303. [Google Scholar] [CrossRef]
  34. Kwak, D.A.; Lee, W.K.; Lee, J.H.; Biging, G.S.; Gong, P. Detection of individual trees and estimation of tree height using LiDAR data. J. For. Res. 2007, 12, 425–434. [Google Scholar] [CrossRef]
  35. Maltamo, M.; Eerikäinen, K.; Pitkänen, J.; Hyyppä, J.; Vehmas, M. Estimation of timber volume and stem density based on scanning laser altimetry and expected tree size distribution functions. Remote Sens. Environ. 2004, 90, 319–330. [Google Scholar] [CrossRef]
  36. Koch, B.; Heyder, U.; Weinacker, H. Detection of individual tree crowns in airborne LiDAR data. Photogramm. Eng. Remote Sens. 2006, 72, 357–363. [Google Scholar] [CrossRef] [Green Version]
  37. Yao, W.; Krzystek, P.; Heurich, M. Tree species classification and estimation of stem volume and DBH based on single tree extraction by exploiting airborne full-waveform LiDAR data. Remote Sens. Environ. 2012, 123, 368–380. [Google Scholar] [CrossRef]
  38. Stereńczak, K. Factors influencing individual tree crowns detection based on airborne laser scanning data. For. Res. Pap. 2013, 74, 323–333. [Google Scholar] [CrossRef] [Green Version]
  39. Hu, B.; Li, J.; Jing, L.; Judah, A. Improving the efficiency and accuracy of individual tree crown delineation from high-density LiDAR data. Int. J. Appl. Earth Obs. Geoinf. 2014, 26, 145–155. [Google Scholar] [CrossRef]
  40. Keränen, J.; Maltamo, M.; Packalen, P. Effect of flying altitude, scanning angle and scanning mode on the accuracy of ALS based forest inventory. Int. J. Appl. Earth Obs. Geoinf. 2016, 52, 349–360. [Google Scholar] [CrossRef]
  41. Næsset, E. Effects of different sensors, flying altitudes, and pulse repetition frequencies on forest canopy metrics and biophysical stand properties derived from small-footprint airborne laser data. Remote Sens. Environ. 2009, 113, 148–159. [Google Scholar] [CrossRef]
  42. Jakubowski, M.K.; Guo, Q.; Kelly, M. Tradeoffs between LiDAR pulse density and forest measurement accuracy. Remote Sens. Environ. 2013, 130, 245–253. [Google Scholar] [CrossRef]
  43. Ørka, H.O.; Hauglin, M. Use of remote sensing for mapping of non-native conifer species. Ina Fagrapp. 2016, 33. Available online: https://nmbu.brage.unit.no/nmbu-xmlui/handle/11250/2647672 (accessed on 2 January 2021).
  44. Fassnacht, F.E.; Latifi, H.; Stereńczak, K.; Modzelewska, A.; Lefsky, M.; Waser, L.T.; Straub, C.; Ghosh, A. Review of studies on tree species classification from remotely sensed data. Remote Sens. Environ. 2016, 186, 64–87. [Google Scholar] [CrossRef]
  45. Zhao, X.; Guo, Q.; Su, Y.; Xue, B. Improved progressive TIN densification filtering algorithm for airborne LiDAR data in forested areas. ISPRS J. Photogramm. Remote Sens. 2016, 117, 79–91. [Google Scholar] [CrossRef] [Green Version]
  46. Magnusson, M.; Fransson, J.E.S.; Holmgren, J. Effects on Estimation Accuracy of Forest Variables Using Different Pulse Density of Laser Data. For. Sci. 2007, 53, 619–626. [Google Scholar]
  47. Gobakken, T.; Næsset, E. Assessing effects of laser point density, ground sampling intensity, and field sample plot size on biophysical stand properties derived from airborne laser scanner data. Can. J. For. Res. 2008, 38, 1095–1109. [Google Scholar] [CrossRef]
  48. St-Onge, B.; Treitz, P.; Wulder, M.A. Tree and Canopy Height Estimation with Scanning LiDAR. In Remote Sensing of Forest Environments; Springer: Boston, MA, USA, 2003; pp. 489–509. [Google Scholar]
  49. Holmgren, J. Prediction of tree height, basal area and stem volume in forest stands using airborne laser scanning. Scand. J. For. Res. 2004, 19, 543–553. [Google Scholar] [CrossRef]
  50. Maltamo, M. Estimation of stem volume using laser scanning-based canopy height metrics. Forestry 2006, 79, 217–229. [Google Scholar] [CrossRef] [Green Version]
  51. Chen, Q.; Baldocchi, D.D.; Gong, P.; Kelly, M. Isolating individual trees in a Savanna woodland using small footprint LiDAR data. Photogramm. Eng. Remote Sens. 2016, 72, 923–932. [Google Scholar] [CrossRef] [Green Version]
  52. Panagiotidis, D.; Abdollahnejad, A.; Surový, P.; Chiteculo, V. Determining tree height and crown diameter from high-resolution UAV imagery. Int. J. Remote Sens. 2016, 38, 2392–2410. [Google Scholar] [CrossRef]
  53. Ben-Arie, J.R.; Hay, G.; Powers, R.; Castilla, G.; St-Onge, B. Development of a pit filling algorithm for LiDAR canopy height models. Comput. Geosci. 2009, 35, 1940–1949. [Google Scholar] [CrossRef]
  54. Khosravipour, A.; Skidmore, A.K.; Isenburg, M.; Wang, T.; Hussin, Y.A. Development of an algorithm to generate a LiDAR pit—Free canopy height model. In Proceedings of the Silvilaser 2013: 13th International Conference on LiDAR Applications for Assessing Forest Ecosystems, Beijing, China, 9–11 October 2013; pp. 125–128. [Google Scholar]
  55. Chen, C.; Wang, Y.; Li, Y.; Yue, T.; Wang, X. Robust and parameter-Free algorithm for constructing pit-Free canopy height models. ISPRS Int. J. Geo-Inf. 2017, 6, 219. [Google Scholar] [CrossRef] [Green Version]
  56. Wulder, M.A.; Niemann, K.O.; Goodenough, D.G. Local maximum filtering for the extraction of tree locations and basal area from high spatial resolution imagery. Remote Sens. Environ. 2000, 73, 103–114. [Google Scholar] [CrossRef]
  57. Gaveau, D.L.A.; Hill, R.A. Quantifying canopy height underestimation by laser pulse penetration in small-footprint airborne laser scanning data. Can. J. Remote Sens. 2003, 29, 650–657. [Google Scholar] [CrossRef]
  58. Hansen, E.; Gobakken, T.; Næsset, E. Effects of Pulse Density on Digital Terrain Models and Canopy Metrics Using Airborne Laser Scanning in a Tropical Rainforest. Remote Sens. 2015, 7, 8453–8468. [Google Scholar] [CrossRef] [Green Version]
  59. Watt, M.S.; Adams, T.; Gonzalez, A.S.; Marshall, H.; Watt, P. The influence of LiDAR pulse density and plot size on the accuracy of New Zealand plantation stand volume equations. N. Z. J. For. Sci. 2013, 43, 15. [Google Scholar] [CrossRef] [Green Version]
  60. Leitold, V.; Keller, M.; Morton, D.C.; Cook, B.D.; Shimabukuro, Y.E. Airborne LiDAR-based estimates of tropical forest structure in complex terrain: Opportunities and trade-offs for REDD+. Carbon Balance Manag. 2015, 10, 3. [Google Scholar] [CrossRef] [PubMed]
  61. Heurich, M.; Persson, A.A.; Holmgren, J.; Kennel, E. Detecting and measuring individual trees with laser scanning in mixed mountain forest of central Europe using an algorithm developed for Swedish boreal forest conditions. Int. Arch. Photogramm. Remote Sens. Spat. Inf. Sci. 2004, 36, 307–312. [Google Scholar]
  62. Maltamo, M.; Mustonen, K.; Hyyppä, J.; Pitkänen, J.; Yu, X. The accuracy of estimating individual tree variables with airborne laser scanning in a boreal nature reserve. Can. J. For. Res. 2011, 34, 1791–1801. [Google Scholar] [CrossRef]
  63. Lim, K.; Treitz, P.; Groot, A.; St-Onge, B. Estimation of individual tree heights using LiDAR remote sensing. In Proceedings of the Twenty-Third Annual Canadian Symposium on Remote Sensing, Quebec, QC, Canada, 20–24 August 2001. [Google Scholar]
Figure 1. Distribution of the study sites in Hainan Province.
Forests 12 00328 g001
Figure 2. Two-dimensional point cloud images of single trees with different point cloud densities.
Forests 12 00328 g002
Figure 3. Tree height extraction flow chart.
Forests 12 00328 g003
Figure 4. Regression analysis comparing the height of D. pierrei obtained using different point cloud densities and the height of D. pierrei obtained from the ground survey.
Forests 12 00328 g004
Figure 5. Box diagram of D. pierrei height obtained in different ways.
Forests 12 00328 g005
Figure 6. Correlation between the error (difference between the height of D. pierrei measured in the field survey and the height of D. pierrei obtained from different point cloud densities) and the height of D. pierrei measured in the field survey.
Forests 12 00328 g006
Figure 7. The accuracy (root mean square error (RMSE)%, bias%) of D. pierrei height obtained under different point cloud densities and different vegetation types.
Forests 12 00328 g007
Figure 8. Difference in the accuracy of D. pierrei height among different stands.
Forests 12 00328 g008
Figure 9. Difference in the accuracy (RMSE, bias) of D. pierrei height obtained under R10 and the four other point cloud densities (R15, R25, R50, F150).
Forests 12 00328 g009
Figure 10. Photos of D. pierrei. (a) mushroom-shaped D. pierrei. (b) pagoda-shaped D. pierrei.
Forests 12 00328 g010
Table 1. Summary statistics of Dacrydium pierrei (D. pierrei).
Vegetation TypesDBH (cm)Tree Height (m)Number of Sample Plots
MeanStdMeanStd
Coniferous forest23.172.6712.662.385
Broad-leaved forest24.285.1215.213.277
Table 2. Light detection and ranging (LiDAR) data density parameters of different point cloud densities.
Abbr.R10R15R25R50F150
Flight altitude (m)150150150150150
Percentage (%)101525%50100
Point cloud density (points/m2)12172864108
Table 3. Extraction accuracy of D. pierrei height under different point cloud densities.
R10R15R25R50F150
RMSE4.223.273.223.183.13
RMSE%30.69%23.77%23.42%23.08%22.78%
Bias3.472.292.182.102.05
Bias%25.22%16.64%15.81%15.29%14.86%
R20.630.670.650.640.65
Publisher’s Note: MDPI stays neutral with regard to jurisdictional claims in published maps and institutional affiliations.

