Article

Morphology and Physicochemical Properties of Alluvial Soils in Riparian Forests after River Regulation

Institute of Soil Science and Environmental Protection, Wroclaw University of Environmental and Life Sciences, ul. Grunwaldzka 53, 50-357 Wrocław, Poland
*
Author to whom correspondence should be addressed.
Forests 2021, 12(3), 329; https://doi.org/10.3390/f12030329
Submission received: 5 February 2021 / Revised: 7 March 2021 / Accepted: 9 March 2021 / Published: 11 March 2021

Abstract

:
The elimination of flooding and lowering of the groundwater table after large-scale river regulation allow deep penetration of soils by plant roots, soil fauna, and microorganisms, thus creating favorable conditions for advanced pedogenesis. Although the changes of the morphology and properties of agriculturally used drained alluvial soils in Central Europe have been well characterized, studies in riparian forests remain insufficient. An analysis of 21 profiles of forest soils located on the Holocene river terrace (a floodplain before river regulation and embankment) in SW Poland confirmed a noticeable pedogenic transformation of soil morphology and properties resulting from river regulation. Gleyic properties were in most profiles replaced with stagnic properties, testifying to a transition from dominant groundwater supply to precipitation-water supply. The development of a diagnostic mollic and cambic horizons, correlated with the shift in soil classification from Fluvisols to Phaeozems, and in the majority, to Cambisols, demonstrated a substantial change in habitat conditions. The transformation of alluvial soils may result in an inevitable modification of forest management in the river valley, including quantitative alteration in species composition of primarily riparian forests.

1. Introduction

The long-term and seasonal dynamics of fluvial processes, the specific microclimate, and the hydrological connectivity with all abiotic and biotic elements of the environment determine the specific diversity and dynamics of river valley habitats [1,2]. The diversity of habitats corresponds to plant communities’ functional systems, which reflect the zonation of the valley hydrogeochemical conditions, additionally being subject to succession processes enhanced by human activity [3,4,5]. One of the most important factors in the variability of valley and/or floodplain ecosystems are soils composed of spatially and vertically differentiated alluvial sediments [6,7,8]. Sedimentation conditions can significantly change over time; therefore, stratification is a basic feature of valley/floodplain soils, affecting their physicochemical and water properties, as well as the productivity of alluvial soils [9,10,11,12]. Moreover, the sequences of sediment layers and soil horizons in the soil profiles on floodplain terraces demonstrate the successions of stable periods with distinct pedogenesis and unstable (i.e., geomorphologically active) periods, in which fresh alluvial layers were accumulated [6,13].
The groundwater level on terraces remains in a dynamic equilibrium with the river water table. Hence, the average river water table level determines the overall moisture content throughout the valley [14,15,16]. Despite the spatial differences, soils of river terraces typically feature a higher groundwater table compared to adjacent soils at higher relief positions outside the river valley [17,18]. Periodic flooding is also important for the functioning of valley ecosystems, directly affecting the moisture content of the surface layers of soils, as a result of which, soils in naturally functioning valleys retain a relatively high moisture content (in both topsoil and subsoil horizons), even in dry periods [19]. Furthermore, floods increase the nutrient content in soils, resulting in a specific floristic composition, as well as increased potential agricultural suitability [20,21,22]. Originally, vast areas of alluvial soils on the flooding terraces were covered with riparian forests [23,24], currently being among one of the most severely threatened forest communities in Europe [25,26]. In Poland, relatively large areas of these forests are still evidenced in lowland soil valleys, but the effects of river regulation and valley drainage have been observed even there [27,28].
Initiated by the channeling of the river in the 19th century and the construction of anti-flooding embankments at the beginning of the 20th century, the large-scale regulation of the Odra Valley initiated environmental and economic changes, particularly in the riparian forests where those considerable parts were separated from the river. Moreover, the launch of the hydroelectric power station in Brzeg Dolny (in 1958) led to the Odra riverbed level being lowered, resulting in the groundwater table lowering in the soils below the weir [29]. The elimination of floods and lowering of the groundwater table allow deeper penetration of the soil by plant roots, soil fauna, and microorganisms, and these changes also create more favorable conditions for the agricultural use of soils [30,31,32]. The transformation of the morphology and properties of agriculturally used alluvial soils in Poland and Central Europe has already been extensively characterized [7,10,12,13,33,34,35], whereas the studies in the forest areas have primarily focused on the phytosociological transformation of plant communities and changes in tree stand productivity, with the transformation of soils remaining insufficiently documented. Meanwhile, the proper recognition of the phenomena occurring in all components of the forest habitat is the basis for a wise, environmentally-oriented planning of the sustainable, long-term forest management.
This study aimed to analyze the directions and intensity of the transformation of morphological features and physicochemical properties in the profiles of alluvial forest soils under the permanently lowered groundwater table and eliminated flooding in a regulated river valley, in the conditions of the temperate climate of SW Poland.

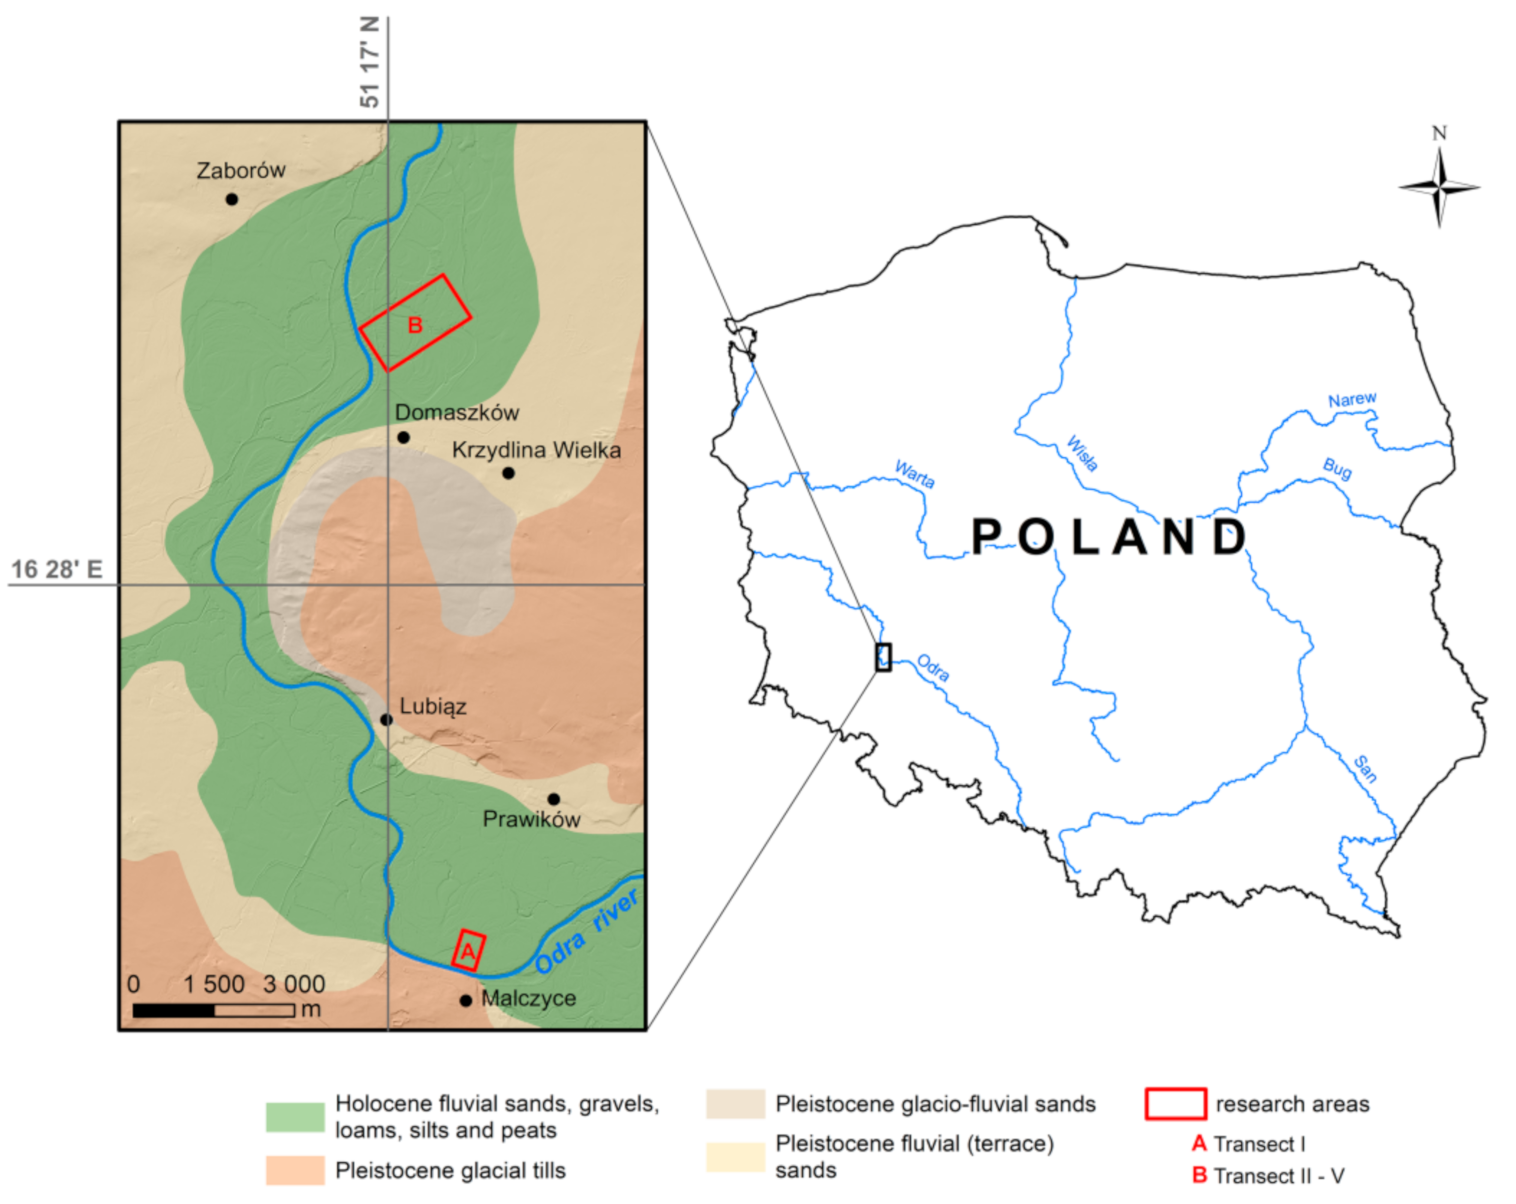
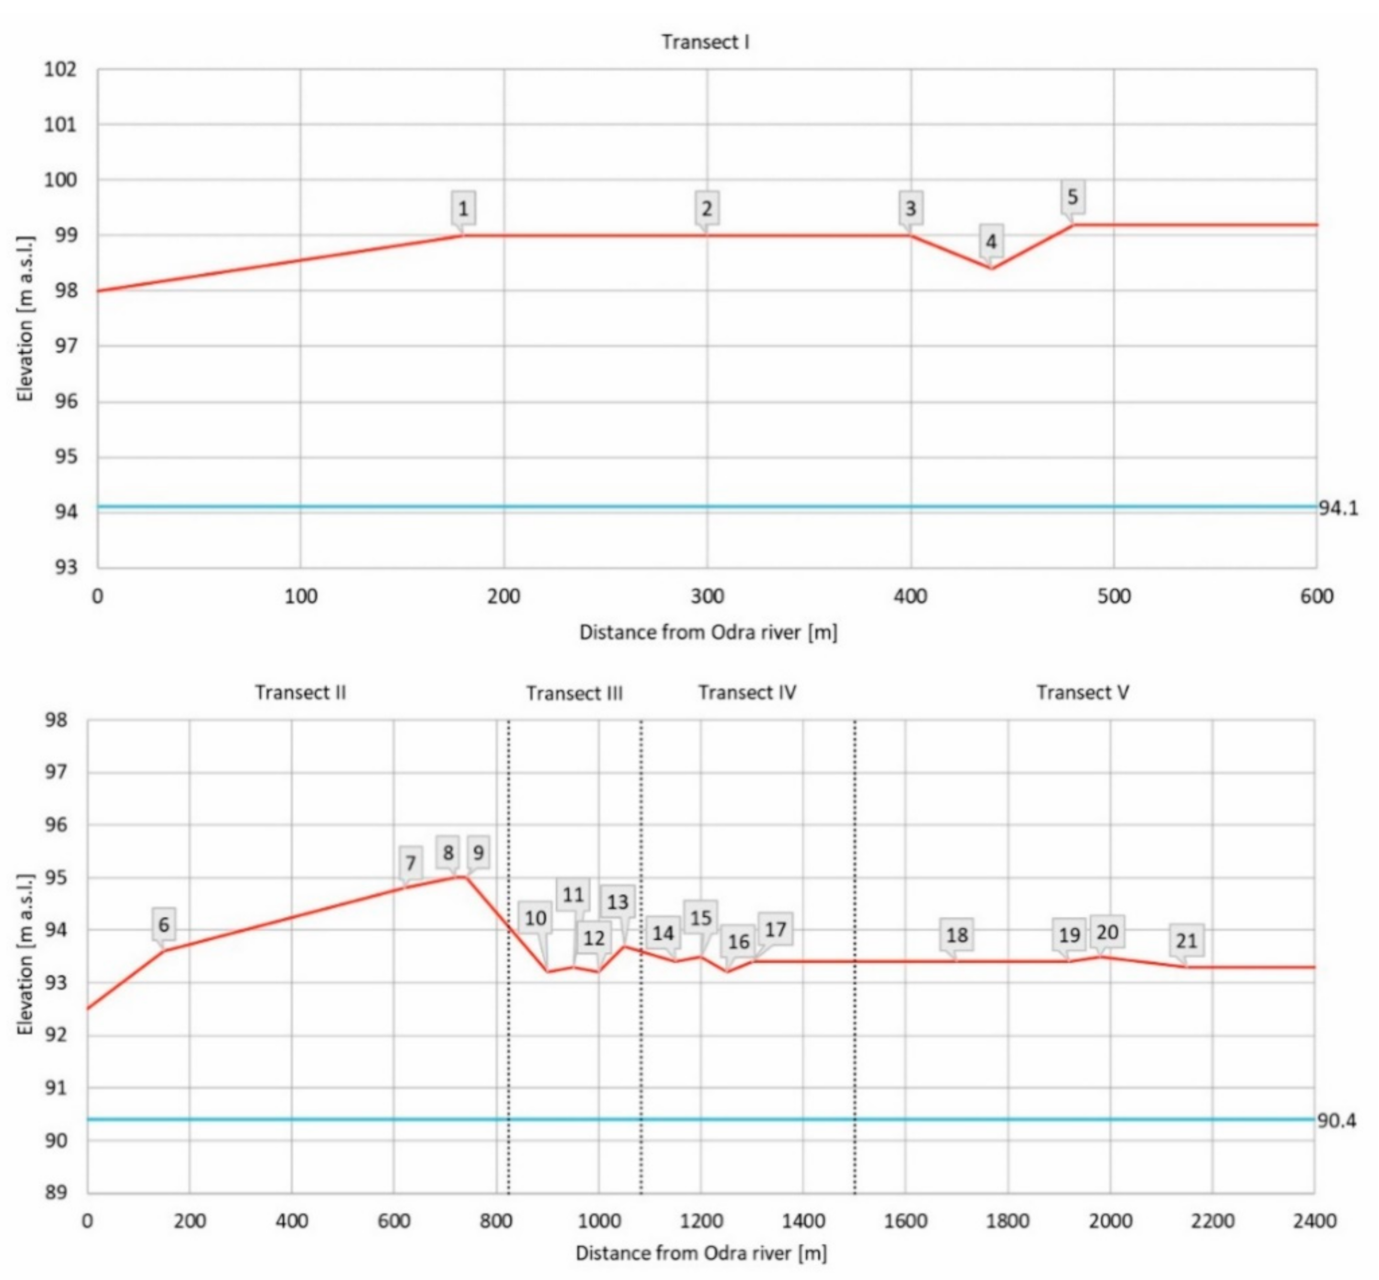
2. Materials and Methods

The work was conducted in the Odra Valley, SW Poland, in the Wołów forest district (Figure 1). The landscape was generally shaped during the Warta glaciation (Riss 2, Saale-Warthe), and the formation of the wide river valley was connected with the flow of water masses from the melting glacier. Tills of the bottom moraine, commonly covered with glacio-fluvial sands, often eolized, prevail in the surroundings of the valley. The Pleistocene river terraces, formed during the Wisła glaciation (Würm, Weichselian), consist almost exclusively of sands and gravels, whereas the Holocene terraces often contain interbeddings of fine-grained sediments (loams, clays, and silts). The superficial layer of the floodplain terrace is typically comprised of loam or silt, 30–90 cm thick, locally up to 3.5 m thick. The area’s climate may be characterized as temperate humid. The mean annual air temperature is ca. 9 °C, with the coldest January (−0.4 °C) and the warmest July (18.8 °C). The mean annual precipitation varies between 550 and 600 mm, with the highest monthly sum in July [36]. As a result of riverbed regulation and construction of levees, and in particular, due to the construction of weirs in Brzeg Dolny and Malczyce, a decrease in groundwater level is documented. Studies conducted in the period 1970–1990 showed a groundwater level decrease of 44 cm (compared to the previous state) at a distance of 550 m from the Odra River and of 65 cm at a distance of 120 m. As a result, the ground-water level is recorded beyond the conventional lower limit of the soil profiles for a considerable part of the year [29].
Soil pits (21 in total) were located in 5 transects on the lower floodplain terrace under three dominant forest communities [24]: (a) Riparian forest Ficario-Ulmetum minoris (8 profiles), (b) similar to (a), but transformed due to a moisture/flooding deficit (5 profiles), and (c) transformed broadleaf forest Galio sylvatici-Carpinetum betuli (8 profiles). The research results on the vegetation state in the area under study have been presented in previous reports [4,28,37]. The situation of the soil pits in the river terrace, including the distance to the river channel and the elevation above the mean river water level are schematically presented in Figure 2.
The pits were dug between July and September; thus, groundwater was not recorded in any pits to a depth of 150 cm. Soil morphology was described following FAO Guidelines [38]. In particular, attention was paid to the type, form, and intensity of redoximorphic features (mottling and concentrations), as well as the soil structure and color in the topsoil and subsoil horizons. Soils were classified according to the WRB classification [39] and Polish Soil Classification [40]. Due to inconsistencies between [38,39] for mottling degree for stagnic and gleyic properties, the new and extended limits consistent with [39] were applied in this study (Table S1). Soil color (in a moist state) was determined using the Munsell Color Charts (Table S2).
Bulk soil samples were collected from all distinguished horizons and sediment layers. The following properties, after sample drying, crushing, and sieving, were determined in the fine earths (<2 mm): Particle-size distribution using sieves (for sand) and a hydrometer (for silt and clay fraction); soil pH in distilled water and 1 M KCl, potentiometrically, at a soil:liquid ratio of 1:2.5 (w/w) [41]. Soil organic carbon (SOC) was measured by dry combustion using a Ströhlein CS-mat 5500 analyzer (samples did not contain carbonates; thus, no pretreatment was applied). The total nitrogen content (Nt) was measured by the Kjeldahl method using a Büchi semi-automated analyzer (units K439 + K350). The exchangeable acidity (EA) was measured by potentiometric titration (instead of colorimetric titration used in an original method [41]) after sample extraction with 1 M potassium chloride (pH 7). Exchangeable base cations (BC, as the sum of Ca(II), Mg(II), K(I), Na(I)) were extracted using 1 M ammonium acetate at pH 7 and analyzed by atomic absorption (Mg) and emission (Ca, K, Na) spectrophotometry [41]. The effective cation exchange capacity (ECEC) and base saturation (BS) were calculated using the sum of exchangeable base cations (BC) and the exchangeable acidity (EA) [42].
The above-mentioned particle-size fractions and physicochemical soil properties had a normal distribution, checked with a Kolmogorov-Smirnov test. Therefore, the mean, standard error, and standard deviation were calculated for soil properties to characterize their variability within the profiles, using the genetic horizons or regular depth increments as grouping variables. The significance of differences between means was checked using a post-hoc NIR Fisher test at p < 0.05. Correlation coefficients between individual variables were calculated using the Pearson algorithm, and the principal component analysis (PCA) was performed to check the multiple relationships between soil properties. All calculations were performed using the Statistica 13.1 package.

3. Results

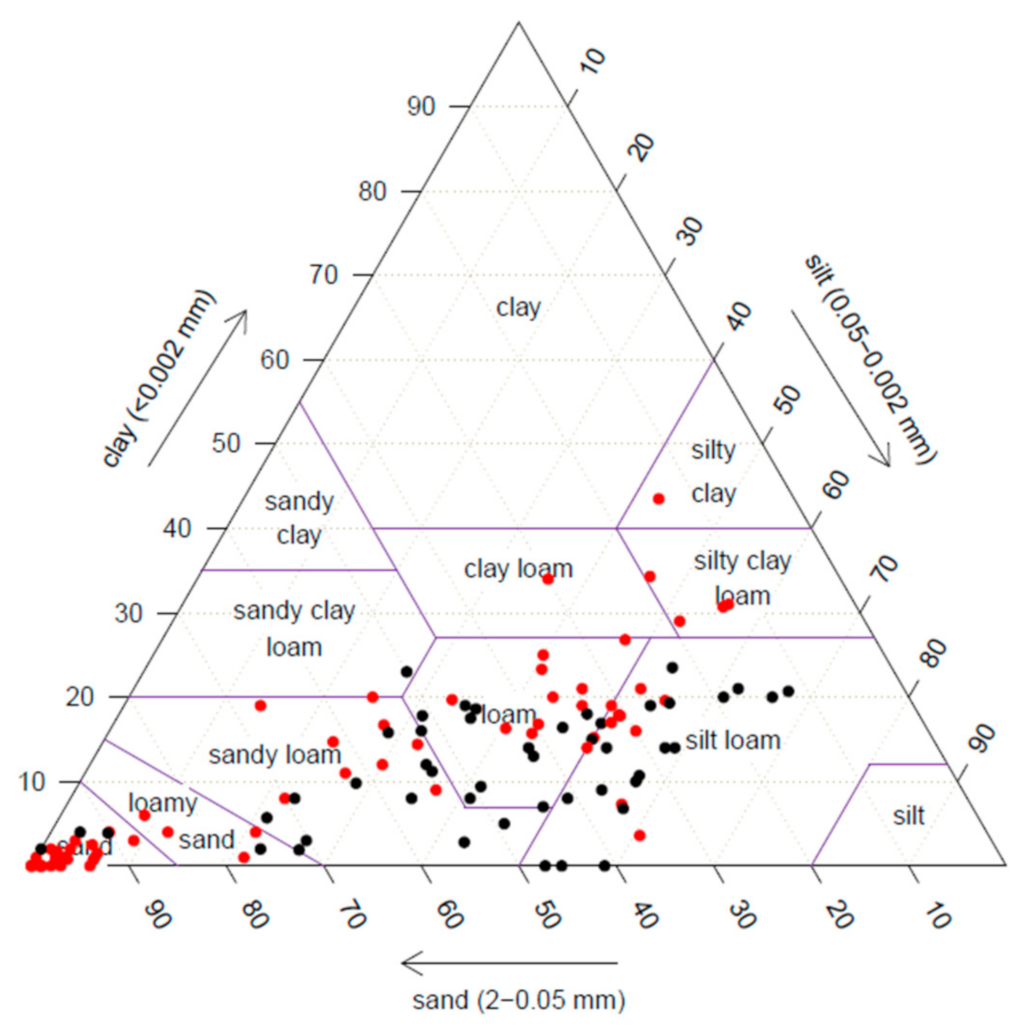
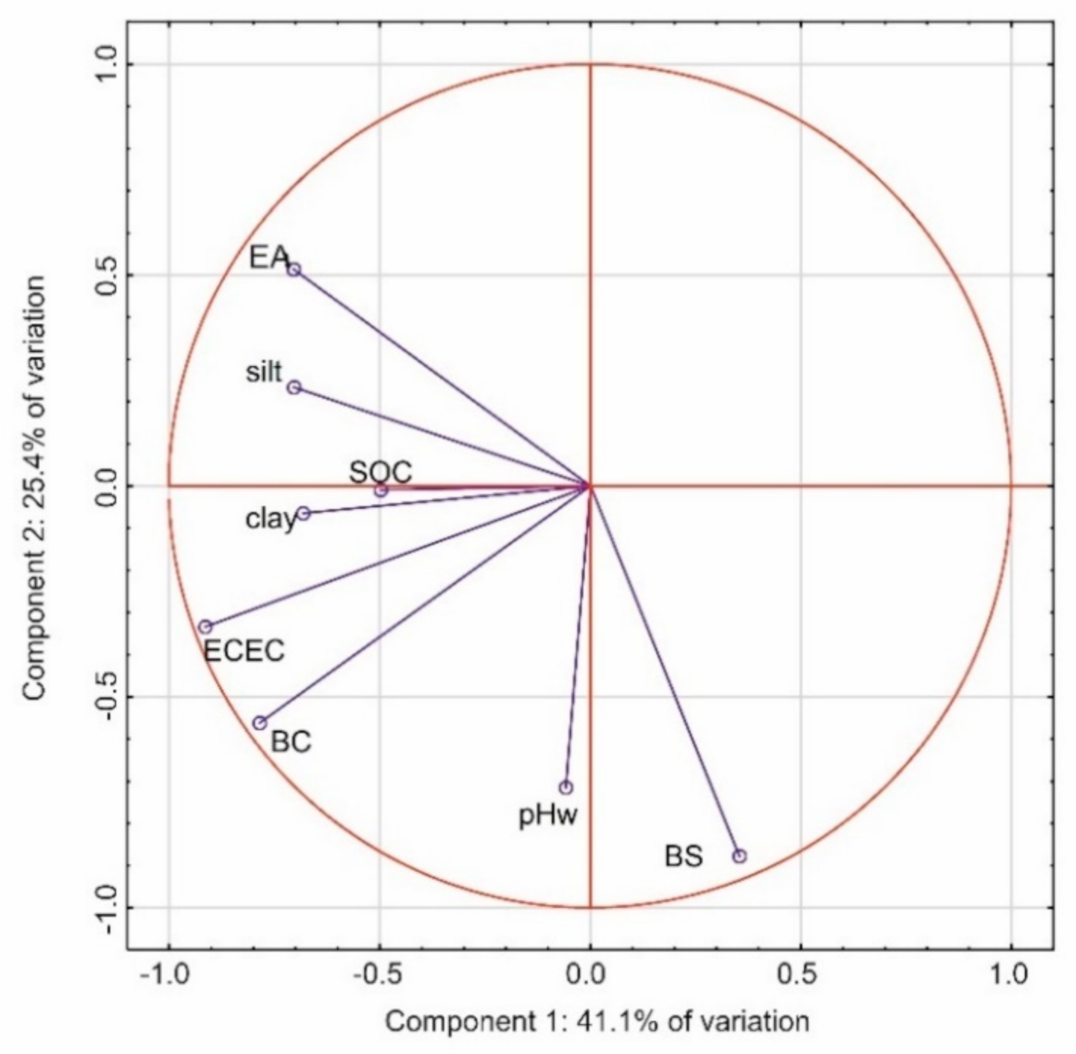
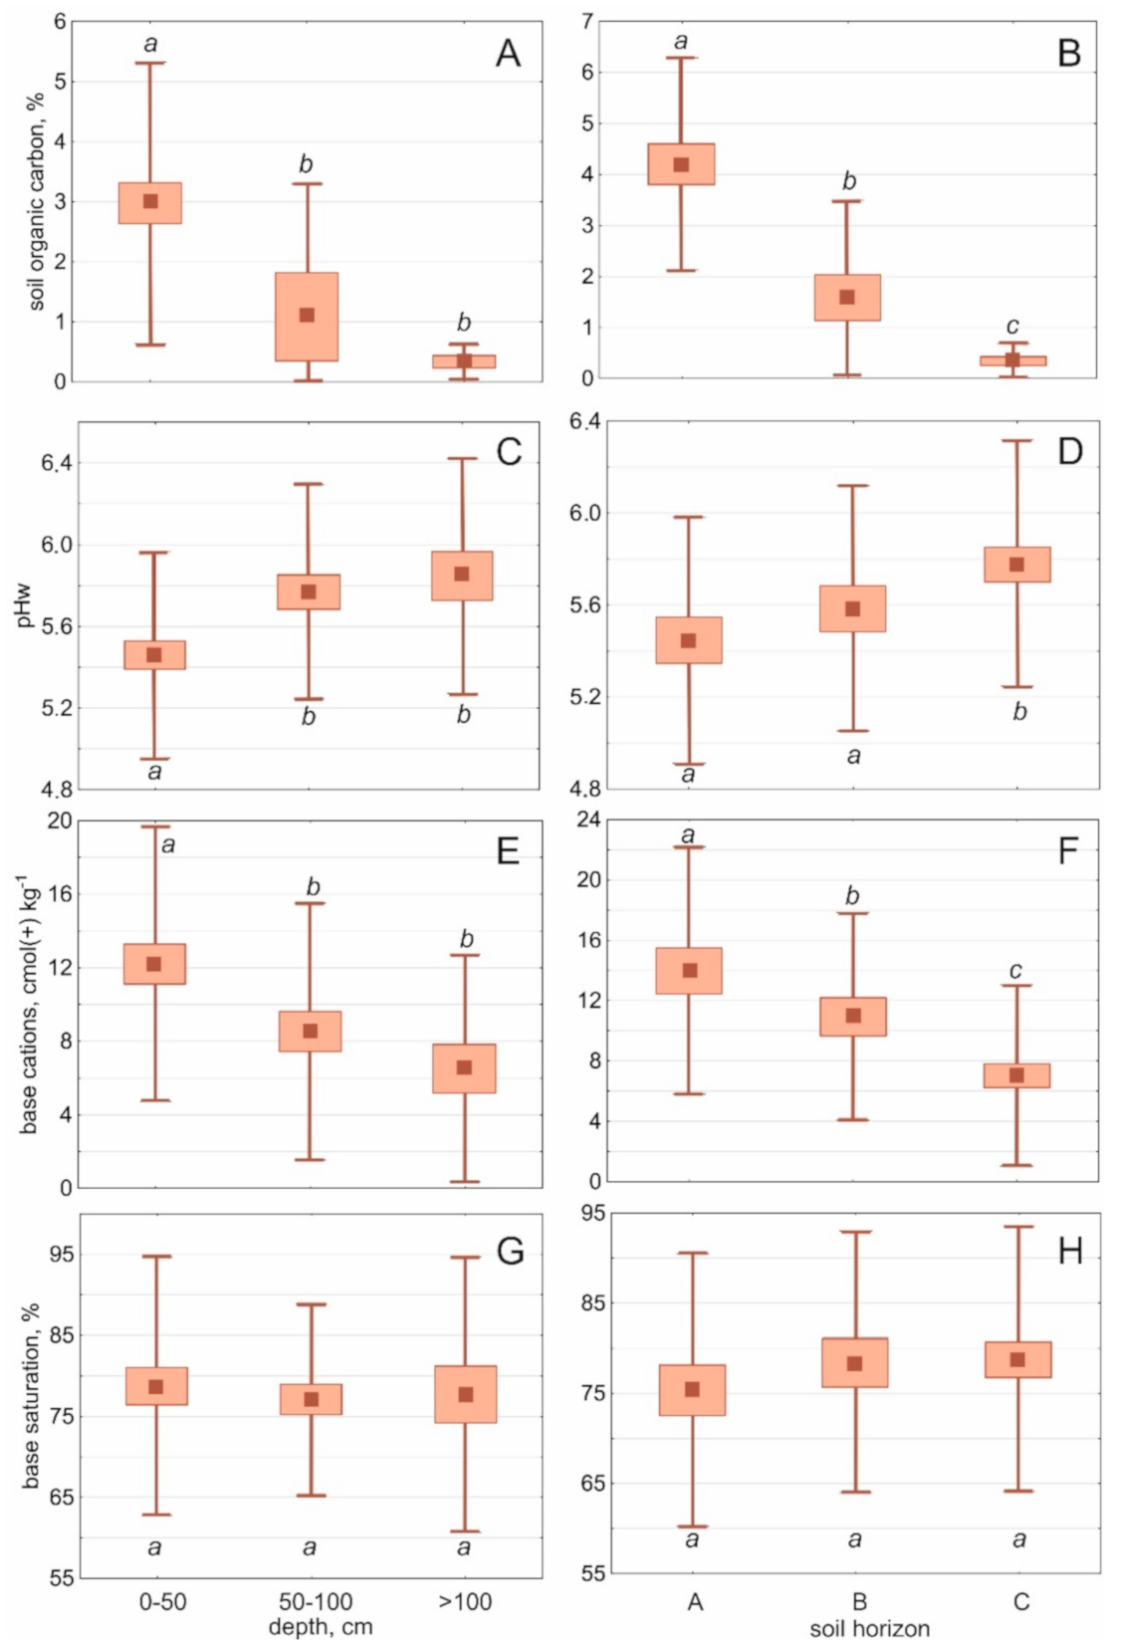
3.1. Differentiation of Soil Texture and Physico-Chemical Properties

Soil texture in particular layers of the soils under study was noticeably differentiated, typical for alluvial soils in Central Europe, from sand to silty clay classes (Figure 3), with the content of clay and silt fractions varying 0.4–43.5% and 0.5–67.2%, respectively (Table 1). Presumed predomination of finer textures in the topsoil layers and the coarser textures in subsoil was rather poorly marked (Figure 4), due to at least four vertical schemes of texture differentiation (Figure 4): (a) Soils had a fine texture (silt, loam, and clay classes) throughout the profile (5 of 21 profiles), (b) soils had a fine texture in the topsoil, underlain with sand at a depth of <50 cm (7 profiles), (c) soils had a fine texture in the topsoil, underlain with sand deeper than 50 cm (5 profiles), and (d) soils a had fine texture in the topsoil and deep subsoil, but interbedded with sand layers (4 profiles).
No clear relationship between the differentiation of soil profiles and their situation in the valley was found. Profiles with thin loamy topsoil underlain with sand were found both in a close proximity of the river channel (soils 2–3) and in distant positions (soil 21). Soils in transect III had, in general, a finer texture (throughout the profile) compared to the sandy soils in transect II (Figure 4).
Fine-textured soil layers were featured by a high BC, between 8–20 cmoL(+) kg−1, contrasting to the low BC in the sandy layers (1–8 cmoL(+) kg−1). However, at relatively high pH (mean pHw 5.7 and pHKCl 5.0), soil horizons had in the majority BS values above 50% (mean 77.9%), typical for eutrophic soils. BC and ECEC were significantly (positively) correlated with both the clay and SOC contents, EA was poorly correlated, whereas pH was not correlated with either clay or SOC contents (Table 2). Although SOC content and clay fraction were negatively correlated (Table 2), the PCA analysis revealed a clear relation between BC, ECEC, and BS to both SOC and clay (Figure 5). Therefore, the vertical distribution of BC followed in, general, the SOC distribution (Figure 6A,E) and textural differentiation (Figure 4). In contrast, pH increased with depth (Figure 6C), and BS did not follow any clear vertical trend (Figure 6G).

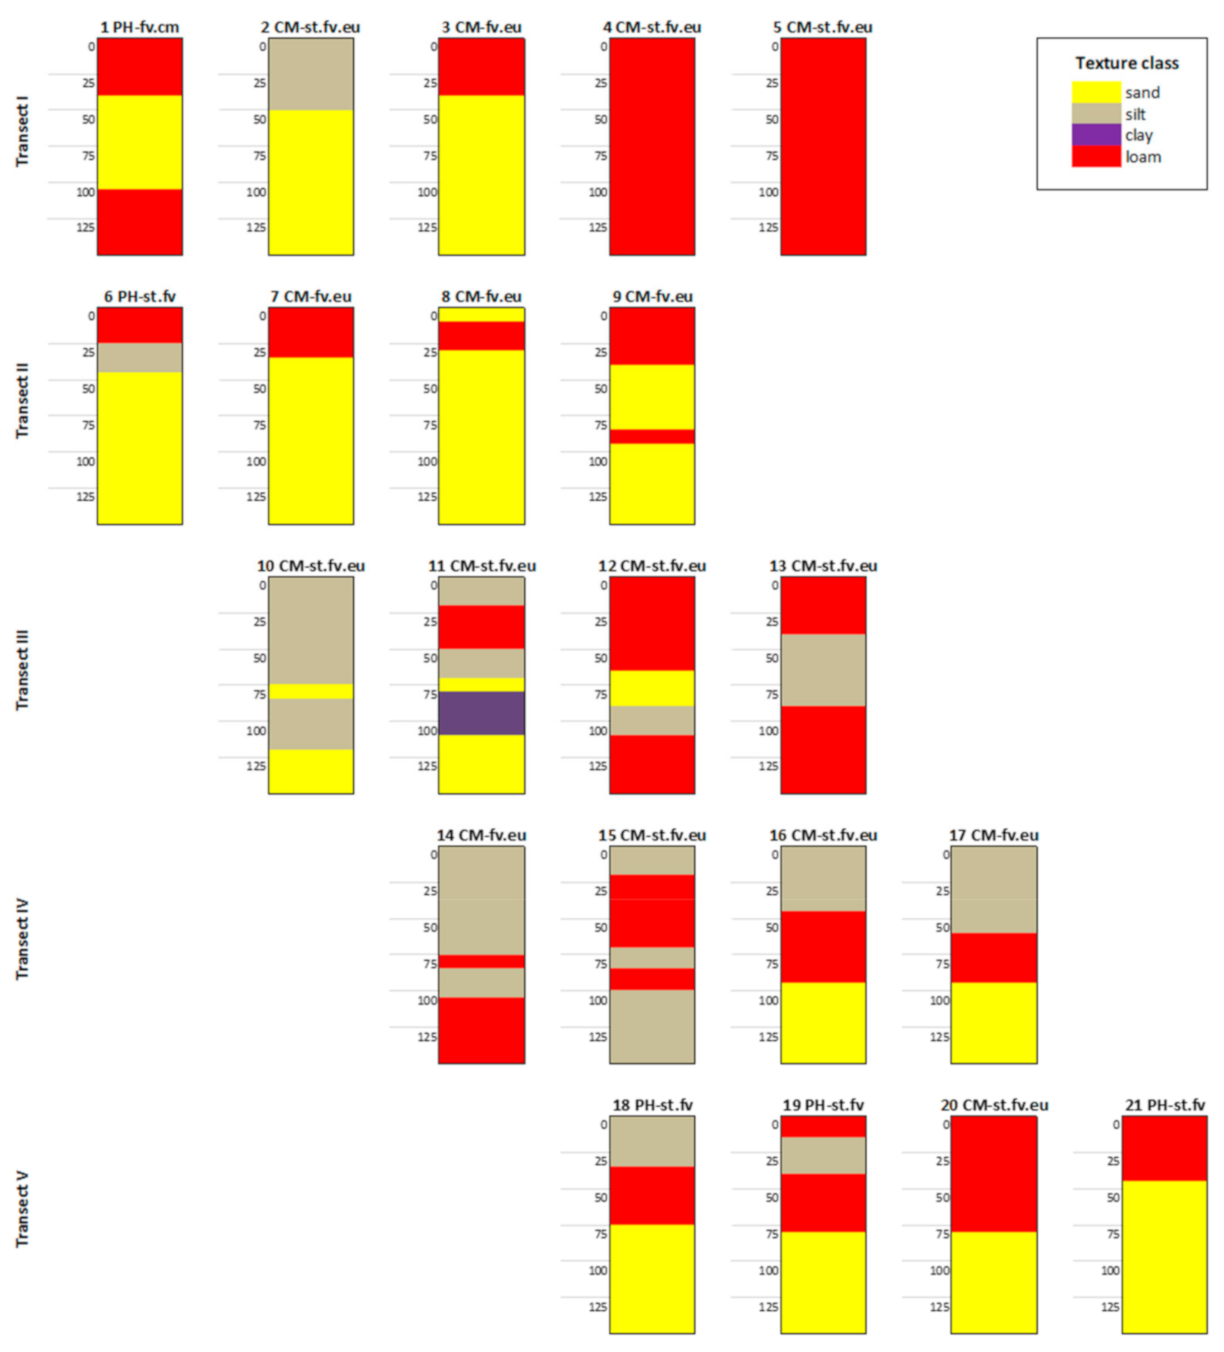
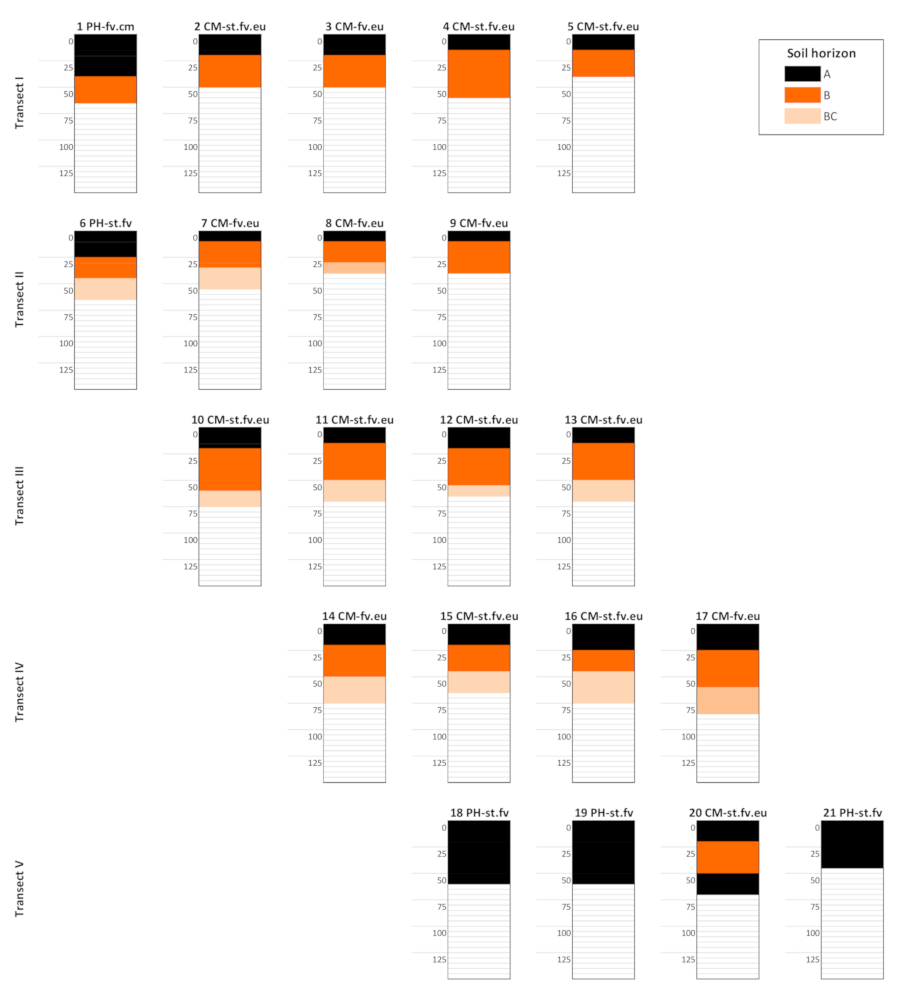
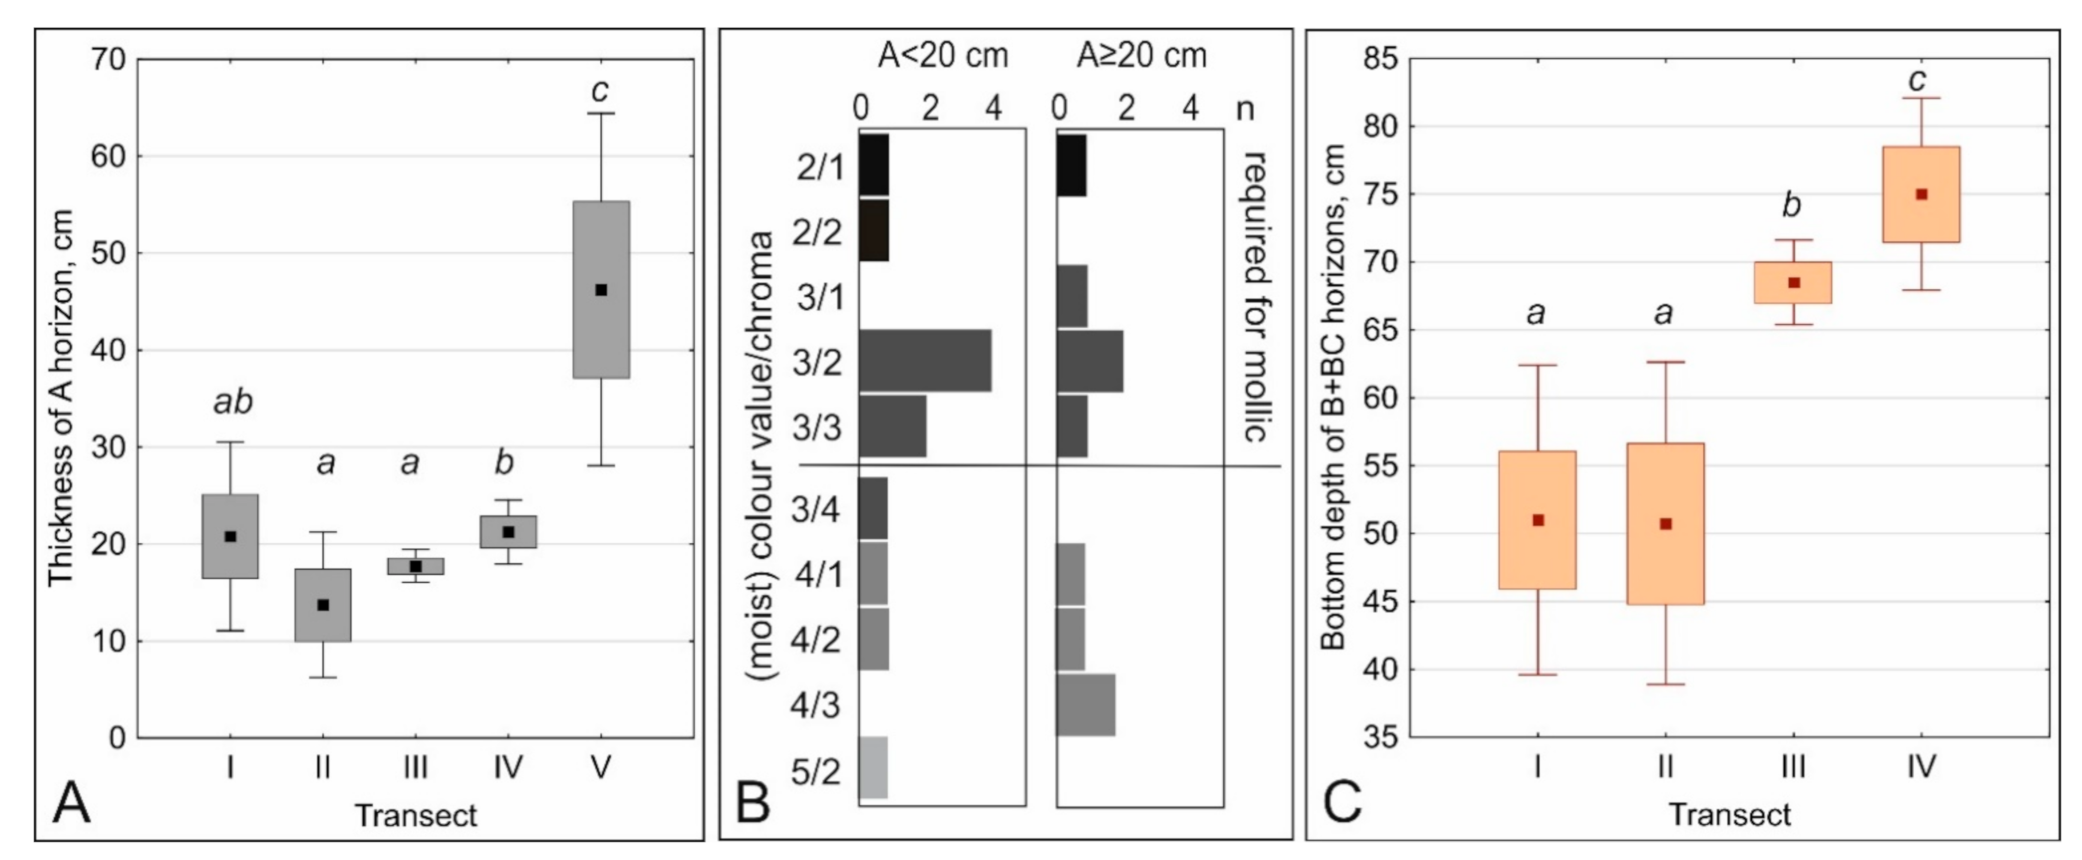
3.2. Morphology of Topsoil and Subsoil Genetic Horizons

The thickness of humus horizons in soils under study ranged between 10 and 60 cm, but more than half of the horizons were thinner than 20 cm (Figure 7 and Table S2). Humus horizons thicker than 20 cm were homogeneous throughout their thicknesses, apart from the thickest a horizons in two profiles, which were clearly bipartial, with the modern topsoil humus horizon underlain with the buried layer. Buried A horizons were also identified in the other profiles (such as no. 20), but were separated from the modern A horizons with other horizons and did not form one continuous layer. Although the thickest humus horizons in transects I and II were noted in the soils situated close to the river channel, the thickness of A horizons generally tended to increase with the distance to the river and was noticeably higher in transects IV–V than in transects II–III (Figure 8A).
Humus horizons were primarily very dark (black or dark grey) colors, characterized by value ≤3 and chroma ≤3 in a moist state (Figure 8B), always in a hue of 10YR (Table S2). The combination of a thickness ≥20 cm and very dark color (value and chroma both ≤3, moist), required for a diagnostic mollic horizon, was noted in 5 profiles of 21 under study (Figure 8B).
All topsoil humus horizons had a well-developed (strong) granular structure, fine- to-medium coarse (Table S2), connected with a high density of (fine-to-medium) roots and visible activity of soil fauna (earthworm casts). Thus, the mull humus was identified in all topsoil layers (in connection with the presence of thin Ol litter layers and the absence of Of or Oh layers) (Table S2). Buried A horizons had a blocky subangular or angular structure, fine-to-medium coarse, and the color was typically darker and less saturated than the topsoil (modern) humus horizons (Table S2).
In 18 of 21 profiles under study, including all soils in transects I–IV, subsurface B horizons have developed (Figure 7). The mean thickness of “proper” Bw horizons was ca. 29 cm (18–45 cm), and the thickness of Bw plus transitional BC horizons was ca. 42 cm (22–61 cm). The mean depth of the bottom limit of the B+BC horizons tended to increase from ca. 50 cm to ca. 75 cm with distance from the river channel (Figure 8C). Subsurface Bw horizons had light brown and brown colors (Munsell hue 10YR), characterized by a value of 4–5 and chroma of 3–5 (moist). The most common colors were 10YR 4/4, 10YR 5/3, and 10YR 5/4 (Table S2). In all cases, Bw horizons had darker and/or stronger colors (i.e., a value or chroma (or both) of at least one unit lower) than the underlying layers. Typically, Bw horizons had blocky subangular structures, fine-to-medium, whereas BC horizons more commonly had blocky angular, medium-to-coarse structures (Table S2). The presence of fine-to-medium roots, as well as earthworm casts, was noticed in all B and BC horizons. The vertical differentiation of physicochemical properties was more prominent if genetic horizons were considered rather than depth increments, although the trends remained the same (Figure 7). In particular, the SOC concentration and BC sum in Bw horizons were significantly higher, whereas the pH was significantly lower than in underlying C horizons (Figure 6B,D,F). Moreover, an increasing BS trend was somewhat clearer if analyzed in subsequent genetic horizons instead of depth increments (although still statistically insignificant) (Figure 6G,H).
Considering the thickness, texture, development of color and structure, as well as the biological activity, the diagnostic cambic horizons were recognized in all described subsurface B horizons, in accordance with WRB classification requirements [39].

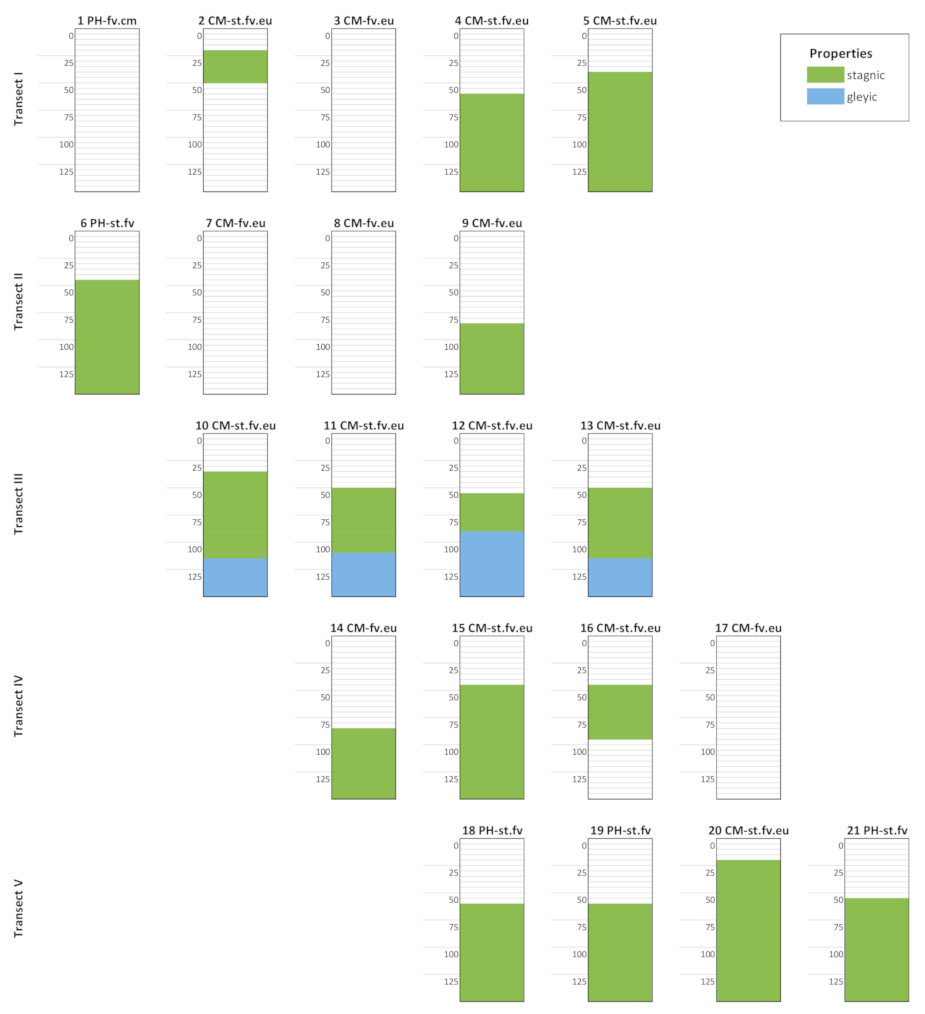
3.3. Gleyic and Stagnic Properties in Profiles of Drained Alluvial Soils

All soil profiles were located in the lowest river terrace, where the strong impact of groundwater on the soil properties is expected. However, the gleyic properties, identified according to WRB [39], were noted in only five profiles of transect III (Figure 9), beginning at a depth of 108–117 cm. Moreover, the gleyic properties were identified in profile 1, but they began at 150 cm (i.e., below the conventional depth limit). Typically, the Cl horizons had the reductimorphic colors 10YR 7/1-2 (moist) covering >80% of the layer cross-section as the matrix colors. The complementary oximorphic rusty-brown colors (10YR 4-5/3-4) were concentrated along the root channels, along the fine-textured interbeddings, and around the coarse-textured lenses. Gleyic properties were not related to any specific texture class, and were identified in sands, loams, and silty clay loams (Table S2).
The features related to stagnic properties were identified in the soils under study much more often than gleyic properties, particularly in the fine-textured soils. Moreover, stagnic properties were not limited to a particular section of soil profile, but were identified at various depths (Figure 9). In fine-textured soils, the stagnic properties commonly began directly below the A horizon, even at a depth of 15–18 cm, and covered underlying Bw horizons. However, the stagnic properties in Bw were weakly expressed, whereas the “clear” or “strong” expression (these terms refer to the limits in Table S1) began most commonly at 40–50 cm below the soil surface, if present (Figure 10). In these fine-textured soils, the stagnic properties extended down to a depth of 150 cm (bottom limit of soil profile) or to the contact with underlying sand. In some profiles, clear/strong stagnic properties continued even in sandy layers (transects III and V). In the soils of transect III, the stagnic properties contacted directly with underlying gleyic properties (Figure 9).
In the fine-textured layers, stagnic properties developed as a mosaic of prevailing oximorphic colors, such as 10YR 5-6/4-6, and complementary reductimorphic colors, typically 10YR 6-7/1-2 (Table S2). Reductimorphic colors were recognized in vertically elongated forms/parts (‘tongues’, ‘interfingering’, etc.), which in the majority are cross-sections of inter-ped cracks, external zones of aggregates, root and animal channels, etc. The oximorphic colors reflected a ‘matrix’ in internal parts of soil aggregates. In the sand-textured layers, the intense rusty-brown oximorphic colors formed extensive spots or wide bands, whereas the reductimorphic colors occurred mostly as round, bright surroundings of the root channels or as grey stripes along the fine-textured sublayers. The redoximorphic colors of the stagnic properties covered 10–100% of the (layer) cross-section, and in Figure 9 are displayed if their intensity reached at least the ‘clear’ level (coverage >25%) that allowed indication of Stagnic qualifier/subtype in a soil classification [39,40]. It must be noted that in a few profiles, only weak stagnic properties were identified; thus, they are not marked in Figure 9 and are not reflected in soil names/classification. In the majority, these were soils developed from thin sandy loams on sand (such as profiles 3, 7, 8), but weak stagnic properties were also possible in thick, although permeable silty loams (profile 17).

4. Discussion

Regulation (channeling) of rivers does not necessarily lead to a permanent lowering of the groundwater level and change in soil moisture status in floodplains [14,26,44]. Łabaz and Kabała [34] and Roj-Rojewski [22] reported that undrained or neglected sections of the floodplain may retain (or restore) their swampy character, including strong gleyic properties in the soil profile. However, river regulation is typically connected with land-use transformation towards extending the arable space that requires extensive drainage of the river terraces. Thus, the lowering of groundwater level and the alteration of moisture regime, at least in the upper part of the soil profile, are often reported from regulated valleys, both from arable, meadow, and forest soils [7,9,30]. The change from reducing into oxidizing conditions in the soil profiles “inactivates” the gleyic properties and favors their blurring (depletion of color intensity) or, conversely, an increase of intensity of rusty-brown colors, resulting in “oxidized gley layers” [13,30]. However, even if fine-textured soil layers lose their water supply and long-term saturation due to groundwater dropping, they retain the ability to accumulate water from precipitation, which may result in the development of stagnic properties under a sufficiently moist climate. Although reasonable, the stagnic properties in alluvial soils have not been commonly reported from Central Europe [45,46,47,48], which may indicate that many researchers do not expect this substantial change in soil moisture status and soil morphology. The change in a dominant moisture supply has significant consequences for land management, both in agriculture and forestry, including a noticeable rebuilding of the forest species composition in the managed forests [4,5,28]. Thus, the recognition of stagnic in place of gleyic properties, as in the case of all soils under study, provides a kind of formal justification for the changes in forest management. In fact, stagnic properties have also been reported from fine-textured soils in non-regulated large valleys (e.g., in Asia), featured by a large seasonal variation in ground-water level and regular flooding [49]. However, these soils typically have strong stagnic properties beginning directly from the surface resulting from soil saturation from flooding water. In contrast, the soils under our study typically do not have redoximorphic features in the topsoil layers and have their weak expression in the upper subsoil layers (Table S2). When discussing the worldwide spread of alluvial soils with stagnic properties, the reported soil names/classification must be analyzed with caution because the profile descriptions and symbols found in the reports sometimes testify to gleyic rather than stagnic properties in reported soils [50].
The permanent lowering of the groundwater level allows intensification of pedogenesis, in a temperate climate zone mirrored in a development of topsoil humus and subsoil Bw horizons [13]. As reported by many authors, the development of the A horizon currently depends to a larger extent on human intervention, including the depth of ploughing, rather than on natural factors. Nearly all mollic and umbric horizons reported by [35] and other unnamed thick topsoil humus horizons of alluvial soils reported by [30,44] had clear or sharp lower limits testifying to their origination by deep ploughing. Even if these soils were reforested, the anthropogenic origin of thick mollic/umbric horizons is recognizable for a long time. It is clear that deep ploughing would be aimless without prior soil drainage. Thus, these thick humus horizons may be considered an indirect effect of river regulation and (at least temporary) terrace drainage [34]. This conclusion may be extended to mollic horizons in the soils under study; those lower limits over Bw horizons or buried humus layers were also clear or sharp, whereas, a development of Bw horizons seems to be a natural result of bioturbation by animals of subsoil layers under aerobic conditions. This transformation may be recognized not only due to a color change, but also as a result of blurring of the micro-stratification of alluvial material, development of a sub-angular instead of angular structure, and subsurface accumulation of organic matter and base cations (as compared to parent material). Similar transformations towards the development of Bw horizons were recognized in most drained alluvial soils [7,10,13,48]. It seems that the formation of Bw horizons may be faster under favorable conditions in the more fertile fine-textured soils (loamy and silty textured), where the well-developed cambic horizons may be recognized over decades after river regulation and soil drainage [30]. In contrast, the development of the Bw horizon in drained sandy alluvial soils may take much longer periods [6,51]. These sandy B horizons do not fulfil the textural criteria for cambic horizons. In Poland, where sandy B horizons are common in many soil categories, a specific diagnostic horizon termed ‘sideric/siderik’ (Bv) was introduced to soil classification in the 1970s as the sandy analogue to cambic [40]. In the soils under study, all Bw horizons met the textural requirements for a cambic horizon (Table S2); however, in a few profiles (no. 3, 7, and, in particular 8; Figure 5), the thickness of the loamy layer was only slightly larger than the minimum required for cambic horizons [39]. In contrast, many drained sandy alluvial soils in Poland do not have any subsurface Bw horizon and have recognizable fluvial stratification directly below the topsoil humus layer [6].
Although the major phenomena discussed above, namely the development of stagnic properties and cambic horizons, occur on the entire area of the former flooding terrace, the spatial trends in their advancement or expression are indistinct (Figure 7 and Figure 9). Large spatial variability of these phenomena may be explained by a specific kind of sedimentation, easily recognizable in the terrace microrelief (Figure 10). Numerous arch-shaped ripples on the inside of each (former) meander indicate subsequent reworking and sedimentation of previously accumulated materials during the river meandering [52]. Therefore, each arch-shaped ripple may differ from neighboring ripples in the sequence and thickness of fine- and coarse-textured layers in the vertical section. Because the ripples are typically only several meters wide, and the ripples slightly differ in their elevation (Figure 10), the soil texture and conditions for the development of stagnic properties and cambic horizons may vary on a very local scale.
Recently formed alluvial soils typically belong to Fluvisols that reflects the presence of recognizable stratification of alluvial parent material and the absence of diagnostic horizons such as mollic/umbric and cambic [39]. Alternatively, according to WRB priorities, the waterlogged young alluvial soils may be classified as Gleysols, if gleyic properties begin sufficiently close to the soil surface. Contrastingly, not one of the soils under study was classified as Fluvisol or Fluvic Gleysol. Five of 21 profiles met the criteria of Phaeozems (Table 3) due to the presence of a mollic horizon and the deep occurrence of gleyic or stagnic properties. The stratification (the fluvic properties) was still recognizable in the deeper section of their profiles, but it was blurred in the topsoil layers. As stated above, the transformation of primary Fluvisols into Fluvic Phaeozems probably resulted from deep ploughing connected with temporary deforestation and arable use of the terrace sections after river regulation. However, most of the soils in the area under study fulfilled the criteria for Cambisols (Table 3) related to the presence of a cambic horizon, absence of the topsoil mollic/umbric horizon, and respectively weak expression or deep presence of gleyic or stagnic properties. However, the Stagnic qualifier was added in most Cambisols under study to reflect the development of the subsurface layer with these kinds of redoximorphic features, beginning at various depths in the middle part of the soil profile (Table 3). The transformation of native alluvial soils, reflected in the change of their name from Fluvisols to Fluvic Cambisols and Fluvic Phaeozems has been similarly identified in the local (Polish) classification, even if the levels of unit classification differ between the systems (Table 3).
Although many authors reported the transformation of drained alluvial soils towards the development of mollic or cambic horizons, which excluded these soils from Fluvisols group according to the statements of WRB classification, Fluvisols are still reported from regulated and drained valleys [10,11,12,32,54,55]. This may indicate that many authors still apply the term “Fluvisols” as a synonym of alluvial soils on the Holocene river terraces, irrespective of the actual stage of their pedogenic transformation.

5. Conclusions

An analysis of 21 profiles of forest soils located on the Holocene river terrace of the Odra River (former floodplain) confirmed a noticeable pedogenic transformation of the soil morphology resulting from river regulation, elimination of flooding and permanent lowering of the groundwater table. Gleyic properties, identified in the bottom section of a few profiles only, were in most of the other profiles replaced with stagnic properties testifying to a substantial alteration of the moisture regime, related to the transition from dominant ground-water supply to precipitation-water supply. The development of a diagnostic mollic, and in particular of cambic horizons, correlated with the shift from Fluvisols to Phaeozems, and in the majority, to Cambisols, provided evidence for the permanent change of habitat conditions that explains the reported transformation of plant communities.
The transformation of alluvial soils reflected in the development of diagnostic horizons and the shift to Phaeozems and Cambisols, connected with the absence of flooding, elucidate the inevitable change of forest management in the river valley, including a quantitative alteration in the forest species composition that may lead to a disappearance of the native riparian forests.

Supplementary Materials

The following are available online at https://www.mdpi.com/1999-4907/12/3/329/s1, Table S1. Intensity of stagnic and gleyic properties. Table S2a. Soil morphology and texture in Transect I. Table S2b. Soil morphology and texture in Transect II. Abrreviations as in Table S-2a. Table S2c. Soil morphology and texture in Transect II. Abrreviations as in Table S-2a. Table S2d. Soil morphology and texture in Transect II. Abrreviations as in Table S-2a. Table S2e. Soil morphology and texture in Transect II. Abrreviations as in Table S-2a.

Author Contributions

Conceptualization, D.K. and C.K.; methodology, D.K.; investigation, D.K. and P.J.; writing—original draft preparation, D.K.; writing—review and editing, C.K. All authors have read and agreed to the published version of the manuscript.

Funding

This work was co-financed by the Ministry of Higher Education and Science of Poland, project MNiSW N N305 154537/2009 and a statute project of Wrocław University of Environmental and Life Sciences, Institute of Soil Science and Environmental Protection from a subsidy of the Ministry of Education and Science of Poland.

Acknowledgments

The authors wish to thank Bogacz, A., Woźniczka, P., and Czeryba, Z. for their help in carrying out long-term observations and field research in the Wołów Forest District.

Conflicts of Interest

The authors declare no conflict of interest. The funders had no role in the design of the study; in the collection, analyses, or interpretation of data; in the writing of the manuscript, or in the decision to publish the results.

References

  1. Ward, J.V.; Malard, F.; Tockner, K. A framework for integrating pattern and processes in river corridors. Landsc. Ecol. 2002, 17 (Suppl. 1), 35–45. [Google Scholar] [CrossRef]
  2. Doulatyari, B.; Basso, S.; Schirmer, M.; Botter, G. River flow regimes and vegetation dynamics along a river transect. Adv. Water Resour. 2014, 73, 30–43. [Google Scholar] [CrossRef]
  3. Czarnecka, B.; Pelc, M. Biodiversity on the floristic and phytocoenotic levels: The comparison of forest and non-forest landscapes in small river valleys. Ecol. Quest. 2007, 8, 37–45. [Google Scholar]
  4. Cieśla, A. Effect of hydrotechnical constructions on the Oder river on the phytosociological diversity of riparian habitats in the Prawików forest. For. Res. Works 2009, 70, 161–174. [Google Scholar] [CrossRef] [Green Version]
  5. Celentano, D.; Rousseau, G.X.; Engel, V.L.; Zelarayán, M.; Oliveira, E.C. Degradation of riparian forest affects soil properties and ecosystem services provision in eastern amazon of Brazil. Land Degrad. Dev. 2017, 28, 482–493. [Google Scholar] [CrossRef]
  6. Ligęza, S. Variability of the contemporary Fluvisols of the Vistula River near Puławy. Sci. Diss. Lub. Univ. Life Sci. 2016, 385, 1–131. [Google Scholar]
  7. Šimanský, V. Can soil properties of Fluvisols be influenced by river flow gradient. Acta Fytotech. Zootech. 2018, 212, 63–76. [Google Scholar] [CrossRef]
  8. Hulisz, P.; Michalski, A.; Dąbrowski, M.; Kusza, G.; Łęczyński, L. Human-induced changes in the soil cover at the mouth of the Vistula River Cross-Cut (northern Poland). Soil Sci. Annu. 2015, 66, 67–74. [Google Scholar] [CrossRef] [Green Version]
  9. Dezső, J.; Czigány, S.; Nagy, G.; Pirkhoffer, E.; Słowik, M.; Lóczy, D. Monitoring soil moisture dynamics in multilayered Fluvisols. Bull. Geography. Phys. Geogr. Ser. 2019, 16, 131–146. [Google Scholar] [CrossRef] [Green Version]
  10. Ružičić, S.; Kovač, Z.; Perković, D.; Bačani, L.; Majhen, L. The Relationship between the Physicochemical Properties and Permeability of the Fluvisols and Eutric Cambisols in the Zagreb Aquifer, Croatia. Geosciences 2019, 9, 416. [Google Scholar] [CrossRef] [Green Version]
  11. Kercheva, M.; Sokolowska, Z.; Hajnos, M.; Skic, K.; Shishkov, T. Physical parameters of Fluvisols on flooded and non-flooded terraces. Int. Agrophys. 2017, 31, 1. [Google Scholar] [CrossRef] [Green Version]
  12. Gajić, B.; Kresović, B.; Pejić, B.; Tapanarova, A.; Dugalić, G.; Životić, L.; Tolimir, M. Some physical properties of long-term irrigated fluvisols of valley the river Beli Drim in Klina (Serbia). Zemljište I Biljka 2020, 69, 21–35. [Google Scholar] [CrossRef]
  13. Chojnicki, J. Soil-Forming Processes in Alluvial Soils Central Valley Vistula and Żuławy; SGGW Development Foundation: Warsaw, Poland, 2002; p. 83. [Google Scholar]
  14. Brunke, M.; Hoehn, E.; Gonser, T. Patchiness of river-groundwater interactions within two floodplain landscapes and diversity of aquatic invertebrate communities. Ecosystems 2003, 6, 707–722. [Google Scholar] [CrossRef]
  15. Ding, J.Y.; Zhao, W.W.; Daryanto, S.; Wang, L.X.; Fan, H.; Feng, Q.; Wang, Y.P. The spatial distribution and temporal variation of desert riparian forests and their influencing factors in the downstream Heihe River basin, China. Hydrol. Earth Syst. Sci. 2017, 21, 2405–2419. [Google Scholar] [CrossRef] [Green Version]
  16. Zhang, X.; Guan, T.; Zhou, J.; Cai, N.; Du, H.; Jiang, L.; Lai, L.; Zheng, Y. Groundwater depth and soil properties are associated with variation in vegetation of a desert riparian ecosystem in an arid area of China. Forests 2018, 9, 34. [Google Scholar] [CrossRef] [Green Version]
  17. Łyczko, W.; Olszewska, B.; Pływaczyk, L. Changes in water reserves in alluvial soils of Odra river valley in Malczyce area during vegetation period of 2005. Acta Sci. Pol. Form. Circumiectus 2007, 6, 25–36. [Google Scholar]
  18. Głuchowska, B.; Pływaczyk, L. Groundwater level in the Odra river valley downstream the Brzeg Dolny. Contemp. Probl. Environ. Eng. 2008, 5, 1–109. [Google Scholar]
  19. Kardol, P.; Bezemer, T.M.; Putten, W.H.V.D. Temporal variation in plant-soil feedback controls succession. Ecol. Lett. 2006, 9, 1080–1088. [Google Scholar] [CrossRef]
  20. Schnitzler, A. River dynamics as a forest process: Interaction between fluvial systems and alluvial forests in large European river plains. Bot. Rev. 1997, 63, 40–64. [Google Scholar] [CrossRef]
  21. Długosz, J.; Kalisz, B.; Łachacz, A. Mineral matter composition of drained floodplain soils in north-eastern Poland. Soil Sci. Annu. 2018, 69, 184–193. [Google Scholar] [CrossRef] [Green Version]
  22. Roj-Rojewski, S.; Hryniewiecka, I. Profile structure and physical properties of muddy-like and river alluvial soils in Supraśl River valley near Jurowce. Rocz. Glebozn. Soil Sci. Annu. 2009, 60, 85–90. [Google Scholar]
  23. Borysiak, J. Willow and poplar forest complex Salici-Populetum R.Tx. in the valleys of Polish lowlands. In Willows. Salix Alba L., Salix Fragilis L. Our Forest Trees; Białobok, S., Ed.; PWN: Warsaw, Poland, 1990; pp. 139–160. [Google Scholar]
  24. Matuszkiewicz, J.M. Forest Associations in Poland; PWN: Warsaw, Poland, 2001; p. 376. [Google Scholar]
  25. Nilsson, C.; Berggren, K. Alterations of riparian ecosystems caused by river regulation: Dam operations have caused global-scale ecological changes in riparian ecosystems. How to protect river environments and human needs of rivers remains one of the most important questions of our time. BioScience 2000, 50, 783–792. [Google Scholar]
  26. Tockner, K.; Stanford, J.A. Riverine floodplains: Present state and future trends. Environ. Conserv. 2002, 29, 308–330. [Google Scholar] [CrossRef] [Green Version]
  27. Danielewicz, W. Ecological Determinants of the Range of Trees and Shrubs in the alluvial areas of the Odra Valley; Poznań Agric. Univ.: Poznań, Poland, 2008; p. 267. [Google Scholar]
  28. Kawalko, D.; Halarewicz, A.; Pruchniewicz, D. Vegetation condition in the Odra river riparian forests in the area of Wołów. Sylwan 2015, 159, 220–226. [Google Scholar]
  29. Pływaczyk, L. The impact of river damming on valley on the example of Brzeg Dolny. Monogr. Wrocław Agric. Univ. 1997, 11, 47. [Google Scholar]
  30. Laskowski, S. Origin, evolution and the properties of alluvial soils from the middle Odra River-valley. Sci. Pap. Wrocław Agric. Univ. 1986, 56, 1–68. [Google Scholar]
  31. Dąbkowska-Naskręt, H. Composition and Physicochemical Properties of Selected Alluvial Soils of the Lower Vistula Valley, Including Their Diagnostic Features; Scientific Dissertations of ATR: Bydgoszcz, Poland, 1990; p. 38. [Google Scholar]
  32. Furtak, K.; Grządziel, J.; Gałązka, A.; Niedźwiecki, J. Analysis of Soil Properties, Bacterial Community Composition and Metabolic Diversity in Fluvisols of a Floodplain Area. Sustainability 2019, 11, 3929. [Google Scholar] [CrossRef] [Green Version]
  33. Kabala, C. (Ed.) Soil of Lower Silesia: Origins, diversity and protection. Polish Society of Soil Science; Polish Humic Substances Society: Wroclaw, Poland, 2015; p. 256. Available online: http://dx.doi.org/10.13140/RG.2.1.2070.9603 (accessed on 10 March 2021).
  34. Labaz, B.; Kabala, C. Anthropogenic transformation of soils in the Barycz Valley—Conclusions for soil classification. Soil Sci. Annu. 2014, 65, 103–110. [Google Scholar] [CrossRef] [Green Version]
  35. Labaz, B.; Kabala, C. Human-induced development of mollic and umbric horizons in drained and farmed swampy alluvial soils. Catena 2016, 139, 117–126. [Google Scholar] [CrossRef]
  36. Pawlak, W.; Pawlak, J. Atlas of the Lower and Opole Silesia, 2nd ed.; Wroclaw University, Polish Academy of Sciences: Wroclaw, Poland, 2008. [Google Scholar]
  37. Kawalko, D.; Halarewicz, A.; Kaszubkiewicz, J.; Jezierski, J. Decomposition rate of the litter fall in the course of riparian habitat changes. Sylwan 2017, 161, 565–572. [Google Scholar]
  38. Jahn, R.; Blume, H.P.; Asio, V.B.; Spaargaren, O.; Schad, P. Guidelines for Soil Description; FAO: Rome, Italy, 2006; p. 97. [Google Scholar]
  39. IUSS Working Group WRB. World Reference Base for Soil Resources 2014, update 2015. International soil classification system for naming soils and creating legends for soil maps. In World Soil Resources Reports; FAO: Rome, Italy, 2015; p. 182. [Google Scholar]
  40. Kabala, C.; Charzyński, P.; Chodorowski, J.; Drewnik, M.; Glina, B.; Greinert, A.; Hulisz, P.; Jankowski, M.; Jonczak, J.; Labaz, B.; et al. Polish Soil Classification, 6th edition—Principles, classification scheme and correlations. Soil Sci. Annu. 2019, 70, 71–97. [Google Scholar] [CrossRef] [Green Version]
  41. Van Reeuwijk, L.P. Procedures for Soil Analysis; Technical paper 19; International Soil Reference and Information Centre: Wageningen, The Netherlands, 1992. [Google Scholar]
  42. Kawalko, D. Soil Morphology and Properties of Forest Soils in the Odra Valley (SW Poland, Forest District Wołów)—The COMPLETE Raw Dataset. 2021. Available online: https://arche.upwr.edu.pl/index.php/s/KCZv4rZcKln7aPY (accessed on 10 March 2021).
  43. USDA-NRCS. Keys to Soil Taxonomy; U.S. Dep. Agric. NRSC: Washington, DC, USA, 2014; p. 360.
  44. Piaścik, H.; Orzechowski, M.; Smólczyński, S. Soil habitats of the Vistula delta. Ann. Poznań Agric. Univ. 2000, 317, 115–124. [Google Scholar]
  45. Horáček, M.; Samec, P.; Minár, J. The mapping of soil taxonomic units via fuzzy clustering. A case study from the Outer Carpathians, Czechia. Geoderma 2018, 326, 111–122. [Google Scholar] [CrossRef]
  46. Graf, M.; Lair, G.J.; Zehetner, F.; Gerzabek, M.H. Geochemical fractions of copper in soil chronosequences of selected European floodplains. Environ. Pollut. 2007, 148, 788–796. [Google Scholar] [CrossRef]
  47. Bieganowski, A.; Jaromin-Glen, K.; Guz, Ł.; Łagód, G.; Jozefaciuk, G.; Franus, W.; Sobczuk, H. Evaluating soil moisture status using an e-nose. Sensors 2016, 16, 886. [Google Scholar] [CrossRef] [PubMed] [Green Version]
  48. Pető, Á. Studying modern soil profiles of different landscape zones in Hungary: An attempt to establish a soil-phytolith identification key. Quat. Int. 2013, 287, 149–161. [Google Scholar] [CrossRef]
  49. Ngo, T.S.; Nguyen, D.B.; Rajendra, P.S. Effect of land use change on runoff and sediment yield in Da River Basin of Hoa Binh province, Northwest Vietnam. J. Mt. Sci. 2015, 12, 1051–1064. [Google Scholar] [CrossRef]
  50. Opekunova, M.G.; Opekunov, A.Y.; Kukushkin, S.Y.; Ganul, A.G. Background contents of heavy metals in soils and bottom sediments in the north of Western Siberia. Eurasian Soil Sci. 2019, 52, 380–395. [Google Scholar] [CrossRef]
  51. Kabala, C.; Gałka, B.; Jezierski, P.; Bogacz, A. Transformation of Fluvisols caused by river regulation and long-term farming—A case study from the Dobra River valley in the Silesian Lowland. Rocz. Glebozn. Soil Sci. Annu. 2011, 62, 141–153. [Google Scholar]
  52. Kondracki, J. Regional Geography of Poland; PWN: Warsaw, Poland, 2002; p. 441. [Google Scholar]
  53. National Geoportal. Available online: https://mapy.geoportal.gov.pl/ (accessed on 31 January 2021).
  54. Kobierski, M.; Piotrowska, A. Profile distribution of heavy metals and enzymatic activity in Fluvisols of the Vistula River Valley, Poland. Fresenius Environ. Bull. 2010, 19, 303–311. [Google Scholar]
  55. Kobierski, M. Evaluation of the content of heavy metals in Fluvisols of floodplain area depending on the type of land use. J. Ecol. Eng. 2015, 16, 1. [Google Scholar] [CrossRef] [Green Version]
Figure 1. Location of research areas in the Odra valley and schematic view of the geology (prepared originally, based on [36]).
Forests 12 00329 g001
Figure 2. Situation of soil profiles in the Transect I (upper scheme) and Transects II-V (bottom). Red line marks the terrace surface, blue line–the mean water level in the river channel.
Forests 12 00329 g002
Figure 3. Soil texture classes in particular layers of soils under study. Black dots indicate the topsoil (0–50 cm) and the red dots indicate the subsoil (50–150 cm) layers, respectively.
Forests 12 00329 g003
Figure 4. Texture layering in the soil profiles. Generalized texture classes according to USDA classification [43]. Reference Soil Groups and principal qualifiers according to WRB [39]: PH—Phaeozems, CM—Cambisols, eu—eutric, fv—fluvic, st—stagnic.
Forests 12 00329 g004
Figure 5. Principal component analysis (PCA) diagram for clay, silt, and physicochemical properties of soils under study.
Forests 12 00329 g005
Figure 6. Differentiation of physicochemical properties in soil profiles under study ordered by regular depth increments (left column, letters A,C,E,G) and genetic horizons (right column, letters B,D,F,H). Explanation: Dark central squares–mean values, boxes–standard errors, whiskers–standard deviations; letters a, b, c–significance of differences (homogeneous groups of means) by NIR Fisher test (at p < 0.05).
Forests 12 00329 g006
Figure 7. Thickness of A, Bw, and BC horizons (in centimeters). Abbreviations—as in Figure 4.
Forests 12 00329 g007
Figure 8. Characteristics of A and B horizons. (A) Thickness of A horizons in particular transects; (B) Munsell soil colors (value/chroma) in A horizons thinner than 20 cm (left side) and at least 20 cm thick (right side); n—number of observations; (C) the depth of bottom limit of B+BC horizons; means, standard errors, and standard deviations are marked as dark central squares, boxes, and whiskers, respectively; letters a, b, c—as in Figure 6.
Forests 12 00329 g008
Figure 9. The presence and depth of stagnic and gleyic properties. Abbreviations—as in Figure 4.
Forests 12 00329 g009
Figure 10. Transformation of the Odra valley in the area of Transects II-V: (ch) Artificial channel of the river, (le) anti-flooding embankments (levees), (m) former river meanders. Moreover, (al) are arch-shaped zones of subsequently accumulated alluvial sediments on the inside of the meander. Source: [53].
Forests 12 00329 g010
Table 1. Range, mean, and standard deviation for clay, silt, sand, and physico-chemical properties of soils under study. SOC, Nt, and pH values are given separately for litter layers and mineral horizons.
VariablenMeanMinimumMaximumStandard Deviation
SOC in litter, %2132.821.844.27.75
Nt in litter, %211.260.821.680.20
pHw in litter215.14.95.40.16
pHKCl in litter214.74.45.00.18
SOC, %1142.420.0110.72.40
Nt, %590.200.010.550.14
pHw1145.74.36.80.55
pHKCl1145.03.66.00.58
clay, %11411.60.443.59.2
silt, %11432.30.567.221.0
sand, %11456.212.099.127.6
EA, cmol(+) kg−1 1142.560.0410.22.49
BC, cmol(+) kg−11149.741.0937.07.36
ECEC, cmol(+) kg−111412.31.4844.28.45
BS, %11477.945.799.414.7
Explanations: n—number of samples, SOC—soil organic carbon, Nt—total nitrogen, pHw—pH in distilled water, pHKCl—pH in 1M KCl, EA—exchangeable acidity, BC—sum of base cations, ECEC—effective cation exchange capacity, BS—base saturation.
Table 2. Pearson correlation coefficients for the relationships between selected physico-chemical properties in the mineral horizons of soils under study (N = 114).
VariableSOCClay Fraction
SOC-−0.31 *
Nt0.86 **−0.14
pHw0.060.14
EA0.210.29 *
BC0.36 **0.44 **
ECEC0.39 **0.49 **
BS−0.120.07
Explanation: Significant at * p < 0.05, ** p < 0.01; abbreviations as in Table 1.
Table 3. Comparison of soil classification according to WRB [2015] and Polish Soil Classification [2019].
Soil Profile(Transect)Soil HorizonsDepth, cmWRB (2015)Polish Soil Classification (2019)
1 (I)A-AB-2C-3Cg0–38–65–104–150PH-fv.cmCFbr
2 (I)A-ABwg-BCg-2C-2Cl0–18–25–50–110–150CM-st.fv.euBFog
3 (I)A-2Bwg-3C0–18–40–150CM-fv.euBFt
4 (I)A-Bw-Cg-2Cg0–15–60–90–150CM-st.fv.euBFog
5 (I)A-Bwg-Cg0–15–40–150CM-st.fv.euBFog
6 (V)A-2Bwg-3BCg-3Cg0–25–43–65–150PH-st.fvBFh-og
7 (V)A-Bw-2BCg-2Cg0–10–37–56–150CM-fv.euBFt
8 (V)A-Bw-2BCg-2Cg0–10–30–42–150CM-fv.euBFt
9 (V)A-Bw-2Cg-3Cg-4Cg0–10–40–85–96–150CM-fv.euBFt
10 (III)A-ABw-Bwg-BCg-2Cg-3Cg-4Cl0–18–35–58–73–86–117–150CM-st.fv.euBFog
11 (III)A-Bwg-BCg-2Cg-3Cg-4Cl0–17–49–68–80–110–150CM-st.fv.euBFog
12 (III)A-2Bwg-3BCg-4Cg-5Cl0–20–55–66–90–150CM-st.fv.euBFog
13 (III)A-Bw-BCg-Cg-Cl0–16–38–67–117–150CM-st.fv.euBFog
14 (IV)A-Bw-BCg-Cg0–19–50–76–150CM-fv.euBFt
15 (IV)A-Bw-BCg-Cg0–18–47–67–150CM-st.fv.euBFog
16 (IV)A-Bwg-BCg-2Cg-3Cg-4Cg0–25–46–73–88–95–150CM-st.fv.euBFog
17 (IV)A-Bw-BCg-2Cg-3C0–23–60–84–94–150CM-fv.euBFt
18 (V)A-ABwg-2Agb-2Cg-3Cg0–20–36–59–74–150PH-st.fvCFog
19 (V)A-Agb-A/Cg-2Cg0–41–60–80–150PH-st.fvCFog
20 (V)A-Bwg-Agb-Cg-2Cg0–21–50–70–80–150CM-st.fv.euBFog
21 (V)A-Ab-2Cg0–25–45–150PH-st.fvCFog
Explanations of soil symbols according to Polish Soil Classification (2019): BFt–typical brown alluvial soils, BFog–stagnogleyic brown alluvial soils, BFh-og–humus-stagnogleyic brown alluvial soils, CFog–stagnogleyic chernozemic alluvial soils, CFbr–brown chernozemic alluvial soils.
Publisher’s Note: MDPI stays neutral with regard to jurisdictional claims in published maps and institutional affiliations.

