
Heuristic Optimization of Thinning Individual Douglas-Fir


Abstract
1. Introduction
2. Materials and Methods
2.1. The Financially Optimal Thinning Problem
2.2. Adaptation of Heuristics to Select Individual Trees
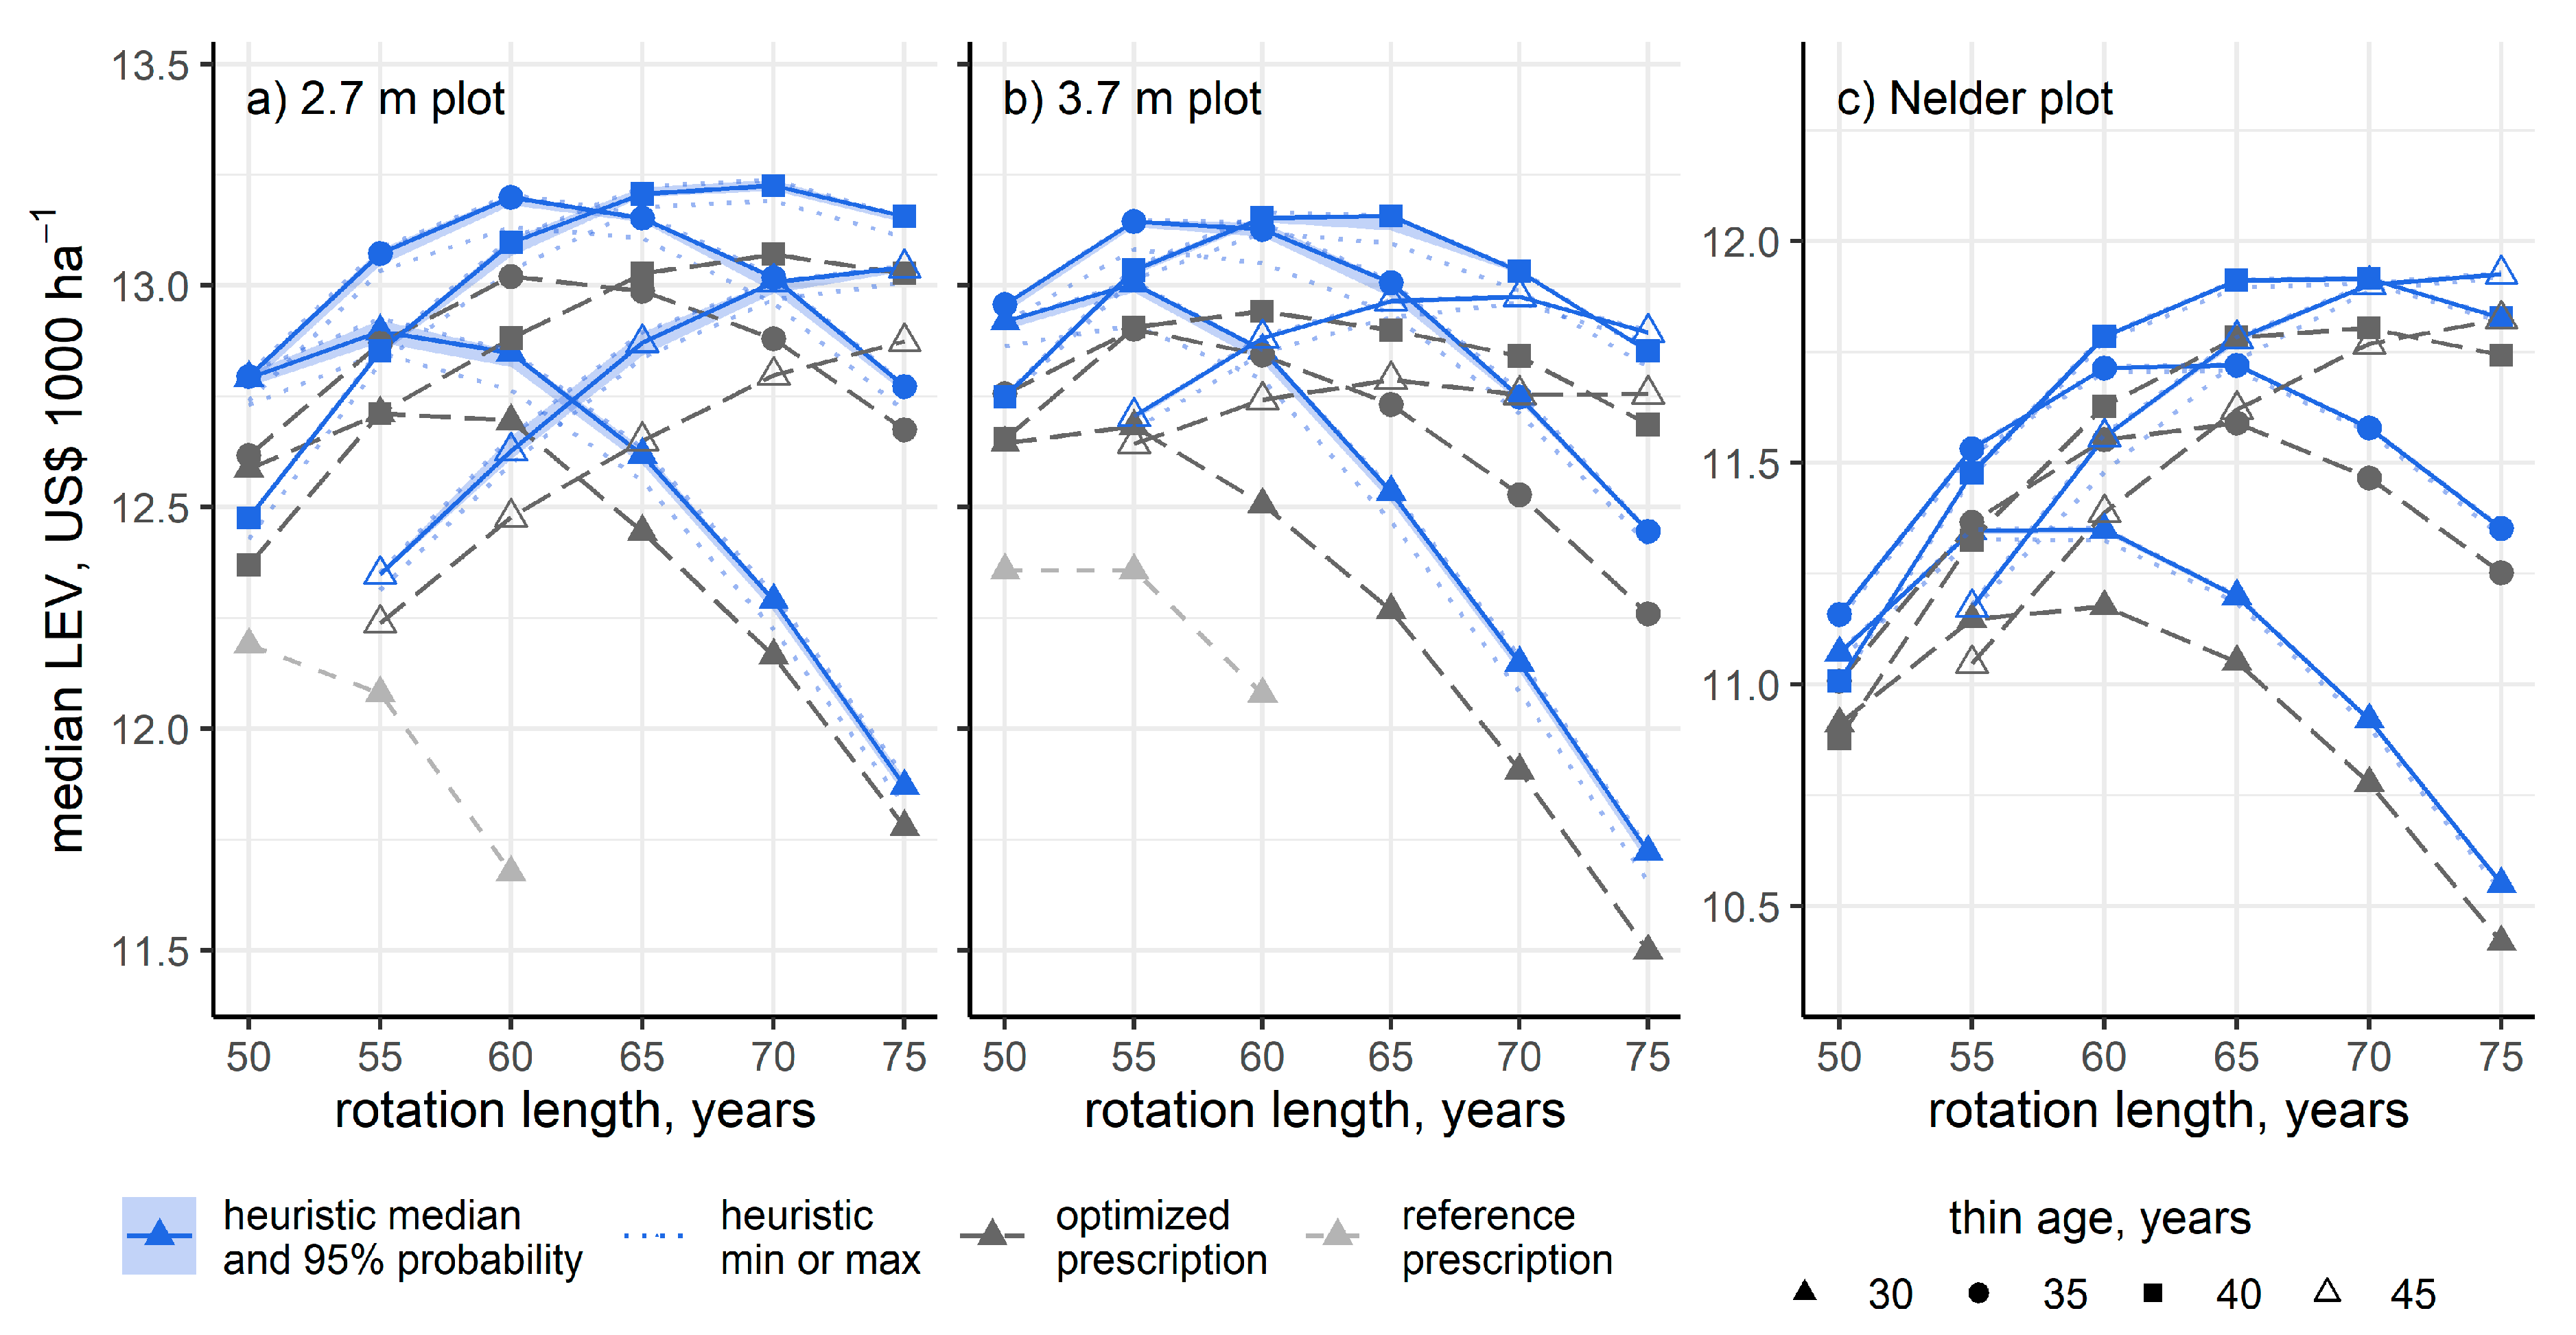
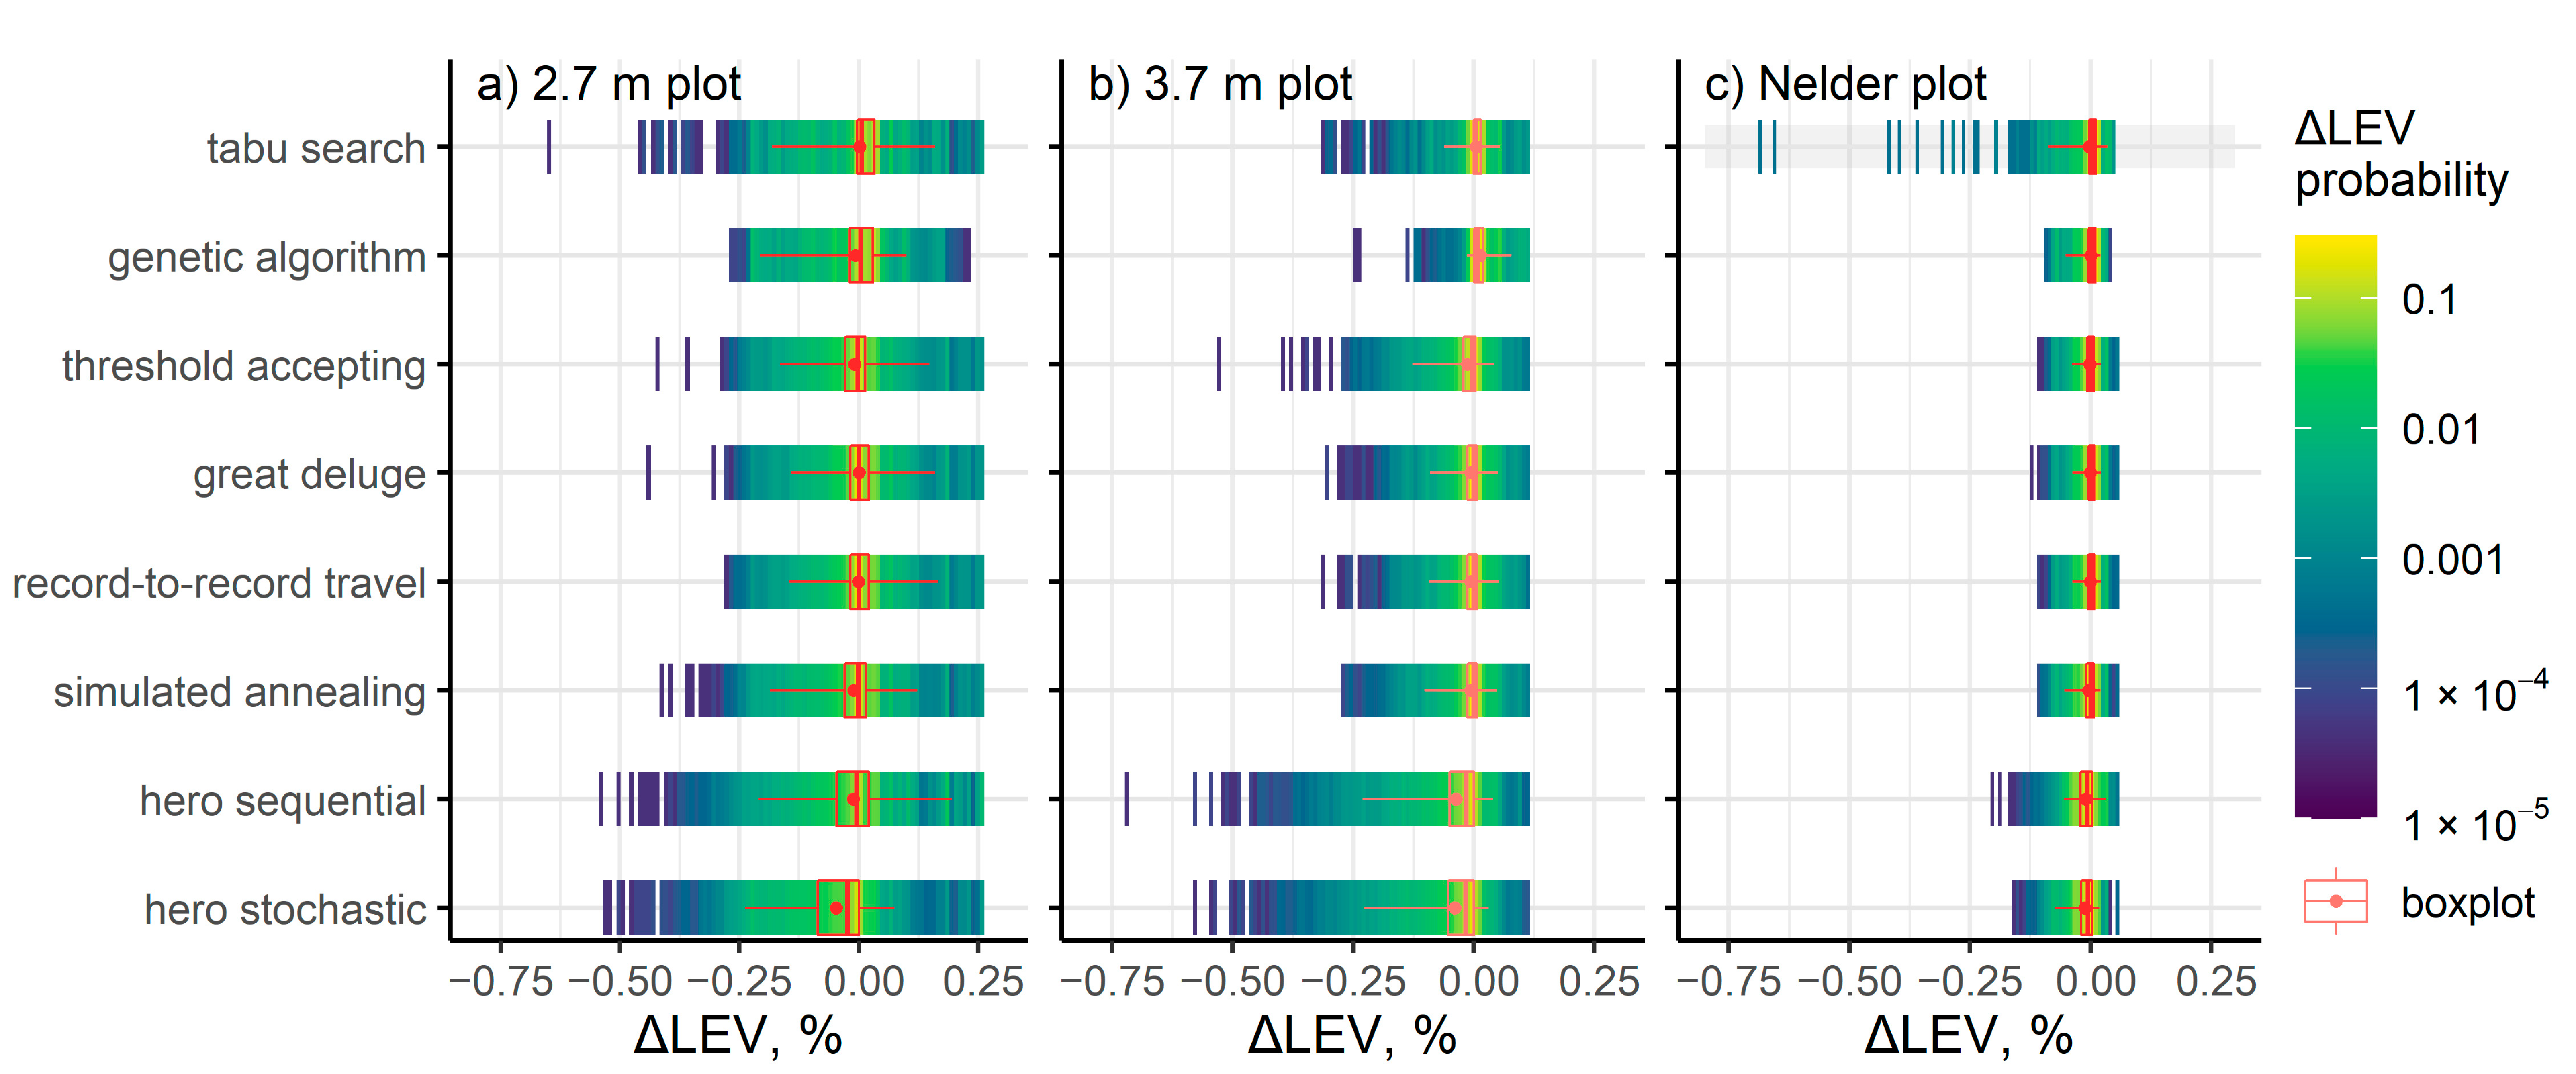
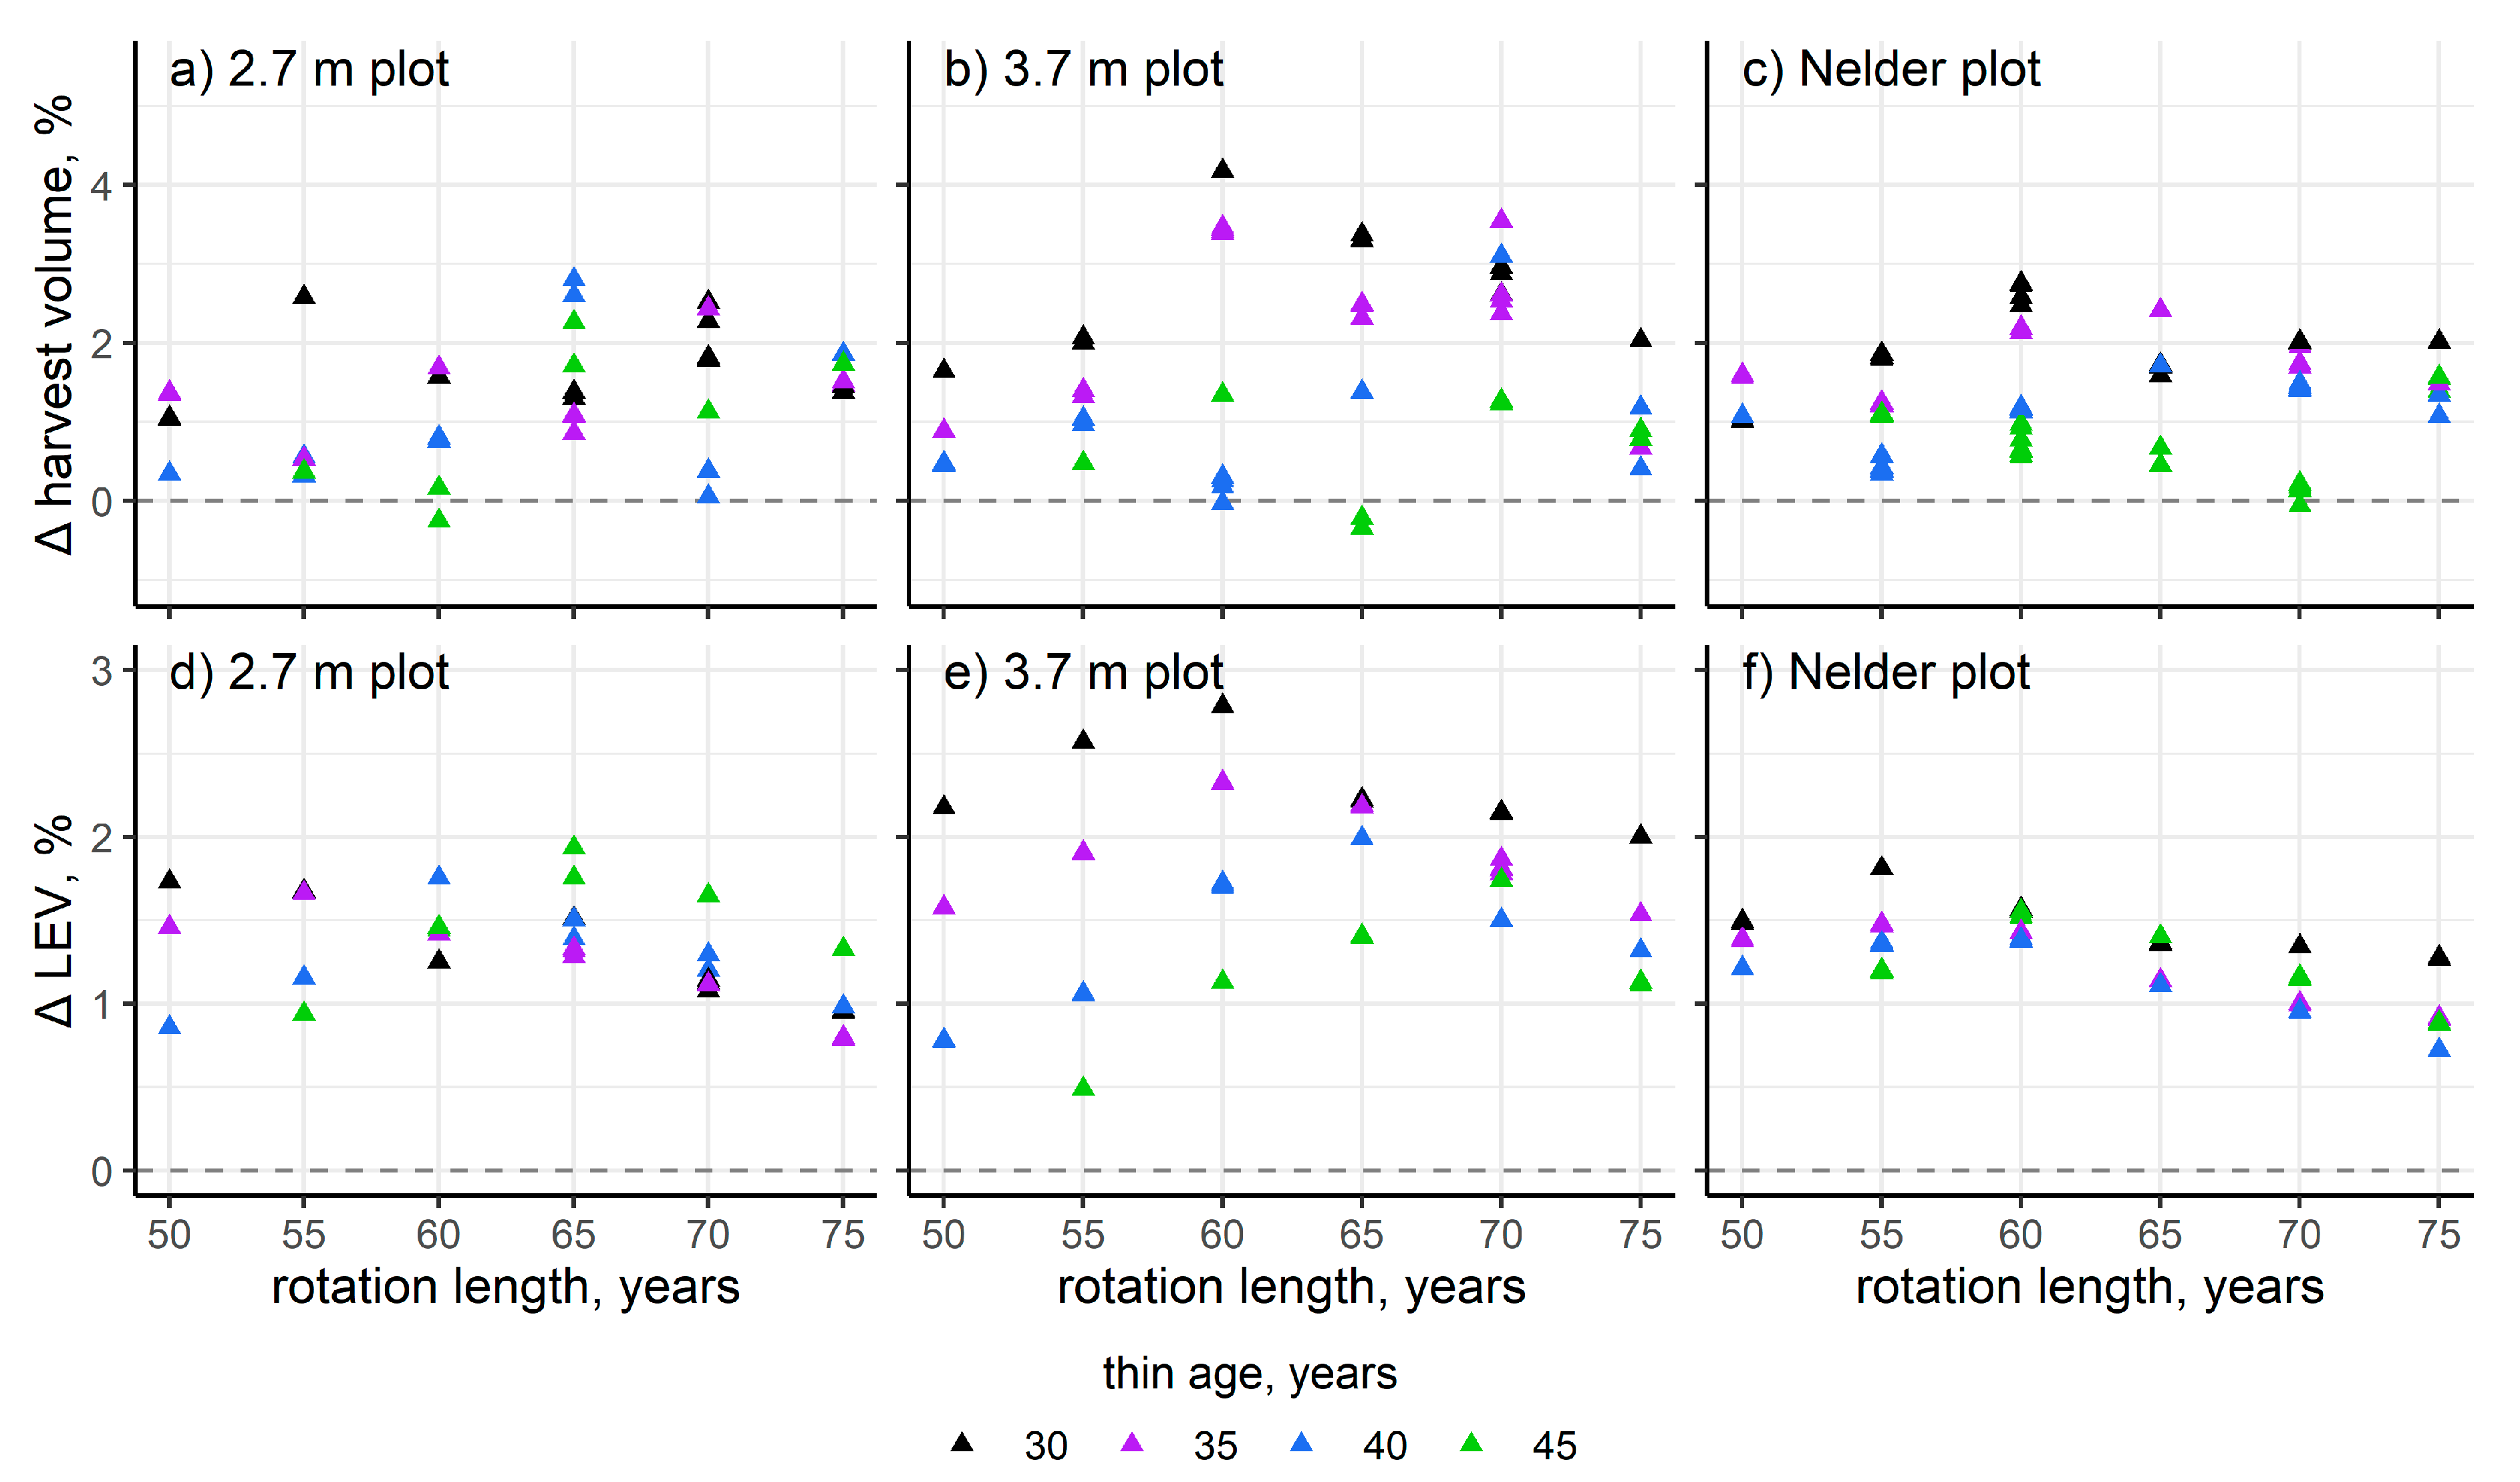
3. Results
4. Discussion
5. Conclusions
Supplementary Materials
Author Contributions
Funding
Data Availability Statement
Acknowledgments
Conflicts of Interest
References
- Viitala, E.-J. The Discovery of the Faustmann Formula in Natural Resource Economics. Hist. Political Econ. 2013, 45, 523–548. [Google Scholar] [CrossRef]
- Çağlayan, İ.; Yeşil, A.; Çınar, D.; Cieszewski, C. Taxonomy for the optimization in forest management: A review and assessment. Forestist 2018, 68, 122–135. [Google Scholar] [CrossRef]
- Pascual, A. Multi-objective forest planning at tree-level combining mixed integer programming and airborne laser scanning. For. Ecol. Manag. 2020, 118714. [Google Scholar] [CrossRef]
- Halbritter, A. An economic analysis of thinning intensity and thinning type of a two-tiered even-aged Forest stand. For. Policy Econ. 2020, 111, 102054. [Google Scholar] [CrossRef]
- Fransson, P.; Franklin, O.; Lindroos, O.; Nilsson, U.; Brännström, Å. A simulation-based approach to a near-optimal thinning strategy: Allowing harvesting times to be determined for individual trees. Can. J. For. Res. 2019, 320–331. [Google Scholar] [CrossRef]
- Jin, X.; Pukkala, T.; Li, F. A new approach to the development of management instructions for tree plantations. For. Int. J. For. Res. 2019, 92, 196–205. [Google Scholar] [CrossRef]
- Xue, H.; Mäkelä, A.; Valsta, L.; Vanclay, J.K.; Cao, T. Comparison of population-based algorithms for optimizing thinnings and rotation using a process-based growth model. Scand. J. For. Res. 2019, 34, 458–468. [Google Scholar] [CrossRef]
- Vauhkonen, J.; Pukkala, T. Selecting the trees to be harvested based on the relative value growth of the remaining trees. Eur. J. For. Res. 2016, 135, 581–592. [Google Scholar] [CrossRef]
- Messerer, K.; Kacprowski, T.; Kolo, H.; Baumbach, J.; Knoke, T. Importance of considering the growth response after partial harvesting and economic risk of discounted net revenues when optimizing uneven-aged forest management. Can. J. For. Res. 2020, 50, 487–499. [Google Scholar] [CrossRef]
- Chang, S.J. Twenty one years after the publication of the generalized Faustmann formula. For. Policy Econ. 2020, 118, 102238. [Google Scholar] [CrossRef]
- Yoshimoto, A.; Asante, P.; Konoshima, M. Stand-Level Forest Management Planning Approaches. Curr. For. Rep. 2016, 2, 163–176. [Google Scholar] [CrossRef]
- Maher, C.T.; Oja, E.; Marshall, A.; Cunningham, M.; Townsend, L.; Worley-Hood, G.; Robinson, L.R.; Margot, T.; Lyons, D.; Fety, S.; et al. Real-Time Monitoring with a Tablet App Improves Implementation of Treatments to Enhance Forest Structural Diversity. J. For. 2019, 117, 280–292. [Google Scholar] [CrossRef]
- Martí, R.; Pardalos, P.M.; Resende, M.G.C. (Eds.) Handbook of Heuristics; Springer International Publishing: Cham, Switzerland, 2018; ISBN 978-3-319-07123-7. [Google Scholar]
- Lavender, D.P.; Hermann, R.K. Douglas-Fir: The Genus Pseudotsuga; College of Forestry, Oregon State University: Corvallis, OR, USA, 2014. [Google Scholar]
- Puettmann, K.; Ares, A.; Burton, J.; Dodson, E. Forest Restoration Using Variable Density Thinning: Lessons from Douglas-Fir Stands in Western Oregon. Forests 2016, 7, 310. [Google Scholar] [CrossRef]
- Weiskittel, A.R.; Hann, D.W.; Kershaw, J.A.; Vanclay, J.K. Forest Growth and Yield Modeling; Wiley-Blackwell: Chichester, UK, 2011; ISBN 978-0-470-66500-8. [Google Scholar]
- Brackett, M. Notes on Tarif Tree Computation. Resource Management Report No. 24, Department of Natural Resources, State of Washington. 1977. Available online: https://www.fs.fed.us/forestmanagement/products/measurement/volume/nvel/index.php (accessed on 26 February 2021).
- University of British Columbia [Dataset] RP 1957-05 Influence of Spacing on Growth of Douglas-fir, Western Hemlock, and Western Red Cedar in Plantations. Malcolm Knapp Research Forest, University of British Columbia, Canada. 2007. Available online: https://www.mkrf.forestry.ubc.ca/research/research-projects-database/ (accessed on 26 February 2021).
- Reukema, D.L.; Smith, H.G. Development over 25 Years of Douglas-Fir, Western Hemlock, and Western Redcedar Planted at Various Spacings on A Very Good Site in British Columbia; Research Paper PNW-RP-381; Pacific Northwest Research Station: Olympia, WA, USA; U.S. Forest Service: Olympia, WA, USA, 1987. [Google Scholar] [CrossRef]
- Mathys, A.; Coops, N.C.; Waring, R.H. Soil water availability effects on the distribution of 20 tree species in western North America. For. Ecol. Manag. 2014, 313, 144–152. [Google Scholar] [CrossRef]
- Wolf, E.C.; Mitchell, A.P.; Schoonmaker, P.K. The Rain Forests of Home: An Atlas of People and Place. Part 1: Natural Forests and Native Languages of the Coastal Temperate Rainforest. Available online: https://ecotrust.org/wp-content/uploads/Rainforests_of_Home.pdf (accessed on 26 February 2021).
- Bettinger, P.; Graetz, D.; Boston, K.; Sessions, J.; Chung, W. Eight heuristic planning techniques applied to three increasingly difficult wildlife planning problems. Silva Fenn. 2002, 36. [Google Scholar] [CrossRef]
- Pukkala, T.; Kurttila, M. Examining the performance of six heuristic optimisation techniques in different forest planning problems. Silva Fenn. 2005, 39. [Google Scholar] [CrossRef]
- Martín-Fernández, S.; García-Abril, A. Optimisation of spatial allocation of forestry activities within a forest stand. Comput. Electron. Agric. 2005, 49, 159–174. [Google Scholar] [CrossRef]
- Bettinger, P.; Tang, M. Tree-Level Harvest Optimization for Structure-Based Forest Management Based on the Species Mingling Index. Forests 2015, 6, 1121–1144. [Google Scholar] [CrossRef]
- Pukkala, T.; Kangas, J. A Heuristic Optimization Method for Forest Planning and Decision Making. Scand. J. For. Res. 1993, 8, 560–570. [Google Scholar] [CrossRef]
- Kirkpatrick, S.; Gelatt, C.D.; Vecchi, M.P. Optimization by Simulated Annealing. Science 1984, 220, 671–680. [Google Scholar] [CrossRef] [PubMed]
- Dueck, G. New Optimization Heuristics: The Great Deluge Algorithm and the Record-to-Record Travel. J. Comput. Phys. 1993, 104, 86–92. [Google Scholar] [CrossRef]
- Dueck, G.; Scheuer, T. Threshold Accepting: A General Purpose Optimization Algorithm Appearing Superior to Simulated Annealing. J. Comput. Phys. 1990, 90, 161–175. [Google Scholar] [CrossRef]
- Lozano, M.; Herrera, F.; Cano, J.R. Replacement strategies to preserve useful diversity in steady-state genetic algorithms. Inf. Sci. 2008, 178, 4421–4433. [Google Scholar] [CrossRef]
- Glover, F. Tabu search—Part I. ORSA J. Comput. 1989, 1, 190–206. [Google Scholar] [CrossRef]
- Emmingham, W.; Fletcher, R.; Fitzgerald, S.; Bennett, M. Comparing Tree and Stand Volume Growth Response to Low and Crown Thinning in Young Natural Douglas-fir Stands. West. J. Appl. For. 2007, 22, 124–133. [Google Scholar] [CrossRef]
- Lu, Y.; Coops, N.C.; Bolton, D.K.; Wang, T.; Wang, G. Comparing Stem Volume Predictions of Coastal Douglas-Fir Stands in British Columbia Using a Simple Physiological Model and LiDAR Remote Sensing. For. Sci. 2015, 61, 586–596. [Google Scholar] [CrossRef]
- Holopainen, M.; Vastaranta, M.; Rasinmäki, J.; Kalliovirta, J.; Mäkinen, A.; Haapanen, R.; Melkas, T.; Yu, X.; Hyyppä, J. Uncertainty in timber assortment estimates predicted from forest inventory data. Eur. J. For. Res. 2010, 129, 1131–1142. [Google Scholar] [CrossRef]
- Saukkola, A.; Melkas, T.; Riekki, K.; Sirparanta, S.; Peuhkurinen, J.; Holopainen, M.; Hyyppä, J.; Vastaranta, M. Predicting Forest Inventory Attributes Using Airborne Laser Scanning, Aerial Imagery, and Harvester Data. Remote Sens. 2019, 11, 797. [Google Scholar] [CrossRef]
- Adam, S.P.; Alexandropoulos, S.-A.N.; Pardalos, P.M.; Vrahatis, M.N. No Free Lunch Theorem: A Review. In Approximation and Optimization; Demetriou, I.C., Pardalos, P.M., Eds.; Springer Optimization and Its Applications; Springer International Publishing: Cham, Switzerland, 2019; Volume 145, pp. 57–82. ISBN 978-3-030-12766-4. [Google Scholar]
- Prügel-Bennett, A. Benefits of a Population: Five Mechanisms That Advantage Population-Based Algorithms. IEEE Trans. Evol. Comput. 2010, 14, 500–517. [Google Scholar] [CrossRef]
- Hann, D.W.; Marshall, D.D.; Hanus, M.L. Equations for Predicting Height-to-crown-base, 5-year Diameter-Growth Rate, 5-Year height-Growth Rate, 5-year Mortality Rate, and Maximum Size-Density Trajectory for Douglas-Fir and Western Hemlock in the Coastal Region of the Pacific Northwest. Research Contribution 40, Forest Research Laboratory, Oregon State University. 2003. Available online: https://ir.library.oregonstate.edu/concern/technical_reports/jd472x893 (accessed on 26 February 2021).
- Maguire, D. Personal Communication on Organon Model Bias; Oregon State University, Center for Intensive Planted-Forest Silviculture: Corvallis, OR, USA, 2020. [Google Scholar]
- Henderson, D.; Jacobson, S.H.; Johnson, A.W. Theory and Practice of Simulated Annealing. In Handbook of Metaheuristics; Kluwer Academic Publishers: Dordrecht, The Netherlands, 2003. [Google Scholar]
- Battiti, R.; Brunato, M.; Mascia, F. Reactive Search and Intelligent Optimization; Springer Science+Business Media: New York, NY, USA, 2009. [Google Scholar]
- Goh, S.L.; Kendall, G.; Sabar, N.R. Simulated annealing with improved reheating and learning for the post enrolment course timetabling problem. J. Oper. Res. Soc. 2019, 70, 872–888. [Google Scholar] [CrossRef]
- McMullan, P. An Extended Implementation of the Great Deluge Algorithm for Course Timetabling. In Computational Science—ICCS 2007; Lecture Notes in Computer Science; Springer: Berlin/Heidelberg, Germany, 2007; Volume 4487. [Google Scholar]
- Hu, T.C.; Kahng, A.B.; Tsao, C.-W.A. Old Bachelor Acceptance: A New Class of Non-Monotone Threshold Accepting Methods. ORSA J. Comput. 1995, 7, 417–425. [Google Scholar] [CrossRef]
- Kramer, O. Genetic Algorithm Essentials; Springer: Cham, Switzerland, 2017. [Google Scholar]
- Thompson, M.P.; Hamann, J.D.; Sessions, J. Selection and Penalty Strategies for Genetic Algorithms Designed to Solve Spatial Forest Planning Problems. Int. J. For. Res. 2009, 2009, 527392. [Google Scholar] [CrossRef]
- Črepinšek, M.; Liu, S.-H.; Mernik, M. Exploration and Exploitation in Evolutionary Algorithms: A Survey. ACM Comput. Surv. (CSUR) 2013, 43, 35. [Google Scholar] [CrossRef]
- Nelder, J.A. New Kinds of Systematic Designs for Spacing Experiments. Biometrics 1962, 18, 283–307. [Google Scholar] [CrossRef]


| Study | Year | Tree Species | Objectives | Optimization Methods |
|---|---|---|---|---|
| this study | 2020 | Douglas-fir | LEV | Eight heuristics |
| Pascual [3] | 2020 | Stone pine | Value increment and spacing | Mixed integer programming |
| Halbritter [4] | 2020 | Any | LEV | Analytic |
| Fransson et al. [5] | 2019 | Norway spruce | LEV | Genetic algorithm (heuristic) |
| Jin et al. [6] | 2019 | Changbai larch | NPV | Particle swarm (heuristic) |
| Xue et al. [7] | 2019 | Scots pine | LEV | Five population heuristics |
| Vaukhonen and Pukkala [8] | 2016 | ≥95% Norway spruce | Value increment | Iterative |
| Parameter | Value |
|---|---|
| Reforestation cost, NPVreforestation | US$ 813 ha−1 + US$0.50 seedling ha−1 |
| Discount rate, r | 4% year−1 |
| Thinning age, T | 30–45 years in 5-year increments |
| Rotation length, R | 50–75 years in 5-year increments |
| Selection vector of individual trees, ui | controlled by heuristic |
| Volume of Douglas-fir j at thinning, Vthin,j | MBF ha−1 from growth and yield models |
| Mean Douglas-fir pond value at thinning, (T) | US$453.67 + 2.776T MBF−1, 7.3 m logs |
| Douglas-fir real appreciation rate, a | 1% year−1 within rotation |
| Fixed thinning cost, Cthin,fixed | US$148 ha−1 |
| Variable thinning cost, Cthin,variable | US$275 MBF−1 |
| Volume of Douglas-fir j at final harvest, Vfinal,i,j | MBF ha−1 from growth and yield models |
| Mean Douglas-fir pond value at final harvest, (R) | US$567.56 + 0.365R MBF−1, 12.2 m logs |
| Fixed final harvest cost, Cfinal,fixed | US$247 ha−1 |
| Variable final harvest cost, Cfinal,variable | US$250 MBF−1 |
| Annual management cost, Cannual | US$18.50 ha−1 |
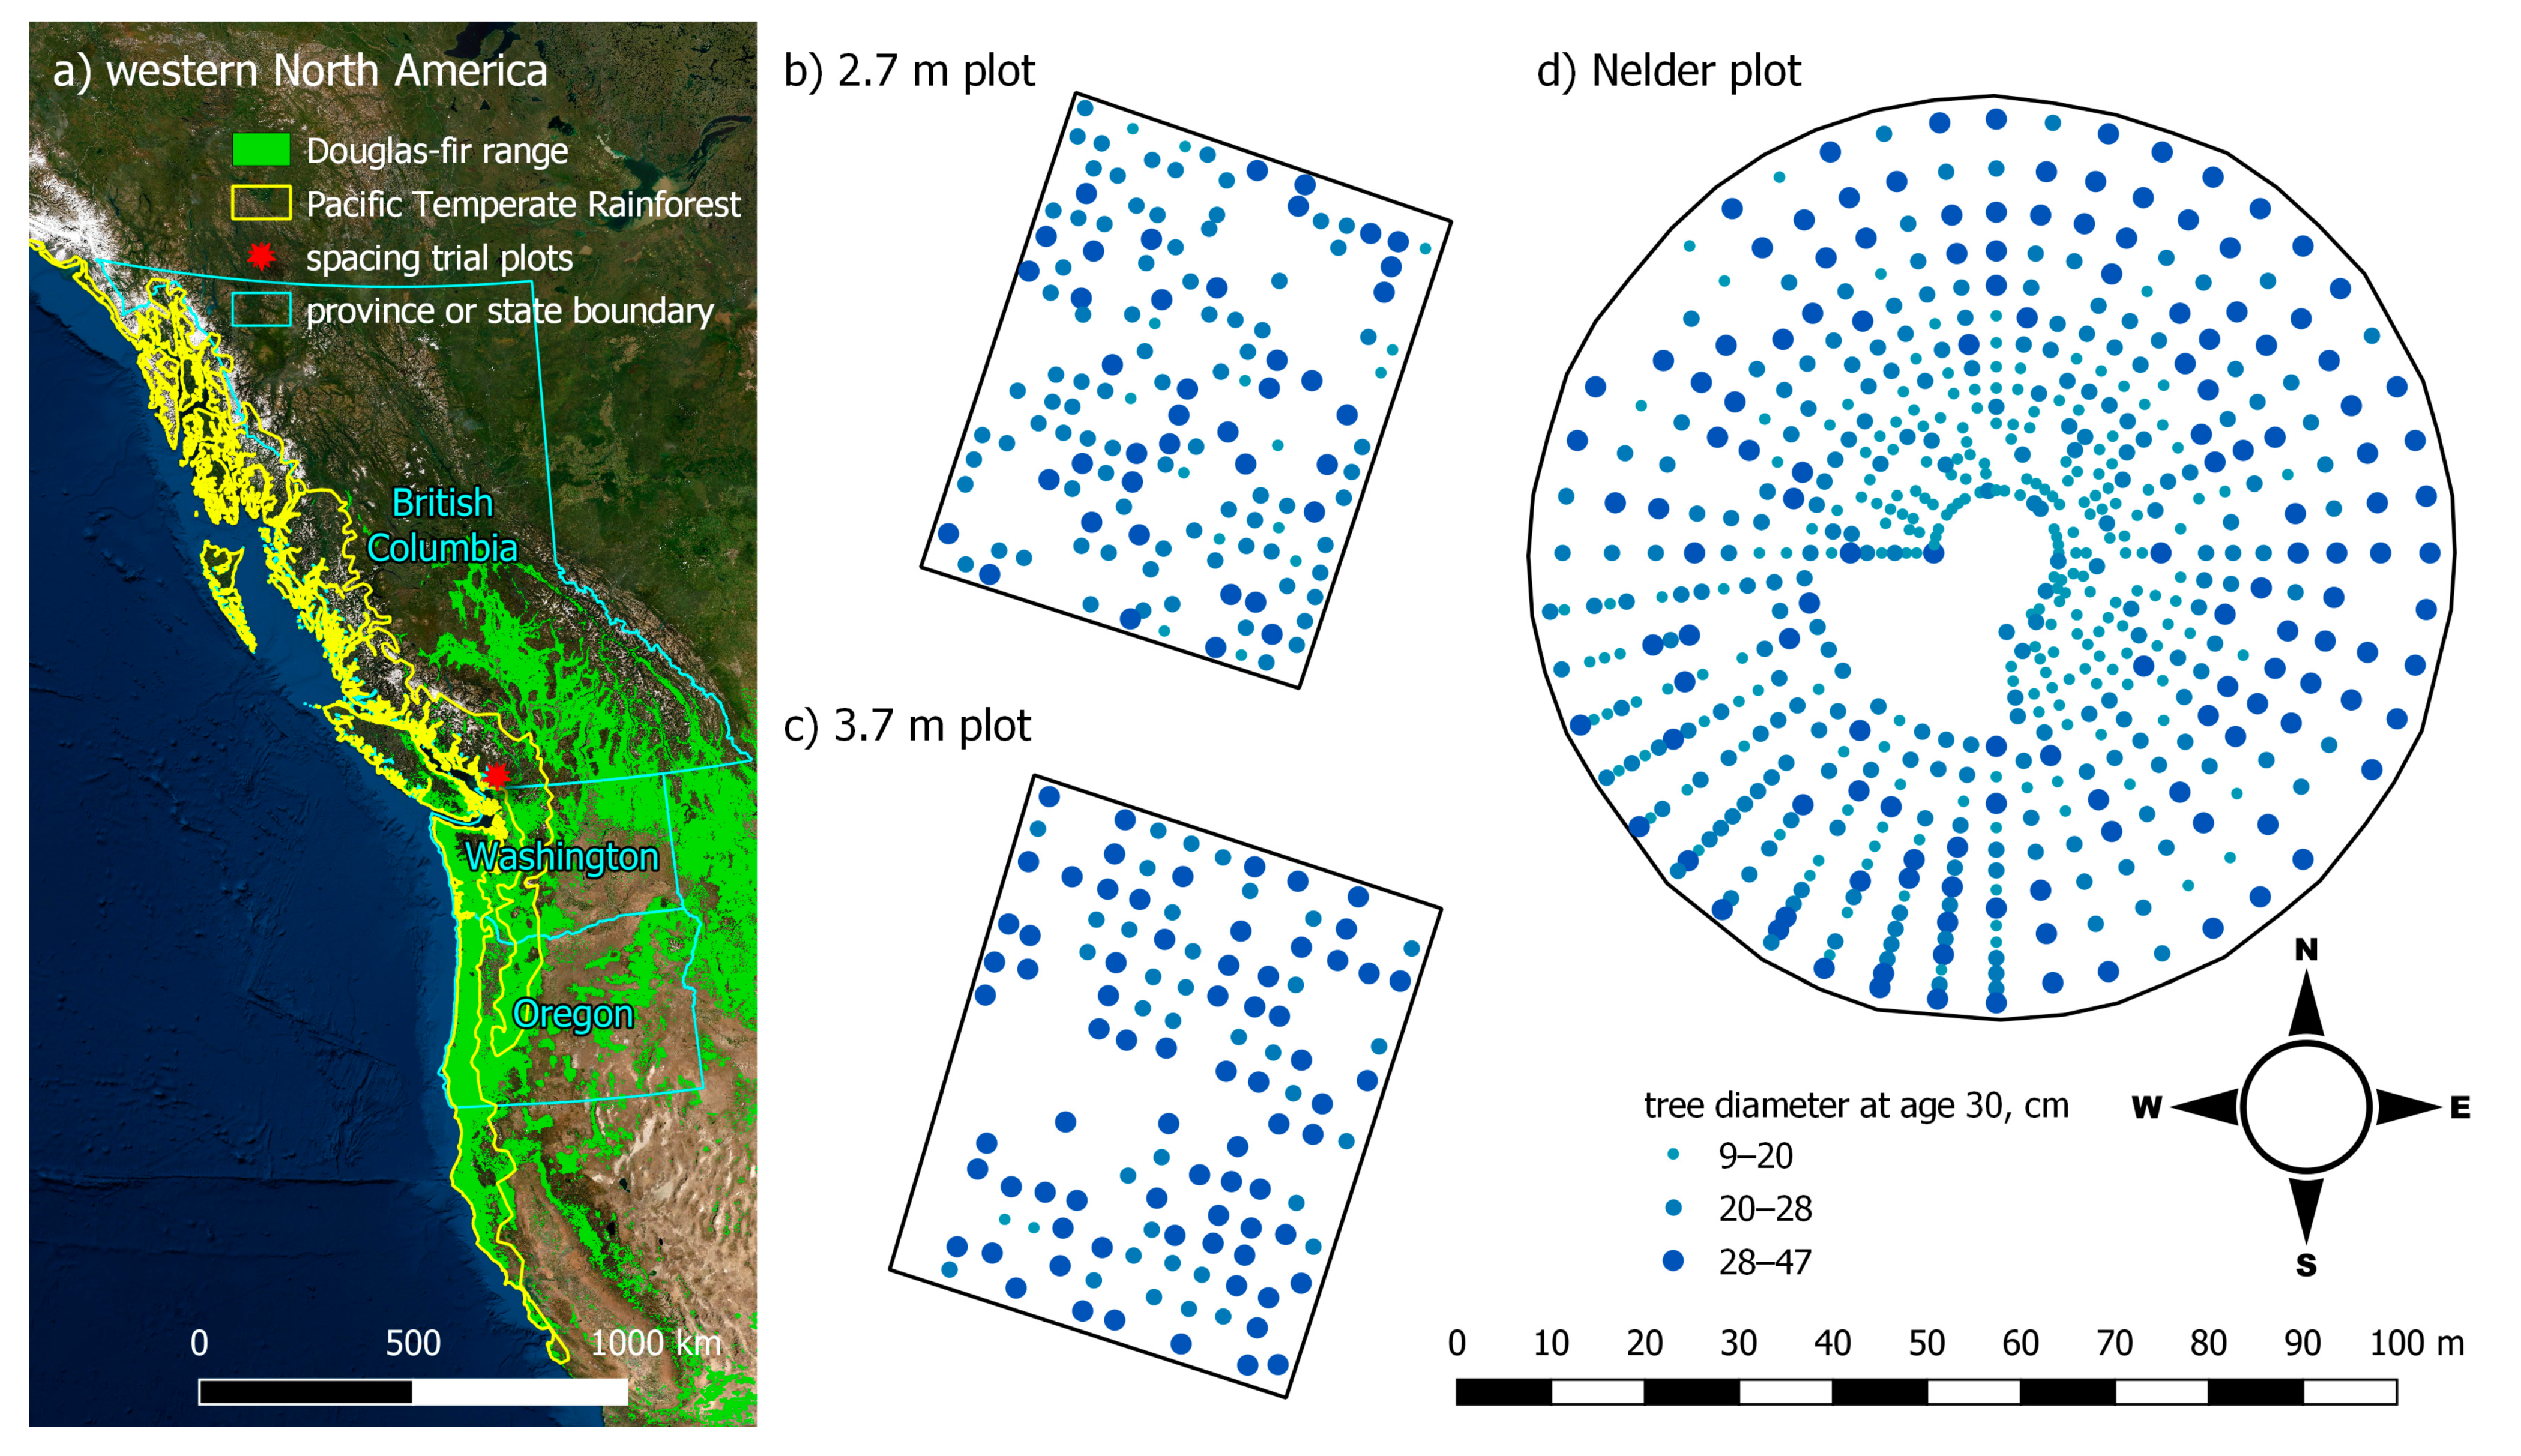
| Plot Spacing | Area (ha) | Live Trees | Mean Density (TPH) | QMD (cm) | H100 (m) | Mean Planting Density (TPH) | Tree Heights Imputed |
|---|---|---|---|---|---|---|---|
| 2.7 m square | 0.25 | 222 | 996 | 29.5 | 27.0 | 1278 | 0 |
| 3.7 m square | 0.22 | 147 | 596 | 23.3 | 28.3 | 730 | 0 |
| Nelder radial | 0.75 | 571 | 757 | 24.1 | 28.6 | 1035 | 4 |
| Heuristic | Cost Including Growth Model | Optimization Mechanisms | Parameters |
|---|---|---|---|
| hero stochastic [this study] | ~O(N2 log N) | sampling without replacement | 0 |
| hero sequential [26] | sequential iteration | 0 | |
| Simulated annealing [27] | ~O(19N2) | sampling with replacement, reheating | 6 |
| Record-to-record travel [28] | 4 | ||
| Threshold accepting [29] | 1 or 4+ | ||
| Great deluge [28] | 5 | ||
| Steady state genetic algorithm [30] | ~O(60N2.6) | parent selection, uniform crossover, mutation, replacement | 4 |
| Tabu search [31] | ~O(N3/log N) | steepest ascent, tenure | 1–2 |
| Rotation Length (Years) | 2.7 m Plot Increase in | 3.7 m Plot Increase in | ||
|---|---|---|---|---|
| Volume (%) | LEV (%) | Volume (%) | LEV (%) | |
| 50 | 2.37 | 5.05 | 3.26 | 4.55 |
| 55 | 1.02 | 7.00 | 2.66 | 5.27 |
| 60 | 0.59 | 10.1 | 2.20 | 6.42 |
Publisher’s Note: MDPI stays neutral with regard to jurisdictional claims in published maps and institutional affiliations. |
© 2021 by the authors. Licensee MDPI, Basel, Switzerland. This article is an open access article distributed under the terms and conditions of the Creative Commons Attribution (CC BY) license (http://creativecommons.org/licenses/by/4.0/).
Share and Cite
West, T.; Sessions, J.; Strimbu, B.M. Heuristic Optimization of Thinning Individual Douglas-Fir. Forests 2021, 12, 280. https://doi.org/10.3390/f12030280
West T, Sessions J, Strimbu BM. Heuristic Optimization of Thinning Individual Douglas-Fir. Forests. 2021; 12(3):280. https://doi.org/10.3390/f12030280
Chicago/Turabian StyleWest, Todd, John Sessions, and Bogdan M. Strimbu. 2021. "Heuristic Optimization of Thinning Individual Douglas-Fir" Forests 12, no. 3: 280. https://doi.org/10.3390/f12030280
APA StyleWest, T., Sessions, J., & Strimbu, B. M. (2021). Heuristic Optimization of Thinning Individual Douglas-Fir. Forests, 12(3), 280. https://doi.org/10.3390/f12030280