Article

Parameters of Trucks and Loads in the Transport of Scots Pine Wood Biomass Depending on the Season and Moisture Content of the Load

by
Grzegorz Trzciński
1,*,
Łukasz Tymendorf
1 and
Paweł Kozakiewicz
2
1
Department of Forest Utilization, Institute of Forest Sciences, Warsaw University of Life Sciences—SGGW, 159 Nowoursynowska St., 02-776 Warsaw, Poland
2
Department of Wood Sciences and Wood Preservation, Institute of Wood Sciences and Furniture, Warsaw University of Life Sciences—SGGW, 159 Nowoursynowska St., 02-776 Warsaw, Poland
*
Author to whom correspondence should be addressed.
Forests 2021, 12(2), 223; https://doi.org/10.3390/f12020223
Submission received: 23 January 2021 / Revised: 10 February 2021 / Accepted: 12 February 2021 / Published: 15 February 2021

Abstract

:
Transport of wood biomass is one of the key operations in forestry and in the wood industry. An important part is the transport of shredded wood, where the most common forms are chips and sawdust. The aim of the research was to present the variability of the total weight of trucks (gross vehicle weight, GVW), the weight of the empty trucks (tare), and loads of chips and sawdust in different periods of the year. Changes in specific parameters were analyzed: GVW; tare weight; trailer capacity; use of the trailer load capacity; bulk volume and bulk density of wood biomass loads; solid cubic meter (m3) and weight of 1m3 of the load; and load weight depending on the season, with simultaneous measurements of wood chips and sawdust moisture. More than 250 transports from four seasons of the year were analyzed in the research. It was found that the total weight of trucks (GVW) was at a comparable level, on average from 39.42 to 39.64 Mg with slight differences (with SD 0.29 and 0.39). The weight of empty trucks was 16.15 Mg for chip-bearing trucks and 15.93 Mg for sawdust-bearing trucks (with SD 0.604 and 0.526). The type of wood material has an influence on the transported volume. The average quantity of load in the bulk cubic meter was 64.783 m3 for wood chips (SD 3.127) and 70.465 m3 (SD 2.516) for sawdust. Over 30% differences in the volume of transported wood chips and approximately 18% for sawdust were observed. The use of the loading capacity of the trailer was on average 72.58% (SD 5.567) for the transport of wood chips and 77.42% (SD 3.019) for the transport of sawdust. The sawdust bulk density was from 0.3050 to 0.4265 Mg⋅m−3 for wood chips and 0.3200 to 0.3556 Mg⋅m−3 for sawdust. This parameter is significantly dependent on moisture content, and the determined correlation functions can be used for estimating and predicting bulk density. The abovementioned absolute moisture content of chips and sawdust also depends on the season, which also affects the selected parameters of wood biomass loads.

1. Introduction

Angus-Hankin et al. [1] report that the most common transport of biomass is the transport of shavings, wood chips, and bark from the processing of roundwood. Road transport, used for the transport of chips, is often the only possible method [2], and in many countries road transport is the most popular type of transport [3].
Economically reasonable transport-distances of wood chips depend on their origin. In the production of chips from logging residues, transport distance ranges from 50 to 100 km [4,5], and in the case of chips obtained from the processing of round wood, it is up to 150 km [6]. Wolfsmayr and Rauch [7] indicate that the maximum economically reasonable distance for road transport of wood chips is equal to 145 km. In fact, these distances are longer—for example, in Poland the average distance for transporting this type of wooden materials to power plants is 340 km [8].
The shapes and sizes of the transported wood chips and their moisture content affect the bulk volume (filling empty space) and, consequently, the weight of the transported load [9]. The bulk density of the chips is 111–340 kg/m3 and depends on their moisture content (10–53%) [10,11]. The research of many authors indicates the significant importance of the moisture of the chips in the optimization of transport costs. According to Kühmaier et al. [12] the moisture should be 35% or less, and reducing the moisture by 1–7% gives a profit of 4.7–30€/24 Mg [9]. Differences in the density and moisture of wood materials may affect the load capacity, resulting from the limitations specified by the regulations [13], and at the same time their high variability may contribute to the overloading of trucks [14,15,16,17,18]. According to Schroeder et al. [19] it is difficult to maintain the maximum allowable load of trucks when transporting wood biomass. The variability of cargo moisture results in overloading the trucks in the winter months or not using the permissible weight of the truck capacity in the summer months [20]. This is a correct observation, because in the temperate climate zone in winter the moisture of wood in tree stumps of living trees is higher than in summer, and higher summer temperatures favor faster drying of the wood (loss of moisture) during its storage (after cutting). The moisture content of the fragmented biomass is most often determined by the dryer-weighing method, based on internal procedures (raw material acceptance instructions) applicable in a given company or national or even international standards. The simplified standard ISO 18134-2: 2017 [21] is used to determine the relative moisture content of solid biofuels, including shredded wood. In laboratory tests, it seems more appropriate to accurately determine the absolute moisture content, for example: based on (adaptation of) the provisions of the BS-EN 13183-1: 2002 standard [22]. More sophisticated methods, e.g., electrometric methods [23] and even with the use of X-rays [24], are also applicable.
The increasing use of shredded wood (including sawdust) with increasing transport costs forces us to look for solutions for better management of deliveries, where one of the possible actions is optimization of cargo moisture [25,26]. Reducing the wood biomass moisture allows for increased use of the cargo volume by 25%, which also contributes to a reduction in the number of trucks’ journeys by 20% [27]. In some countries (e.g., Estonia, Ireland, the Netherlands, Finland, Sweden), in order to improve the economics of timber transport, the gross vehicle weight (GVW) of trucks is increased from 40 (44) Mg to 60, and even to 92 Mg [28,29,30,31,32,33].
Good identification of the truck configuration for timber adapted to operational and legal requirements, their own weight, and the possibility of loading timber, with a simultaneous large variation in the weight of the load, may contribute to the improvement of the efficiency of forest transport [34,35,36].
Knowing the actual weight of the transported loads (wood chips and sawdust) and trying to relate them to GVW and load moisture will avoid overloading and increase the load capacity of trucks. This information is of great importance for transport companies as well as producers and buyers of wood biomass.
The aim of the research was to present the variability of the total weight of trucks (GVW), the weight of the empty trucks (tare) and loads of chips and sawdust in different periods of the year. Changes in specific parameters were analyzed: GVW; tare weight; trailer capacity; use of the trailer load capacity; bulk volume and bulk density of wood biomass loads; solid cubic meter (m3) and weight of 1m3 of the load; and load weight depending on the season, with simultaneous measurements of wood chips and sawdust moisture.

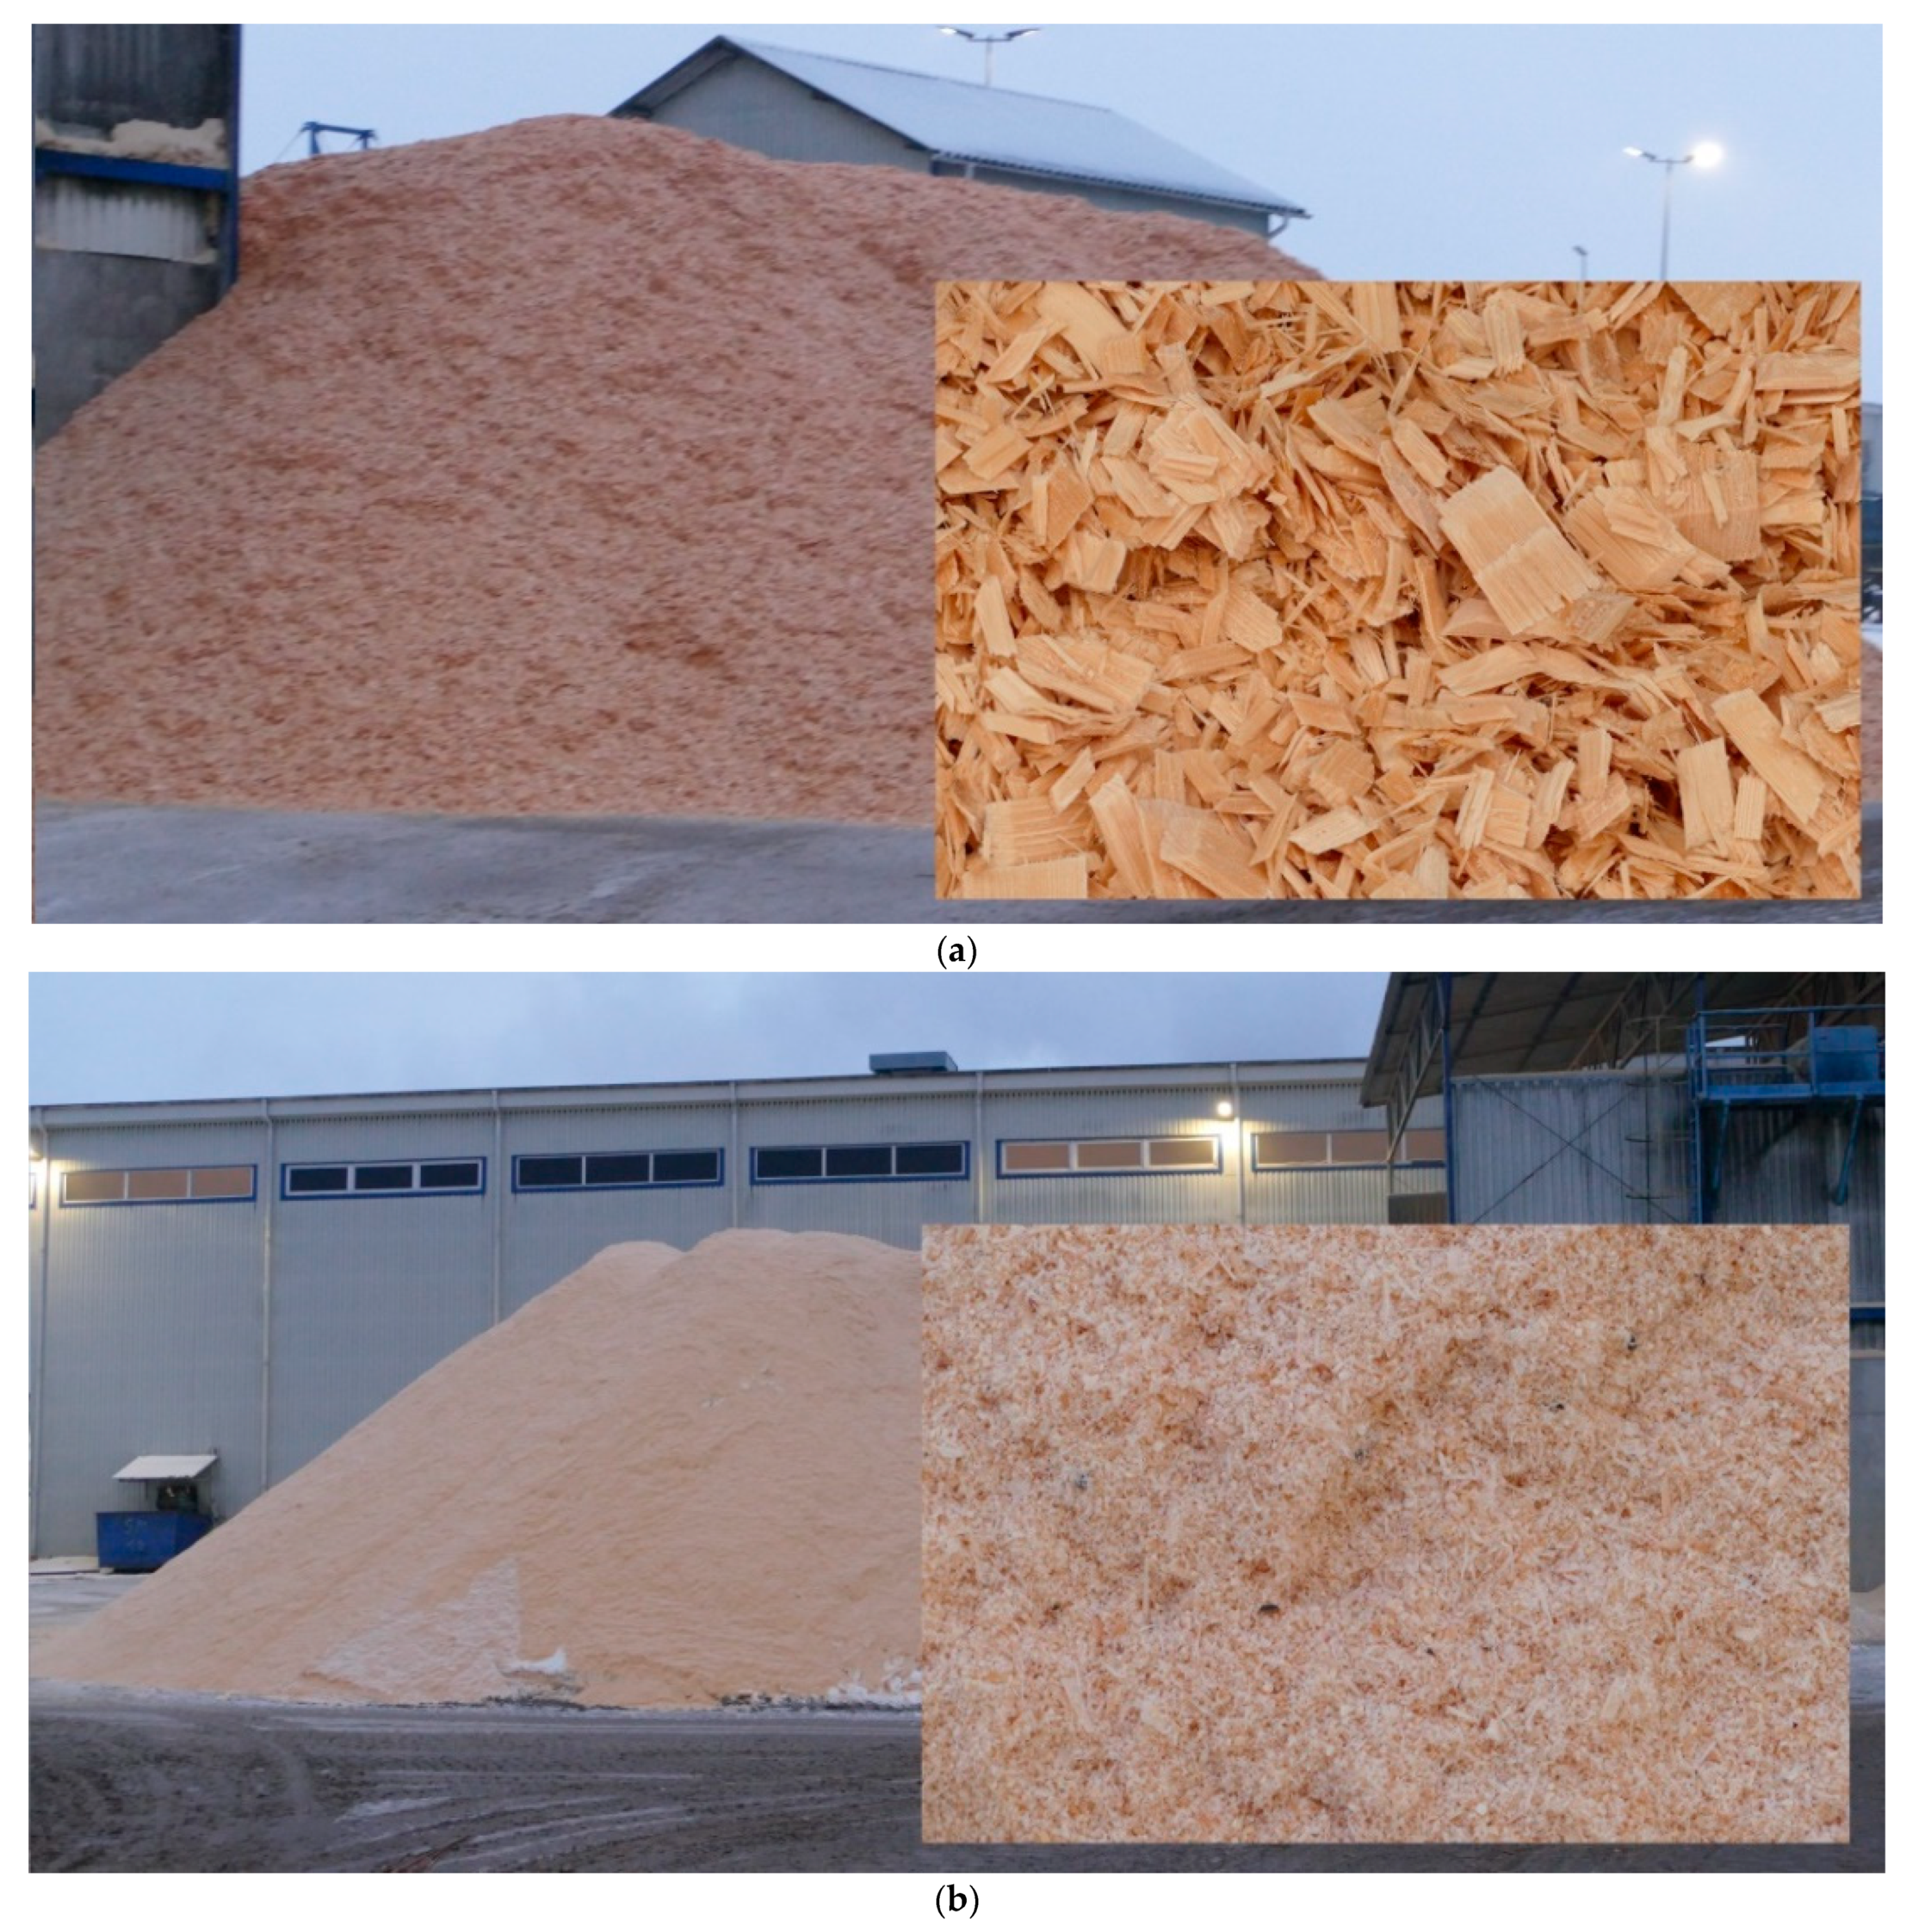
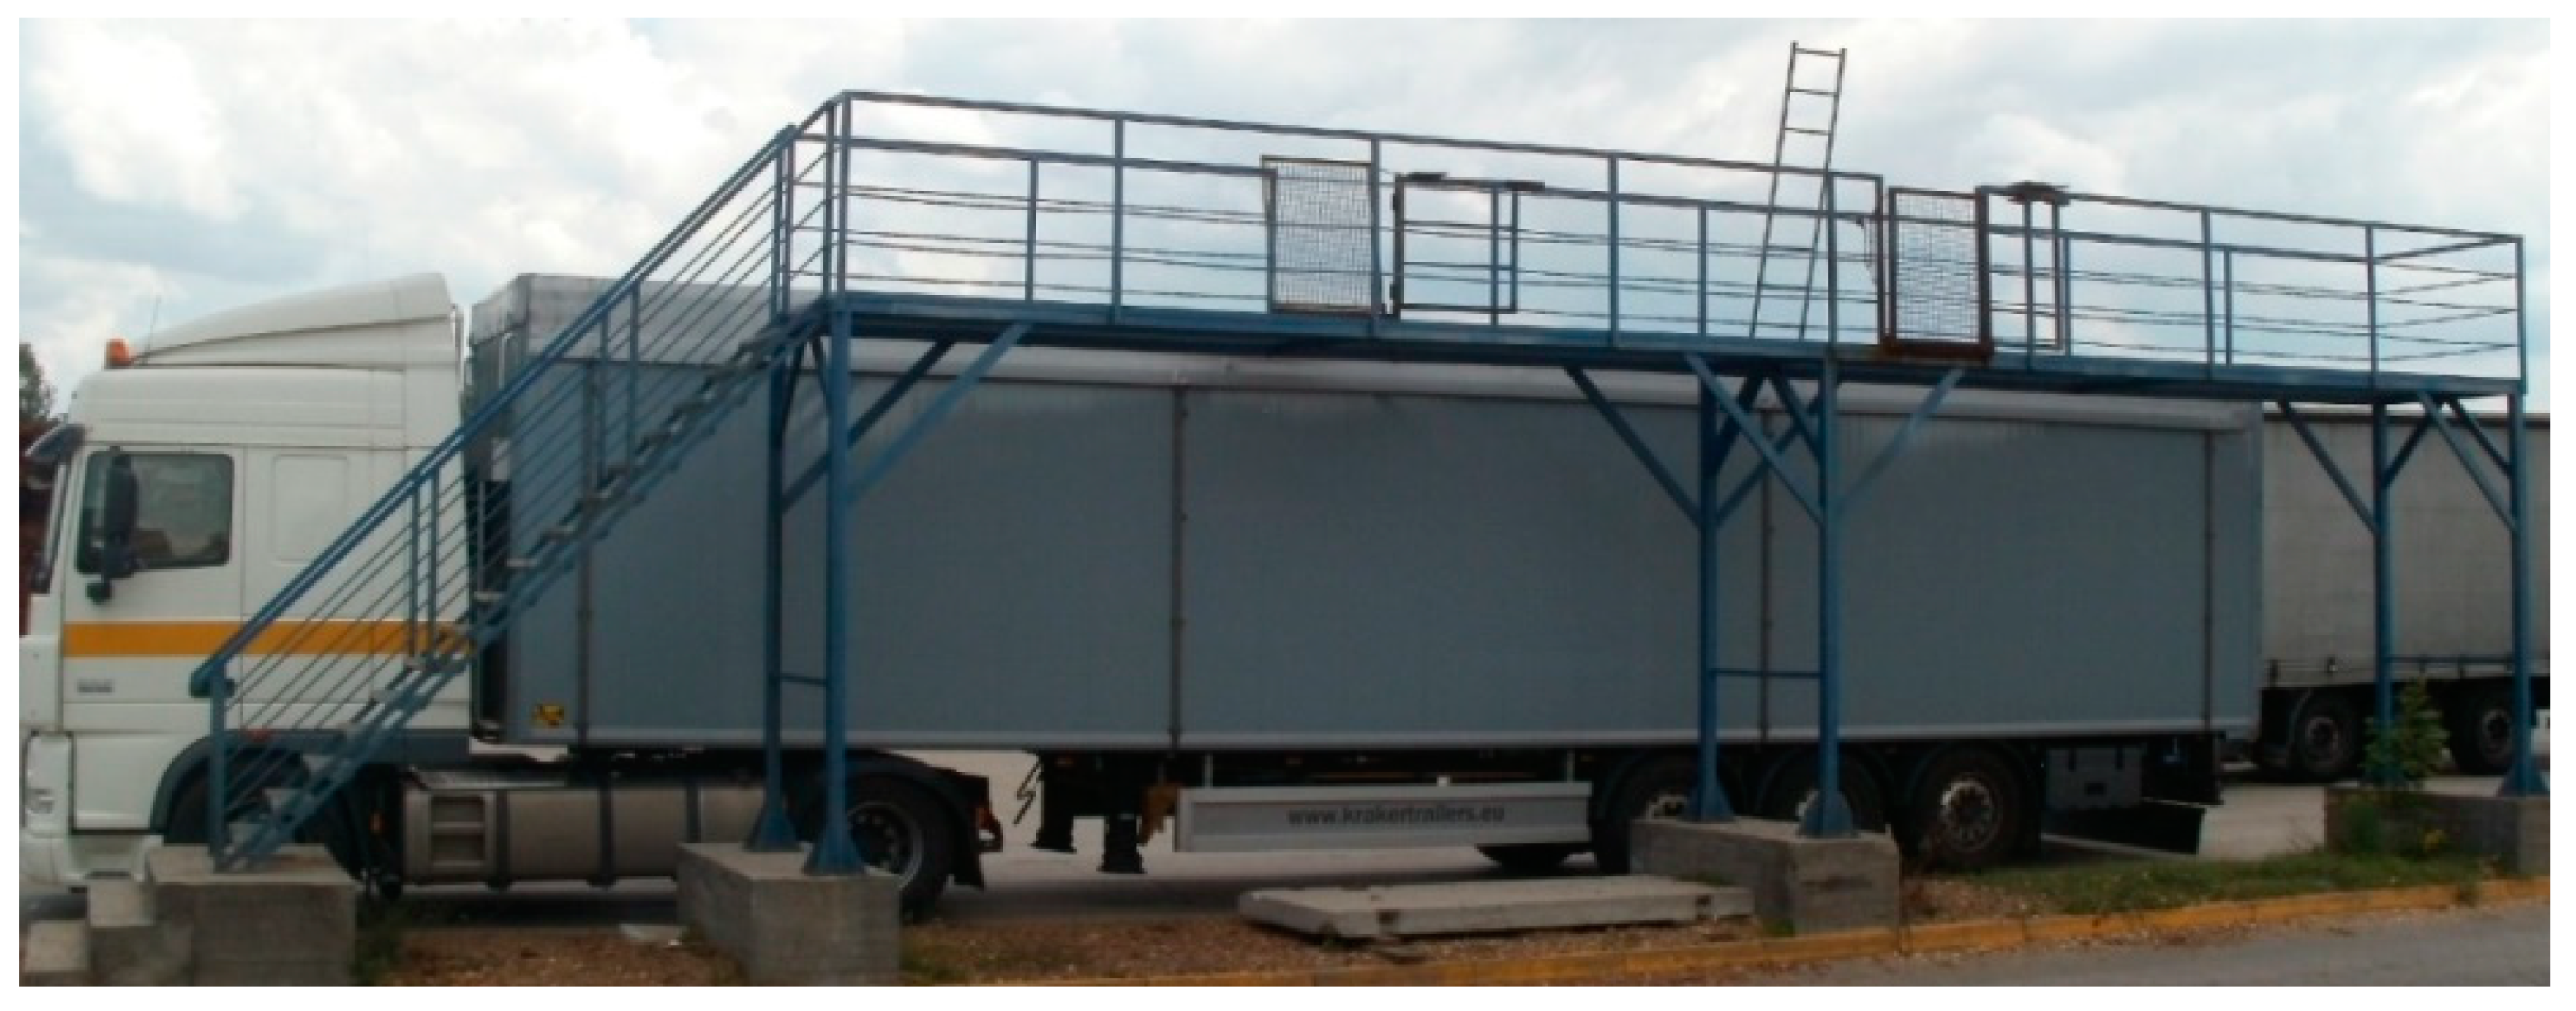
2. Materials and Methods

In order to conduct the research and perform the relevant analyses, shipments of wood chips and sawdust from one of the largest sawmills in Poland were used (Figure 1). Chips and sawdust formed as sawmill byproducts in the production of solid wood furniture in the processing phase of round wood, large-size Scots pine (Pinus sylvestris L.). In the factory, previously debarked roundwood is sawn on a line consisting of chipper canter and bandsaws. Sawdust and wood chips are without bark (white chips). Transport from the sawmill to the customer was carried out by external professional companies.
In the conducted research, 254 transports were analyzed, including 211 with wood chips and 43 with sawdust, in different periods of the year. The research was carried out during four seasons of the year. In November (autumn) 2018 and February (winter), April (spring), and June (summer) 2019.
The total weight of trucks (GVW) expressed in Mg is understood as the actual weight of a truck and a semi-trailer with all the equipment, driver, and load. The weight of the empty truck (tare) was determined on the basis of weighing on a stationary scale when it arrived for the load (Figure 2). The raw material (wood chips or sawdust) was then loaded and the entire truck was reweighed to determine GVW.
If it was found that the permissible total weight of the truck was exceeded, part of the load was unloaded. In the case of too-small GVW, it was possible to add material, and the truck was re-weighed (for control purposes). The actual weight (Mg) of each load was obtained from the difference of the GVW and the empty truck.
The volume of transported wood in solid cubic meters, m3, was determined on the basis of the actual measurements of the bulk cubic meter (bulk m3) on the trailer by the seller (sawmill). Quantity of chips or sawdust was calculated using the conversion factor from bulk m3 to solid m3. According to the internal company rules, the factor for chips is 0.42 and for sawdust 0.33. This method is common and used in various countries and regions [37,38]. When the permissible GVW was achieved during loading, the driver was obliged to spread the material evenly on the trailer and the volume of the load was measured. The loading volume of the trailer was determined in cubic meters (with an accuracy of three decimal places) based on realistic measurements of length, width, and height. To calculate the load volume, the difference in height between the upper edge of the trailer’s load box and the upper surface of the material was used. With the known maximum volume of the trailer, it was possible to determine the percentage of use of the loading capacity for each transport.
Transport distances in kilometers for each shipment of wood chips or sawdust were determined based on the location of the buyer’s plant and information from drivers with route verification on Google Maps.
The absolute moisture content of the transported wood chips and sawdust was determined for the samples taken. Samples of chips and sawdust were collected into sealed string bags twice in the morning and afternoon. Samples were taken from the center of heaps, at a depth of about 0.5–0.7 m (Figure 1), from which the trucks were loaded, and from a dozen trucks after loading the semi-trailer during measuring the volume of the load (Figure 3). After each sample was taken, it was (immediately) weighed with an accuracy of 1 g. Finally, the absolute moisture content of each sample taken was determined by the dryer-weight method under laboratory conditions. In terms of the accuracy of mass measurements, the method of drying samples and the methodology of calculating the absolute moisture content, the provisions of BS-EN 13183-1: 2002 [22] were followed.
The obtained results were analyzed statistically using the STATISTICA 12 package. In all analyzed periods, the distributions of the variables for all parameters deviate from the normal distribution. Therefore, the significance of differences was mainly determined using the Mann–Whitney test for two independent variables, as well as the Kruskal–Wallis test, and Dunn’s multi-sample rank mean comparison test. In order to determine the relationship between the examined features, the Spearman correlation coefficient (Spearman’s rank correlation test) was used.

3. Results

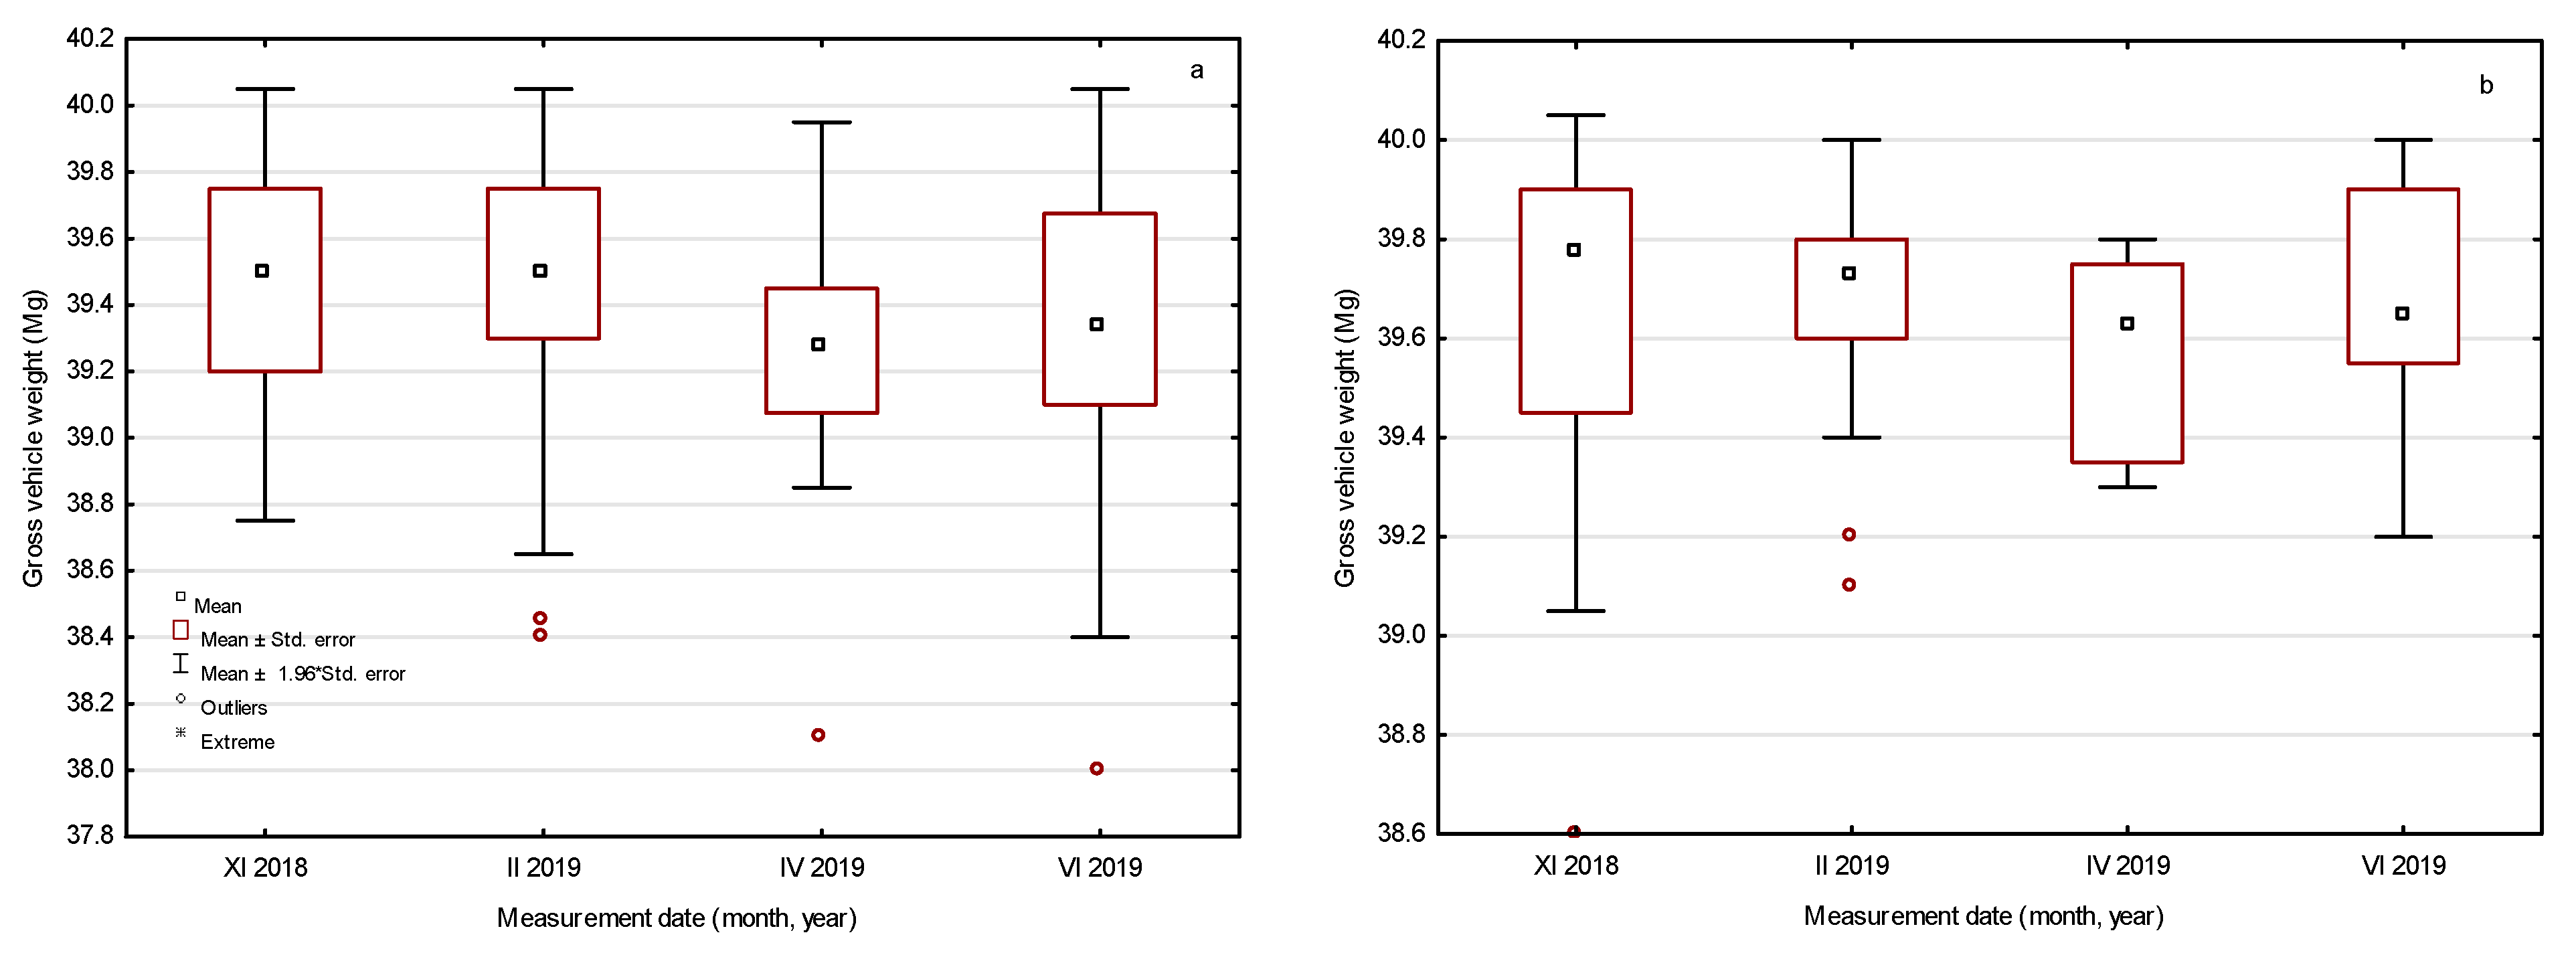
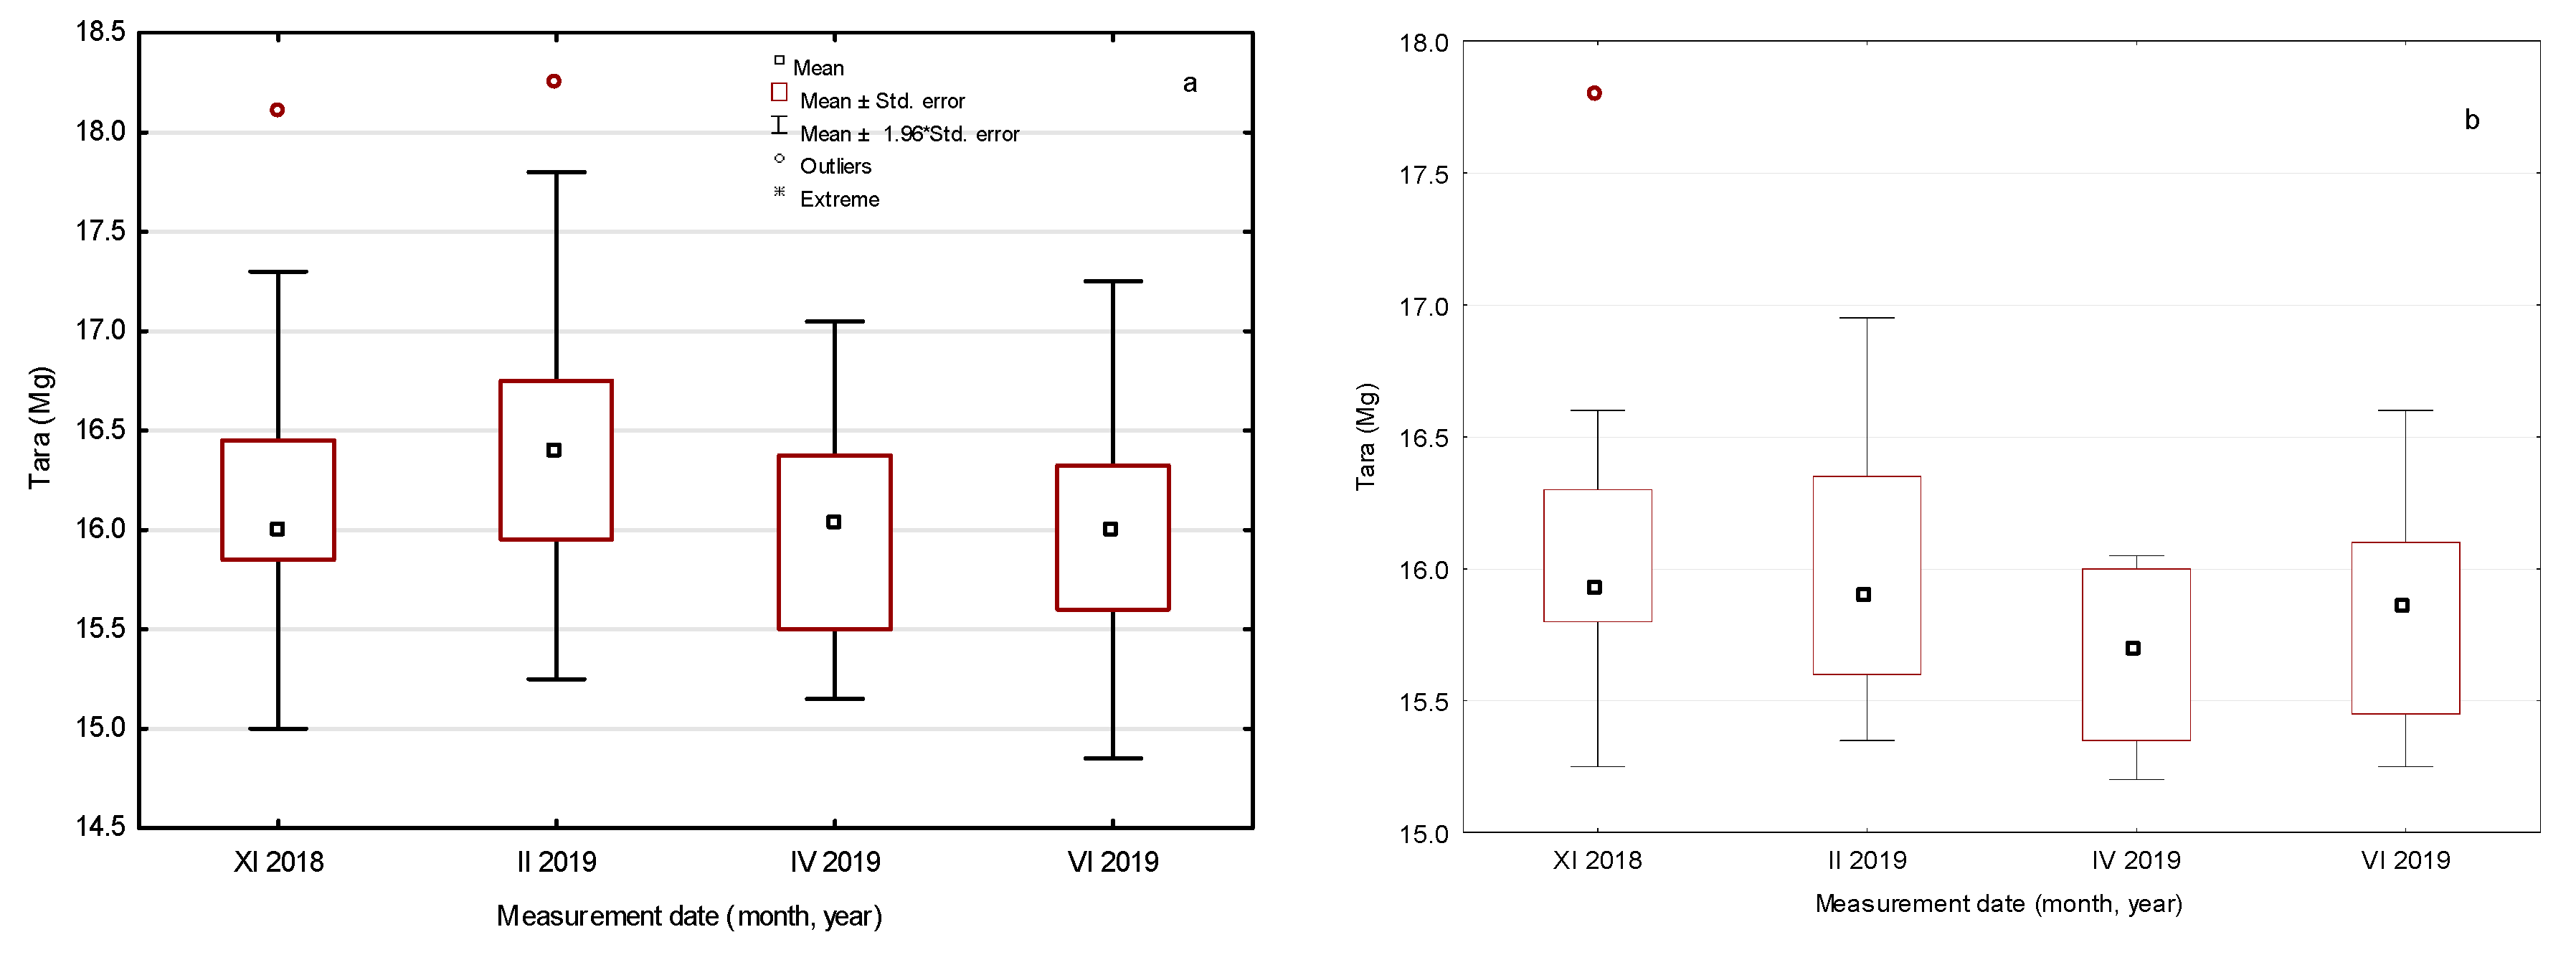
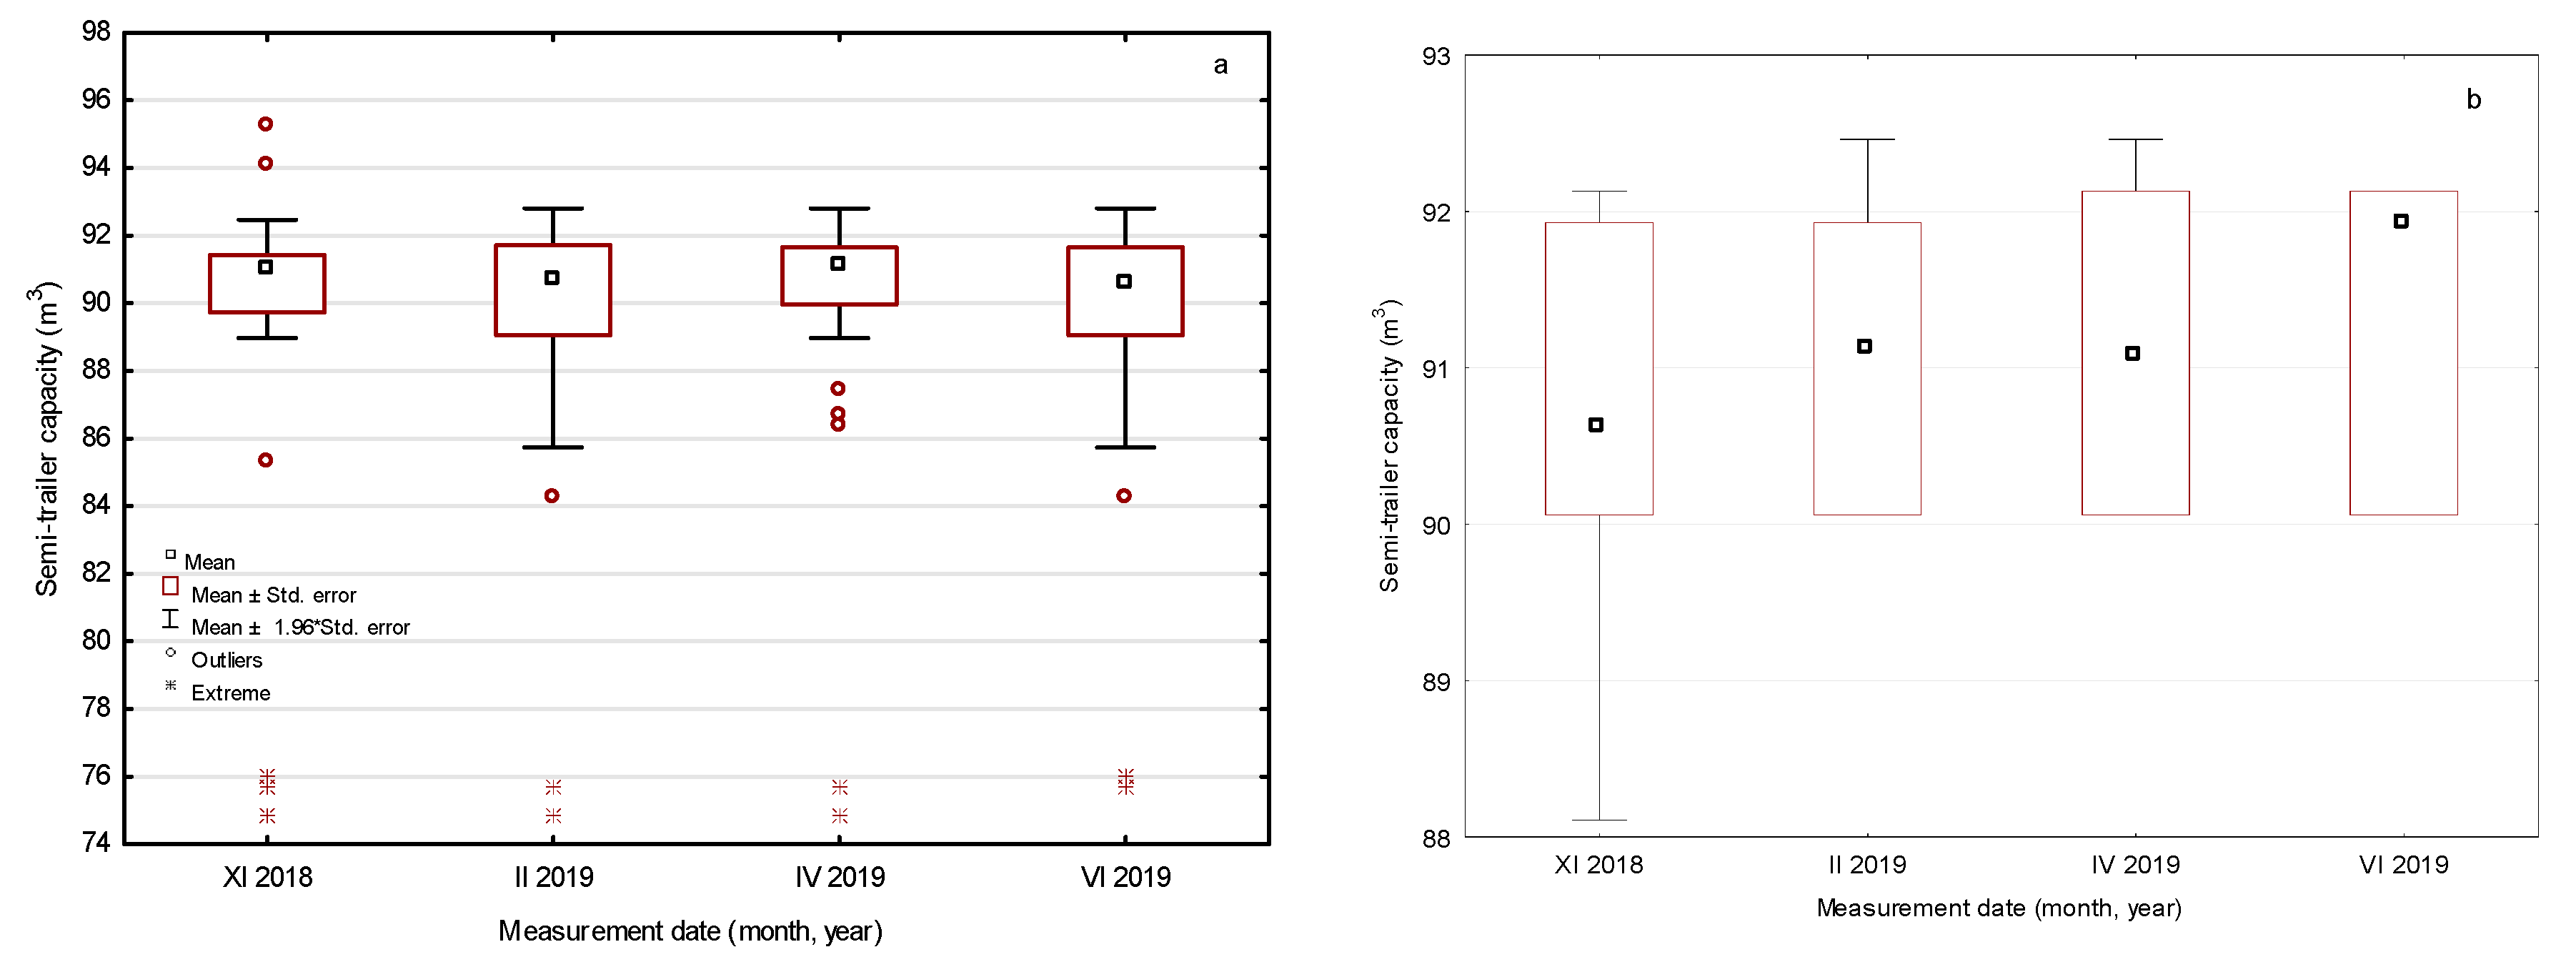
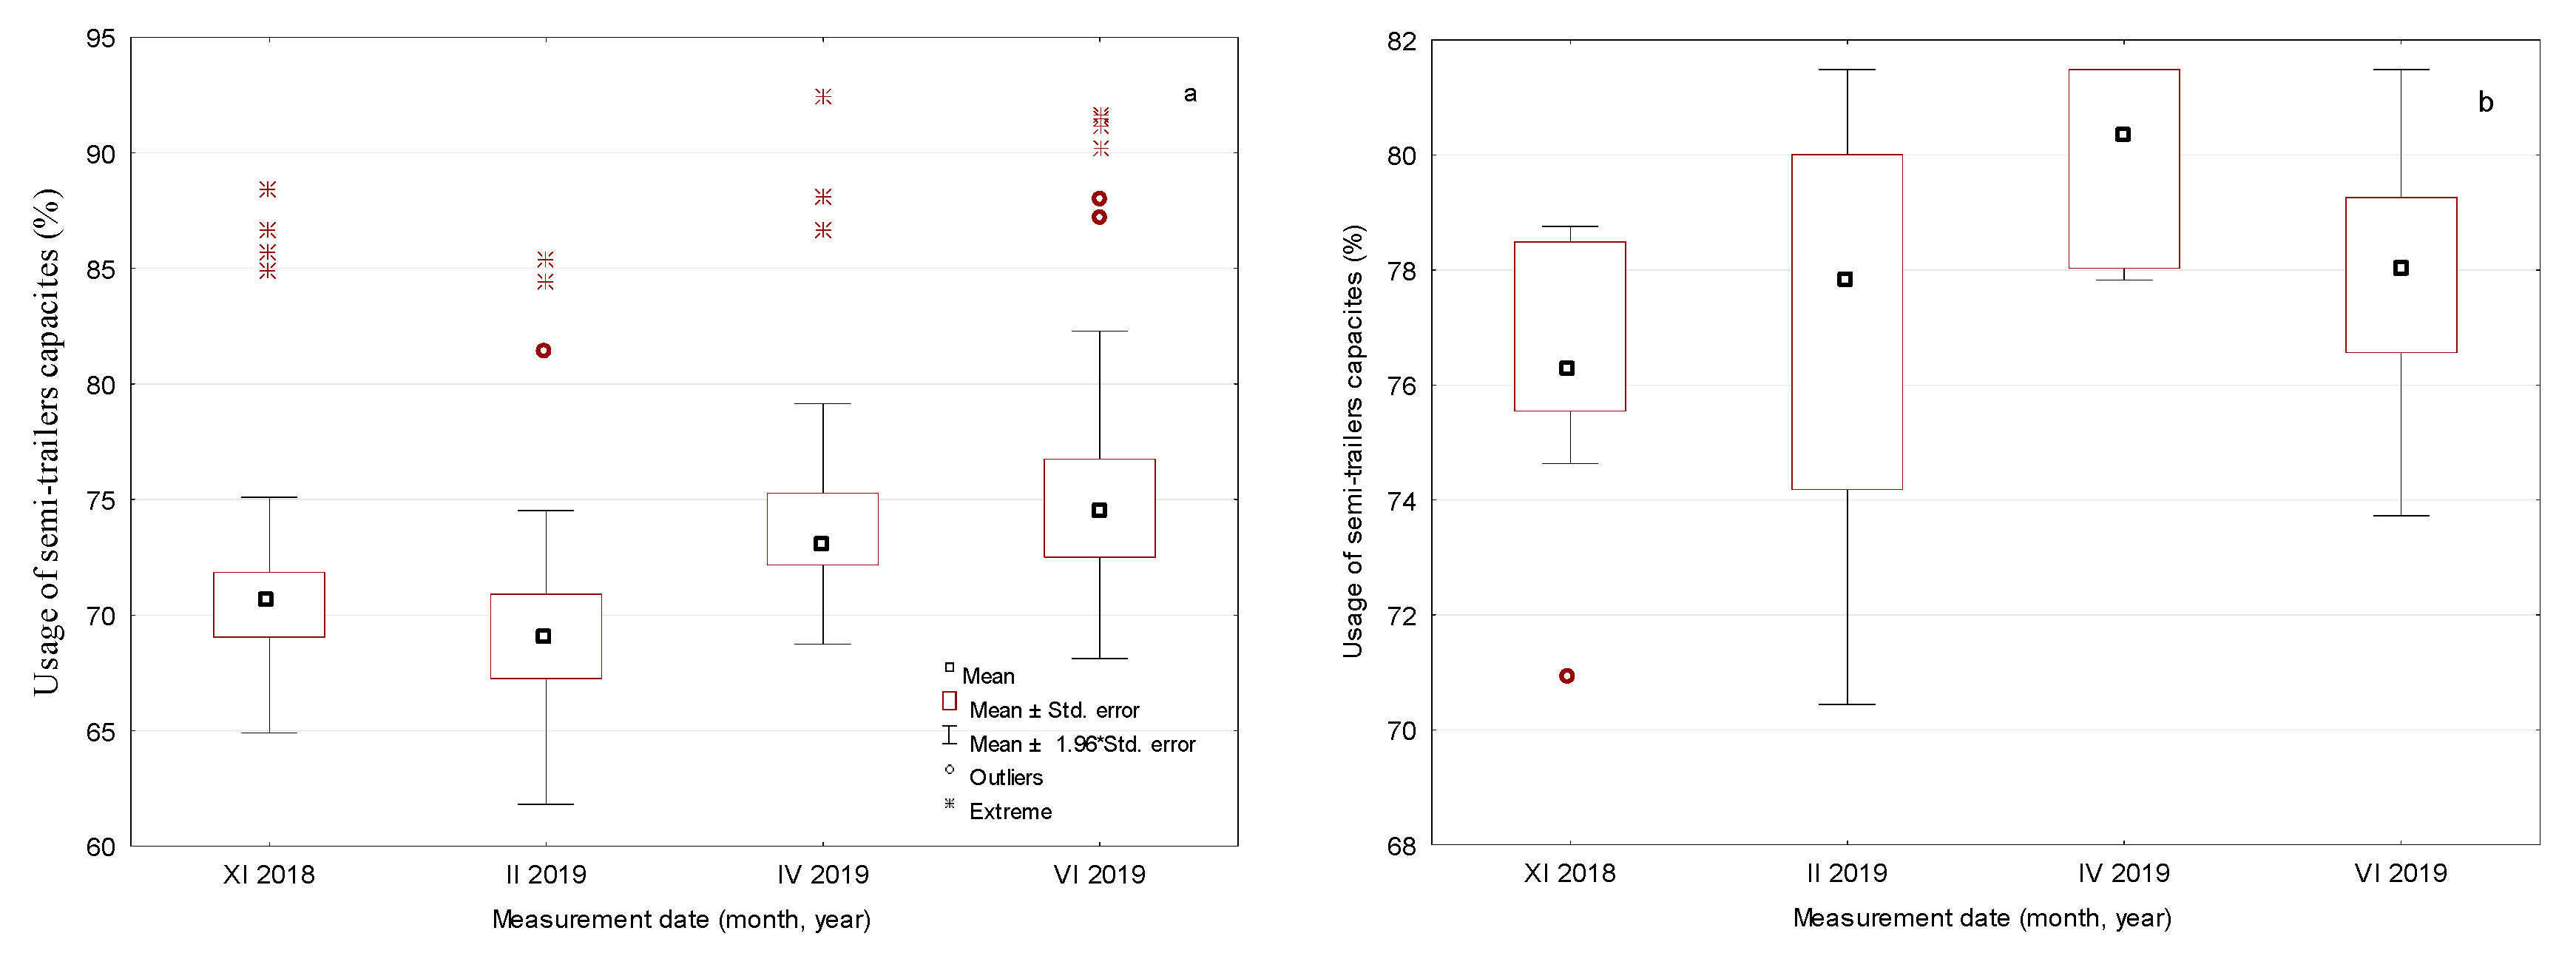
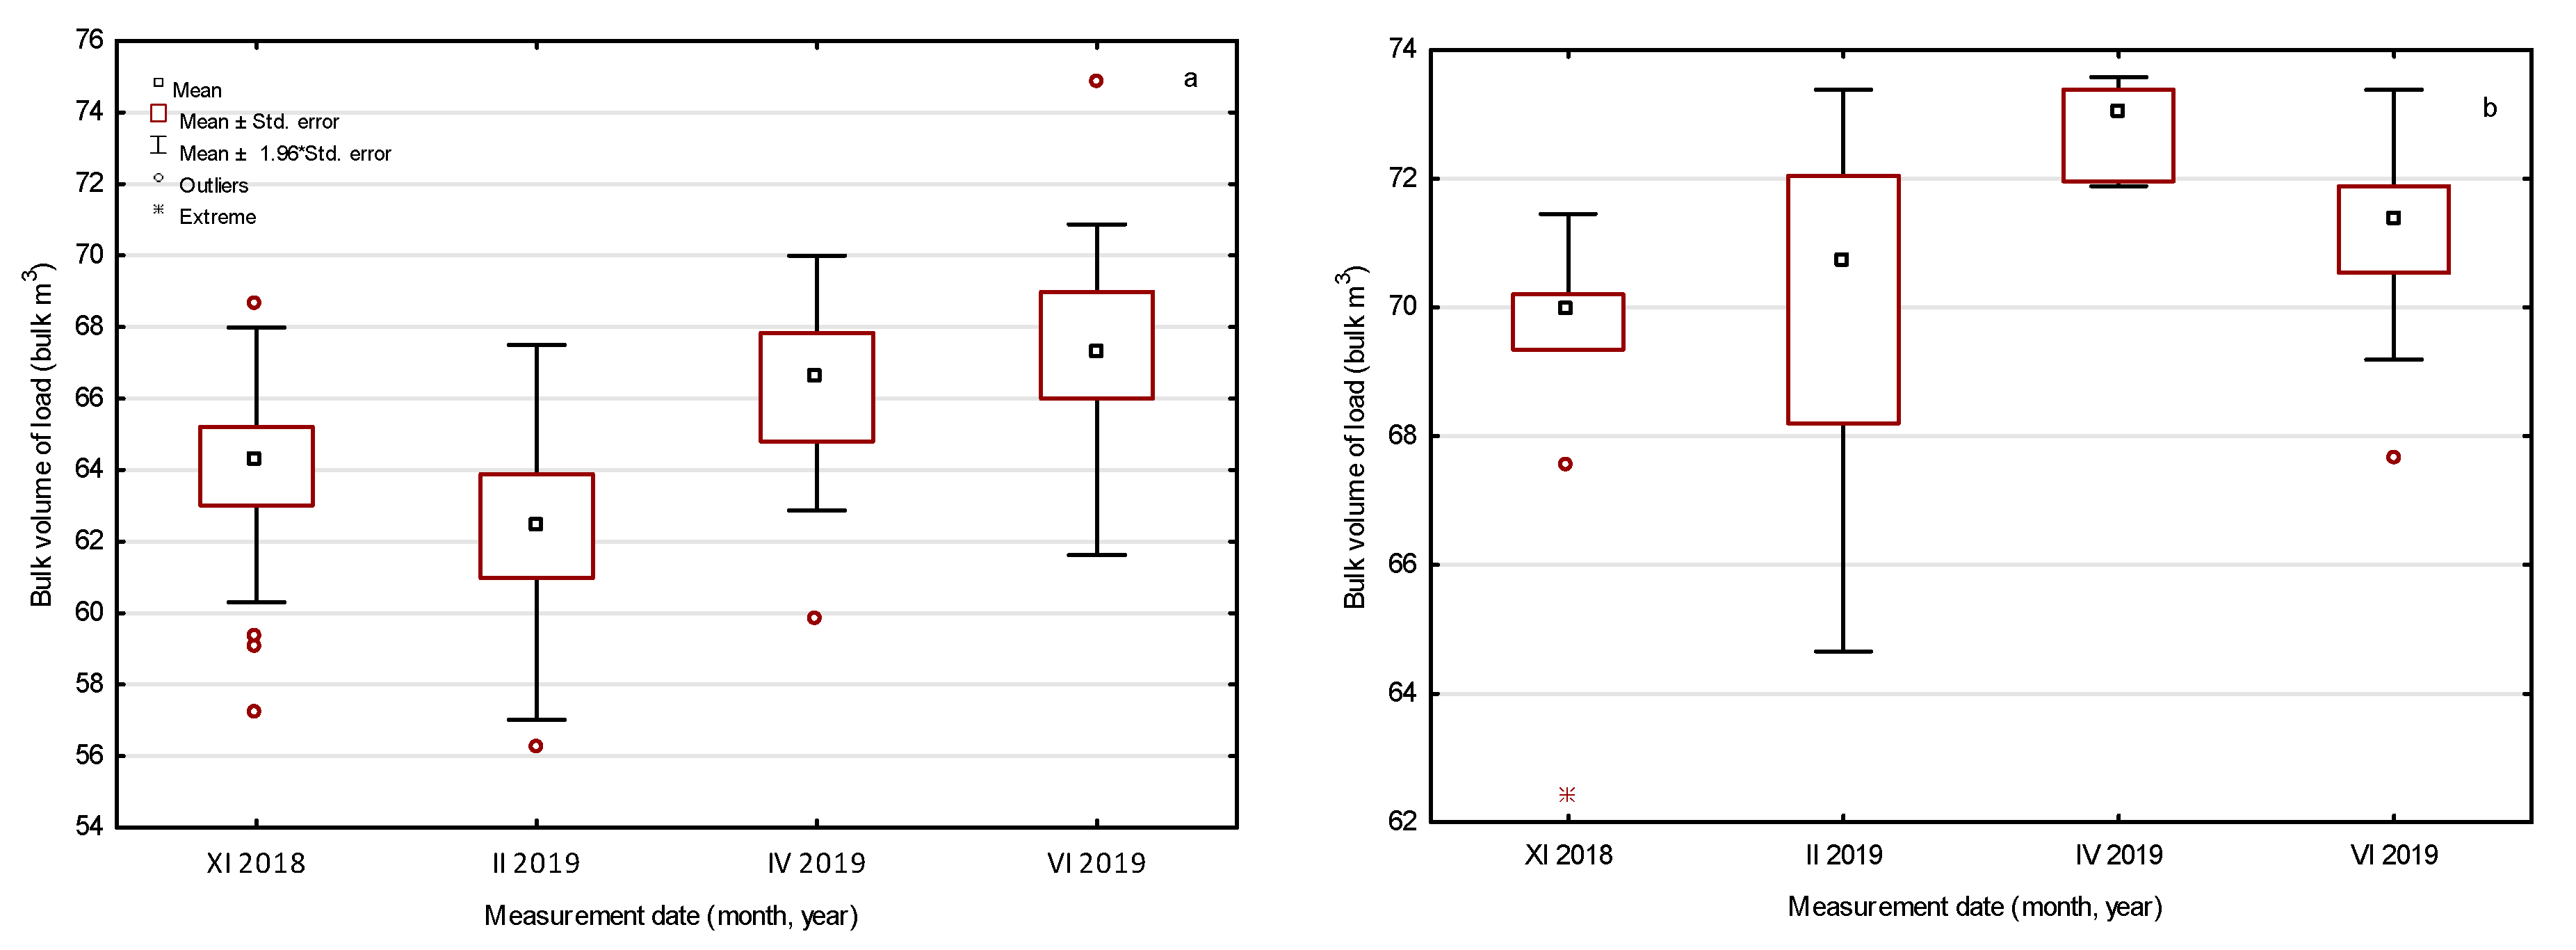
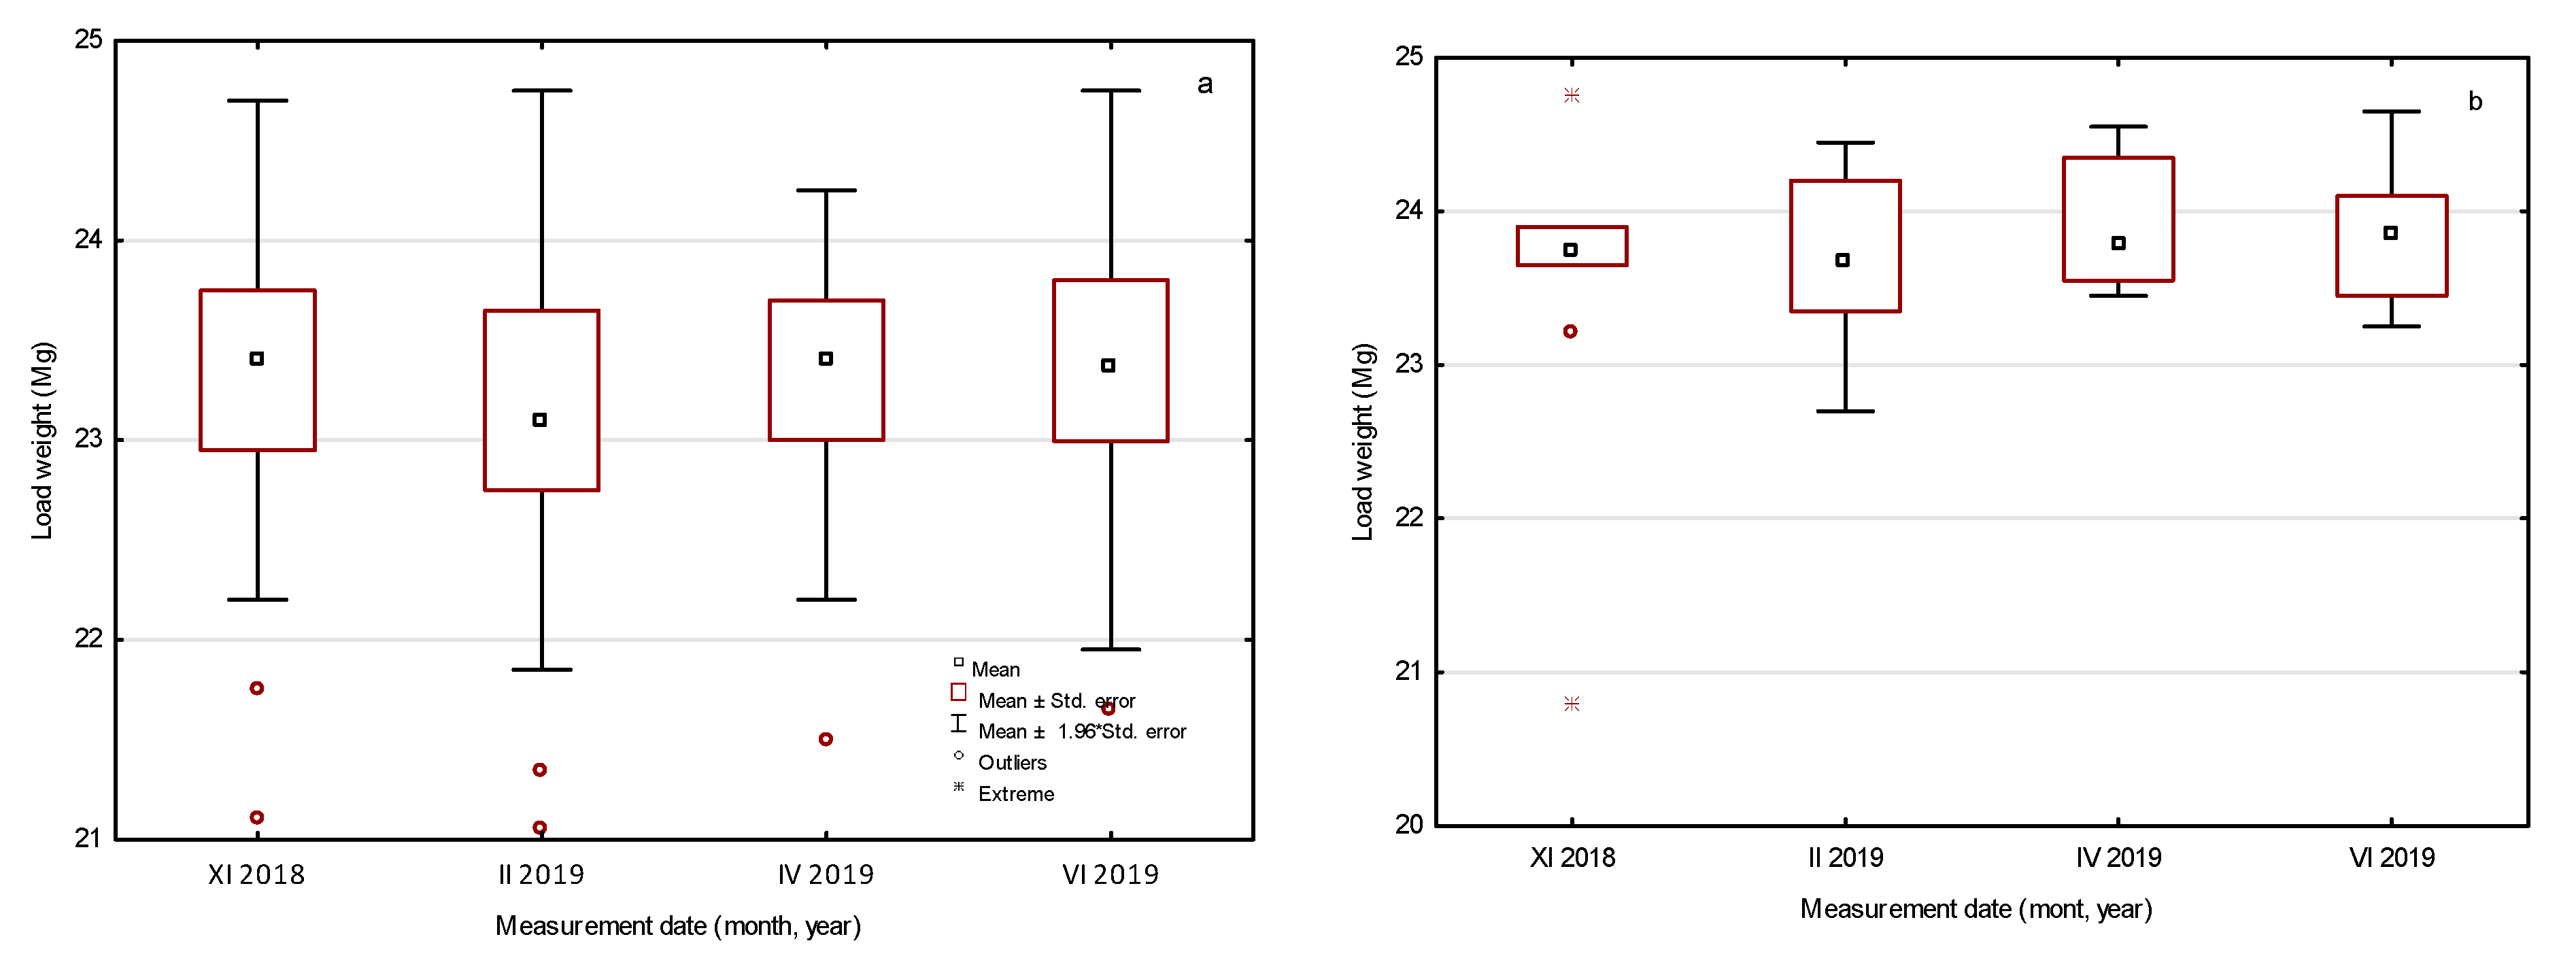
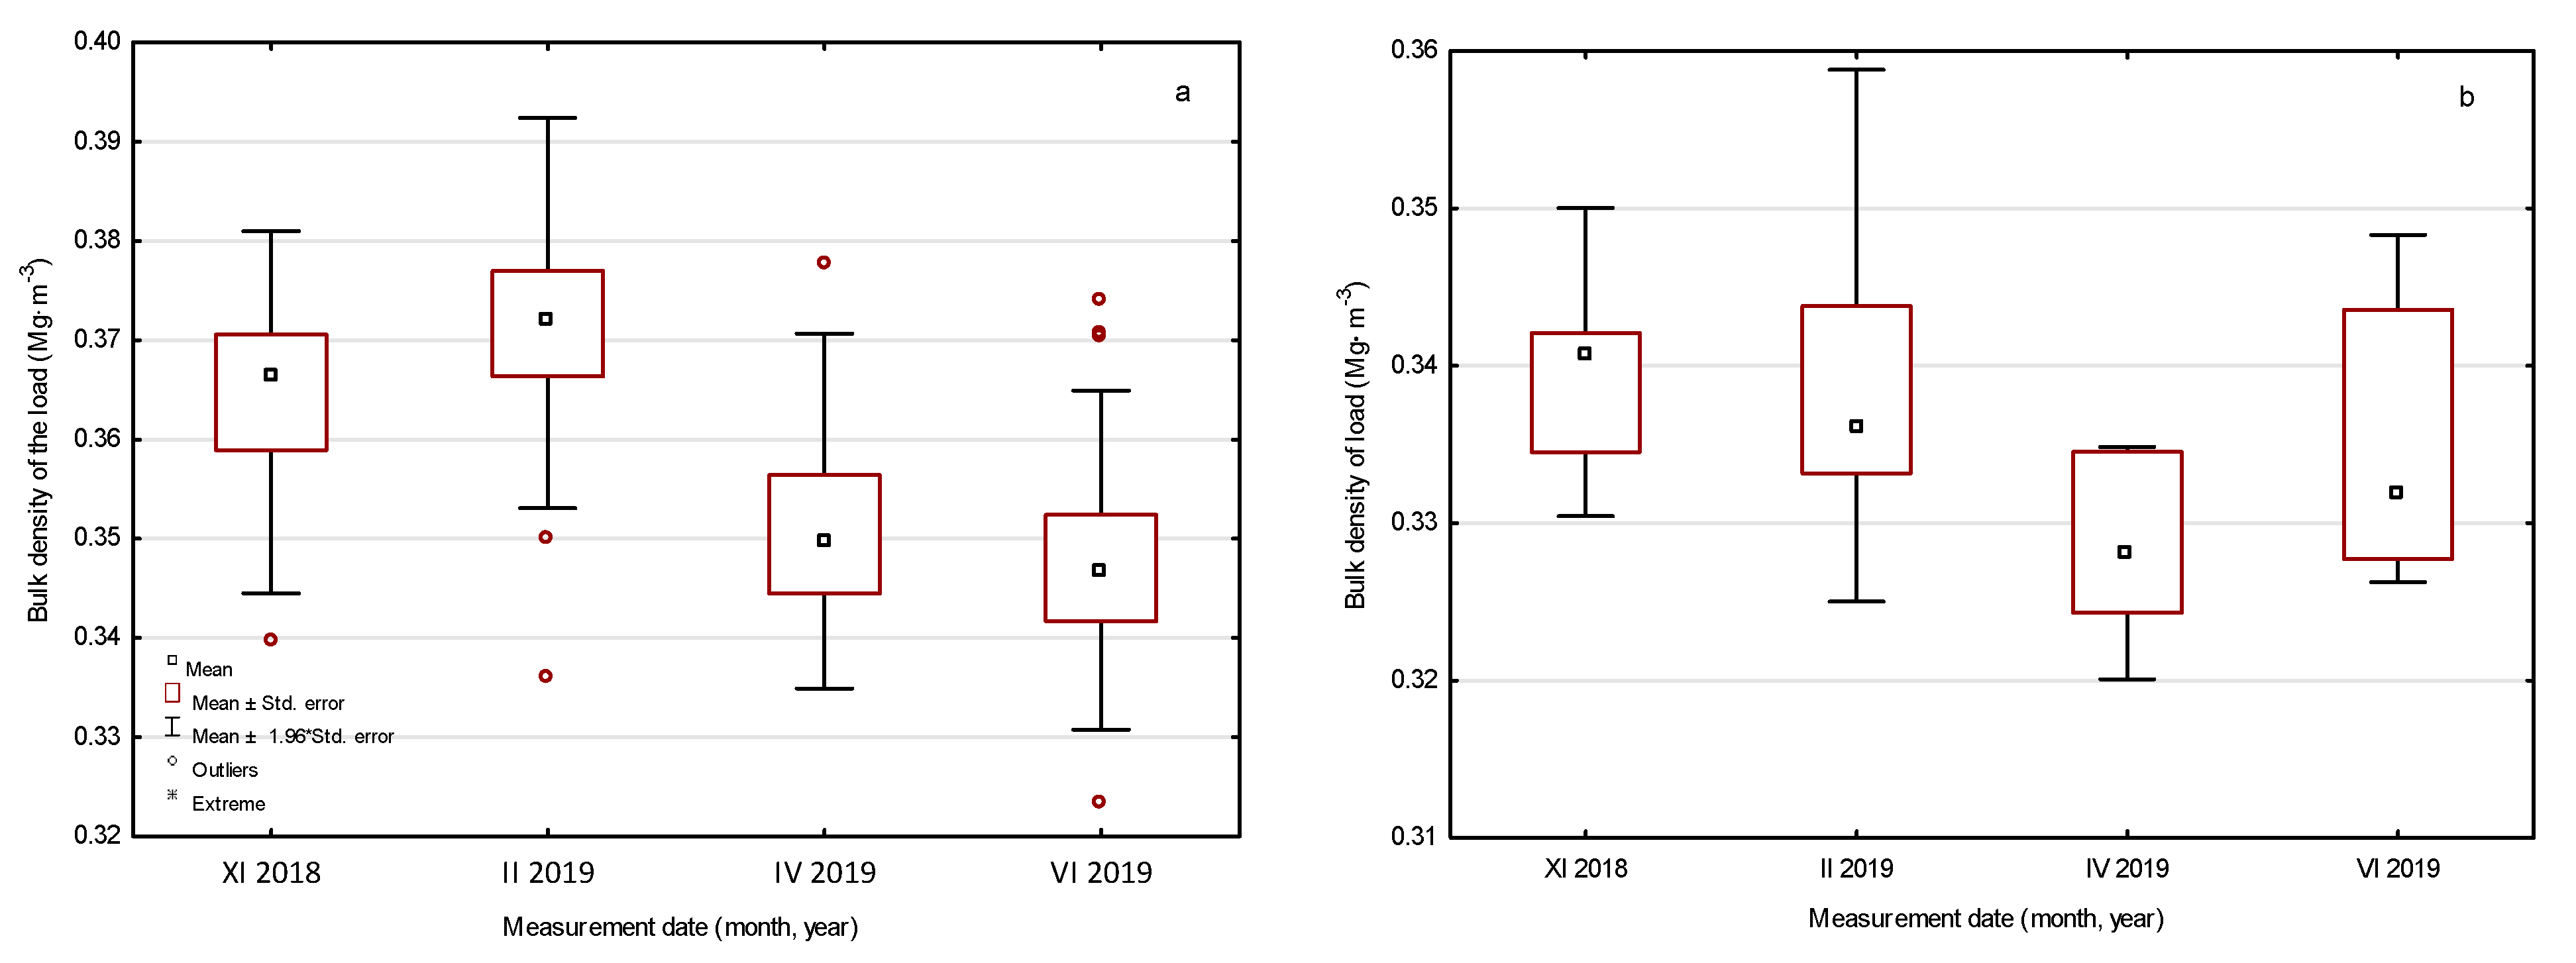
3.1. Characteristics of the Parameters of Trucks and Loads of Wood Biomass

Timber transports were carried out by sets consisting of trucks and trailers with a walking floor (Figure 1 and Figure 2). The average values of the parameters characterizing transport sets and loads of chips and sawdust are presented in Table 1.
It was found that the gross vehicle weight (GVW) transporting wood chips or sawdust is at a comparable (equal) level, on average from 39.42 to 39.64 Mg with slight differences (with SD 0.29–0.39). The range of the minimum values for chips is from 38.00 Mg up to 40.05 Mg for chips and sawdust (Table 1). Sets of trucks with trailers transporting wood biomass are characterized by a small variation in the value of the empty set weight (tare) in the range from 14.85 Mg to 18.25 Mg (for wood chips). The average weight of the empty set for the transport of wood chips was 16.15 Mg and 15.93 Mg for sawdust, with a very low SD of 0.52–0.60. The average capacity (volume) of the semi-trailer in the analyzed sets is very similar to 89.527 m3 for the transport of wood chips and 91.022 m3 for the transport of sawdust. However, there are differences in the sets for the chips from 74.860 to 95.260 m3, and for the transport of sawdust—smaller from 88.110 to 92.460 m3 (Table 1).
With a known and similar weight of empty transport sets, the GVW control determines the results regarding the weight (Mg) of the load. The haulage truck and semi-trailer transported similar (with SD 0.6) loads of chips or sawdust with an average weight of 23.27 Mg for wood chips or 23.70 Mg for sawdust within the observed results from 20.80 to 24.75 Mg. The type of material is important for the transported volume. The average load value in bulk cubic meters was 64.783 bulk m3 for chips and 70.465 bulk m3 for sawdust. Over 30% differences were observed in the volume of transported wood chips from 56.266 to 74.826 bulk m3, and for sawdust 18% with values from 62.457 to 73.357 bulk m3.
Bulk density of the load (Mg⋅m−3) of chips and sawdust was calculated by dividing the weight of the load (Mg) by its bulk volume m3 for individual shipments. The average bulk density of the chips is 0.360 Mg⋅m−3 with the differences (SD 0.020) from 0.305 to 0.426 Mg⋅m−3, and the average sawdust is 0.335 Mg⋅m−3 with a very small range of variation (SD 0.008) from 0.320 to 0.355 Mg⋅m−3.
With the data of trailer volume and volume of load (bulk m3), the percentage of the load capacity usage of the trailer was determined. Gross vehicle weight (GVW) limitations do not allow the maximum loading of the semi-trailer, and the average use of the semi-trailer capacity for transport of wood chips was 72.58%, and for sawdust 77.42%. The differences in the capacity utilization when transporting wood chips are significant (about 50% with SD 5.56) from 61.81 to 92.44%, and for sawdust from 70.44 to 81.48% (about 15% with SD 3.01).
An analysis (the Mann–Whitney test) was carried out in order to investigate the significance of the tested features depending on the type of transported wood biomass (wood chips and sawdust). No statistically significant differences (at α = 0.05) were found for the capacity of the semi-trailer (p = 0.0604). There are statistically significant differences for the remaining features between the transports of chips and sawdust, where in most cases the indicated value was p = 0.0000 or p = 0.01280 for the tare.
The Kruskal–Wallis test (due to the heterogeneity of the variance) was used to analyze the significance of the tested features between individual measurement dates for the transports of wood chips and sawdust, and the results are presented in Table 2. Additionally, a multiple comparison test of mean rank was performed, and all analyses were performed at the significance level of α = 0.05.
The statistical analysis confirmed the lack of differences between the values of the examined features for the transport of wood chips only in the case of the capacity of the trailer (m3), depending on the measurement date. The Kruskal–Wallis test for weight of load (Mg) showed significant differences for chips transports (p < 0.05); however, the Dunn’s test (multiple comparison test of mean rank) showed no differences between the seasons. In the case of sawdust transport, no statistically significant differences were found for the five examined features (0.2056 < p< 0.9030) (Table 2).
The scope of the obtained results for the tested features depending on the transported material and the time of measurements is shown in figures from 4 to 10. Statistically significant differences (p = 0.0053) for gross vehicle weight (GVW) were found in the transport of wood chips between February and April 2019, where the mean-rank multiple comparison test (Dunn’s test) was p = 0.01107 (Figure 4a). The empty weights of transport sets (tare) differ only between the measurements in February and April and June 2019 for chips transports (p = 0.023312 and p = 0.002630) (Figure 5). There are no differences for the capacity of the trailer in the analyzed periods for the transports of chips and sawdust according to the Kruskal–Wallis test—p = 0.8054 and p = 0.5911 (Figure 6). There are also no statistically significant differences in the use of the trailer load capacity (%) for sawdust transports (p = 0.2056), and for wood chips transports only between the measurements from April and June 2019 (Dunn’s test p = 1.0000) and November 2018 and February 2019 (p = 0.1504) (Figure 7).
The volume of the transported material in solid cubic meters (m3) and bulk volume of the load (bulk m3) (Figure 8b) of sawdust differs only in II from IV 2019 (p = 0.0314) and November 2018 from IV 2019 (p = 0.0036), and for wood chips in all dates, except for the comparison of IV with VI 2019 (Figure 8a). There were no statistically significant differences in the weight of the load (Mg) between the measurement dates for the transport of wood chips and sawdust (p = 0.6005) (Figure 9). Bulk density (Mg/m3) values do not differ only between the transports of wood chips in April and June 2019 (p = 1.0000) and November 2018 and February 2019 (p = 0.0664) (Figure 10a). In the transport of sawdust, differences in bulk density were found only between transports in November 2018 and April 2019 (p = 0.0444) (Figure 10b).

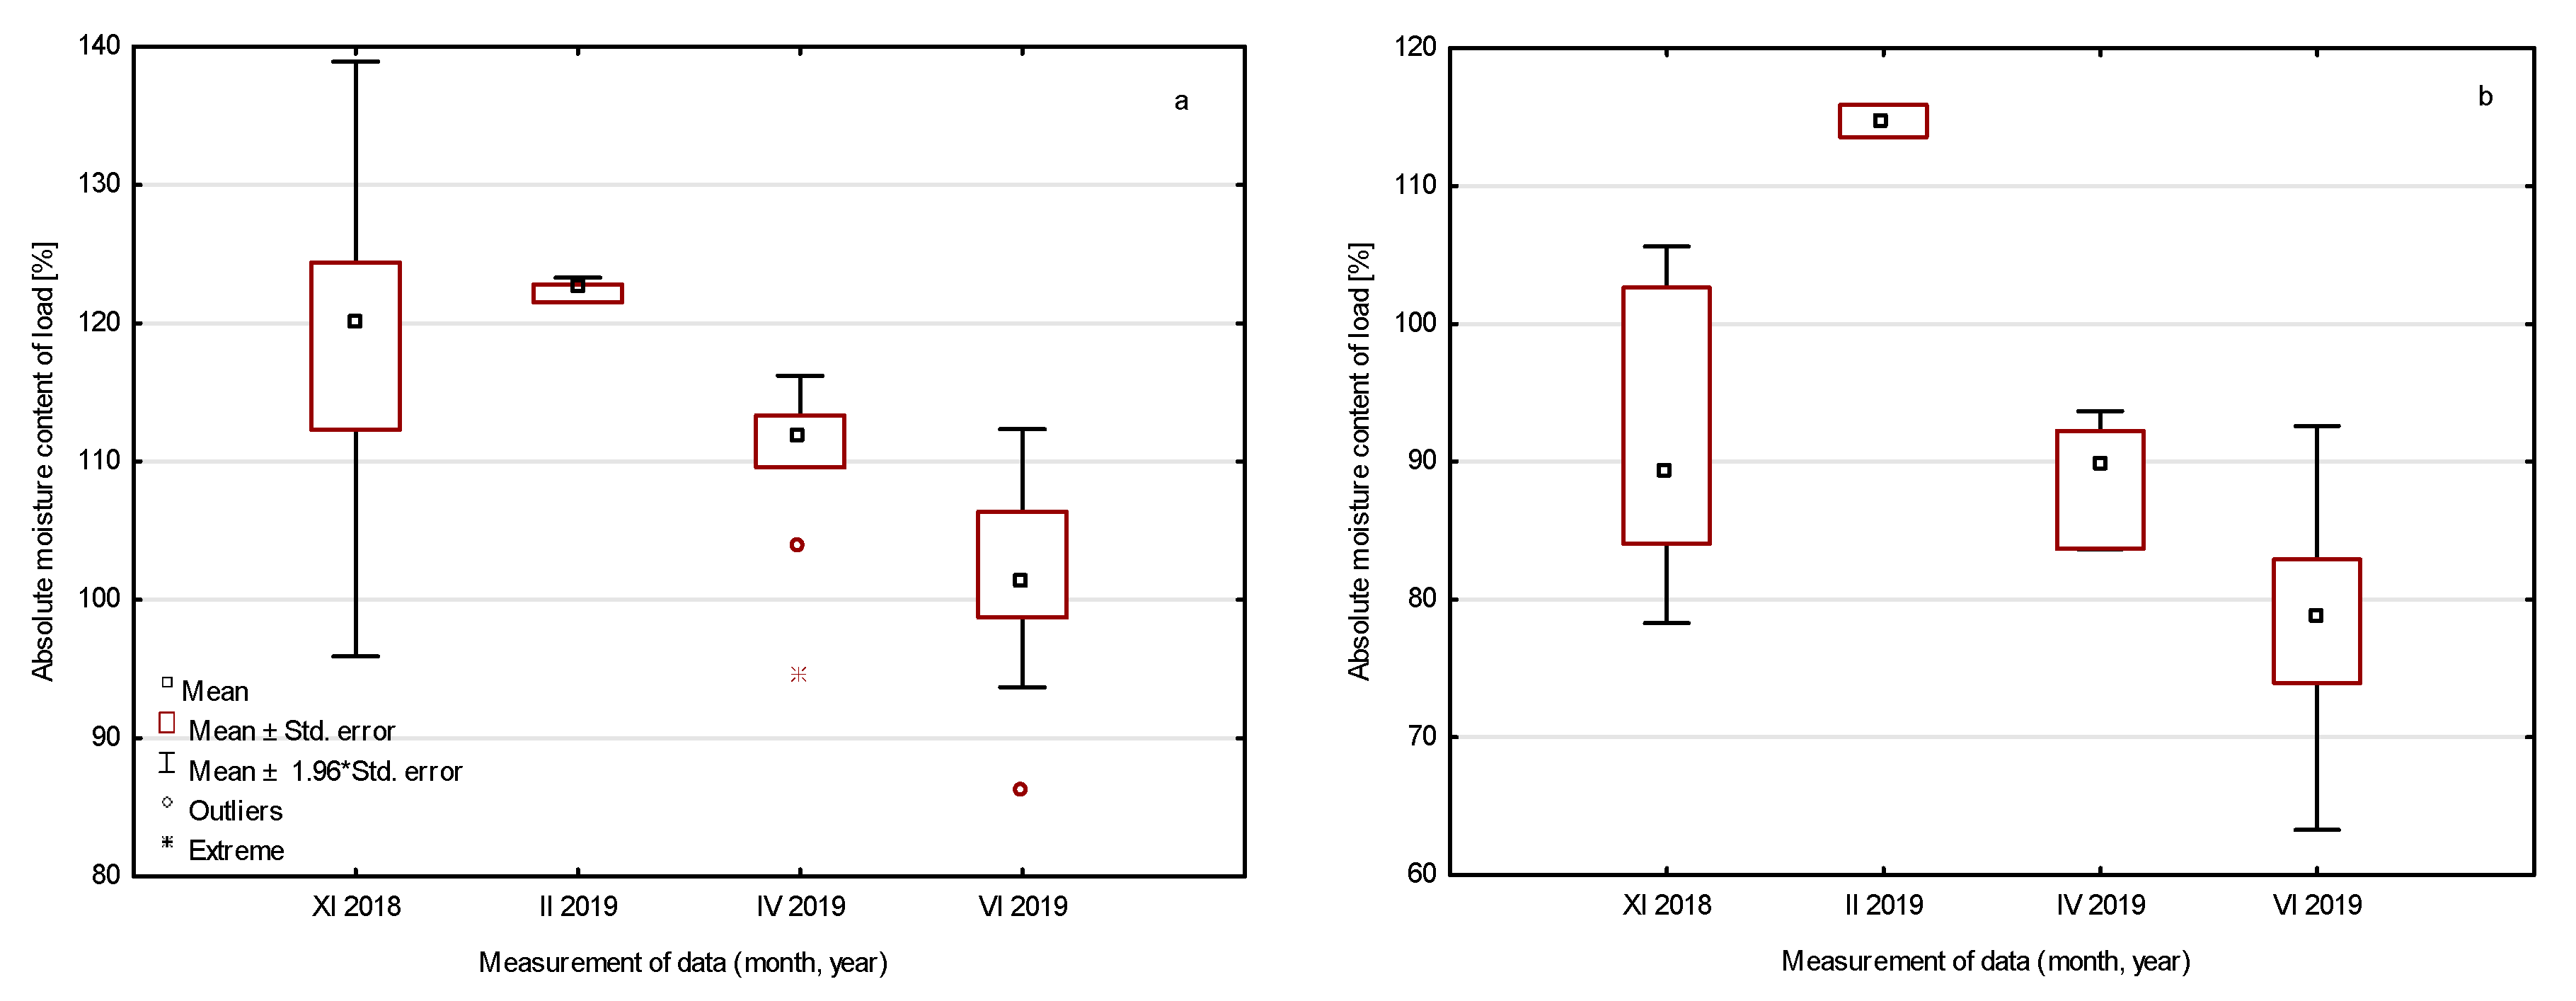
3.2. Moisture Content Characteristics of Chips and Sawdust Loads

The absolute moisture content was determined for 40 wood chips and 16 sawdust samples. The results are summarized in Table 3. They show that the average moisture of the chips (108.5%) is significantly higher than the average moisture of sawdust (86.3%).
The analysis with the Kruskal–Wallis test and the mean rank comparison test (Dunn’s test) (control performed despite a small research sample) showed statistically significant differences in the moisture content of loads between the measurements from June, February, and November for wood chips and between June and February for sawdust. These differences are clearly visible in Figure 11, i.e., the differences are mainly between summer, winter, and autumn. These differences are probably responsible for the observed and previously described significant differences for Mg⋅m−3 in particular seasons of the year (between VI and II and XI for wood chips and between XI and IV for sawdust). The season of the year determines the absolute moisture content of the wood biomass in the form of sawdust and wood chips, which affects the selected parameters of loads.

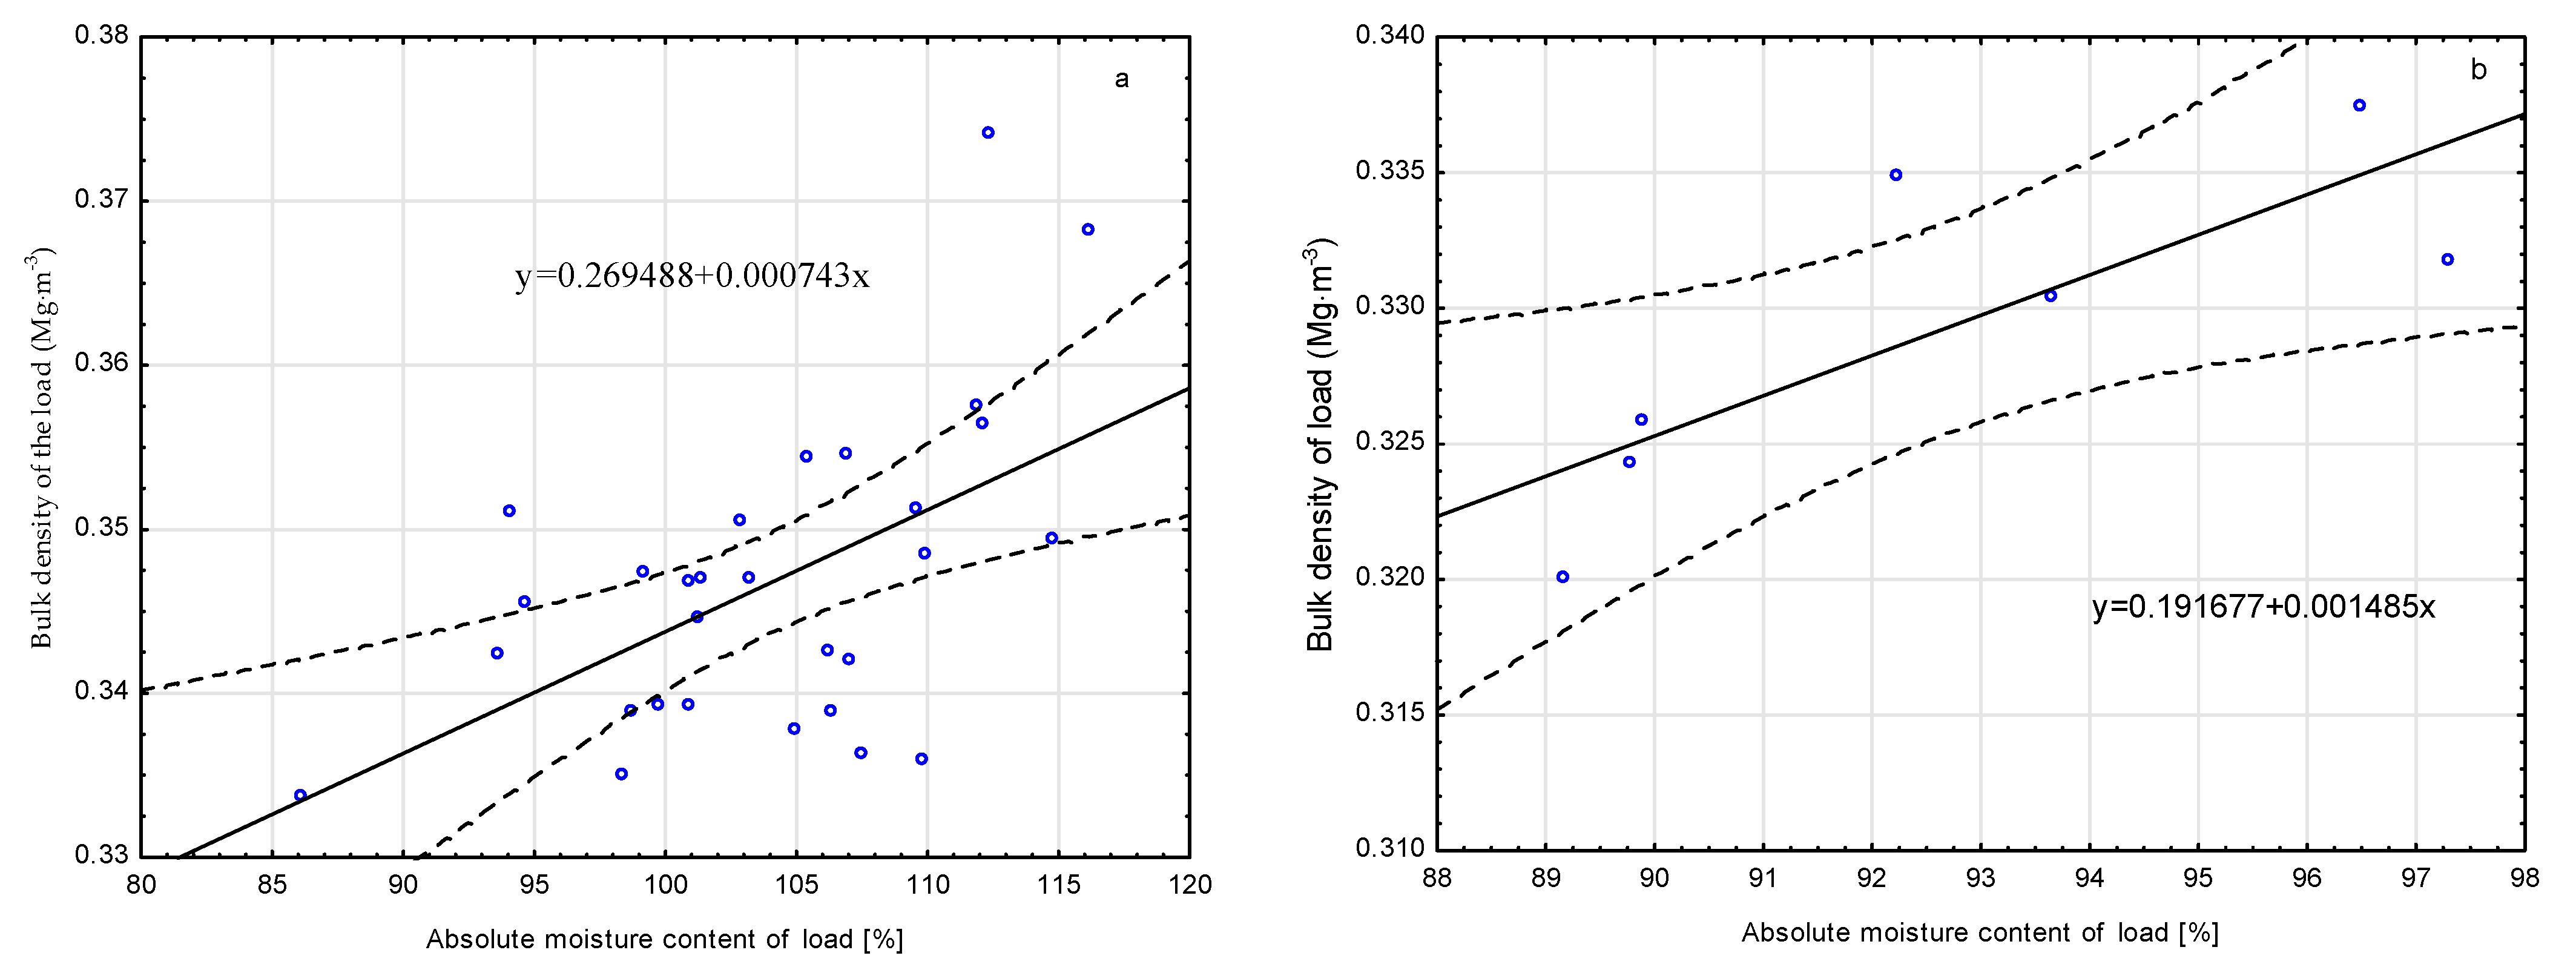
3.3. Relationships between the Analyzed Parameters

Statistical analyses of the results confirmed the differences between the analyzed parameters depending on the date of transport. The control of gross vehicle weight (GVW) during loading of chips and sawdust ensured that the transport sets were not overloaded above the permissible weight (40 Mg). Nevertheless, the results differ statistically, which contributed to the transport of different bulk volumes of the load. As described in the introduction, the problem in the transport of wood products is the definition of GVW. Three-factor regression models were developed for the GVW (Mg) value as a function of the tare weight of the transport set (T, Mg), the bulk volume of the load (Bv, Bulk m3) and the bulk density (Bd, Mg⋅m−3) (Table 4 and Table 5). The presented linear regression models were developed using the least squares method (OLS), and the significance of the calculated coefficients was assessed using the Student’s t-test at α = 0.05. Drivers know the weight of empty sets and with the use of a simple method of determining the bulk density of chips and sawdust [38], this relationship may be applied in practice. Linear regressions on GVW for wood chip transports, as shown in formula 1, and the parameters and their evaluation are presented in Table 4.
GVW = −21.9928 + 0.9716·T + 0.3527·Bv + 63.5796·Bd
In the case of sawdust transports, the regression model took the form (Table 5):
GVW = −22.8719 + 0.9895·T + 0.3341·Bv + 68.9311·Bd
From the practical point of view of organizing transports of wood biomass, it is important to be able to determine the load volume that can be loaded on the transport set in order to maintain the maximum GVW permitted by law (40 Mg for a five-axle set). For the transport of wood chips and sawdust resulting from the processing of round wood (one species) and in the same technology, i.e., with similar parameters (bulk density Bd, Mg⋅m−3), with a known empty weight of the export set (T, Mg), a nonlinear regression model was determined on the bulk volume of the load of chips (3) and sawdust (4). The evaluation of the model parameters is presented in Table 6 for chip loads and in Table 7 for sawdust.
B v = 40 0.970076 · T 1.045960 · B d   ( Bulk   m 3 )
B v = 40 1.062124 · T 0.973537 · B d   ( Bulk   m 3 )
An analysis of the relationship between the absolute moisture content of chips and sawdust with selected tested load characteristics was performed, using the Spearman rank order correlation test. The obtained statistically significant coefficients of Spearman’s correlation between the selected examined features are presented in Table 8. The statement shows that in the case under consideration the moisture of the wood biomass (both chips and sawdust) is a factor significantly affecting the bulk volume of load (bulk m3) and the bulk density of the load (Mg⋅m−3). The influence of absolute moisture content on other features is negligible.
The literature [10,11,12,13,14,15] refers to the high dependence of bulk density (Mg⋅m−3) on moisture content, which was confirmed by the obtained correlation coefficients (Table 8). Therefore, a more detailed analysis of this relationship was carried out, and its results are presented in Figure 12 and Table 9 and Table 10.
The obtained equation coefficients were checked for their statistical significance. The obtained equation parameters are statistically significant, and the results of these analyses are presented in Table 9 for chips, where the standard error of the estimation was 0.0088 with the correlation coefficient r2 = 0.2968.
The dependence of bulk density (Mg⋅m−3) on moisture content for sawdust is greater with r2 = 0.63999 and the standard error of estimation equal to 0.00403. (Table 10).
The described correlations are an important guideline for estimating and thus predicting the value of bulk density.

4. Discussion

Transport efficiency depends on a number of factors. These include, among others, vehicle load capacity, driving time, distance traveled, and fuel consumption [15,39,40,41]. The transport of larger loads of timber is beneficial for haulers, where, for example, increasing the weight of the transport sets to 76 tonnes in Finland has been used to the greatest extent in forestry [32]. An important factor influencing the mass of wood load is its density [9,13,18,27,42].
The analyzed transports of chips and sawdust are characterized by the usage of the load capacity of the semi-trailer at an average level of 72.5% and 77.4%. This is the result of the activities of the manufacturer (sawmill) producing wood biomass, where the gross vehicle weight (GVW) of the transport sets for chips and sawdust to recipients is controlled, so that it does not exceed the weight allowed by law. At the same time, these actions allow the driver to use the maximum load capacity of the trailer. The lack of statistically significant differences between the capacity of the semi-trailer and the weight of the load (controlled to the permissible GVW) indicate the importance of the bulk density of chips and sawdust, although it is a very homogeneous material as a residue in the processing of large-sized round wood of Scots pine. This results in large differences in the volume of loads for the transports of wood chips and sawdust, which is consistent with the data presented by other authors [26,43]. The analysis of the differences in transported loads of chips and sawdust can be concluded that they occur between the autumn–winter period (XI and II) and the spring–summer period (IV and VI). It results from the initial moisture content of pine round wood, which depends on the season [44,45]. For example, according to Millers and Magaznieks [45] studying Scots pine steamwood in the whole territory of Latvia in 2011, Scots pine heartwood absolute moisture content changes a little during the year: 30– 34% for 71–146-year-old trees; and 34–41% for 37–70-year-old trees. Sapwood absolute moisture content changes from 113% (in the summer) to 130% (in the winter), without any reference to the age of the tree.
Significantly higher moisture content of the chips is also observed compared to sawdust. This is due to the initial distribution of moisture content in pine logs and logs with naturally drier heartwood and wetter sapwood [44,45] and the method of their processing by chipper canter. Canter heads chip mainly the perimeter layers of round wood, with a predominantly damp sapwood. The produced two-side cants containing mainly the drier heartwood are sawn onto the lumber. This operation produces sawdust. Chips and sawdust are sent to separate heaps on an ongoing basis (photo 1), from where they are successively loaded on transport sets. The storage time of a given batch of chips and sawdust in heaps usually does not exceed three days, hence the original differences in absolute moisture content are maintained. During transport and pouring onto heaps, the chips obtained from subsequent logs are partially mixed and therefore the moisture content level in the heap is even. A similar process, with increased intensity, also occurs with sawdust.
The presented bulk densities from 0.3050 to 0.4265 Mg⋅m−3 for round wood chips without bark, with material moisture ranging from 63.3 to 138.9% (Table 3, Figure 11), are consistent with the data presented by Laitile and Route [46] and adopted for the calculation of economic effects and optimization of biomass transports [47].
Transport sets, i.e., trucks with walking floor semi-trailers, are very similar in design regardless of the manufacturer and allow the transport of wood chips and sawdust, hence the similar weight values of empty sets. The weight of empty sets 14–18 Mg for wood biomass is much smaller than the various transporting sets for round wood, where the average is 20.50 Mg [14,16,17,35] and the maximum 23.70 Mg [48]. It may result from the lack of necessity to equip with a loading device (HDS) and from the light construction of the semi-trailer.
Summing up the considerations about the weight of the empty truck (tare), the volume of the trailer and the percentage of its use, gross vehicle weight, and the bulk density of chips and sawdust, it can be concluded that in the absence of GVW control (weighing) during the load, significant overloading of transport sets would take place. In Poland, gross vehicle weight (GVW) for five-axle sets is 40 Mg. If the maximum volume of the semi-trailer was used, the export sets would be overloaded by 4 to 12 Mg for wood chips transport and by 5 to 9 Mg for sawdust. The fact of unused capacity of the semi-trailer in the transport of forest biomass or trucks overloading is confirmed by the research of other authors [1,20,25]. Sosa et al. [20], analyzing transport sets with gross vehicle weight (GVW) of 42 Mg, gives a possible overload of 6.4 Mg in the transport of forest biomass, which is consistent with our results, taking into account the set of 40 Mg GVW.

5. Conclusions

As part of the work, research and analysis of transports of wood biomass, chips, and sawdust were carried out, which were obtained in the processing of large-size pine wood in different seasons of the year.
In the case under consideration, the average annual absolute moisture content of chips was significantly higher than the average absolute moisture content of sawdust. In addition, the moisture content of wood biomass, both chips and sawdust, changes throughout the year, which is a factor significantly affecting the bulk density of transport loads. The described correlations with absolute moisture content make it possible to predict the bulk density of wood biomass.
The analyzed parameters of trucks transporting wood chips and sawdust are very similar, but only for the capacity of the trailer are there no statistically significant differences.
Sawdust transport is characterized by more stable parameters throughout the year. No statistically significant differences were found for the five analyzed parameters, and in the transport of wood chips only two.
The control of the total weight of the trucks did not fully eliminate the differences in this parameter. The solution to achieving gross vehicle weight (GVW) is to load the trailer while weighing it, which is difficult to implement in practice.
With the transported very homogeneous material, in terms of the species and grain size of wood chips and sawdust, the efficiency of transport (bulk volume of the load m3) is significantly influenced by the absolute moisture content of the material, and this depends on the season.

Author Contributions

Conceptualization, G.T. and P.K.; methodology, G.T and P.K.; formal analysis, G.T. and P.K.; investigation, G.T. and P.K.; data curation, G.T. and P K; writing—original draft preparation, G.T. and Ł.T.; writing—review and editing, Ł.T.; visualization, G.T. and Ł.T.; supervision, G.T. and P.K. All authors have read and agreed to the published version of the manuscript.

Funding

This research received no external funding.

Institutional Review Board Statement

Not applicable.

Informed Consent Statement

Not applicable.

Data Availability Statement

Data sharing not applicable.

Conflicts of Interest

The authors declare no conflict of interest

References

  1. Angus-Hankin, C.; Stokes, B.; Twaddle, A. The transportation of fuelwood from forest to facility. Biomass Bioenergy 1995, 9, 191–203. [Google Scholar] [CrossRef]
  2. Mahmudi, H.; Flynn, P. Rail vs truck transport of biomass. Appl. Biochem. Biotechnol. 2006, 129, 88–103. [Google Scholar] [CrossRef]
  3. Moskalik, T.; Gendek, A. Production of Chips from Logging Residues and Their Quality for Energy: A Review of European Literature. Forest 2015, 10, 262. [Google Scholar] [CrossRef] [Green Version]
  4. Goltsev, V.; Trishkin, M.; Tolonen, T. Efficiency of forest chip transportation from Russian Karelia to Finland. Work. Pap. Finn. For. Res. Inst. 2011, 189, 1–42. [Google Scholar]
  5. Sukhanov, Y.; Seliverstov, A.; Gerasimov, Y. Efficiency of Forest Chip Supply Systems in Northwest Russia. Adv. Mater. Res. 2013, 740, 799–804. [Google Scholar] [CrossRef]
  6. Gerasimov, Y.; Karjalainen, T. Energy wood resources availability and delivery cost in Northwest Russia. Scand. J. For. Res. 2013, 28, 689–700. [Google Scholar] [CrossRef]
  7. Wolfsmayr, U.J.; Rauch, P. The primary forest fuel supply chain: A literature review. Biomass Bioenergy 2014, 60, 203–221. [Google Scholar] [CrossRef]
  8. Gendek, A.; Nurek, T. Variability of energy woodchips and their economic effects. Folia For. Pol. Ser. A 2016, 58, 62–71. [Google Scholar]
  9. Gendek, A.; Nurek, T.; Zychowicz, W.; Moskalik, T. Effects of Intentional Reduction in Moisture Content of Forest Wood Chips during Transport on Truckload Price. BioResources 2018, 13, 4310–4322. [Google Scholar] [CrossRef] [Green Version]
  10. Nuutinen, Y.; Laitila, J.; Rytkönen, E. Grinding of Stumps, Logging Residues and Small Diameter Wood Using a CBI 5800 Grinder with a Truck as a Base Machine. Baltic For. 2014, 20, 176–188. [Google Scholar]
  11. Jensen, P.D.; Hartmann, H.; Böhm, T.; Temmerman, M.; Rabier, F.; Morsing, M. Moisture content determination in solid biofuels by dielectric and NIR reflection methods. Biomass Bioenergy 2006, 30, 935–943. [Google Scholar] [CrossRef]
  12. Kühmaier, M.; Erber, G.; Kanzian, C.; Holzleitner, F.; Stampfer, K. Comparison of costs of different terminal layouts for fuel wood storage. Renew. Energy 2016, 87, 544–551. [Google Scholar] [CrossRef]
  13. Koirala, A.; Kizhal, A.R.; Roth, B.E. Perceiving Major Problems in Forest Products Transportation by Trucks and Trailers: A Cross-sectional Survey. Eur. J. For. Eng. 2017, 3, 23–34. [Google Scholar]
  14. Brown, M. The Impact of Tare Weight on Transportation Efficiency in Australian Forest Operations. Harvesting and Operations Program, Research Bulletin 3. 2008. Available online: https://fgr.nz/documents/download/4740 (accessed on 8 December 2017).
  15. Ghaffariyan, M.R.; Acuna, M.; Brown, M. Analysing the effect of five operational factors on forest residue supply chain costs: A case study in Western Australia. Biomass Bioenergy 2013, 59, 486–493. [Google Scholar] [CrossRef]
  16. Owusu−Ababio, S.; Schmitt, R. Analysis of Data on Heavier Truck Weights. Transp. Res. Rec. J. Transp. Res. Board 2015, 2478, 82–92. [Google Scholar] [CrossRef]
  17. Trzciński, G.; Moskalik, T.; Wojtan, R. Total weight and axle loads of truck units in the transport of timber depending on the timber cargo. Forests 2018, 9, 164. [Google Scholar] [CrossRef] [Green Version]
  18. Tymendorf, Ł.; Trzciński, G. Multi-Factorial Load Analysis of Pine Sawlogs in Transport to Sawmill. Forests 2020, 11, 366. [Google Scholar] [CrossRef] [Green Version]
  19. Schroeder, R.; Jackson, B.; Ashton, S. Biomass Transportation and Delivery. In Sustainable Forestry for Bioenergy and Bio-Based Products: Trainers Curriculum Notebook; Hubbard, W., Biles, L., Mayfield, C., Ashton, S., Eds.; Southern Forest Research Partnership Inc.: Athens, Greece, 2007; pp. 145–148. Available online: http://www.forestbioenergy.net/training-materials/training-curriculum-notebook/ (accessed on 20 November 2013).
  20. Sosa, A.; Acuna, M.; McDonnell, K.; Devlin, G. Controlling moisture content and truck configurations to model and optimise biomass supply chain logistics in Ireland. Appl. Energy 2015, 137, 338–351. [Google Scholar] [CrossRef] [Green Version]
  21. ISO 18134-2:2017 Solid Biofuels—Determination of Moisture Content—Oven Dry Method—Part 2: Total Moisture—Simplified Method. Available online: https://www.iso.org/standard/71536.html (accessed on 9 January 2021).
  22. BS EN 13183-1:2002 Moisture Content of a Piece of Sawn Timber. Determination by Oven Dry Method. Available online: https://www.en-standard.eu/bs-en-13183-1-2002-moisture-content-of-a-piece-of-sawn-timber-determination-by-oven-dry-method/ (accessed on 9 January 2021).
  23. Durate da Paz, A.M.M. Water Content Measurement in Woody Biomass: Using Dielectric Constant at Radio Frequencies. Mälardalen University Press Licentiate Theses No. 90. School of Sustainable Development of Society and Technology. 2008. Available online: http://www.diva-portal.org/smash/get/diva2:167/FULLTEXT01.pdf (accessed on 9 January 2021).
  24. Hultnäs, M.; Fernandez-Cano, V. Determination of the moisture content in wood chips of Scots pine and Norway spruce using Mantex Desktop Scanner based on dual energy X-ray absorptiometry. J. Wood Sci. 2012, 58, 309–314. [Google Scholar] [CrossRef]
  25. Routa, J.; Kolström, M.; Ruotsalainen, J.; Sikanen, L. Validation of prediction models for estimating the moisture content of logging residues during storage. Biomass Bioenergy 2016, 94, 85–93. [Google Scholar] [CrossRef]
  26. Sosa, A.; Acuna, M.; McDonnell, K.; Devlin, G. Managing the moisture content of wood biomass for the optimization of Ireland’s transport supply strategy to bioenergy markets and competing industries. Energy 2015, 86, 354–368. [Google Scholar] [CrossRef]
  27. Erber, G.; Kanzian, C.; Stampfer, K. Modelling natural drying of European beech (Fagus sylvatica L.) logs for energy based on meteorological data. Scand. J. For. Res. 2016, 31, 294–301. [Google Scholar] [CrossRef]
  28. Lukason, O.; Ukrainski, K.; Varblane, U. Economic benefit of maximum truck weight regulation change for Estonian forest sektor. Veokite täismassi regulatsiooni muutmise majanduslikud mõjud eesti metsatööstuse sektorile. Est. Discuss. Econ. Policy 2011, 19. [Google Scholar] [CrossRef]
  29. Permissible Maximum Weights in Europe. OECD International Transport Forum. 2010. Available online: http://www.internationaltransportforum.org/europe/road/pdf/weights.pdf (accessed on 8 December 2020).
  30. Wilson, S. Permissible Maximum Weights of Lorries in Europe. Available online: https://www.itf-oecd.org/permissible-maximum-weights-lorries-europe (accessed on 26 January 2018).
  31. FinLex 4.12.1992/1257. Asetus Ajoneuvon Käytöstä Tiellä. Available online: http://www.finlex.fi/fi/laki/ajantasa/1992/19921257 (accessed on 8 December 2020).
  32. Liimatainen, H.; Nykänen, L. Impacts of Increasing Maximum Truck Weight—Case Finland; Transport Research Centre Verne, Tampere University of Technology: Tampere, Finland, 2017; Available online: http://www.tut.fi/verne/aineisto/LiimatainenNyk%C3%A4nen.pdf (accessed on 10 January 2021).
  33. Palander, T.; Kärhä, K. Potential traffic levels after increasing the maximum vehicle weight in environmentally efficient transportation system: The Case of Finland. J. Sustain. Dev. Energy Water Environ. Syst. 2017, 5, 417–429. [Google Scholar] [CrossRef]
  34. Sosa, A.; Klvac, R.; Coates, E.; Kent, T.; Devlin, G. Improving Log Loading Efficiency for Improved Sustainable Transport within the Irish Forest and Biomass Sectors. Sustainability 2015, 7, 3017–3030. [Google Scholar] [CrossRef] [Green Version]
  35. Hamsley, A.; Greene, W.G.; Siry, J.; Mendell, B. Improving timber trucking performance by reducing variability of log truck weights. South. J. Appl. For. 2007, 31, 12–16. [Google Scholar] [CrossRef] [Green Version]
  36. Kühmaier, M.; Erber, G. Research trends in European forest fuel supply chains: A review of the last ten years (2007–2016)—part two: Comminution, transport & logistics. Croat. J. For. Eng. 2018, 39, 139–152. [Google Scholar]
  37. FAO; ITTO and United Nations. Forest Product Conversion Factors; FAO: Rome, Italy, 2020. [Google Scholar] [CrossRef]
  38. Francescato, V.; Antonini, E.; Beromi, L.Z.; Metschina, C.; Chamber, S.; Schnedl, C.; Krajnc, N.; Gradziuk, P.; Koscik, K.; Nocentini, G.; et al. Wood Fuels Handbook. Production, Quality requirements, Tradin. Biomass Trade Cetres. 2008. Available online: http://www.biomasstradecentre2.eu/available-literature/ (accessed on 10 January 2021).
  39. Acuna, M.; Mirowski, L.; Ghaffariyan, M.R.; Brown, M. Optimizing transport efficiency and costs in Australian wood chipping operations. Biomass Bioenergy 2012, 46, 291–300. [Google Scholar]
  40. Tymendorf, Ł.; Trzciński, G. Duration of stages of delivery of large−sized Scots pine wood to the sawmill. Sylwan 2020, 164, 549–559. [Google Scholar]
  41. Trzciński, G.; Tymendorf, Ł. Transport Work for the Supply of Pine Sawlogs to the Sawmill. Forests 2020, 11, 1340. [Google Scholar] [CrossRef]
  42. Beardsell, M.G. Decreasing the Cost of Hauling Timber through Increased Payload. Ph.D. Thesis, Virginia Polytechnic Institute and State University, Blacksburg, VA, USA, 1986. Available online: https://vtechworks.lib.vt.edu/handle/10919/53617 (accessed on 9 September 2017).
  43. Johansson, J.; Liss, J.-E.; Gullberg, T.; Björheden, R. Transport and handling of forest energy bundles—advantages and problems. Biomass Bioenergy 2006, 30, 334–341. [Google Scholar] [CrossRef]
  44. Kozakiewicz, P. Physic of Wood in Theory and Practice; Fourth Edition-Changed; Warsaw University of Life Sciences Press: Warsaw, Poland, 2012; Available online: https://www.researchgate.net/publication/326557330_Fizyka_drewna_w_teorii_i_zadaniach_Physic_of_wood_in_theory_and_practise (accessed on 10 January 2021). (In Polish)
  45. Millers, M.; Magaznieks, J. Scots pine (Pinus sylvestris L.) stem wood and bark moisture and density influencing factors. Research for Rural Development. In Proceedings of the Annual 18th International Scientific Conference Proceedings, Jelgava, Latvia, 16–18 May 2012; Volume 2, pp. 91–96. Available online: https://www2.llu.lv/research_conf/Proceedings/18th_volume2.pdf (accessed on 8 December 2020).
  46. Laitila, J.; Routa, J. Performance of a small and a medium sized professional chippers and the impact of storage time on Scots pine (Pinus sylvestris) stem wood chips characteristics. Silva Fenn. 2015, 49, 1382. [Google Scholar] [CrossRef] [Green Version]
  47. Sultana, A.; Kumar, A. Optimal configuration and combination of multiple lignocellulosic biomass feedstocks delivery to a biorefinery. Bioresour. Technol. 2011, 102, 9947–9956. [Google Scholar] [CrossRef]
  48. Trzciński, G.; Moskalik, T.; Wojtan, R.; Tymendorf, Ł. Variability of loads and gross vehicle weight in timber transportation. Sylwan 2017, 161, 1026–1034. (In Polish) [Google Scholar]
Figure 1. Wood biomass generated during the processing of roundwood and the method of its storage—chips (a) and sawdust (b).
Forests 12 00223 g001
Figure 2. A station for weighing whole trucks set on a stationary scale.
Forests 12 00223 g002
Figure 3. A station for measuring the bulk volume of loads.
Forests 12 00223 g003
Figure 4. Comparison of gross vehicle weight (GVW) values by measurement date for unit A wood chips (a); sawdust (b).
Forests 12 00223 g004
Figure 5. Comparison of tare values by measurement date for unit A wood chips (a); sawdust (b).
Forests 12 00223 g005
Figure 6. Comparison of semi-trailer capacity values by measurement date for unit A wood chips (a); sawdust (b).
Forests 12 00223 g006
Figure 7. Comparison usage of semi-trailers capacities by measurement date for unit A wood chips (a); sawdust (b).
Forests 12 00223 g007
Figure 8. Comparison bulk volume of load values by measurement date for unit A wood chips (a); sawdust (b).
Forests 12 00223 g008
Figure 9. Comparison weight of load values by measurement date for unit A wood chips (a); sawdust (b).
Forests 12 00223 g009
Figure 10. Comparison bulk density (Mg⋅m−3) values by measurement date for unit A wood chips (a); sawdust (b).
Forests 12 00223 g010
Figure 11. Absolute moisture content of load values by measurement date for wood chips (a); sawdust (b).
Forests 12 00223 g011
Figure 12. Graph of the dependence of bulk density (Mg⋅m−3) on absolute moisture content for wood chips (a) and sawdust (b).
Forests 12 00223 g012
Table 1. Selected measurements by type of load.
MeasureLoadMeanSDMinMaxQ1MedianQ3
Gross vehicle weight (Mg)Wood chips39.4240.39638.00040.05039.20039.42539.700
Sawdust39.6410.29438.60040.05039.55039.70039.850
Tare
(Mg)
Wood chips16.1540.60414.85018.25015.80016.10016.450
Sawdust15.9380.52615.20017.80015.50015.90016.200
Semi-trailer capacity (m3)Wood chips89.5274.24174.86095.26089.72090.72091.664
Sawdust91.0221.11088.11092.46090.06091.70092.130
Bulk volume of the load (bulk m3)Wood chips64.7833.12756.26674.82662.77664.80466.945
Sawdust70.4652.51662.45773.57569.1871.04872.051
Solid cubic meter (m3)Wood chips27.2091.31323.63231.42726.36627.21828.117
Sawdust23.2530.83020.61124.28022.83023.44623.777
Weight of load (Mg)Wood chips23.2700.68521.05024.75022.85023.34523.700
Sawdust23.7030.64320.80024.75023.45023.75024.100
Weight of 1 m3 of the load (Mg)Wood chips0.8560.0340.7700.9340.8260.8560.883
Sawdust1.0190.0270.9691.0871.0011.0141.036
Bulk density of the load (Mg⋅m3)Wood chips0.36000.02070.30500.42650.34750.35860.3749
Sawdust0.33580.00850.32000.35560.32970.33450.3417
Usage of semi-trailer capacity (%)Wood chips72.5855.56761.81792.44869.22871.42874.339
Sawdust77.4203.01970.44081.48475.09877.82579.860
Notes: SD. standard deviation; Q1. first quartile; Q3 third quartile.
Table 2. The results of the assessment of the significance of differences of selected features depending on the load.
Measure
Type of Load
Gross Vehicle Weight (Mg)Tare
(Mg)
Semi-Trailer Capacity (m3)Bulk Volume of the Load (Bulk m3)Usage of Semi-Trailer
Capacity (%)
Solid Cubic Meter (m3)Weight of Load (Mg)Weight of 1 m3 of Load (Mg)Bulk Density of the Load (Mg⋅m−3)
Wood chips0.00530.02850.80540.00000.00000.00000.03610.00000.0000
Sawdust0.76380.90300.59110.00350.20560.00350.60050.04780.0478
Table 3. Statistical characteristics of absolute moisture content of the loads.
Type of LoadMeanSDMin.Max.Q1MedianQ3
Wood chips108.510.986.1138.9100.4107.0115.5
Sawdust86.312.663.3116.078.384.192.2
Notes: SD, standard deviation; Q1, first quartile; Q3, third quartile.
Table 4. Evaluation of model parameters on GVW for wood chips transport.
ParameterParameter ValueStandard Errort-Statisticp-Valuer2 Coefficient of DeterminationStandard Error of Estimation
Constant term−21.99280.516796−42.55210.00000.98620.04684
Tare (T)0.97160.00985098.64620.0000
Bulk volume m3(Bv)0.35270.003095113.96270.0000
Bulk density Mg⋅m−3 (Bd)63.57960.529833119.99940.0000
Table 5. Evaluation of model parameters on GVW for sawdust transport.
ParameterParameter ValueStandard Errort-Statisticp-Valuer2 Coefficient of DeterminationStandard Error of Estimation
Constant term−22.87190.906769−25.22360.00000.99270.02603
Tare0.98950.01768055.96390.0000
Bulk volume m30.33410.00489768.22970.0000
Bulk density Mg⋅m−368.93110.96480571.44560.0000
Table 6. Evaluation of model parameters for the bulk volume of the chips load.
ParameterParameter ValueStandard Errort-Statisticp-Valuer-Coefficient of Determination
Tare (T)0.9700760.02907333.367400.0000.9349
Bulk density Mg⋅m−3 (Bd)1.0459600.02018351.822640.000
Table 7. Evaluation of model parameters for the bulk volume of the sawdust load.
ParameterParameter ValueStandard Errort-Statisticp-Valuer-Coefficient of Determination
Tare1.0621240.04835921.963100.0000.9392
Bulk density Mg⋅m−30.9735370.03252829.929360.000
Table 8. Spearman’s correlation coefficients for the analyzed parameters.
MeasureBulk Volume of the Load (Bulk m3)Usage of Semi-Trailers Capacities (%)Weight of Load (Mg)Bulk Density of the Load (Mg⋅m−3)Absolute Moisture Content of Load (%)
Bulk volume of the load (bulk m3)x0.8008
0.7829
0.6479
-
−0.5284
−0.7748
−0.5038
−0.9009
Usage of semi-trailers capacities (%)0.7819
0.8004
x0.5112
-
−0.4079
-
-
-
Weight of load (Mg)0.6479
-
0.5112
-
x-
-
-
-
Bulk density of the load (Mg⋅m−3)−0.5284
−0.7748
−0.4079
-
-
-
x0.5015
0.8214
Absolute moisture content of load (%)−0.5038
−0.9009
-
-
-
-
0.5015
0.8214
x
Bold for chips, not bold for sawdust; ‘-’ means no statistically significant correlation.
Table 9. Assessment of model parameters on the dependence of bulk density (Mg⋅m−3) chips on absolute moisture content.
ParameterParameter ValueStandard Errort-Statisticp-Valuer2-Coefficient of Determination
Constant term0.2694880.02293311.75110.00000.2968
Absolute moisture content of load0.0007430.0002203.376160.002243
Table 10. Evaluation of model parameters on the dependence of sawdust bulk density (Mg⋅m−3) on absolute moisture content.
ParameterParameter ValueStandard Errort-Statisticp-Valuer2-Coefficient of Determination
Constant term0.1916770.0461664.15190.0088930.63999
Absolute moisture content of load0.0014850.0004982.98140.030751
Publisher’s Note: MDPI stays neutral with regard to jurisdictional claims in published maps and institutional affiliations.

