Abstract
Research highlights: In this study, the possibility of developing predictive models for both individual trees and forest stands, based on information derived from digital surface models (DSMs), was evaluated. Background and objectives: Unmanned aerial systems (UASs) make it possible to obtain digital images with increased spectral and spatial resolution at a lower cost. Based on the variables extracted by means of the digital representation of surfaces, we aimed at generating mathematical models that would allow the prediction of the main biometric features of both individual trees and forest stands. Materials and methods: Forest stands are characterized by various structures. As such, measurements may address upper-level trees, but most often are oriented towards those belonging to the mean tree category, randomly selected from those identifiable from digital models. In the case of grouped trees, it is the best practice to measure the projected area of the entire canopy. Tree and stand volumes can be determined using models based on features measured in UAS-derived digital models. For the current study, 170-year-old mixed sessile oak stands were examined. Results: Mathematical models were developed based on variables (i.e., crown diameter and tree height) extracted from digital models. In this way, we obtained results characterized by root mean square error (RMSE) values of 18.37% for crown diameter, 10.95% for tree height, and 8.70% for volume. The simplified process allowed for the estimates of the stand volume using crown diameter or diameter at breast height, producing results with RMSE values of 9%. Conclusions: The accuracy of the evaluation of the main biometric features depends on the structural complexity of the studied plots, and on the quality of the DSM. In turn, this leads to the necessity to parametrize the used models in such a manner that can explain the variation induced by the stand structure.
1. Introduction
Field measurements are still the most accurate data source upon which forest management planning is based. The development of unmanned aerial systems (UASs) has created new opportunities in the fields of mapping and the estimation of the biophysical properties of forests. Various information related to their structure can be retrieved by means of remote-sensing techniques in a relatively short time frame, and under various conditions of accessibility [1]. UASs, consisting of various unmanned aerial vehicles (UAVs) equipped with remote-sensing sensors (i.e., digital cameras), make it possible to obtain digital images with high spectral and spatial resolutions. Thus, by using these systems and their associated processing software, tridimensional (3D) models can be generated and used in forestry applications.
Digital images, combined with photo-interpretation techniques, allow for the evaluation of the main stand parameters [2]. Parameter values derived from digital models and orthorectified products fall within acceptable tolerance levels (±10%) [3] when compared to in-situ measurements. The literature has highlighted the relationship between tree diameter at breast height (DBH) and crown width (CW) as being one of the advantages of this approach. Similarly, the root mean square errors (RMSEs) for height estimates show expectedly low values [4] (RMSE = 1.712).
Using UASs equipped with small thermal, laser, or optical sensors has emerged as a promising alternative to obtaining 3D models, and is more frequently being used in forestry applications [5]. Data processing techniques makes it possible to use high-resolution images and 3D data in forest monitoring activities [6,7,8,9,10,11], as well as in taking forest inventory and remotely measuring tree variables [1,12,13,14]. Several studies have focused on estimating the biometric characteristics of either forest stands [15] or individual trees by means of the segmentation of digital models [11,16]. The use of UAV laser scanning provides values for features, such as tree location and height, with accuracies comparable to those reached from ground measurements [17,18]. An important aspect to be considered is the fact that features such as stand volume, basal-area weighted average height (Lorey’s mean height) and average and maximum height [15] were better estimated when the dominant-tree model was used in the calculations.
Fitting UAVs with active laser sensors (UAV-LSs) created the possibility to get 3D data with high resolution. This has been advantageous in the estimation of certain biophysical properties at the level of the individual tree, such as coordinates, height, DBH, CW, pruning height, biomass variation, and rate of pruning [1]. Studies on tree stems and their diameters, along with other structural parameters, have been performed, including below crown level [19,20]. Merging terrestrial and UAV-LS data has led to an improved inventory of forest resources [17]. The direct estimation of aboveground biomass (AGB) without using in-situ observations has been made possible through the use of individual tree approaches (single-tree AGB) by applying allometric models based on variables derived from terrestrial laser scanning (TLS) and specific predictors at the individual tree level [21].
TLS, in addition to associated point-cloud processing techniques using automated algorithms, provides the ability to very accurately determine stand parameters. Applied in stands characterized by variations in crown size and Kraft class, the detection rate of trees can be as high as 97.4% when DBH is above 12 cm, and 84.62% when DBH is below this threshold (as is the case in natural regenerations) [22]. However, research has also highlighted the potential limitations of using TLS, rooted in the complexity of crown structure [23].
UAV-LS technology is one of the latest technological advances, enabling tree-height measurement with an accuracy equivalent to that of forestry applications requirements [24]. Reduced RMSE values (8.6–12.7%) have been attained in the measurement of DBH by means of the supervised processing of TLS along with UAV-LS data, and even better results have been achieved when fully automated processing was used [25].
UAV photogrammetry provides acceptable results for the delineation of crowns, but at a lower cost than UAV-LS [26]. Digital-photography-based canopy height evaluation, due to its high resolution, allows for the extraction of dendrometric features at the stand scale, being more efficient, in particular, for estimating the dominant height in stands of uniform structure [27]. The accuracy of the results is influenced by stand structure. Consequently, the processing of UAV data using structure-from-motion (UAV-SfM) techniques can deliver results similar to those obtained by airborne laser scanning when addressing the biometric characteristics of stands (i.e., dominant height, basal area, aggregation trend of DBH/quadratic mean DBH). UAV allows for the acquisition of high-resolution images at low cost. UAV-SfM data can be used in a complementary manner, rather than as an alternative, to LiDAR data [28], while remaining a suitable tool for observing crown phenology at high temporal resolutions [29].
Despite all the advantages of remote-sensing approaches, stand structure remains one of the main drivers influencing aspects of instrument selection or measurement accuracy. For tree-level determinations, UAV is an effective system for estimating biometric variables.
With regard to the limitations of the UAV-SfM technique, it is notable that not all trees in a stand are visible on the resulting digital surface models (DSMs), which results in the computations being applied only to higher-level trees or isolated individuals. Conducting measurements only on trees belonging to the mean-tree category, considered to be representative of all trees in a stand, greatly simplifies such computations. The number of trees addressed is determined in a probabilistic manner, in relation to the variability of their dimensions. The trees in the sample can be selected proportionally, in relation to their basal area or volume-by-diameter categories. Tree and stand volumes have been determined using models based on biometric variables measured on digital models (obtained from UAS data). Since these biometric variables include crown dimensions and tree height, they can be included in models that calculate volume. As a stand structure forms the shape and dimensions of trees, appropriate models have to be developed, based on structure type. Through this study, we aimed to develop models for the estimation of sessile oak (Quercus petraea) stand characteristics (such as DBH and volume), based on variables measured from UAS digital surface models (i.e., crown diameter and tree height). The accuracy of the determinations was analyzed with reference to values obtained through a classical inventory of the entire 170-year-old sessile oak stand.
2. Materials and Methods
Table 1 gives the acronyms for the addressed biophysical variables.

Table 1.
Abbreviations of the biophysical variables used in the equations.
2.1. Study Area
The study was carried out in the forests near Brasov city (45°38′ N, 25°35′ E), in Romania’s central region. This region is rich in different forest ecosystems, from sessile oak stands at lower altitude to Norway spruce stands close to timber line.
For this study, stands with protective functions, situated at the upper limit of their bioregion, and comprising sessile oak as the main species and beech with hornbeam as the mixing species, were selected. The silvicultural treatments applied to these stands have a very conservative character, aimed at recreating the conditions found in naturally regenerated stands and ensuring their permanence, in order to exercise the continuity of their protective functions.
2.2. Field Measurements
Plots were placed in two sessile oak stands. Plots S1 and S2 were installed in a 170-year-old stand, each covering an area of 0.5 ha (50 m × 100 m; 45°38′ N, 25°33′ E). In both plots, the slope of the terrain was 10°. S1 was placed in a mild soil microstation on the sun-facing side of the mountain, while S2 was located in a shadowed microstation with deeper soil. Plots S3 and S4, measuring 1 ha each (100 m × 100 m), were installed in another stand, aged 110 years (45°38′ N, 25°34′ E), on a 20° slope partially facing the sun. An increased variability in the biometric variables of the trees allowed for the development of valid models only for the older stand plots. As such, the 110-year-old stand was used only for testing the generated models.
For each tree in the sampled areas, we measured DBH, height, pruning height, and crown diameter (CW). The wood quality and Kraft class were also evaluated. The stem diameter was derived from the circumference. The height and crown diameter were measured using a Vertex hypsometer and a Criterion laser. For the older stand, the (X, Y) coordinates of each tree were determined using survey engineering methods and a Leica TC 407 total station. Knowing the coordinates, the listed trees could be positioned on the cartographic support (Figure 1a). Also, by means of the total station, the field elevations (Z) were recorded, to obtain a digital terrain model. To improve the accuracy of the determinations, four connection marks (tie points) were placed on the ground in such a manner that they could easily be identified on the digital images. Digital aerial images were acquired, using a DJI Phantom 3 Advanced UAV, from a height of 56 m, and with a 90% overlap. The automated flight of the UAV was aided by the use of Global Navigation Satellite System technology. The accuracy of the model (averaging 0.7 m XY and 1 m Z) has been improved by using four ground control points recorded through the GNSS technique. These have served as references, forming the basis for orientating the digital model. After compensation, an RMSE value of 1.03 cm was obtained on X axis and 1.40 cm on Y axis.
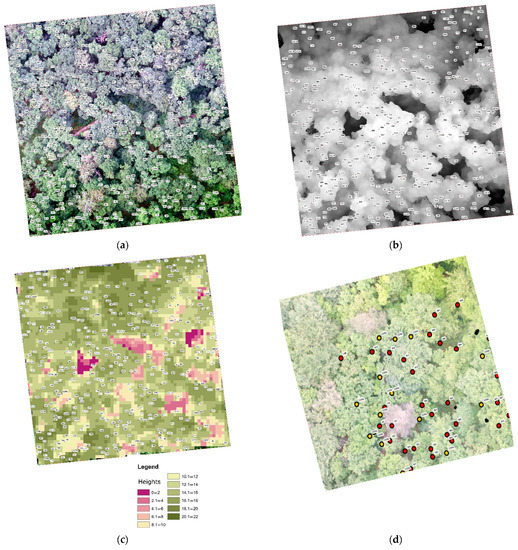
Figure 1.
Models derived from digital image processing. (a) Positioning of points on aerial imagery; (b) positioning of trees on the digital surface models (DSM); (c) canopy height model (CHM) with tree segmentation; (d) detailed view.
2.3. Measurements Made on the Digital Model
After assembling the digital images and georeferencing the point cloud, the SfM technique allowed the extraction of a DSM, as well as other models necessary for further processing (Figure 1b,c).
The 3D point cloud (Figure 2a) was generated using Agisoft Photoscan software. The canopy height model was generated by first normalizing the point cloud (reducing the heights to a reference plane) followed by barycentric spike free interpolation [30] resulting in a raster with a 1 m × 1 m spatial resolution. Control cross-sections were traced on the resulting model in order to evaluate the height of the trees from the CHM.
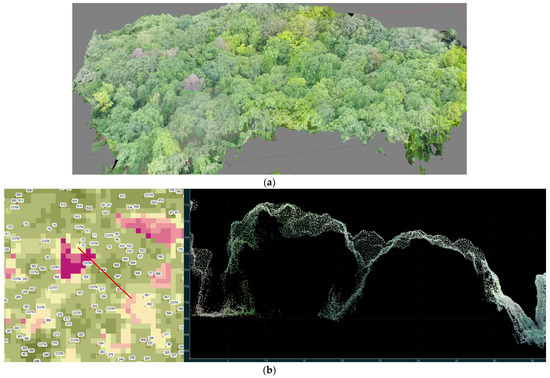
Figure 2.
Overview obtained by processing data from plot S1. (a) 3D unmanned aerial system (UAS) point cloud; (b) transverse cross-section from the point cloud.
2.4. Data Analysis
A synthesis of the field data can be found in Table 2. In the studied stands, the sessile oak proportion ranged from 56% to 91%.
Table 2.
Structural characteristics.
Due to the structure of the stands, not all trees could be identified on the digital model. This was because they had similar heights and, consequently, overlapping crowns. Isolated trees were visible and easily identifiable. In cases where the crowns could be individualized, the characteristics visible on the digital model (i.e., crown projection area of tree and tree height) were extracted. The number of individual trees measured on the digital model was established using a probabilistic approach [1] based on the variability of the biometric characteristics of the trees, as described by the field measurements (Table 3). Thus, the selected sample implies a tree volume determination error no more than 10% at a probability of 95%. On the digital model, the sample trees were identified on the plots using their field-measured coordinates. They were selected in relation to their basal area and diameter categories, determined from field measurements. Most of these sample trees were selected from median-diameter categories, and particularly in the diameter category of the mean tree, considering the basal area. Trees in this category had average crown diameters. Thus, the average diameter of the sample trees was very close to the dg value. The CWs of the sample trees were deducted from the crown projection areas measured on the digital model. For trees that were not clearly individualized on the digital model, CW and tree height were determined based on models expressing the DBH-CW and DBH-tree height relationships. These models were designed based on characteristics measured at the individual tree level.
Table 3.
Coefficients of variation (for sessile oak).
Lastly, based on the digital model, the crowns of all the trees were vectorized. The crowns of grouped trees that could not be precisely individualized on the digital model were treated as a unique value, and vectorized as such. The canopy projection area of the trees was used in a simplified volume determination process (i.e., processing of the mean tree, considering the volume).
The volume of each tree was computed as a function of DBH and tree height, following the regression equation developed for Romanian forest species [31,32]:
log v = a0 + a1 log d + a2 log d2 + a3 log h + a4 log2 h
In Equation (1), for sessile oak, the coefficients take the following values: a0 = −4.17315, a1 = 2.27662, a2 = −0.09084, a3 = 0.57596 and a4 = 0.093429.
In order to determine the biometric variables of the ideal trees that were included in the models, correlations to the characteristics of the trees inventoried in the field (Table 4) were considered.
Table 4.
Correlation coefficients.
The main variable for accurately estimating tree volume is DBH. The influence of structural and site conditions on the size of trees leads to models that express the relationship between the biometric characteristics of the trees that need to be developed separately for each structure type.
Models established at both the individual tree and stand level were based on relationships between the tree characteristics (i.e., crown projection area, crown diameter, and tree height), determined from the digital model and those determined through field measurements (tree DBH, height, and volume).
3. Results
3.1. Estimation of Tree Biometric Features
DBH. In the older sessile oak stand, the increase in diameter of very thick trees follows a curved, not linear, trend. The same trend was noticed in the relationship between CW and DBH. The CW of trees measured on the model are close to those measured in the field (Figure 3a). The RMSE values range between 15.33 and 20.21%.
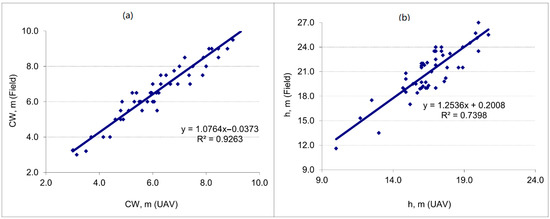
Figure 3.
Relationships between the biometric characteristics of trees determined from the digital model and those determined in the field. Crown diameter (a) and tree height (b). h UAV is the tree height measured on the digital model (height model in Figure 1c).
The relationship between the CW of trees determined on the digital model and the diameter of the same trees measured in the field is expressed by Equations (2) and (3):
for S1 and
for S2.
d = 0.1593CW3 − 1.9808CW2 + 11.777CW + 11.231
d = 0.1663CW3 − 2.6011CW2 + 18.772CW − 12.867
In those relationships, the CW was computed from the crown projection area of vectorized trees.
For the older sessile oak stand, the regression equation can be generalized:
d = 0.058CW3 − 0.3011CW + 2.4391CW + 27.021
By implementing Equations (2) and (3), the DBH values are close to those extracted by means of classical inventory measurements, with RMSEs ranging from 0.33 to 0.88%, and they have equally similar basal areas. For diameters, R2 indicates a close correlation between the field measured and the estimated values through Equations (2) and (3) (Figure 3a), compared to the height situation for which R2 values are much lower (Figure 3b).
Tree heights were measured on the CHM model. The heights measured at the same trees in the field have recorded smaller values with differences between 2.0 and 7.0 m. For the mean tree, regarding basal area, the values determined from the digital model showed negative differences, ranging between 3.4 and 5.9 m (i.e., between 17 and 25%), for plots S1 and S2, respectively, compared to those initially measured in the field. The R2 values were reduced in comparison to the remaining characteristics, reaching values of 0.7 (Figure 3b), and RMSE values of between 10.40 and 11.70%. In general, differences increase proportionally with the tree height and the complexity of stand vertical structure. Some examples by diameter category are shown in Table 5. However, the coefficient of variation of the heights measured on the model has much lower values, ranging from 7 to 8%, than its values for the real heights.
Table 5.
Examples of heights measured in the field and on CHM.
The tree height measured on the digital model was adjusted using a linear model:
for S1 and
for S2.
h = 1.4975 b − 4.6541
h = 2.4994 b − 20.146
In Equations (5) and (6), b represents the tree heights measured on the digital model (h UAV). In this study, the variation in heights measured on the digital model in relation to the real DBHs was expressed by means of a logarithmic equation.
Tree volume was computed using Equation (1). In this equation, the DBH obtained from Equations (2) and (3), and the tree height computed from Equations (5) and (6) were included. The computed volumes produced values similar to those determined on the basis of field measurements (Figure 4), with RMSE values ranging between 8.30 and 8.94%.
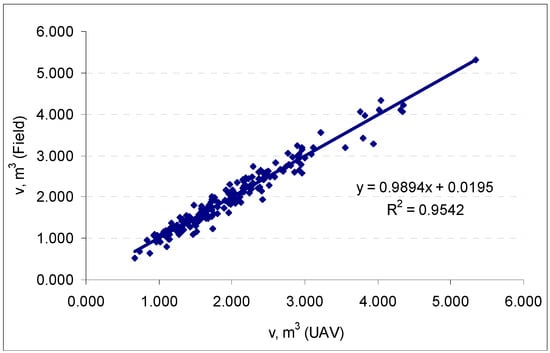
Figure 4.
Relationship between estimated volume and volume determined from field measurements.
3.2. Stand Volume Estimation
Equation (1) was also used to calculate the stand volume based on data obtained from the digital model, as well as field measurements. The greatest difference (−21.6%) was recorded when the measured heights from the digital model were directly used in the calculations. By adjusting these using Equations (5) and (6), the differences narrowed to 0.1% (Table 6).
Table 6.
Stand volume.
The relationships between the characteristics of the trees determined on the basis of the digital model were expressed by simplified regression equations (Equations (7)–(12)), which are useful for expeditiously determining tree and stand volumes.
Tree volume was expressed only in relation to their diameter, computed using Equations (2) and (3), while stand volume resulted from the quantification of the individual tree volumes, by using the relationship:
for S1 and
for S2 (Figure 5).
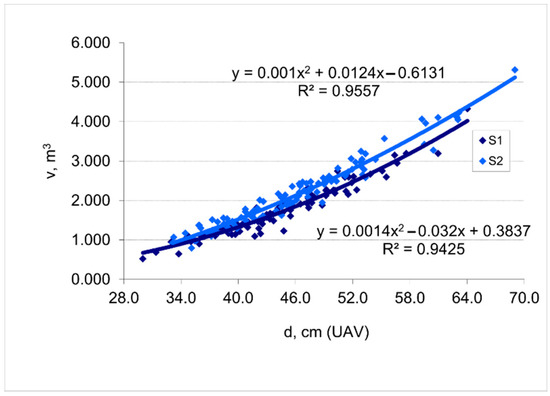
Figure 5.
Relationship between tree volume (v) and diameter at breast height (DBH) (d), where DBH was estimated using Equations (2) and (3), and CW (d UAV).
For the calculation at tree level, only the CW was computed, while for the crown projection areas of trees measured from aerial imagery, the stand volume was computed as the sum of the tree volumes through the relation:
By expressing tree volume in relation to the product (k) between CW and h, measured from the aerial photos (h UAV), the stand volumes can be expressed by the relationship:
For Equations (7) and (8), R2 reaches values ranging between 0.94 and 0.95. The tree volume values are explained by Equations (9) and (10) with a confidence interval of 95% (Figure 6a,b) Compared to the field measurements, the volume differences range between −2.64 and 5.04% (Table 7).
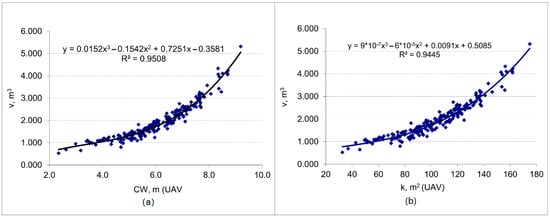
Figure 6.
Relationship between tree volumes and their biometric characteristics computed using measurements made on the digital model. (a) Crown diameter; (b) product between crown diameter and tree height. CW was computed using Equations (2) and (3), and k = CW*h UAV.
Table 7.
Volume resulting from application of Equations (1) and (7)–(10).
For stands with grouped trees, because their crowns could not be separated, only Equation (9) could be used for volume determination of the mean tree in relation to the volume. As a consequence, for determination of the stand volume, Equation (11) was used. In Equation (11), instead of vv, vg (i.e., the volume of the mean tree when considering the basal area) was used. For even stands, the two mean trees had close volumes (Table 8):
Table 8.
Application of the mean-tree approach.
In Equation (11), the tree canopy projection includes both the area of the projection of the crowns from isolated trees and the canopy area of grouped trees whose crowns could not be individualized and measured separately. CAg can be determined as the arithmetic mean of the crowns belonging to trees with average dimensions. In our calculations, CAg was determined directly from the crown diameter of the mean tree, when considering its basal area (CWg), by means of the following relation:
CWg = 0.075CWd sup + 0.6725
In Equation (12), CWd sup represents the mean crown diameter of the trees that have DBH greater than dg, and trees with visible crowns on the digital model. Applying Equation (11) to plots S1 and S2 resulted in volumes 1.1 to 1.8% smaller than those computed from the field measurements (Table 8).
4. Discussion
Focused around developing mathematical models based on trees variables measured on DSM, this paper analyzes the possibility of extending them towards stands of different structural conditions. Considering this, we resorted to a methodological approach, showcasing the holistic use of UAV technology and dendrometrics, rather than further developing previous research.
4.1. Accuracy of Evaluated Biometric Variables
Several models for estimating the biometric variables of trees measured from digital models obtained by means of UAV technology were tested. Tree crown was found to be a reliable source of information regarding tree DBH in the case of stands with even age structures, uniform densities and a low height coefficient of variation. For the tree crowns, the RMSE values ranged from 15.33 to 20.21% (Table 9). These values are consistent with results from previous studies ([13]: RMSE = 14.29–18.56%). These results are specific to the particular stand structure of the studied plots, as this shapes the size and geometry of the trees. Variable density in the stand influences the d-CW relationship. An analysis of the ratio between the two computed characteristics (CW and d) from field data gave R2 values of around 0.70, while similar research [4] has shown that the relationship is stronger if crown diameter is used. Using the generated models (Equations (2) and (3)), the DBH values were estimated as being close to those measured in the field, with low RMSE values (0.32–0.89%). Since using the digital model to measure trees favors individuals from the upper levels of the canopy [33], for stands with grouped crowns, the canopy should be vectorized as a whole. The mean tree of the stand can be used to simplify the calculation of the stand volume (i.e., the mean tree when considering the basal area or volume) for such cases. The crown diameter of the mean tree in the stand can be estimated based on the diameter of the upper-level trees, which is more easily visible on a digital model. Applying Equations (11) and (12), based on the use of mean-tree variables, led to 1.1–1.8% smaller values relative to the volume determined from field measurements.
Table 9.
Accuracy of the determination of tree characteristics from the model.
DBH is a variable that allows the easy estimation of tree volume. Equations (7) and (8) indicate that around 95% of the variation in tree volume can be explained by variation in the crown diameter, determined by measurements from the digital model. When implementing Equations (7) and (8), the results showed little difference to those from field measurements, with the RMSE reaching values of between 8.82 and 9.60%.
In general, the values obtained from measurements from the digital model are close to those determined from field measurements. However, determinations using the digital model showed problems in capturing the heights of all the trees. The errors in determining tree height increase with an increase in tree height, under conditions of an intimate mixture of trees with different heights and closer to each other (i.e., increase of stand density). The differences between the estimated and field-measured height values are highlighted by RMSE values between 10.40 and 11.70%, which support the findings of previous studies ([1,13,15]: RMSE = 11.42–12.62%). For the mean tree of the stand, considering the basal area approach, for plots S1 and S2, respectively, characterized by heights between 19.6 and 23.3 m, only 17 and 25% of the real heights were estimated. For the mean tree, when considering the basal area, the sub evaluated height values measured from the digital model gave a lower volume than the reference by 14.3 (for S1) and 21.2% (for S2), respectively. As a consequence, it was necessary to calibrate the heights measured from the digital model by linear models, as expressed by Equations (5) and (6). Following calibration, the resulting volumes were identical to the reference volumes (with the exception of S2, with a 0.02% smaller volume).
Research carried out under different flight conditions (altitude 60 to 140 m, overlap between 80 and 95%) using the same UAV [34] showed that these conditions have a negligible effect on errors when measuring height. For tree heights up to 26 m, errors often reach 4 m, and tend to increase as the height of the trees increases.
The models generated in this study, based on digital model measurements, led to RMSE values of around 9% (Table 9), close to those achieved in other studies [1,15]. At the stand level, by applying Equation (10), the RMSE was 11.12% (Table 4). This can be explained by a much greater increase in DBH in comparison to heights from the old stands, with aspect also highlighted by the slenderness index values (Table 2). The increased percentages (over 80%) for DBH, in terms of volume growth, produced an increase in k in Equation (10).
Using mean-tree variables considering the basal area to determine the volume of a stand using Equation (11) rather than mean tree considering the volume led to negligible volume differences (0.52% lower than the reference volume in plot S1, 0.65% in S2, Table 9). This suggests that either of these two approaches can be used for determining the volume of uniform-structured stands.
4.2. Limits of the Established Equations
The models generated in this study may be used for sessile oak stands of similar structure (where the slenderness index has values close to those shown in Table 2) that also experience similar environmental conditions. Our study shows that, for similar crown diameters, trees from different production sites may have different DBHs (Figure 7a). Similar influences are also exerted on tree height. At the same DBH, with the same crown diameter, tree height varies widely under the same situational and structural conditions (Figure 7b).
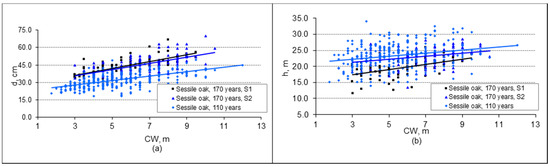
Figure 7.
DBH and (a) tree height variation, (b) crown diameter.
Crown diameter is a good indicator of DBH, but the strength of their relationship is specific to each structure. At the species level, models based on this relationship must be differentiated according to the age of the stand, their density and the productivity category. In medium- and superior-productivity sites, the correlation between crown diameter and tree height decreases with an increase in stand density. Therefore, the relationships between crown diameter and other variables are more stable where trees are systematically treated to avoid large variations in density from time to time in a stands’ development.
This highlights the fact that relationships addressing tree volume based on single traits cannot be generalized. In the calculation of tree volume, in addition to DBH and crown diameter, tree height should also be included. From the structural analysis of the studied stands, no strong correlation between tree volume and crown length could be extracted. Also, this correlation is reduced if pruning height is taken into account.
The accuracy in determining the main tree and stand biometrics depends on the quality of the digital surface model. Environmental factors, such as wind speed, solar position relative to the UAV, and temperature variations can influence the quality of the recorded information. In addition, it should be noted that reflected light from the canopy, the stand composition and its vertical structure [11] are factors that can influence the quality of the digital imagery. Field conditions must also be considered. Sometimes, with hard-to-reach plots, the cost of the associated activities and the conditions for processing the recorded data can increase. Despite these drawbacks, UAV technology is an effective tool that can be used in forest management planning and inventory practices. Crown diameter and tree height are variables that can be easily computed by processing digital images acquired using UAVs. However, the use of other techniques should not be excluded. The structural complexity of a stand can determine the most appropriate technology, or combination thereof, to be used.
5. Conclusions
This study highlighted the possibility of estimating the main tree and stand biometric variables using information provided by UAV image processing. While digital models are crucial in delivering the most accurate results, understanding their limits allows mathematical models to be generated that can further improve the accuracy of the determinations. However, these models can only be replicated by using the same technologies and techniques, and only for similar trees and stand structures. The determination of mathematical models involves taking into consideration in the equations several variables that relate to a stand’s structural features. The two variables that can most easily be measured from the digital model are crown diameter and tree height. Used together, these increase the accuracy of the results.
Simplified procedures, based on the relationships between the biometric characteristics of trees that can be measured from digital models, can also be applied to the determination of stand volumes. Thus, such procedures may be applied for the rapid determination of volumes under conditions where precision is not required.
Tree features, such as DBH, height, and crown dimensions, vary in relation to stand structure. Therefore, when developing models based on these variables, stand structure, species composition, and age class should be taken into consideration.
Author Contributions
Conceptualization, G.M.T. and A.C.; Data curation, G.M.T. and A.C.D.; Formal analysis, G.M.T. and A.C.; Investigation, G.M.T., A.C.D., A.C. and I.S.P.; Methodology, G.M.T. and A.C.; Software, A.C.D.; Supervision, G.M.T.; Validation, A.C.D.; Visualization, I.S.P.; Writing—original draft, G.M.T.; Writing—review & editing, G.M.T. and I.S.P. All authors have read and agreed to the published version of the manuscript.
Funding
This research received no external funding.
Institutional Review Board Statement
Not applicable.
Informed Consent Statement
Not applicable.
Acknowledgments
We are grateful to Mihai Daniel Niță for the IT infrastructure support required for processing the aerial images.
Conflicts of Interest
The authors declare no conflict of interest.
References
- Puliti, S.; Ørka, H.O.; Gobakken, T.; Næsset, E. Inventory of small forest areas using an unmanned aerial system. Remote Sens. 2015, 7, 9632–9654. [Google Scholar] [CrossRef]
- Vorovencii, I. Fotogrametrie; Editura Matrix Rom: Bucuresti, Romania, 2010. [Google Scholar]
- Zagalikis, G.; Cameron, A.D.; Miller, D.R. The application of digital photogrammetry and image analysis techniques to derive tree and stand characteristics. Can. J. For. Res. 2005, 35, 1224–1237. [Google Scholar] [CrossRef]
- Iizuka, K.; Yonehara, T.; Itoh, M.; Kosugi, Y. Estimating Tree Height and Diameter at Breast Height (DBH) from Digital surface models and orthophotos obtained with an unmanned aerial system for a Japanese Cypress (Chamaecyparis obtusa) Forest. Remote Sens. 2018, 10, 13. [Google Scholar] [CrossRef]
- Salamí, E.; Barrado, C.; Pastor, E. UAV flight experiments applied to the remote sensing of vegetated areas. Remote Sens. 2014, 6, 11051–11081. [Google Scholar] [CrossRef]
- Vorovencii, I. A change vector analysis technique for monitoring land cover changes in Copsa Mica, Romania, in the period 1985–2011. Environ. Monit. Assess. 2014, 186, 5951–5968. [Google Scholar] [CrossRef]
- Vorovencii, I. Quantifying landscape pattern and assessing the land cover changes in Piatra Craiului National Park and Bucegi Natural Park, Romania, using satellite imagery and landscape metrics. Environ. Monit. Assess. 2015, 187, 692. [Google Scholar] [CrossRef] [PubMed]
- Vorovencii, I. Assessing and monitoring the risk of desertification in Dobrogea, Romania, using Landsat data and decision tree classifier. Environ. Monit. Assess. 2015, 187, 204. [Google Scholar] [CrossRef] [PubMed]
- Vorovencii, I. Applying the change vector analysis technique to assess the desertification risk in the south-west of Romania in the period 1984–2011. Environ. Monit. Assess. 2017, 189, 524. [Google Scholar] [CrossRef]
- Zhang, J.; Hu, J.; Lian, J.; Fan, Z.; Ouyang, X.; Ye, W. Seeing the forest from drones: Testing the potential of lightweight drones as a tool for long-term forest monitoring. Biol. Conserv. 2016, 198, 60–69. [Google Scholar] [CrossRef]
- Mohan, M.; Silva, C.A.; Klauberg, C.; Jat, P.; Catts, G.; Cardil, A.; Hudak, A.T.; Dia, M. Individual tree detection from unmanned aerial vehicle (UAV) derived canopy height model in an open canopy mixed conifer forest. Forests 2017, 8, 340. [Google Scholar] [CrossRef]
- Puliti, S.; Ene, L.T.; Gobakken, T.; Næsset, E. Use of partial-coverage UAV data in sampling for large scale forest inventories. Remote Sens. Environ. 2017, 194, 115–126. [Google Scholar] [CrossRef]
- Panagiotidis, D.; Abdollahnejad, A.; Surový, P.; Chiteculo, V. Determining tree height and crown diameter from high-resolution UAV imagery. Int. J. Remote Sens. 2017, 38, 8–10. [Google Scholar] [CrossRef]
- Otero, V.; Van De Kerchove, R.; Satyanarayana, B.; Martínez-Espinosa, C.; Fisol, M.A.B.; Ibrahim, M.R.B.; Sulong, I.; Mohd-Lokman, H.; Lucas, R.; Dahdouh-Guebas, F. Managing mangrove forests from the sky: Forest inventory using field data and Unmanned Aerial Vehicle (UAV) imagery in the Matang Mangrove Forest Reserve, peninsular Malaysia. For. Ecol. Manag. 2018, 411, 35–45. [Google Scholar] [CrossRef]
- Ota, T.; Ogawa, M.; Mizoue, N.; Fukumoto, K.; Yoshida, S. Forest Structure Estimation from a UAV-Based Photogrammetric Point Cloud in Managed Temperate Coniferous Forests. Forests 2017, 8, 343. [Google Scholar] [CrossRef]
- Fritz, A.; Kattenborn, T.; Koch, B. Uav-Based Photogrammetric Point Clouds—Tree STEM Mapping in Open Stands in Comparison to Terrestrial Laser Scanner Point Clouds. ISPRS Int. Arch. Photogramm. Remote Sens. Spat. Inf. Sci. 2013, XL-/W2, 141–146. [Google Scholar] [CrossRef]
- Jaakkola, A.; Hyyppä, J.; Kukko, A.; Yu, X.; Kaartinen, H.; Lehtomäki, M.; Lin, Y. A low-cost multi-sensoral mobile mapping system and its feasibility for tree measurements. ISPRS J. Photogramm. Remote Sens. 2010, 65, 514–522. [Google Scholar] [CrossRef]
- Wallace, L.; Lucieer, A.; Watson, C.S. Evaluating tree detection and segmentation routines on very high resolution UAV LiDAR ata. IEEE Trans. Geosci. Remote Sens. 2014, 52, 7619–7628. [Google Scholar] [CrossRef]
- Chisholm, R.A.; Cui, J.; Lum, S.K.Y.; Chen, B.M. UAV LiDAR for below-canopy forest surveys. J. Unmanned Veh. Syst. 2013, 1, 61–68. [Google Scholar] [CrossRef]
- Wieser, M.; Mandlburger, G.; Hollaus, M.; Otepka, J.; Glira, P.; Pfeifer, N. A case study of UAS borne laser scanning for measurement of tree stem diameter. Remote Sens. 2017, 9, 1154. [Google Scholar] [CrossRef]
- Puliti, S.; Breidenbach, J.; Astrup, R. Estimation of forest growing stock volume with UAV laser scanning data: Can it be done without field data? Remote Sens. 2020, 12, 1245. [Google Scholar] [CrossRef]
- Heinzel, J.; Huber, M.O. Constrained spectral clustering of individual trees in dense forest using terrestrial laser scanning data. Remote Sens. 2018, 10, 1056. [Google Scholar] [CrossRef]
- Pascu, I.S.; Dobre, A.C.; Badea, O.; Tanase, M.A. Retrieval of forest structural parameters from terrestrial laser scanning: A Romanian case study. Forests 2020, 11, 392. [Google Scholar] [CrossRef]
- Liang, X.; Wang, Y.; Pyörälä, J.; Lehtomäki, M.; Yu, X.; Kaartinen, H.; Kukko, A.; Honkavaara, E.; Issaoui, A.E.I.; Nevalainen, O.; et al. Forest in situ observations using unmanned aerial vehicle as an alternative of terrestrial measurements. For. Ecosyst. 2019, 6, 1–16. [Google Scholar] [CrossRef]
- Wang, Y.; Pyörälä, J.; Liang, X.; Lehtomäki, M.; Kukko, A.; Yu, X.; Kaartinen, H.; Hyyppä, J. In situ biomass estimation at tree and plot levels: What did data record and what did algorithms derive from terrestrial and aerial point clouds in boreal forest. Remote Sens. Environ. 2019, 232, 111309. [Google Scholar] [CrossRef]
- Yurtseven, H. Comparison of GNSS-, TLS- And different altitude UAV-generated datasets on the basis of spatial differences. ISPRS Int. J. Geo-Inf. 2019, 8, 175. [Google Scholar] [CrossRef]
- Lisein, J.; Pierrot-Deseilligny, M.; Bonnet, S.; Lejeune, P. A photogrammetric workflow for the creation of a forest canopy height model from small unmanned aerial system imagery. Forests 2013, 4, 922–944. [Google Scholar] [CrossRef]
- Jayathunga, S.; Owari, T.; Tsuyuki, S. Evaluating the performance of photogrammetric products using fixed-wing UAV imagery over a mixed conifer-broadleaf forest: Comparison with airborne laser scanning. Remote Sens. 2018, 10, 187. [Google Scholar] [CrossRef]
- Dandois, J.P.; Ellis, E.C. High spatial resolution three-dimensional mapping of vegetation spectral dynamics using computer vision. Remote Sens. Environ. 2013, 136, 259–276. [Google Scholar] [CrossRef]
- Khosravipour, A.; Skidmore, A.K.; Isenburg, M. Generating spike-free digital surface models using LiDAR raw point clouds: A new approach for forestry applications. Int. J. Appl. Earth Obs. Geoinf. 2016, 52, 104–114. [Google Scholar] [CrossRef]
- Giurgiu, V. Dendrometrie și Auxologie Forestieră; Ceres: Bucharest, Romania, 1979. [Google Scholar]
- Giurgiu, V.; Decei, I.; Draghiciu, D. Metode si Tabele Dendrometrice; Ceres: Bucharest, Romania, 2004. [Google Scholar]
- Popescu, S.C.; Wynne, R.H.; Nelson, R.F. Measuring individual tree crown diameter with lidar and assessing its influence on estimating forest volume and biomass. Can. J. Remote Sens. 2003, 29, 564–577. [Google Scholar] [CrossRef]
- Kameyama, S.; Sugiura, K. Estimating tree height and volume using unmanned aerial vehicle photography and sfm technology, with verification of result accuracy. Drones 2020, 4, 19. [Google Scholar] [CrossRef]


Publisher’s Note: MDPI stays neutral with regard to jurisdictional claims in published maps and institutional affiliations. |
© 2021 by the authors. Licensee MDPI, Basel, Switzerland. This article is an open access article distributed under the terms and conditions of the Creative Commons Attribution (CC BY) license (http://creativecommons.org/licenses/by/4.0/).