Article

Community Structure and Soil Mineral Concentration in Relation to Plant Invasion in a Subtropical Urban and Rural Ecotone

College of Forestry and Landscape Architecture, South China Agricultural University, Guangzhou 510642, China
*
Author to whom correspondence should be addressed.
Forests 2021, 12(2), 185; https://doi.org/10.3390/f12020185
Submission received: 3 December 2020 / Revised: 2 February 2021 / Accepted: 4 February 2021 / Published: 7 February 2021
(This article belongs to the Special Issue Ecology of Alien Species in Forests)

Abstract

:
Alien species invasion affects local community biodiversity and stability considerably, and ecosystem services and functions will accordingly be dramatically changed. Many studies have reported a correlation between invasibility and the chemical nature of soil, but the influences of understory plant community structure and soil trace element concentrations on invasibility have not been fully explored. Landscape heterogeneity in the urban and rural ecotone may alter the invasion process, and assessing the invasibility of different types of native forests may lead to a better understanding of the mechanisms by which native species resist invasion. We compared the composition, structure, diversity and stability of the understory community in abandoned fallows, severely invaded by Mikania micrantha and Borreria latifolia, and adjacent natural and planted forests in the urban and rural ecotone of Eastern Guangzhou, China. Additionally, we quantified mineral element concentrations in the topsoil (0–25 cm) most influenced by the root system of understory communities in the forest stand types. Abandoned fallows had the highest concentrations of available ferrum (Fe) and available boron (B) and the lowest concentration of total mercury (Hg) Hg among the three stand types. In contrast to various species diversity indices, the understory structure of the three stands better explained differences in community invasibility. Average understory cover significantly differed among the three stand types, and those types with the greatest number of stems in height and cover classes 1 and 2 differed the most, indicating that seedling establishment may deter invasion to a certain extent. CCA (canonical correspondence analysis) results better reflected the distribution range of each stand type and its relationship with environmental factors, and available Fe, available B, exchangeable calcium (Ca), exchangeable magnesium (Mg), cover, available copper (Cu) and total Hg , were strongly related the distribution of native and exotic understory species. Invasion weakened community stability. The stability index changed consistently with the species diversity index, and abandoned fallows understory community stability was lower than the other stand types. According to our results, both soil mineral element concentrations and community structure are related to alien species invasion. Against the backdrop of urbanization and industrialization, this information will provide forest management and planning departments with certain reference points for forest protection and invasive plant management.

1. Introduction

Climate warming, land use change and biodiversity loss now have become the leading three drivers of global changes, and biological invasion is a key cause of diversity loss [1]. Alien plant invasion significantly affects local community biodiversity and stability, and ecosystem services and functions will accordingly be changed dramatically [2,3]. Therefore, research into local community invasibility mechanisms has become a critical scientific issue in invasion ecology.
Urban and rural ecotone refers to the transition zone between urban and rural areas, and its characteristics integrate some features of the two areas to form composite landscapes [4], which play an important role in balancing ecological problems caused by urbanization. However, habitat loss and fragmentation caused by urbanization also leave urban and rural ecotones at higher invasion risk [5]. The eastern suburb of Guangzhou is a typical urban and rural ecotone where agriculture and forestry are combined. It has a unique ecological patch landscape of orchards, cultivated land, natural forest and planted forest. Here, the alien species, Borreria latifolia and Mikania micrantha, are abundant. Mikania micrantha spread rapidly from Hong Kong to Southern China in 1919, and Borreria latifolia was introduced into Guangdong Province in 1937 as feed for army horses and also planted to stabilize soil. The rapid spread of these two alien species can quickly occupy native species’ living space [6,7,8], which seriously changes understory species composition.
Invasibility refers to community sensitivity to invasion, which is an inherent community characteristic [9]. It is generally believed that there are three hypotheses for the regulation of invasibility by community structure: (1) if the number of local species is large, the community is not easily invaded [3,10], (2) the higher the functional similarity between alien and native species, the easier it is for successful invasion by the alien species [11], and (3) the limitation based on the principle of community construction depends on the number of vacant niches [12]. However, it also largely depends on resource availability. The composition, structure and diversity of native species may be modified when faced with invasion, which, in turn, determines whether a community can accept the successful establishment of invaders [13]. We found that these two invasive species were mainly distributed in the understory of abandoned fallows. This understory was investigated and compared with those of adjacent natural and planted forests in the structure, composition and diversity of native species under similar ecological conditions. Furthermore, exploring the causes and results of invasion in this area was an important step to evaluate the risk and prevention of invasion.
Successful invasion is not only associated with local community structure but also affected by environmental factors. Due to the different survival strategies between invasive and native species, differences in appearance (the composition, structure and life history strategy of the vegetation on the ground) and biomass and litter properties may greatly change soil properties. However, differences in soil mineral elements may also play an important role in determining species distribution [14,15]. It is generally believed that areas with higher resource levels are more likely to be invaded [16,17]. Indeed, in determining invasion success and changing the allocation of aboveground and belowground resources, soil mineral element concentrations play a leading role in promoting invasion [18]. Related studies on soil physical and chemical properties changed by invasion have mainly focused on soil carbon, nitrogen and phosphorus. Various mechanisms have been identified, including the tendency for invasive species to have a higher nutrient utilization rate, litter accumulation and decomposition efficiency. Thus, microhabitats that favor invasion can be established. Likewise, soil microbial communities also promote invasion by positive feedback to regulate and control nutrient cycling and effective proportion [19,20,21]. Native species may also reduce invasion by affecting the availability of soil mineral elements. Some studies have pointed out there is a significant relationship between local and alien plant niche space and soil phosphorus availability [22]. Additionally, invasion could be reduced by lowering soil nitrogen availability [23]. However, there are few studies on other mineral elements and invasion, and related research has mainly focused on riparian aquatic plants. Due to high human interference, and active and frequent river erosion and deposition, considerable heavy metal elements accumulate [24]. A large number of factories are distributed in urban and rural Guangzhou, and the ecotones are threatened with urban and industrial pollution. Many mineral elements are deposited in soil under runoff, leaching and weathering [25,26]. Consequently, the growth and physiological functions of native and alien species have changed in this area, which may affect species distribution. Furthermore, the existence of alien species may also affect soil mineral element composition.
Therefore, our study aim was to compare the relationships between invasibility and changes in soil mineral elements and understory community structure in abandoned fallows and natural and planted forests. Abandoned fallows were seriously invaded by Mikania micrantha and Borreria latifolia in the eastern urban and rural ecotone of Guangzhou, whereas natural and planted forests were only slightly invaded. We asked the following three specific research questions: (1) What was the impact of invasion on soil mineral element composition? (2) How did species composition, structure, stability and diversity respond to invasion? (3) What were the distribution factors driving alien and native species, respectively? We hypothesized that there were differences in soil mineral element concentrations, understory species composition, structure and stability among the three communities and that invasibility was influenced by soil mineral elements and community structure. Our findings should be relevant to land managers and hopefully could be used as guidance for decision-makers in forest protection and management of invasive plants in the future.

2. Materials and Methods

2.1. Study Site

The study area is located in the eastern ecotone of Guangzhou. Guangzhou, situated in Central–Southern Guangdong Province, is the capital of Guangdong Province. This area has a typical south subtropical monsoon climate with an annual mean temperature of 21.5 °C and a mean annual precipitation of 1819 mm. The highest average monthly temperature is 28.3 °C, and the lowest is 14.2 °C. The rainy season is from April to September and it is cool and dry from December to February. Water and heat coincide throughout the year and rainfall is abundant. The soil is mainly south subtropical lateritic red soil and the parent rock is granite, sandstone and shale [27].

2.2. Sampling Design and Plant Census

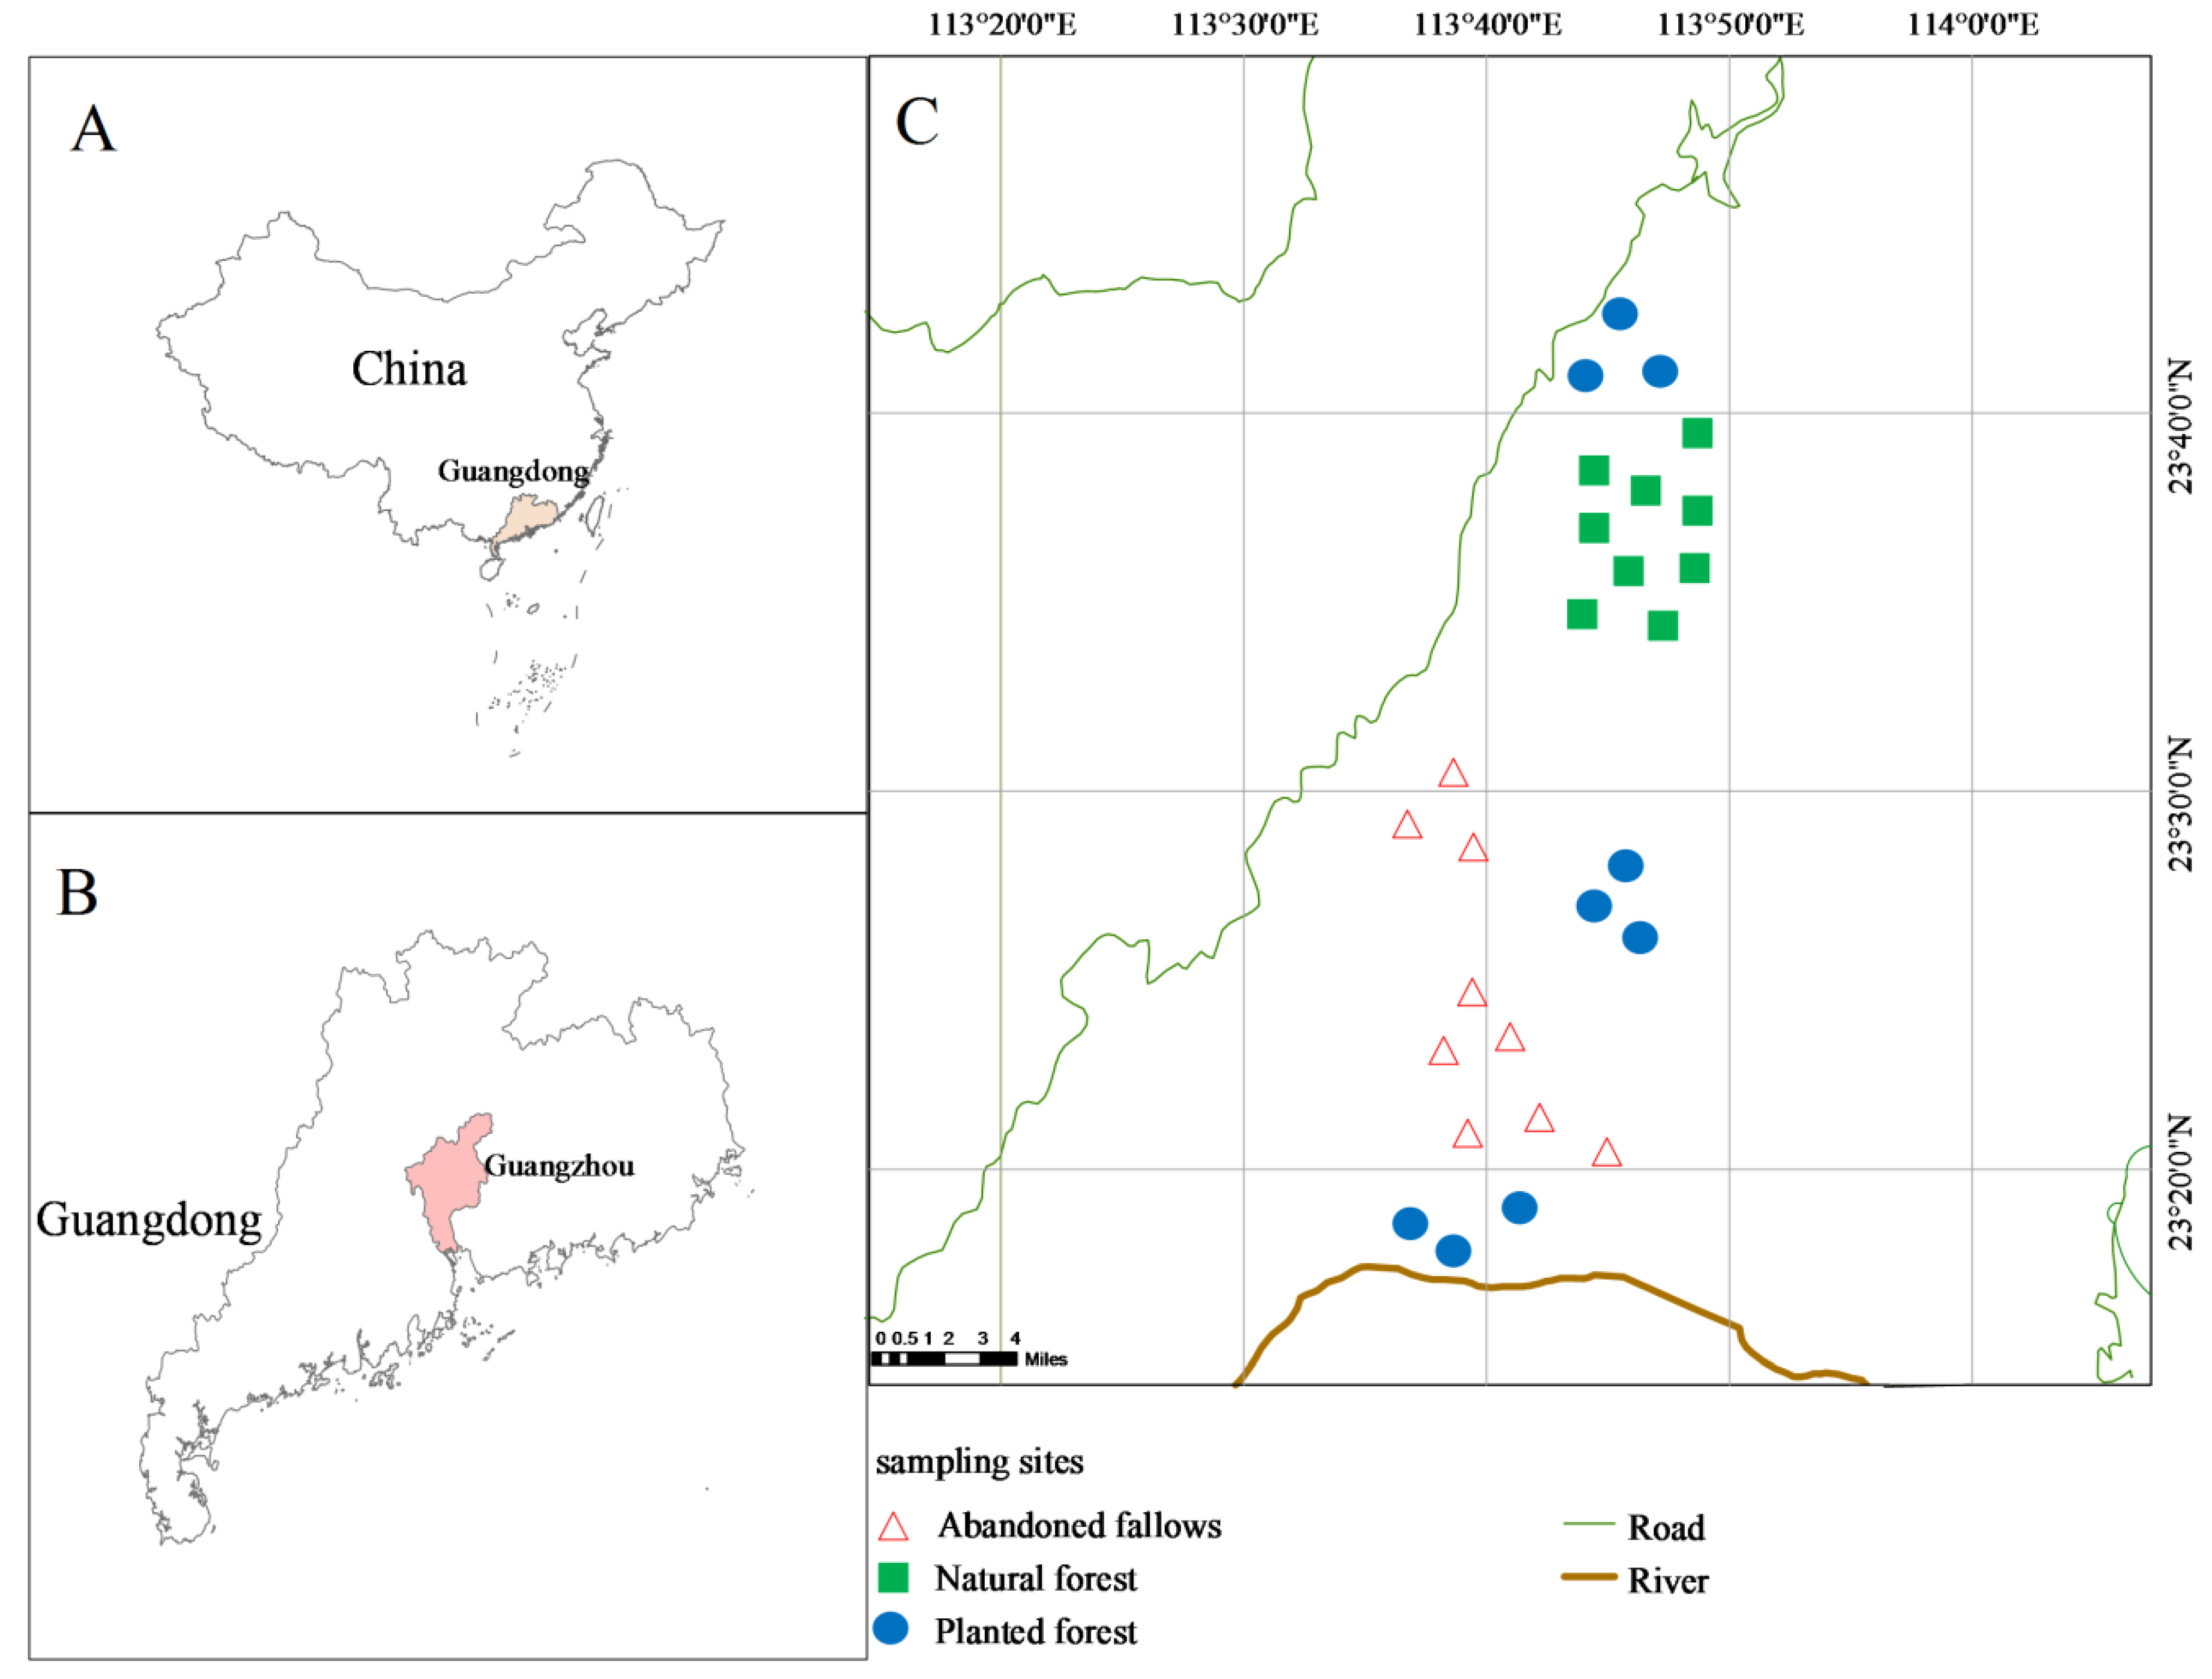
Three stand types were selected in the study area (Figure 1). Mikania micrantha and Borreria latifolia were mainly distributed in the abandoned fallows understory (Table S1). After cultivation was abandoned, planting agroforestry systems were adopted, including litchi, eucalyptus, slash pine and other tree species. Natural and planted forest were selected in the adjacent stand. Canopy species of natural forest were native tree species. The woody plants of the secondary forest are primarily alien species, which were introduced for wood processing. Logging ceased in 2000. To minimize the differences caused by habitat heterogeneity, we investigated the rock parent material, soil type, topography and degree of human disturbance in the study area, before final sample plot selection. Our determination of rock parent material was based on the National Geological Information Public Service Platform [28], and soil classification was carried out according to the United States Department of Agriculture (USDA) soil taxonomy [29]. Once similar sites were identified, we selected forest understories that were around 20 years old and had received minimal human disturbance over the previous 10 years of survey sampling (Table 1). Nine 600 m2 (20 × 30 m) sample plots were established in each stand type, and each sample plot was spaced at least 50 m apart. Three 2 × 2 m quadrats were randomly located in the sample plots and data on shrub and grass communities were collected in each quadrat. Species name, height, number of trees, cover and the invasion of three stand types were investigated (Table 1). Community structure of shrub and grass communities was defined using differences in cover and height. Cover was divided into 7 classes and height was divided into 8 (Table 2).

2.3. Soil Sampling and Determination

Topsoil (0–25 cm depth) was collected at the intersection of 1/4 and 3/4 diagonal lines in each 20 × 30 m quadrat and mixed into a homogenous quadrat sample. Available sodium (Na) (mg/kg), exchangeable calcium (Ca) (mg/kg), exchangeable magnesium (Mg) (mg/kg), available copper (Cu) (mg/kg), available zinc (Zn) (mg/kg), available ferrum (Fe) (mg/kg), available manganese (Mn) (mg/kg), available boron (B) (mg/kg), total mercury (Hg) (mg/kg), organic matter (g/kg), total nitrogen (TN) (g/kg), total phosphorus (TP) (g/kg), total kalium (TK) (g/kg), available phosphorus(AP) (mg/kg) and available kalium (AK) (mg/kg) were determined to characterize soil chemical properties [30].

2.4. Data Analysis

Differences in soil mineral element concentrations were compared using one-way analysis of variance (ANOVA) among different stand types. To compare stand type diversity differences, four diversity indexes were calculated, including species richness, species evenness, Shannon–Wiener and Simpson diversity index [31]. Average cover and average height were used to evaluate stand structure, and the Kruskal–Wallis test was used to examine significant differences among stand types.
Multi-response permutation procedures (MRPP) and indicator species analysis (ISA) were applied to test for differences in the composition of stand types. Test statistics were based on the weighted average of pairwise distances within the processing. The test process was arranged by observation results. MRPP had good characteristics when multivariate and even high-dimensional problems were addressed, especially in capturing the difference of dependent structure among variables. The results of the MRPP analysis include the T value of the test statistic, the A value of the consistency statistic and the p value [32]. The larger the absolute value of T, the stronger the separation between groups. The A value is the statistic that describes group homogeneity, and the greater the A value, the greater the group similarity.
Indicator species analysis (ISA) is able to determine the representative species of the categorical predictive variable group. The species indicator value is the product of the two parts: specificity (i.e., relative frequency) and sensitivity of species occurrence, which is calculated as follows [33]:
IndVal = A × B = a p / N p K = 1 K l k 2 N k × a p N p
A is species specificity and B is species sensitivity. N is the number of samples, Np is the number of plots belonging to a certain habitat, ap is the abundance of a species k habitat type, Nk is the number of plots belonging to the k habitat type, and lk is the Euclidean norm of the diversity vector of species in the k habitat type. Resulting indicator values range from 0 to 100 (indicator species were perfectly matched with the current habitat). Significant indicator species (p < 0.05) were determined by a Monte Carlo randomized experiment (4999 runs) [34].
Using canonical correspondence analysis (CCA), correlations between sample plot distributions and soil mineral element concentrations and community structure were obtained. CCA is a nonlinear multivariate direct gradient analysis method that combines correspondence analysis and multivariate regression analysis. CCA is carried out for regression analysis on the results of each step of environmental factor calculation and then the relationship between species and environment is analyzed in detail [35,36]. Since CCA sequencing is based on a unimodal model, it has certain requirements for the distribution of species. In our study, the attribute data of the re-sampled and extracted samples were first sorted. The length of the first coordinate axis was 7.4, which was acceptable for CCA sequencing based on a unimodal model.
Stand type stability was measured by the Godron coordinate value. The Godron method for determining stability is based on the Gini–Lorenz model. The Gini–Lorenz curve is fitted using species frequencies or percentages (relative frequencies) [37]. The frequency of all the plants in the community was arranged from highest to lowest. The cumulative reciprocal percentage and cumulative relative frequency of plant species were calculated. Then, scatter plots were drawn and fitted with a smooth curve to determine the binomial curve regression equation. When a straight line was used to connect the horizontal and vertical axes 100, the point at which it intersects the curve was the desired point. After the Godron coordinate values (a, b) were obtained, the Euclidean distance (D) between the Godron coordinate values and the ideal stable point (20, 80) of the community was calculated. Furthermore, 1/D was considered as the specific index value to measure community stability. The smaller the D value, the higher the community stability [38].
Statistica 12.0 (Statsoft, Inc. Tulsa, OK, USA) was used to calculate and draw average community cover, height box plots, one-way ANOVA, Kruskal–Wallis test, height level and coverage level diagram and stability regression fitting. MRPP and ISA were calculated by PC-ORD 7.0 (MjM Software, Gleneden Beach, OR, USA), and CCA was conducted using CANOCO 5.0 [39].

3. Results

3.1. Stand Species Composition and Structure

There were significant differences in the understory species composition of the three stand types (p < 0.05) (Table 3). The T absolute value of natural forest and abandoned fallows was the largest (T = −7.2845), which demonstrated that the widest separation distance between the two groups and, therefore, the greatest difference in species composition. Natural and planted forest had the second highest degree of separation in species composition (T= −6.2603). The higher the A value, the higher the intra-group consistency of different communities. The A value of natural forest and abandoned fallows was the largest (A = 0.1451); abandoned fallows and planted forest had the lowest A value (A = 0.0389).
There were 10 species in natural forest with indicator values > 25, 7 species in abandoned fallows and 9 species in planted forest from the composition of indicator species of different stand types (Table 4). Indicator species in natural forest are all common native species and can adapt to the local environment. Photophilous invasive plants Borreria latifolia and Mikania micrantha were among the indicator species of abandoned fallows. The associated native plants, Cratoxylum ligustrinum and Miscanthus sinensis, are photophilous plants with similar habitat adaptability. However, Alocasia macrorrhiza, Microlepia hancei and Cyrtococcum patens grow in humid environments, which could reduce competition for the same resources with invasive plants. Because planted forest had been affected by past logging, indicator species such as Mussaenda pubescens, Dicranopteris dichotoma, Alchornea trewioides and Litsea cubeba were characterized by high tolerance, wide adaptability and rapid growth.
Compared to the α diversity index (Figure S1), a comparison of community cover and height better revealed structural differences between stand types (Figure 1). The average cover of abandoned fallows (8.815%) was significantly higher than natural (3.742%) and planted forests (3.051%), (Figure 2A). Similarly, the average height of abandoned fallows (19.676 m) was greater than natural (9.926 m) and planted forest (19.352 m); however, the differences were not statistically significant (Figure 2B).
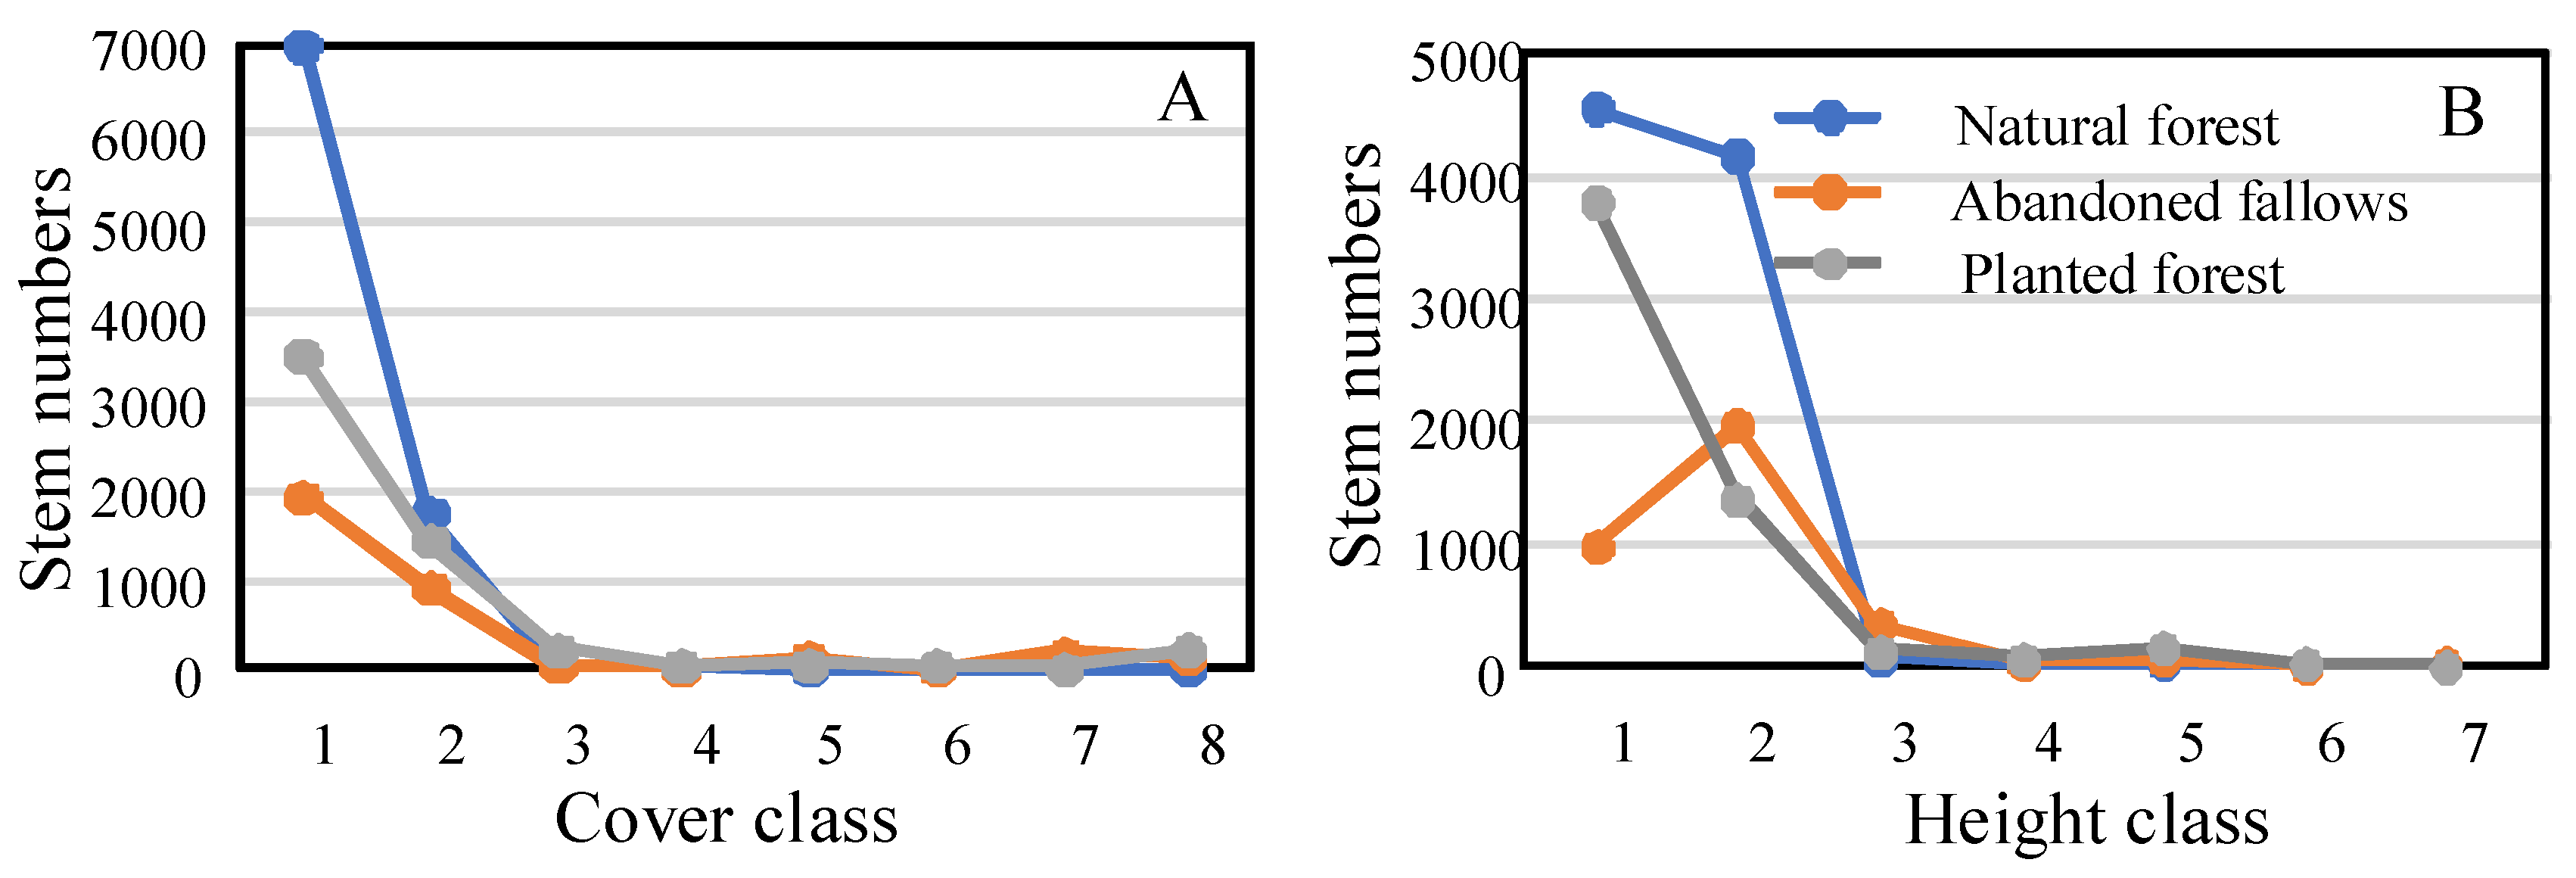
When the cover class was less than three (Figure 3A), there were significant differences between stand types. The number of stems in natural forest in cover classes 1 and 2 was greater than the other two stand types and the number in planted forest was the lowest. There were no significant differences among stand types above cover class 3. Similarly, for height, the number of stems in height classes less than three was greater in natural forest than in the other two stand types (Figure 3B). However, the number of stems in height class 2 in abandoned fallows was less than in planted forest.

3.2. Soil Mineral Composition in Different Stand Types

There were significant differences in available Fe (p = 0.04), available B (p = 0.01) and total Hg (p = 0.02) among different stand types (Table 5). In abandoned fallows, compared with the other two stand types, the concentrations of exchangeable Ca, available Cu, available Zn, available Fe and available B were the highest, and the total Hg concentration was the lowest. The concentrations of available Na, exchangeable Ca, exchangeable Mg, available Zn and available B in natural forest were higher than in planted forest soil.

3.3. Environmental Factors Driving Native and Alien Plant Distribution

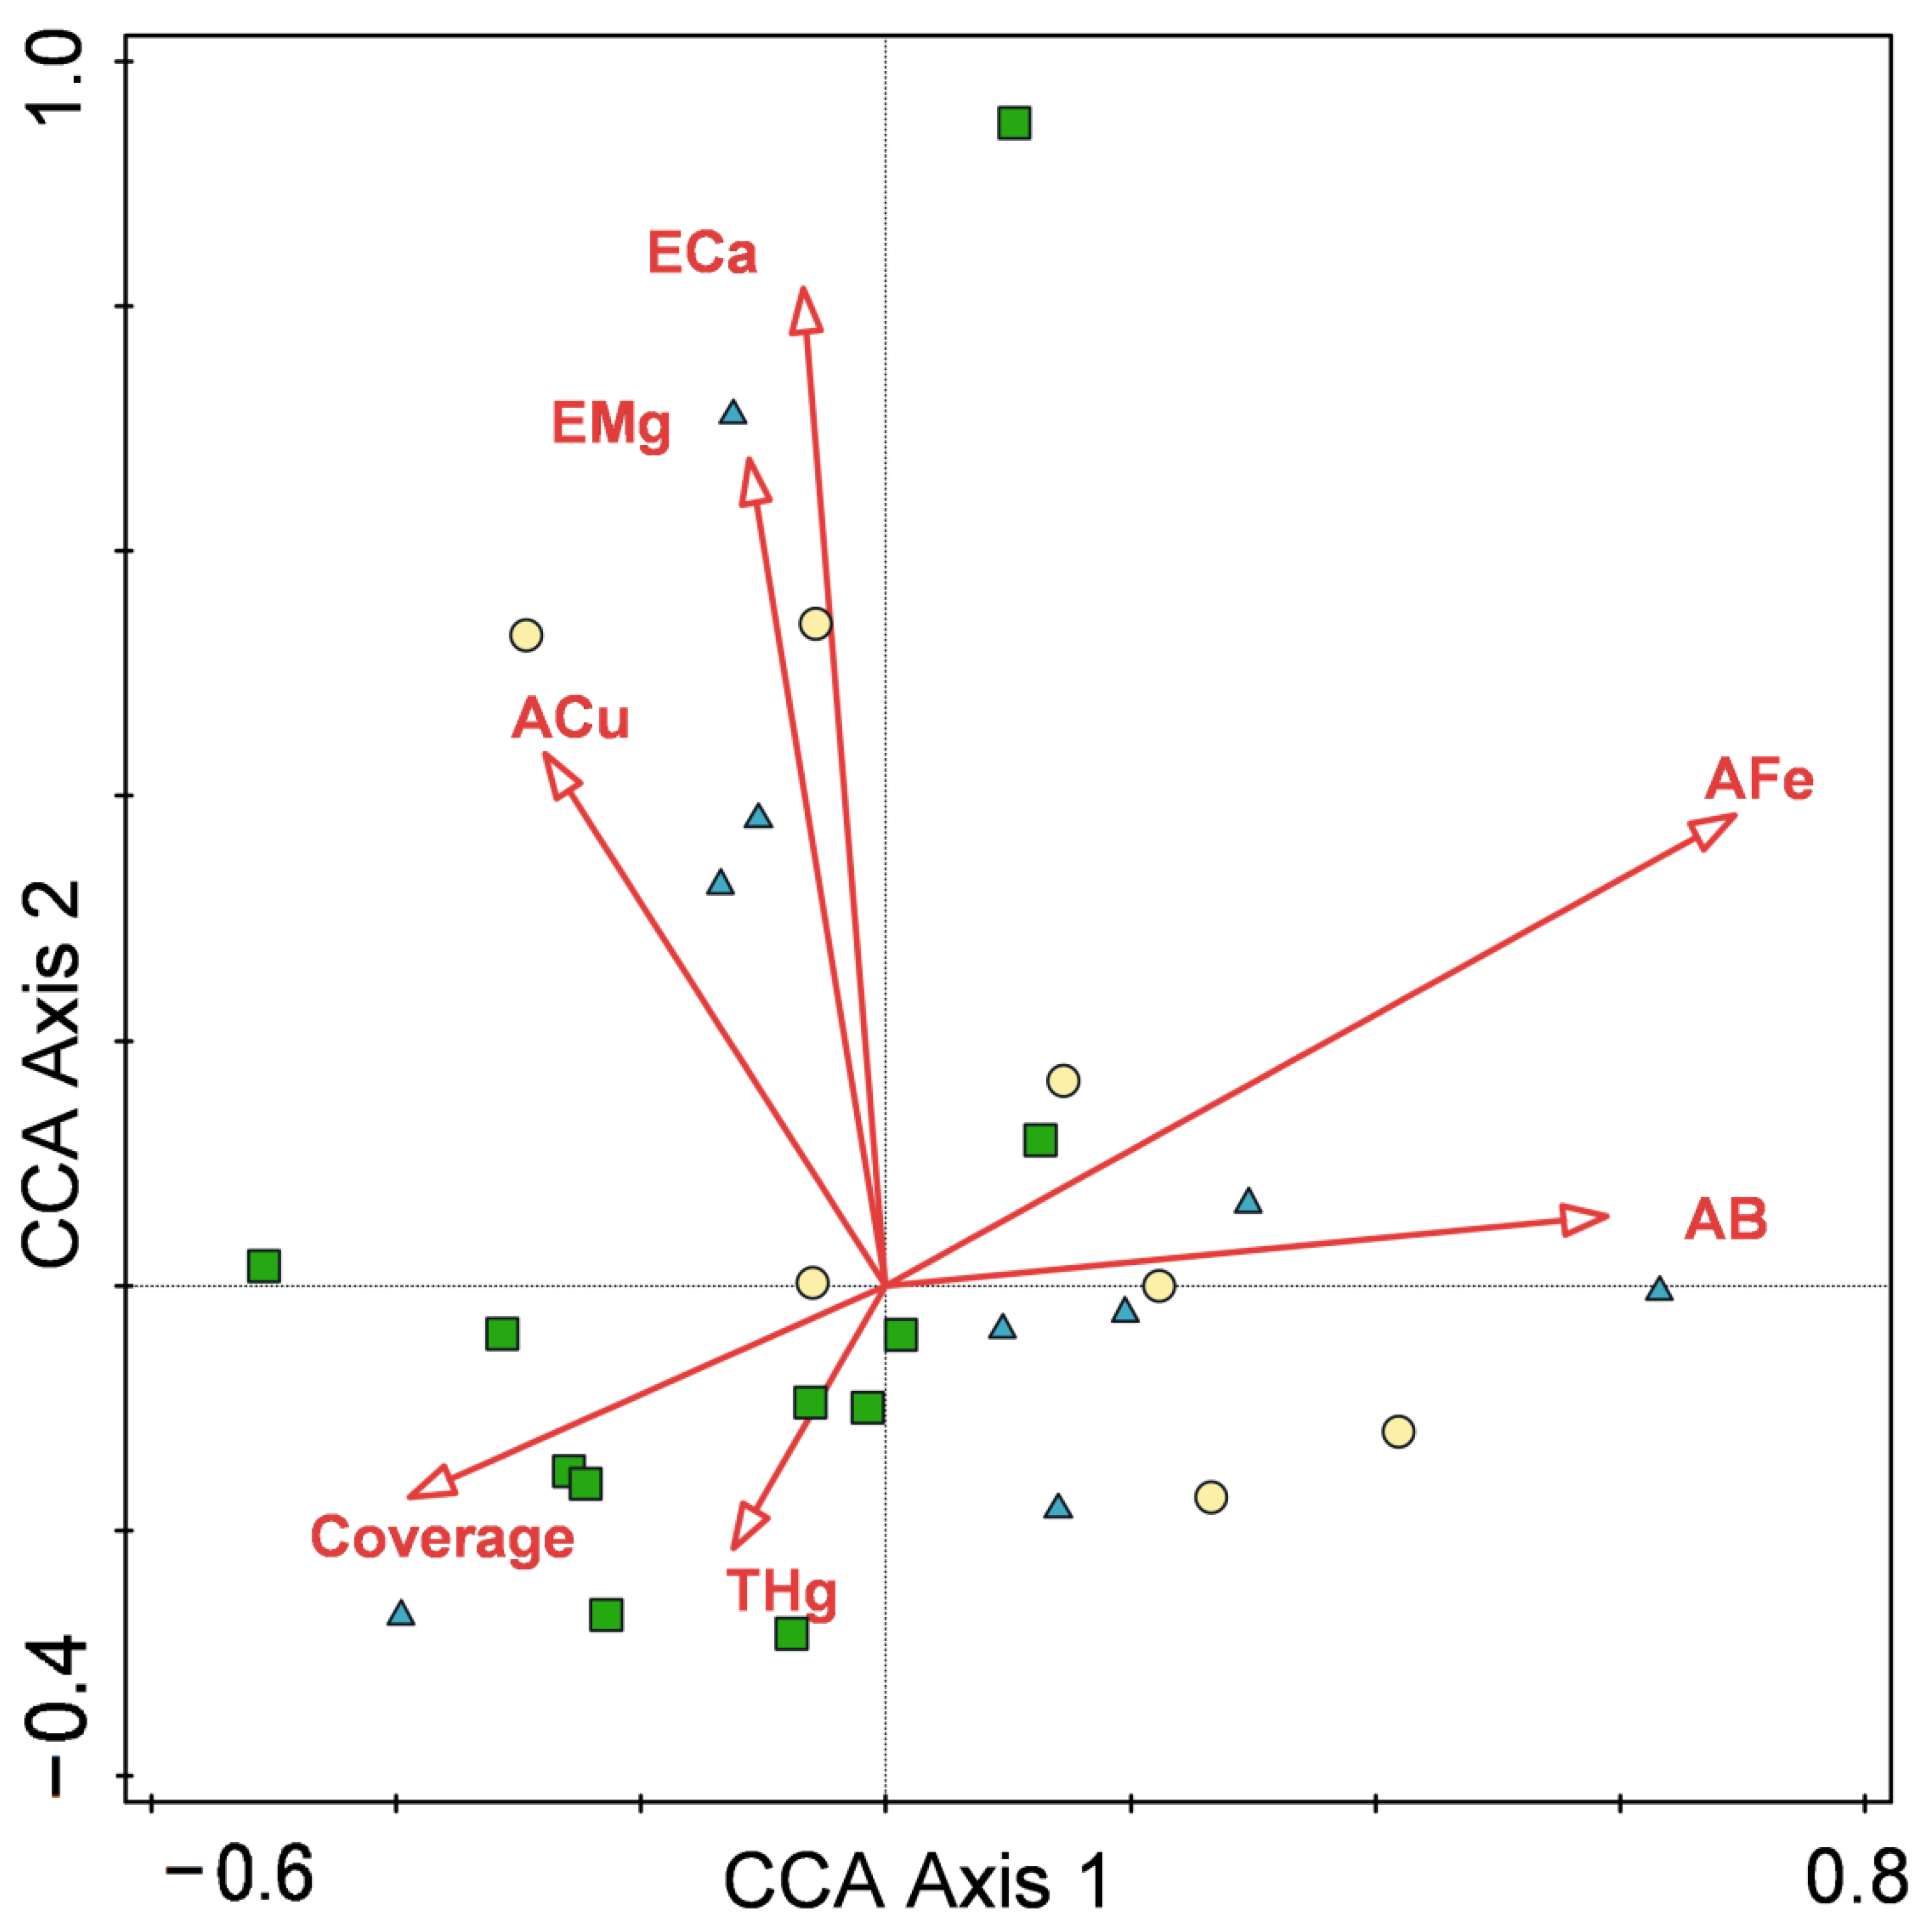
All soil factors and community structure indices were sequenced by CCA. The first four axes accounted for 66.18% of the total eigenvalue of understory native species (Table 6), which could reflect most sequencing information. Available Fe, available B, exchangeable Ca, exchangeable Mg and cover all played a significant role in explaining species distribution (Table 7). Although available Cu and total Hg did not reach significant levels, their explanatory variation was 4.5% and 4.2%, respectively. Along CCA axis 1, available Fe and available B concentrations increased from left to right, while the influence of cover gradually weakened. From the bottom to the top along CCA axis 2, exchangeable Mg, exchangeable Ca and available Cu concentrations increased gradually, while the influence of total Hg on quadrat distribution increasingly weakened (Figure 4).
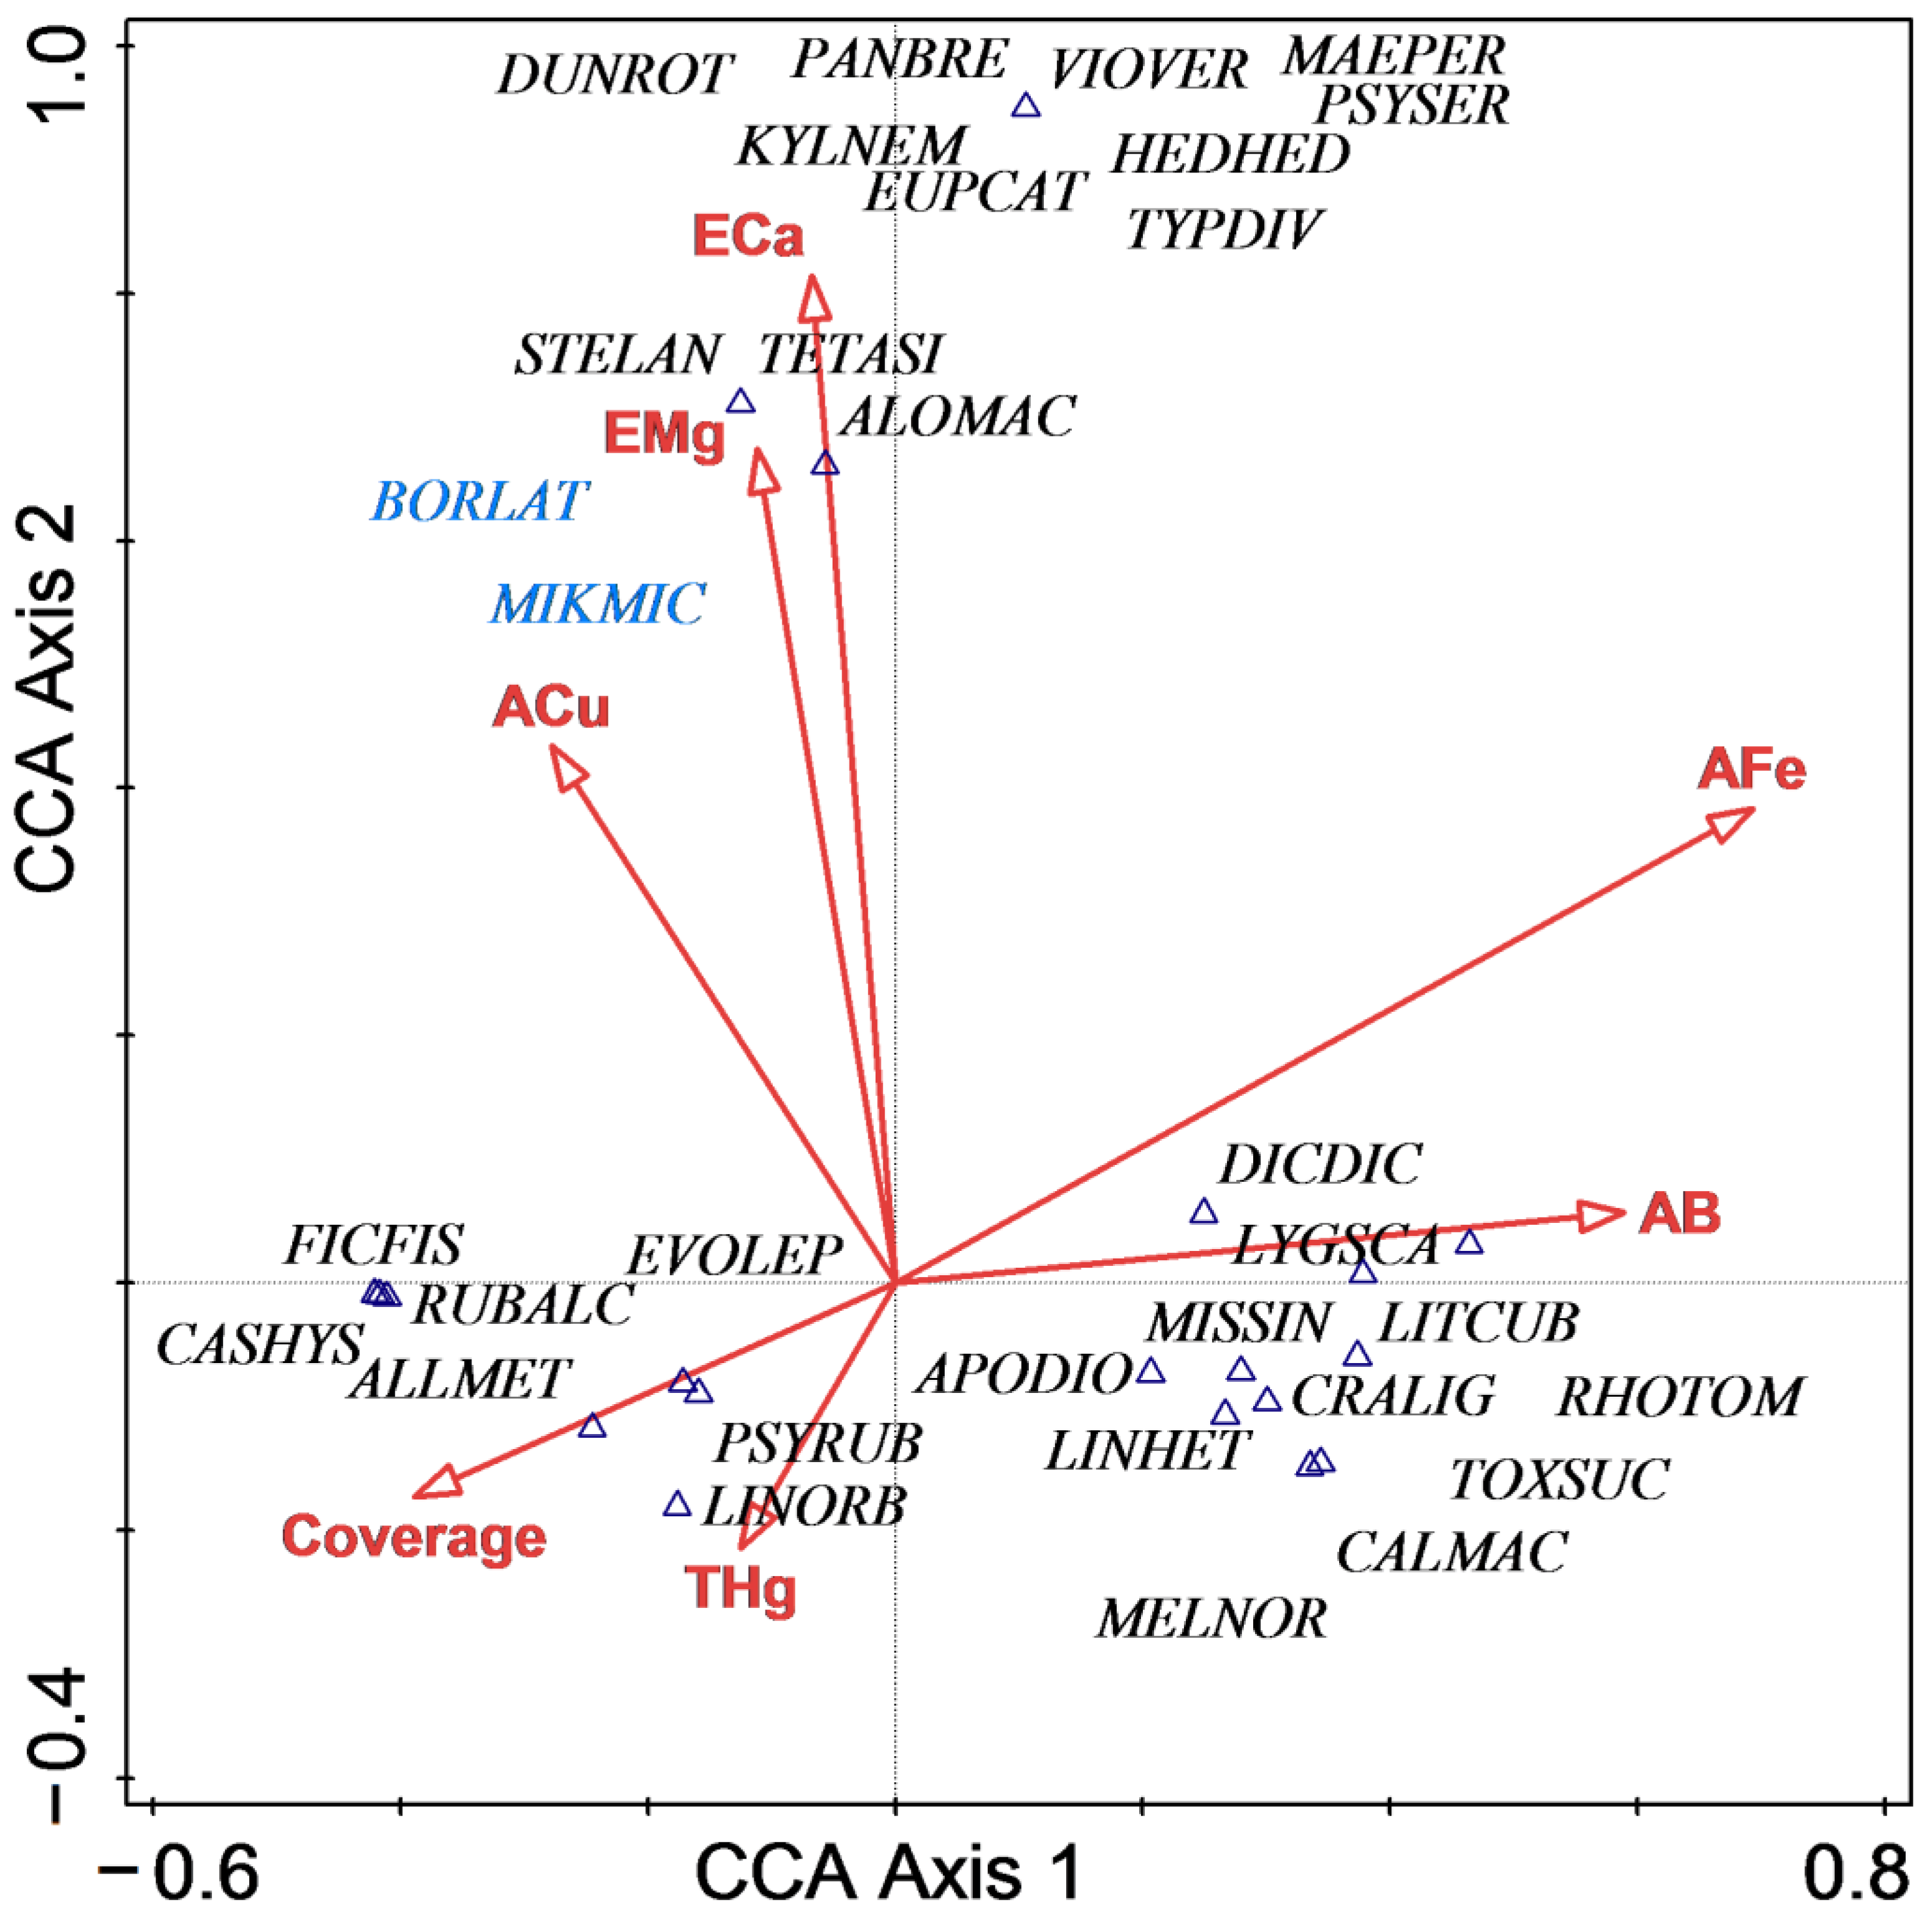
Natural forest plots were more tightly clustered in the CCA diagram and greatly affected by cover and total Hg, whilst abandoned fallows and planted forest had similar habitat preferences and were jointly influenced by exchangeable Ca, exchangeable Mg, available Cu, available Fe and available B (Figure 4). The results also demonstrate that the invasive species, Borreria latifolia and Mikania micrantha, were mainly affected by available Cu and exchangeable Mg (Figure 5). Native species could be divided into three groups. Native species such as Tetracera asiatica, Alocasia macrorrhiza and Kyllinga nemoralis were located in the upper left of the CCA and closely linked to exchangeable Ca and exchangeable Mg, while cover and total Hg were the main environmental factors affecting the distribution of Lindsaea orbiculata and Psychotria rubra in the bottom left. Miscanthus sinensis and Litsea cubeba, located in the bottom right of the CCA, were mainly driven by available B and available Fe (Figure 5).

3.4. Relationship between Stand Type and Community Stability

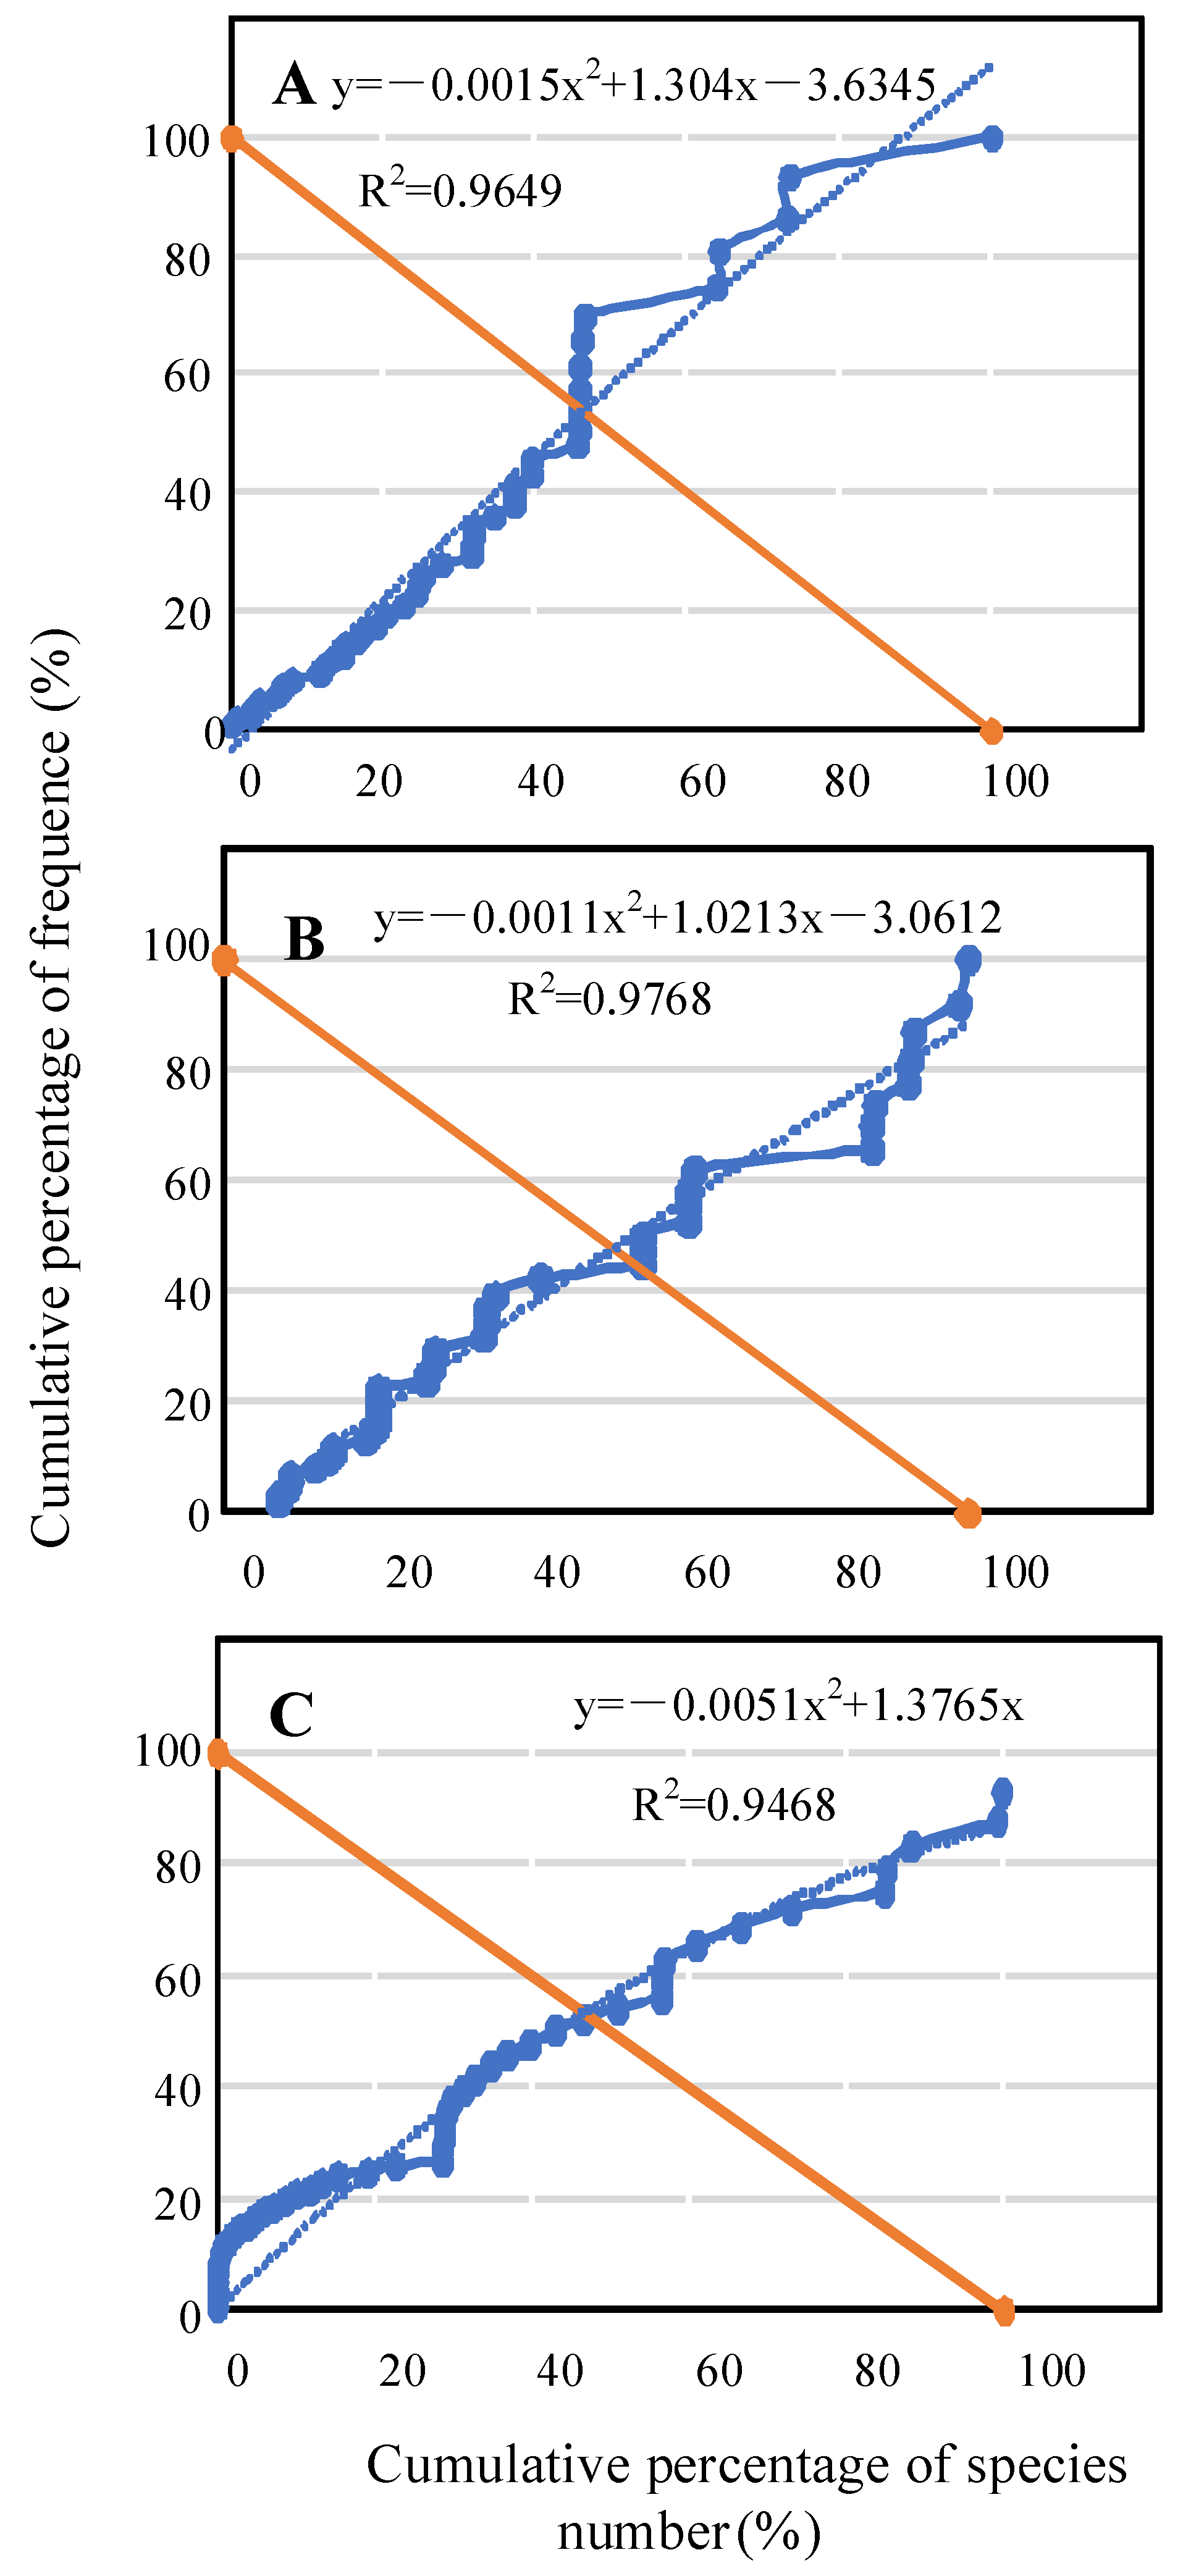
The stability analysis diagram (Figure 6) and the intersection coordinates for Euclidean distance (Table 8) demonstrated that the stability ratio of abandoned fallows had the highest degree of deviation from 20/80 and its stability was the lowest. For natural and planted forest, the intersection distance was close to 20/80, indicating that the stability of the two communities was similar.

4. Discussion

Variation in soil mineral element concentration is closely related to soil formation conditions and processes. It is influenced by the combination of soil-forming parent material, topographic factors and biological effects [40,41]. The soils in the study area had developed from granite and other soil-forming matrices intruded during the Yanshanian, and so local mineral elements are generally depleted [42]. This may be due to the local high temperature and rainfall, as, during strong soil formation, easily mobile mineral elements such as K, Mg and Ca, are leached, while a few difficult elements, such as Fe and Al, are enriched in the soil. Alternatively, the site vegetation was severely damaged, soil erosion was exacerbated, and organic matter and clay particles were low, which reduced mineral element adsorption [43]. The effects of these factors on soil mineral elements are extensive and therefore negligible in our study. We selected sites with the same parent material and soil type to minimize the mineral differences in the soil itself (Table 1) and collected only the topsoil (0–25 cm depth) for analysis. Because of differences in aboveground litter and sediment input, mineral element concentrations are changed by root absorption and turnover of the shrub and grass community and, therefore, most obvious in the soil surface layer. This approach helped us to explore soil mineral element changes in different stands.
Our results indicated that there were significant differences in soil available Fe, available B and total Hg among the three stand types. Compared with the other two stand types, abandoned fallows had the highest soil concentrations of exchangeable Ca, available Cu, available Zn, available Fe and available B. However, abandoned fallows had a lower pH and organic matter concentration than the other stand types, although there were no significant differences between them (Table S2). The differences in mineral concentrations between stands may be related to the land use history. Because the abandoned fallows was initially used as an agroforestry complex, tillage and fertilization may have caused a continuous increase in cation concentration in the soil [44]. Although conversion to forest land has occurred due to abandonment and natural succession, such changes may still be detectable decades or even centuries after afforestation [44,45,46]. It has been suggested that community composition may also alter soil mineral concentrations. Different species may directly or indirectly influence mineralization rates and alter soil mineral cycles through uptake rates [47], litter quality and quantity [48,49] and synergistic interactions with soil microorganisms [48,50]. Additionally, other unmeasured factors in this study, such as soil temperature and humidity, density and porosity, may also affect soil mineral element concentrations [51,52].
The extensive occurrence of invasive species in abandoned lands is related to their specific environmental characteristics, such as light requirements [53], but it could also be a preference for a certain soil element [54]. Many studies have shown the limiting effect of nitrogen and phosphorus deficiency on the growth of invasive plants [54,55,56]. In addition to these soil elements, other elements also play a role in the distribution of invasive plants. For example, Solidago canadensis L. is abundantly distributed in soils with high zinc (Zn) and lead (Pb) concentrations, which may be the result of its ability to overcome the stress of high element concentrations by developing defense mechanisms while maintaining competitive ability under stressed conditions [57]. The low number of invasive species in natural and planted forests may be due to their adaptation to low mineral concentrations in local soils. It has been suggested that high mineral element utilization (e.g., longer roots) may be a survival strategy for native species in low mineral concentration habitats. In contrast, invasive species have difficulty utilizing low mineral element concentrations and therefore have difficulty surviving [58]. However, in the study area, the correlation between mineral concentration and invasive species requires verification by further experimental studies.
In our study, there were significant differences in species composition in the three stand types (MRPP test, p < 0.05). However, there were no common species with indicator values >25, indicating that no habitats could be differentiated by these species; for example, natural forest indicator species were all common and widely adaptable native species. Abandoned fallows were mainly invaded by Borreria latifolia and Mikania micrantha, both of which were photophilous, and associated native species tended to have two different survival strategies: (1) direct competition between associated native species and invasive plants for light resources, and (2) reduced competition for the same resources in low light environments where native species exist and invasive plants are less common. Planted forest indicator species were characterized by a wide tolerance and rapid growth. For planted and natural forest with lower invasion, the selected indicator species all played an important role in habitat protection.
The aim of our ecological research was to confirm the factors controlling community distribution. Understory species composition and community structure are regulated by many environmental factors. Based on our CCA analysis, the important factors influencing quadrat distribution were available Fe, exchangeable Mg, exchangeable Ca, available B, available Cu, total Hg and community cover. However, quadrat distributions in the CCA sequencing diagram indicated that there were significant differences in the three stand types. Natural forest plots were tightly clustered, while abandoned fallows and planted forest plots had similar habitat requirements that were mainly affected by multiple mineral elements. The occurrence of invasive species Borreria latifolia and Mikania micrantha was closely related to available Cu and exchangeable Mg, but at the same time, many native species, such as Tetracera asiatica and Alocasia macrorrhiza, were similarly affected. The remaining native species were distributed in two areas: low cover and low total Hg concentration, or high available B and available Fe concentrations.
Community stability is the comprehensive performance of community dynamic balance achieved through population competition and symbiosis adjustment. Compared with a non-invaded community, an invasive community has limited living space and available resources. The stability of the invasive community represents its capacity to maintain homeostasis under positive and negative feedback to the alien species [59].We reflected the homogeneity of community distribution with the fitted curve of species frequency shown in Figure 6. The resulting fitted curve reflects uniformity of community distribution; the more uniform the distribution, the more stable the community [60]. Compared with the traditional method of community succession and comparative analysis, it is possible to obtain current community stability from one time data, but the limitation is that it is not possible to predict community successional trends [37,38]. In our study, Euclidean square distances of the three stand types between intersection coordinates and stable point coordinates were distributed in the range of 37–46 and in the stability order: planted forest > natural forest > abandoned fallows. It may be that as invasive species increase plant height and cover, it helps them to compete with native plants for growing space and resources to maintain their dominant position and strong resistance to external interference [61]. Furthermore, root allelopathic effect may increase [62], which would aggravate competition between invasive and native species. Therefore, species replacement rate would be enhanced and stability decreased in the community. Moreover, changing trends in the stability index were consistent with changes in the species diversity index, Shannon–Wienerindex and Simpson index (Figure S1). We can, therefore, conclude that the higher the community species diversity, the more stable the community.
Plant invasions are often considered to be related to three factors: propagule pressure, native community invasibility and land use history [63]. The extent to which each factor plays a role in a given habitat may vary, and there may be some linkage between them [64]. It has been suggested that invasibility is regulated by exposure to propagule pressure. Whether under high or low propagule pressure, communities change invasibility through different strategies (adjusting the density or diversity of the community), and invasion outcomes change as a result [65]. In addition, during the natural recovery of cropland to forest, even with the influence of land use history, native communities can enhance resistance to invasion and reduce the probability of invasion success by changing to those species that can effectively use resources and become dominant [66]. Although we could not completely exclude the effects of pressure and land use history in our study, community invasibility is still worth further study. In the future, we will consider the effects of integrating propagule pressure, land use practices and invasibility.
Invasibility is determined by a combination of community dominance, species diversity, community structure and other components. In past field investigations and controlled experiments on invasibility, native species diversity was considered as one of the main factors affecting the invasion process [67]. However, there are few reports on the invasibility of community structure. In our study, although there was a size relationship between the diversity indices of stand types, it was statistically insignificant. Furthermore, there was no significant relationship between soil mineral element concentrations and diversity, a similar result to a study of Galium verum L invasion. Regardless of native species diversity, alien species can use their resources as much as possible at different nutrient levels to increase their biomass. [16]. Some mineral elements had significant relevance with average cover and height (Table S3) in our study. There were also significant differences in average cover among the three stand types, indicating that plant height and cover play an important role in plant competitiveness and resistance to environments. Compared with the number of species, the relationship between diversity and invasiveness may be more dependent on species structure. When species with different survival strategies coexist, structurally rich communities may increase complexity and improve the utilization rate of available resources (especially light), while reducing the probability of invasion [68,69]. The cover and height class distributions of the three stands were further analyzed, and it was found that there was little difference between stand types at height and cover classes >3. However, the number of stems in natural forest in height and cover classes 1 and 2 was clearly higher than in the other two stand types. There was only a slight difference between the stand types above class 3, which demonstrates that cover and height distribution tends to be stable among communities. In natural and planted forests, the level of invasion was lower, while the invasion level of abandoned fallows was higher, which may be due to the large number of plants with low cover class in the former habitats. This may be a difference in growth strategies: when species allocate resources to aboveground vegetative growth in a resource-rich environment, plants with different cover classes can make full use of the abundant resources in the environment, making it difficult for invasive plants to compete with them [70,71]. In studying the impact of alien plant invasion on native species, the relationship between community structure and invasibility should be paid more attention in the future. Considering the complexity of community structure, it may also be necessary to establish larger sample plots and increase time series to explore the relationships with invasibility.
5. Conclusions

Soil mineral element concentrations in severely invaded abandoned fallows were compared with those in slightly invaded natural and planted forests. There were significant differences in available soil Fe, available B and total Hg concentrations among the three stand types. Abandoned fallows had the highest concentrations of available Fe and available B and the lowest concentration of total Hg. Through MRPP and indicator species analysis, we found significant differences in species composition of the three stand types. Our study highlighted that stand structure may be better than classical species diversity indices in fully explaining invasibility differences among communities. There was little difference in stem numbers in different stand types when cover and height class was >3, but at height classes 1 and 2, stem numbers in natural forest were much greater than the other two types, which indicates that invasion was resisted, to some extent, by established seedlings. The three stand types demonstrated regular distribution on a CCA two-dimensional sequencing diagram. Available Fe, available B, exchangeable Ca, exchangeable Mg, coverage, available Cu and total Hg were important factors affecting the composition and distribution of alien and native species in the community. The stability of the three stand types was in the order planted forest > natural forest > abandoned fallows, indicating that the latter invaded community was the least stable.

Supplementary Materials

The following are available online at https://www.mdpi.com/1999-4907/12/2/185/s1, Figure S1: Local community parameter changes across stand type. NF = natural forest; AF = abandoned fallows; PF = planted forest, Table S1: Invasion of different stand types. Table S2: Soil nutrient content across stand type, Table S3: Pearson correlation analysis between community parameters and soil heavy metal content.

Author Contributions

Z.S. conceived and designed the study. P.X., T.L., H.C., and Z.S. collected the data. P.X. analyzed the data and wrote the manuscript. All authors have read and agreed to the published version of the manuscript.

Funding

This research was supported by the Forestry Department of Guangdong Province, China, for Provincial Ecological Public Welfare Forest research (Grant No. GZFC-KT1-ZT2).

Institutional Review Board Statement

Not applicable.

Informed Consent Statement

Not applicable.

Data Availability Statement

Not applicable.

Acknowledgments

We thank Mingfeng Xu and Yonglin Zhong for field plant identification.

Conflicts of Interest

The authors declare no conflict of interest.

References

  1. Schulze, E.D.; Beck, E.; Buchmann, N.; Clemens, S.; Müller-Hohenstein, K.; Scherer-Lorenzen, M. Global change and terrestrial ecosystems. In Plant Ecology; Springer: Berlin/Heidelberg, Germany, 2019; pp. 865–899. [Google Scholar]
  2. Curtis, C.A.; Pasquarella, V.J.; Bradley, B.A. Landscape characteristics of non-native pine plantations and invasions in Southern Chile. Austral. Ecol. 2019, 44, 1213–1224. [Google Scholar] [CrossRef]
  3. Hejda, M.; Pyšek, P.; Jarošík, V. Impact of invasive plants on the species richness, diversity and composition of invaded communities. J. Ecol. 2009, 97, 393–403. [Google Scholar] [CrossRef]
  4. Ye, H.C.; Huang, Y.F.; Chen, P.F.; Huang, W.J.; Zhang, S.W.; Huang, S.Y.; Sen, H. Effects of land use change on the spatiotemporal variability of soil organic carbon in an urban-rural ecotone of Beijing, China. J. Integr. Agric. 2016, 15, 918–928. [Google Scholar] [CrossRef] [Green Version]
  5. Lowry, B.J.; Lowry, J.H.; Jarvis, K.J.; Keppel, G.; Thaman, R.R.; Boehmer, H.J. Spatial patterns of presence, abundance, and richness of invasive woody plants in relation to urbanization in a tropical island setting. Urban. For. Urban. Green. 2020, 48, 12–21. [Google Scholar] [CrossRef]
  6. Han, S.; Li, Z.; Xu, Q.; Zhang, L. Mile-a-Minute weed mikania micrantha kunth. In Biological Invasions and Its Management in China; Springer: Berlin/Heidelberg, Germany, 2017; pp. 131–141. [Google Scholar]
  7. Wang, J.; Chen, W.; Zhu, H. Ecological stoichiometry and invasive strategies of two alien species (Bidens pilosa and Mikania micrantha) in subtropical China. Ecol. Res. 2019, 34, 612–623. [Google Scholar] [CrossRef]
  8. Zhang, T.; Cui, Y.; Guo, W.; Tian, X. Research Progress on the Exotic Plant Species Borreria latifolia. Weed Sci. 2019, 37, 1–5. [Google Scholar]
  9. Guo, Q.; Fei, S.; Dukes, J.S.; Oswalt, C.M.; Basil, V.I., III; Potter, K.M. A unified approach for quantifying invasibility and degree of invasion. Ecology 2015, 96, 2613–2621. [Google Scholar] [CrossRef]
  10. Howeth, J.G. Native species dispersal reduces community invasibility by increasing species richness and biotic resistance. J. Anim. Ecol. 2017, 86, 1380–1393. [Google Scholar] [CrossRef] [Green Version]
  11. Sheppard, C.S.; Carboni, M.; Essl, F.; Seebens, H.; Consortium, D.; Thuiller, W. It takes one to know one: Similarity to resident alien species increases establishment success of new invaders. Divers. Distrib. 2018, 24, 680–691. [Google Scholar] [CrossRef] [Green Version]
  12. Zeiter, M.; Stampfli, A.; Newbery, D. Recruitment limitation constrains local species richness and productivity in dry grassland. Ecology 2006, 87, 942–951. [Google Scholar] [CrossRef] [Green Version]
  13. Castro-Díez, P.; Pauchard, A.; Traveset, A.; Vilà, M. Linking the impacts of plant invasion on community functional structure and ecosystem properties. J. Veg. Sci. 2016, 27, 1233–1242. [Google Scholar] [CrossRef]
  14. Medvecká, J.; Jarolímek, I.; Hegedüšová, K.; Škodová, I.; Bazalová, D.; Botková, K.; Šibíková, M. Forest habitat invasions–who with whom, where and why. For. Ecol. Manag. 2018, 409, 468–478. [Google Scholar] [CrossRef]
  15. Leicht-Young, S.A.; Bois, S.T.; Silander, J.A. Impacts of Celastrus-primed soil on common native and invasive woodland species. Plant. Ecol. 2015, 216, 503–516. [Google Scholar] [CrossRef]
  16. Heckman, R.W.; Carr, D.E. Effects of soil nitrogen availability and native grass diversity on exotic forb dominance. Oecologia 2016, 182, 803–813. [Google Scholar] [CrossRef]
  17. Fridley, J.D.; Stachowicz, J.J.; Naeem, S.; Sax, D.; Seabloom, E.; Smith, M.; Stohlgren, T.; Tilman, D.; Holle, B.V. The invasion paradox: Reconciling pattern and process in species invasions. Ecology 2007, 88, 3–17. [Google Scholar] [CrossRef]
  18. Mattingly, W.B.; Reynolds, H.L. Soil fertility alters the nature of plant–resource interactions in invaded grassland communities. Biol. Invasions 2014, 16, 2465–2478. [Google Scholar] [CrossRef]
  19. Umemura, M.; Takenaka, C. Changes in chemical characteristics of surface soils in hinoki cypress (Chamaecyparis obtusa) forests induced by the invasion of exotic M oso bamboo (Phyllostachys pubescens) in central J apan. Plant. Species Biol. 2015, 30, 72–79. [Google Scholar] [CrossRef]
  20. Castro-Diez, P.; Alonso, A.; Romero-Blanco, A. Effects of litter mixing on litter decomposition and soil properties along simulated invasion gradients of non-native trees. Plant. Soil 2019, 442, 79–96. [Google Scholar] [CrossRef]
  21. Li, W.C.; Sheng, H.Y.; Chen, W.J.; Liu, Y.Y.; Zhang, R.; Wen, X. Variation of soil bacterial diversity after the invasion of Phyllostachys edulis into Pinus massoniana forest. Chin. J. Appl. Ecol. 2018, 29, 3969–3976. [Google Scholar]
  22. Driscoll, D.A.; Strong, C. Covariation of soil nutrients drives occurrence of exotic and native plant species. J. Appl. Ecol. 2018, 55, 777–785. [Google Scholar] [CrossRef]
  23. Blank, R.R.; Morgan, T.; Clements, C.D.; Mackey, B.E. Bromus tectorum L. invasion: Changes in soil properties and rates of bioturbation. Soil Sci. 2013, 178, 281–290. [Google Scholar] [CrossRef]
  24. Tererai, F.; Gaertner, M.; Jacobs, S.; Richardson, D. Eucalyptus camaldulensis invasion in riparian zones reveals few significant effects on soil physico-chemical properties. River Res. Appl. 2015, 31, 590–601. [Google Scholar] [CrossRef]
  25. Gu, Y.G.; Gao, Y.P.; Lin, Q. Contamination, bioaccessibility and human health risk of heavy metals in exposed-lawn soils from 28 urban parks in southern China’s largest city, Guangzhou. Appl. Geochem. 2016, 67, 52–58. [Google Scholar] [CrossRef]
  26. Li, C.; Sun, G.; Wu, Z.; Zhong, H.; Wang, R.; Liu, X.; Guo, Z.; Cheng, J. Soil physiochemical properties and landscape patterns control trace metal contamination at the urban-rural interface in southern China. Environ. Pollut. 2019, 250, 537–545. [Google Scholar] [CrossRef] [PubMed]
  27. Wang, J.; Huang, L.; Ren, H.; Sun, Z.; Guo, Q. Regenerative potential and functional composition of soil seed banks in remnant evergreen broad-leaved forests under urbanization in South China. Community Ecol. 2015, 16, 86–94. [Google Scholar] [CrossRef] [Green Version]
  28. CGS; GeoCloud. Introduction to GeoCloud, national geological information service platform of China—ScienceDirect. China Geol. 2019, 2, 116–118. [Google Scholar]
  29. Winandy, J.E.; Lebow, P.K.; Nelson, W. United States Department of Agriculture. Western 2007, 6, 89–97. [Google Scholar]
  30. Bao, S. Soil and Agricultural Chemistry Analysis; China Agriculture Press: Beijing, China, 2000. [Google Scholar]
  31. Gao, T.; Liu, F.; Wang, Y.; Mu, S.; Qiu, L. Reduction of Atmospheric Suspended Particulate Matter Concentration and Influencing Factors of Green Space in Urban Forest Park. Forests 2020, 11, 950. [Google Scholar] [CrossRef]
  32. Berry, K.J.; Mielke, P.W.; Johnston, J.E. Randomized Designs: Nominal Data. In Permutation Statistical Methods; Springer: Berlin/Heidelberg, Germany, 2016; pp. 367–419. [Google Scholar]
  33. De Caceres, M.; Legendre, P. Associations between species and groups of sites: Indices and statistical inference. Ecology 2009, 90, 66–74. [Google Scholar] [CrossRef]
  34. Chin, E.Y.; Kupfer, J.A. Identification of environmental drivers in urban greenway communities. Urban. For. Urban. Green. 2020, 47, 126549. [Google Scholar] [CrossRef]
  35. Bu, C.F.; Zhang, P.; Wang, C.; Yang, Y.S.; Shao, H.B.; Wu, S.F. Spatial distribution of biological soil crusts on the slope of the Chinese Loess Plateau based on canonical correspondence analysis. Catena 2016, 137, 373–381. [Google Scholar] [CrossRef]
  36. Ter Braak, C.J. Canonical correspondence analysis: A new eigenvector technique for multivariate direct gradient analysis. Ecology 1986, 67, 1167–1179. [Google Scholar] [CrossRef] [Green Version]
  37. Godron, M.; Daget, P.; Poissonet, P. Some aspects of heterogeneity in grasslands of Cantal (France). Stat. Ecol. 1971, 3, 397–415. [Google Scholar]
  38. Zheng, Y.R. Comparison of methods for studying stability of forest community. Sci. Silvae Sin. 2000, 36, 28–32. [Google Scholar]
  39. Ter Braak, C.J.; Smilauer, P. Canoco Reference Manual and User’s Guide: Software for Ordination, Version 5.0; Microcomputer Power: Ithaca, NY, USA, 2012. [Google Scholar]
  40. He, Z.L.L.; Yang, X.E.; Stoffella, P.J. Trace elements in agroecosystems and impacts on the environment. J. Trace Elem. Med. Biol. 2005, 19, 125–140. [Google Scholar] [CrossRef]
  41. Hooda, P. Trace Elements in Soils; John Wiley & Sons: Hoboken, NJ, USA, 2010. [Google Scholar]
  42. Ren, D.J.; Shen, S.L.; Cheng, W.C.; Zhang, N.; Wang, Z.F. Geological formation and geo-hazards during subway construction in Guangzhou. Environ. Earth Sci. 2016, 75. [Google Scholar] [CrossRef]
  43. Xu, L.; Liu, T. The zonal differentiation of soil environmental background values and critical contents in Guangdong. J. South. China Agric. Univ. 1996, 4, 61–65. [Google Scholar]
  44. Nikolic, M.; Pavlovic, J. Plant responses to iron deficiency and toxicity and iron use efficiency in plants. In Plant Micronutrient Use Efficiency; Elsevier: Amsterdam, The Netherlands, 2018; pp. 55–69. [Google Scholar]
  45. Kacalek, D.; Dusek, D.; Novak, J.; Slodicak, M.; Bartos, J.; Cernohous, V.; Balcar, V. Former agriculture impacts on properties of Norway spruce forest floor and soil. For. Syst. 2011, 20, 437–443. [Google Scholar] [CrossRef] [Green Version]
  46. Lewis, D.B.; Kaye, J.P.; Kinzig, A.P. Legacies of agriculture and urbanization in labile and stable organic carbon and nitrogen in Sonoran Desert soils. Ecosphere 2014, 5, 18–28. [Google Scholar] [CrossRef] [Green Version]
  47. Richardson, D.M.; Holmes, P.M.; Esler, K.J.; Galatowitsch, S.M.; Stromberg, J.C.; Kirkman, S.P.; Pyšek, P.; Hobbs, R.J. Riparian vegetation: Degradation, alien plant invasions, and restoration prospects. Divers. Distrib. 2007, 13, 126–139. [Google Scholar] [CrossRef]
  48. Castro-Diez, P.; Fierro-Brunnenmeister, N.; Gonzalez-Munoz, N.; Gallardo, A. Effects of exotic and native tree leaf litter on soil properties of two contrasting sites in the Iberian Peninsula. Plant. Soil 2012, 350, 179–191. [Google Scholar] [CrossRef]
  49. Tamura, M.; Suseela, V.; Simpson, M.; Powell, B.; Tharayil, N. Plant litter chemistry alters the content and composition of organic carbon associated with soil mineral and aggregate fractions in invaded ecosystems. Glob. Chang. Biol. 2017, 23, 4002–4018. [Google Scholar] [CrossRef]
  50. Stefanowicz, A.M.; Stanek, M.; Nobis, M.; Zubek, S. Species-specific effects of plant invasions on activity, biomass, and composition of soil microbial communities. Biol. Fertil. Soils 2016, 52, 841–852. [Google Scholar] [CrossRef] [Green Version]
  51. Luan, J.; Liu, S.; Zhu, X.; Wang, J.; Liu, K. Roles of biotic and abiotic variables in determining spatial variation of soil respiration in secondary oak and planted pine forests. Soil Biol. Biochem. 2012, 44, 143–150. [Google Scholar] [CrossRef]
  52. Ruwanza, S.; Dondofema, F. Effects of exotic guava (Psidium guajava L.) invasion on soil properties in Limpopo, South Africa. Afr. J. Ecol. 2020, 58, 272–280. [Google Scholar] [CrossRef]
  53. Pruchniewicz, D. Abandonment of traditionally managed mesic mountain meadows affects plant species composition and diversity. Basic Appl. Ecol. 2017, 20, 10–18. [Google Scholar] [CrossRef]
  54. Esterhuizen, N.; Forrester, J.; Esler, K.J.; Wigley-Coetzee, C.; Morcillo, R.J.; Kleinert, A.; Perez-Fernandez, M.; Valentine, A.J. Nitrogen and phosphorus influence Acacia saligna invasiveness in the fynbos biome. Plant. Ecol. 2020, 221, 309–320. [Google Scholar] [CrossRef]
  55. Barad, A.V.; Revar, H.J.; Rajput, S.T. Effect of nitrogen levels and cuttings (main and ratoon) on golden rod (Solidago canadensis L.) during summer and rainy season planting. Indian J. Hortic. 2011, 68, 379–385. [Google Scholar]
  56. Ding, W.J.; Wang, R.Q.; Yuan, Y.F.; Liang, X.Q.; Liu, J. Effects of nitrogen deposition on growth and relationship of Robinia pseudoacacia and Quercus acutissima seedlings. Dendrobiology 2012, 67, 3–13. [Google Scholar]
  57. Czortek, P.; Krolak, E.; Borkowska, L.; Bielecka, A. Impacts of soil properties and functional diversity on the performance of invasive plant species Solidago canadensis L. on post-agricultural wastelands. Sci. Total Environ. 2020, 729, 10. [Google Scholar] [CrossRef]
  58. Vanderhoeven, S.; Dassonville, N.; Chapuis-Lardy, L.; Hayez, M.; Meerts, P. Impact of the invasive alien plant Solidago giganteaon primary productivity, plant nutrient content and soil mineral nutrient concentrations. Plant. Soil 2006, 286, 259–268. [Google Scholar] [CrossRef] [Green Version]
  59. Liu, H.; Du, R.; Wang, Y.; Chen, Y.; Wu, Y.; Yuan, L. Effects of Eupatorium adenophorum on interspecific association and the stability of companion species in Liangshan Prefecture of Sichuan Province. Acta Ecol. Sin. 2017, 37, 5031–5038. [Google Scholar]
  60. Wheelan, C. Naked Statistics: Stripping the Dread from the Data; WW Norton & Company: New York, NY, USA, 2013. [Google Scholar]
  61. Wu, H.; Du, K.; Li, W.; Cao, Y.; Kong, F.; Zhao, D. Influence of Alternanthera philoxeroides invasion on species diversity and stability in the herbaceous community in southern Henan Province. Pratacultural. Sci. 2019, 36, 382–393. [Google Scholar]
  62. Huang, Y.; Ge, Y.; Wang, Q.; Zhou, H.; Liu, W.; Christie, P. Allelopathic Effects of Aqueous Extracts of Alternanthera philoxeroides on the Growth of Zoysia matrella. Pol. J. Environ. Stud. 2017, 26, 97–105. [Google Scholar] [CrossRef]
  63. Pyšek, P.; Richardson, D.M. The biogeography of naturalization in alien plants. J. Biogeogr. 2006, 33, 2040–2050. [Google Scholar] [CrossRef]
  64. Waddell, E.H.; Banin, L.F.; Fleiss, S.; Hill, J.K.; Hughes, M.; Jelling, A.; Yeong, K.L.; Ola, B.B.; Bin Sailim, A.; Tangah, J.; et al. Land-use change and propagule pressure promote plant invasions in tropical rainforest remnants. Landsc. Ecol. 2020, 35, 1891–1906. [Google Scholar] [CrossRef]
  65. Byun, C.; de Blois, S.; Brisson, J. Interactions between abiotic constraint, propagule pressure, and biotic resistance regulate plant invasion. Oecologia 2015, 178, 285–296. [Google Scholar] [CrossRef]
  66. Foster, B.L.; Houseman, G.R.; Hall, D.R.; Hinman, S.E. Does tallgrass prairie restoration enhance the invasion resistance of post-agricultural lands? Biol. Invasions 2015, 17, 3579–3590. [Google Scholar] [CrossRef]
  67. Muthukrishnan, R.; Hansel-Welch, N.; Larkin, D.J. Environmental filtering and competitive exclusion drive biodiversity-invasibility relationships in shallow lake plant communities. J. Ecol. 2018, 106, 2058–2070. [Google Scholar] [CrossRef]
  68. Morin, X.; Fahse, L.; Scherer-Lorenzen, M.; Bugmann, H. Tree species richness promotes productivity in temperate forests through strong complementarity between species. Ecol. Lett. 2011, 14, 1211–1219. [Google Scholar] [CrossRef]
  69. Park, J.; Kim, H.S.; Jo, H.K.; Jung, I. The Influence of Tree Structural and Species Diversity on Temperate Forest Productivity and Stability in Korea. Forests 2019, 10, 1113–1122. [Google Scholar] [CrossRef] [Green Version]
  70. Herron, C.M.; Jonas, J.L.; Meiman, P.J.; Paschke, M.W. Using native annual plants to restore post-fire habitats in western North America. Int. J. Wildland Fire 2013, 22, 815–821. [Google Scholar] [CrossRef]
  71. Kerns, B.K.; Day, M.A. The importance of disturbance by fire and other abiotic and biotic factors in driving cheatgrass invasion varies based on invasion stage. Biol. Invasions 2017, 19, 1853–1862. [Google Scholar] [CrossRef]
Figure 1. Geographic location of the study area in Guangdong, China (A,B) and sampling sites (C).
Forests 12 00185 g001
Figure 2. Box and whisker plots showing variations in average cover (A) and average height (B) of the resident community across stand types. NF = natural forest; AF = abandoned fallows; PF = planted forest.
Forests 12 00185 g002
Figure 3. Variations in total abundance in different stand types across cover classes (A) and height classes (B).
Forests 12 00185 g003
Figure 4. Ordination biplot showing the first two axis results from canonical correspondence analysis (CCA) of natural forest (filled squares), abandoned fallows (filled circles) and planted forest (filled triangles).
Forests 12 00185 g004
Figure 5. Ordination biplot showing the first two-axis results from canonical correspondence analysis (CCA) of both native (black color) and invasive (blue color) species in the understory of the resident communities. The top 32 species were selected from the analysis. Species codes: DUNROT = Dunbaria rotundifolia; PANBRE = Panicum brevifolium; KYLNEM = Kyllinga nemoralis; EUPCAT = Eupatorium catarium; TETASI = Tetracera asiatica; ALOMAC = Alocasia macrorrhiza; STELAN = Sterculia lanceolata; BORLAT = Borreria latifolia; MIKMIC = Mikania micrantha; VIOVER = Viola verecunda; MAEPER = Maesa perlarius; HEDHED = Hedyotis hedyotidea; TYPDIV = Typhonium divaricatum (L.) Decne.; PSYSER = Psychotria serpens; FICFIS = Ficus fistulosa; EVOLEP = Evodia lepta; RUBALC = Rubus alceaefolius; CASHYS = Castanopsis hystrix; ALLMET = Allantodia metteniana; PSYRUB = Psychotria rubra; LINORB = Lindsaea orbiculata; DICDIC = Dicranopteris dichotoma; LYGSCA = Lygodium scandens; MISSIN = Miscanthus sinensis; LITCUB = Litsea cubeba; APODIO = Aporosa dioica; CRALIG = Cratoxylum ligustrinum; RHOTOM = Rhodomyrtus tomentosa; LINHET = Lindsaea heterophylla; TOXSUC = Toxicodendron succedaneum; CALMAC = Callicarpa macrophylla; MELNOR = Melastoma normale.
Forests 12 00185 g005
Figure 6. Stability of tree stand types. (A) = natural forest; (B) = abandoned fallows; (C) = planted forest.
Forests 12 00185 g006
Table 1. Stand site characteristics.
AttributeNatural ForestAbandoned FallowsPlanted Forest
Location113°47′–113°48′ E113°39′–113°40′ E113°37′–113°45′ E
23°38′–23°39′ N23°22′–23°29′ N23°17′–23°42′ N
Elevation (m)260.2135.496
Slope (°)23.720.416.8
Soillateritic red soillateritic red soillateritic red soil
Bedrockgranitegranitegranite
Stand age202020
Sample plots999
Quadrats272727
Invasion samples 161
Average alien cover (%) 0.1124.33.33
Dominant canopy species Cunninghamia lanceolata, Castanopsis hystrix, Machilus chinensisEucalyptus urophylla, Pinus elliottii, Litchi chinensisAcacia magium, Pinus massoniana, Castanopsis chinensis
Table 2. Classification of the range of height and cover classes.
Height ClassRange of Height(cm)Mid-Point
1<10.5
22–152.1
316–3020
431–4540
546–6050
661–8070
7>80100
Cover classRange of cover (%)Mid-point
1<11
22–53
36–105
411–1515
516–2020
621–3030
740–5040
8>5050
Table 3. Multi-responsepermutation procedures (MRPP) to test for significance of variation in natural forest (NF), abandoned fallows (AF) and planted forest (PF).
Group ComparedTAp
PF vs. AF−2.56620.03890.0241
PF vs. NF−6.26030.08750.0002
AF vs. NF−7.28450.14510.0001
Table 4. Plant species with a significant indicator value (IV) ≥ 25 for different forest types.
Stand TypeSpeciesIndicator Value (IV)MeanS.Devp Level
Natural forestAdiantum flabellulatum47.70 29.90 8.21 0.04
Allantodia metteniana55.60 17.20 7.97 0.00
Ardisia punctata22.20 11.00 7.44 0.30
Blechnum orientale38.90 29.20 7.56 0.13
Carex chinensis44.40 16.00 7.61 0.02
Evodia lepta67.60 22.90 9.09 0.00
Lindsaea orbiculata44.40 16.20 7.80 0.02
Psychotria rubra86.70 23.60 8.35 0.00
Schefflera octophylla65.80 21.50 9.21 0.00
Woodwardia japonica33.30 14.10 7.41 0.08
Abandoned fallowsAlocasia macrorrhiza30.20 16.50 8.28 0.08
Borreria latifolia24.40 16.20 7.89 0.15
Cratoxylum ligustrinum33.30 13.60 7.37 0.08
Cyrtococcum patens23.70 22.10 9.50 0.30
Microlepia hancei26.30 18.30 8.50 0.21
Mikania micrantha33.30 13.70 7.57 0.09
Miscanthus sinensis30.50 18.00 8.41 0.11
Planted forestAlchornea trewioides33.30 14.50 7.66 0.09
Aporosa dioica28.90 16.00 7.83 0.09
Ardisia quinquegona25.90 15.80 7.45 0.15
Dicranopteris dichotoma35.40 26.80 9.95 0.18
Ficus hirta22.90 23.10 9.26 0.42
Litsea cubeba33.30 14.10 7.64 0.08
Mussaenda pubescens44.80 29.90 8.28 0.07
Polygonum chinensis31.40 18.40 8.71 0.15
Pteris semipinnata26.60 28.20 7.74 0.51
Table 5. Soil mineral concentrations from plots in natural forest, abandoned fallows and planted forest.
VariableNaturalAbandoned FallowsPlanted ForestF Valuep Level
MaxMean ± SEMinMaxMean ± SEMinMaxMean ± SEMin
ANa69.63 15.57 ± 6.805.85 13.93 6.56 ± 1.192.67 8.64 4.27 ± 0.881.41 2.21 0.13
ECa205.62 70.0 ± 17.6027.04 145.42 71.9 ± 16.2118.97 51.34 38.71 ± 2.5627.76 1.80 0.19
EMg29.73 12.88 ± 2.246.16 19.98 9.85 ± 1.924.06 10.90 7.32 ± 0.684.60 2.53 0.10
ACu1.29 0.84 ± 0.090.47 3.05 1.36 ± 0.310.39 2.29 0.93 ± 0.270.18 1.28 0.30
AZn8.16 4.96 ± 0.632.62 16.71 5.63 ± 1.552.03 8.84 4.43 ± 0.722.39 0.32 0.73
AFe65.73 36.6 ± 6.70 b10.53 94.34 62.32 ± 5.86 a39.60 83.50 49.39 ± 7.01 ab22.95 3.86 0.04
AMn18.23 7.47 ± 2.310.81 26.93 6.53 ± 2.980.50 65.87 13.47 ± 7.500.36 0.60 0.56
AB0.35 0.27 ± 0.02 a0.19 0.49 0.31 ± 0.03 a0.23 0.38 0.17 ± 0.03 b0.07 6.27 0.01
THg0.14 0.09 ± 0.01 a0.06 0.09 0.06 ± 0.01 b0.05 0.21 0.11 ± 0.02 a0.05 4.70 0.02
Note: Available sodium (mg/kg): ANa; Exchangeable calcium (mg/kg): ECa; Exchangeable magnesium (mg/kg): EMg; Available copper (mg/kg): ACu; Available zinc (mg/kg): AZn; Available ferrum (mg/kg): AFe; Available manganese (mg/kg): AMn; Available boron (mg/kg): AB; Total mercury (mg/kg): THg. Data with different lowercase letters indicate a significant difference (p < 0.05).
Table 6. Eigenvalues and explained variation of the first four canonical correspondence analysis (CCA) ordination axes of species distribution and environmental variables.
StatisticAxis 1Axis 2Axis 3Axis 4
Eigenvalues0.6250.5340.4760.461
Explained variation (cumulative)7.07013.10018.49023.700
Pseudo-canonical correlation0.9370.9070.9380.937
Explained fitted variation (cumulative)19.73036.58051.62066.180
Table 7. Effects of environmental variables on species distribution.
NameExplained Variation %Contribution %p Value
AFe6.19.20.002
AB5.37.90.016
ECa5.17.60.022
EMg5.68.40.03
Coverage57.40.048
ACu4.56.70.09
THg4.26.30.19
Table 8. Changes in stability parameters in relation to stand type.
Stand TypeFitted Curve Average HeightR²Crossover PointEuclidean Distance
Natural foresty = −0.0015x2 + 1.304x − 3.63450.965(46.89,53.11)38.028
Abandoned fallowsy = −0.0011x2 + 1.0213x − 3.06120.977(52.49,47.51)45.948
Planted foresty = −0.0051x2 + 1.3765x0.947(46.77,53.23)37.858
Publisher’s Note: MDPI stays neutral with regard to jurisdictional claims in published maps and institutional affiliations.