
Rapid Ecological Integrity Assessment Metrics to Restore Wildlife Habitat and Biodiversity for Shortleaf Pine–Oak Ecosystems


Abstract
:1. Introduction
- To provide a common framework for delineating the various broadly distinct shortleaf pine–oak (SPO) and Appalachian pine–oak (AP) ecosystems.Product: Classification of SPO and AP ecosystems, including distribution according to ecoregion and National Forests.
- To define the desired reference conditions that can guide the management of SPO and AP ecosystems, where the primary objective is the conservation of wildlife and biodiversity maintenance.Product: A set of reference conditions for SPO and AP ecosystems, evaluated using ecological integrity indicators.
- To provide a rapid EIA assessment protocol that is usable by land managers to assess the condition of stands.Product: A protocol, usable in the field, that guides the evaluation process, using indicators with ratings of Excellent, Good, Fair, and Poor.
1.1. Definition of Southern Open Pine Ecosystems
1.2. Priority Wildlife Species
1.3. Management of Southern Open Pine Forests
1.4. Purpose
2. Materials and Methods
2.1. Ecological Integrity Assessment Methods: Metrics-Based Approach
- Specify the ecosystem types
- Develop the conceptual models of ecosystem types
- Specify the level of assessment
- Select the indicators and metrics
- Determine metric ratings (assessment points/thresholds)
- Provide assessment tools
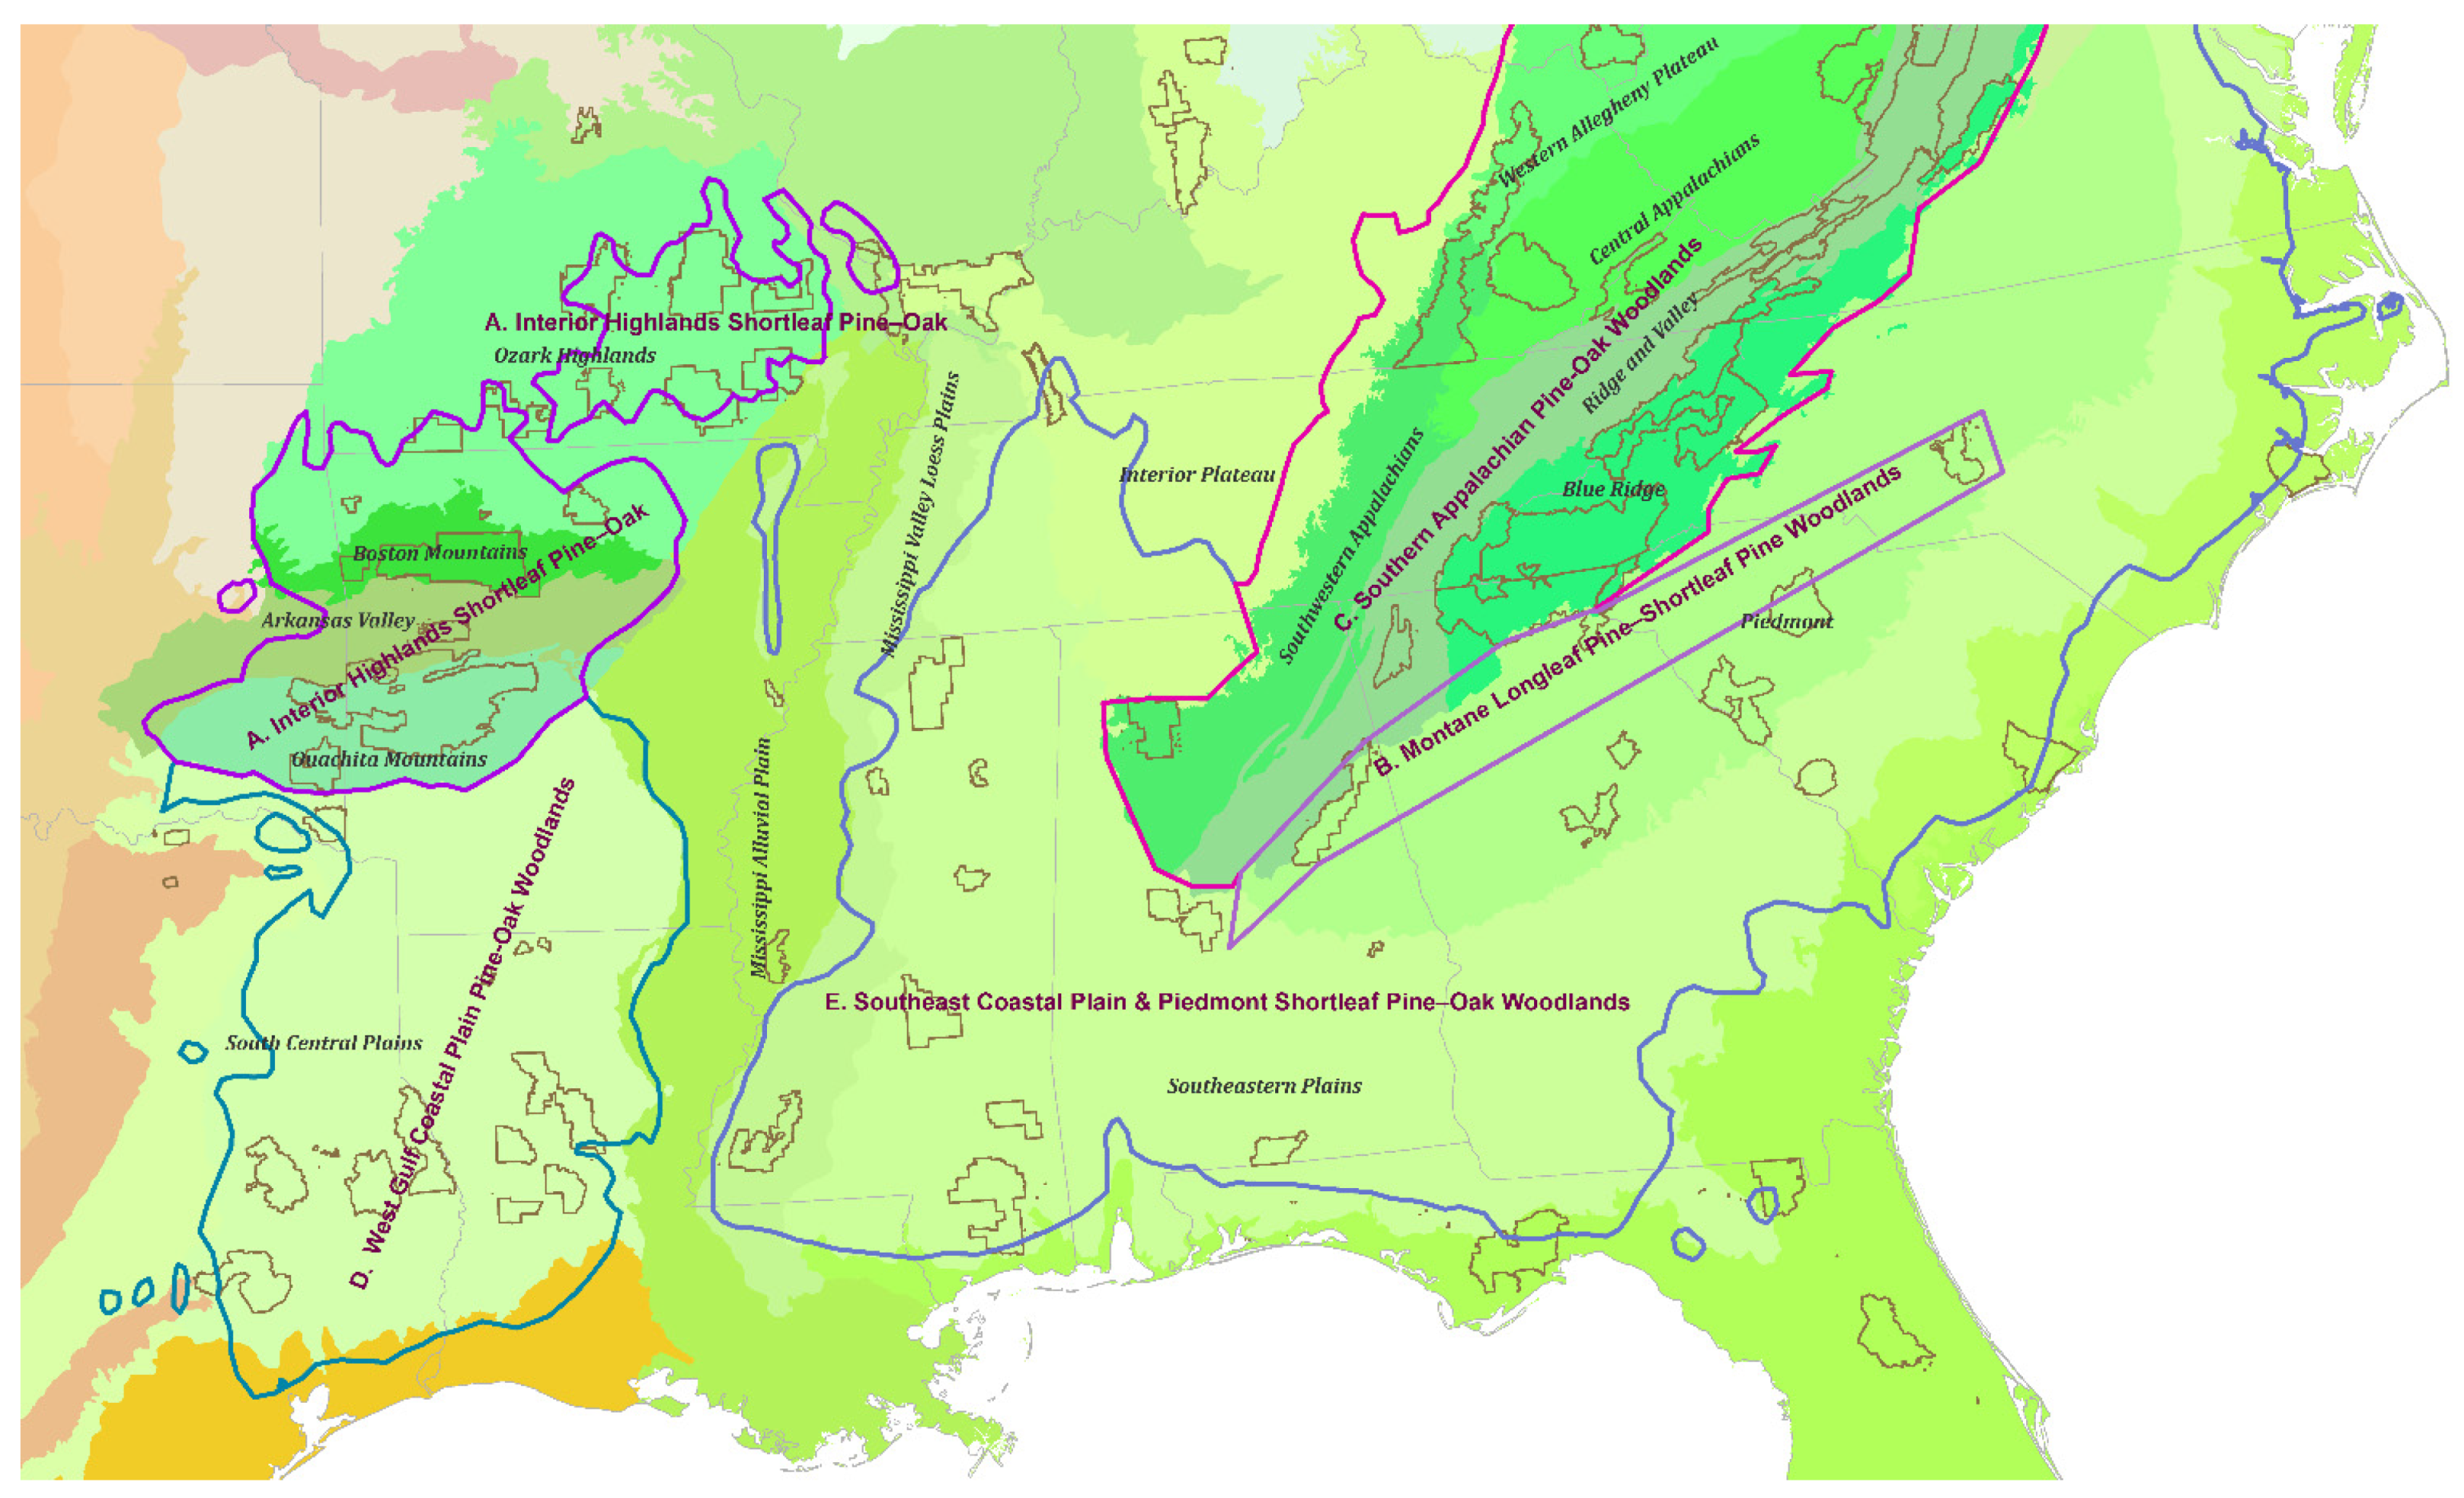
2.1.1. Specification of Ecosystem Types
- Interior Highlands Shortleaf Pine–Oak
- A.1.
- Interior Highlands Shortleaf Pine–Oak Forests and WoodlandsThese dry, dry-mesic, and mesic Interior Highlands shortleaf pine–oak forests and woodlands have their most extensive areas in the Ozark–Ouachita Highlands, with shortleaf pines and oaks (Quercus spp.) as the canopy codominants, generally mixed with hickories (Carya spp.) and other hardwoods. The mid-story is sparse, the tall shrub layer is sparse to patchy, and the short shrub layer may be patchy to dense. The herbaceous understory is dominated by graminoids, including the little bluestem (Schizachyrium scoparium (Michx.) Nash), oat grass (Danthonia spp.), woodoats (Chasmanthium spp.), and Pennsylvania sedge (Carex pensylvanica Lam.), with various forbs, such as elmleaf goldenrod (Solidago ulmifolia Muhl. ex Willd.), and pale purple coneflower (Echinacea pallida Moench.).
- A.2.
- Interior Highlands Shortleaf Pine–Bluestem WoodlandsThese dry and dry-mesic Interior Highlands shortleaf pine–bluestem woodlands have their most extensive areas on long ridges in the Ouachita Highlands, with shortleaf pine as the canopy dominant, the subcanopy and midstory are open with scattered oaks, hickories, and other hardwoods. The tall shrub layer is largely absent, and the short shrub layer is very open. The understory is characterized by big bluestem (Andropogon gerardii L.) and little bluestem, as well as other prairie grasses, legumes, and various other forbs.
- Montane Longleaf Pine–Shortleaf Pine WoodlandsMountain longleaf pine–shortleaf pine woodlands occur on dry sites and ridges in certain Appalachian or Piedmont areas of Alabama, Georgia, and the Carolinas. These pine woodlands have longleaf pine and shortleaf pine as the canopy dominants, which are generally mixed with oaks, hickories, and other hardwoods. Open tall and short shrub layers are common, and in more open stands, the understory is characterized by Elliott’s bluestem (Andropogon gyrans Ashe.), splitbeard bluestem (Andropogon ternarius Michx.), big bluestem, oatgrass, little bluestem, Indian grass (Sorghastrum nutans Nash), other prairie grasses and forbs including greater tickseed (Coreopsis major Walter), tick trefoil (Desmodium spp.), and lespedeza (Lespedeza spp.).
- Southern Appalachian Pine–Oak WoodlandsSouthern Appalachian pine–oak woodlands mainly occur in the Southern Appalachian Mountains, including the Cumberland Mountains and plateaus. These open woodlands have pitch pine and shortleaf pine, mixed with oak at lower elevations, and, at middle elevations and on slopes and steep ridges, pitch pine and Table Mountain pine mixed with oak are to be found. These Southern Appalachian pine–oak woodlands tend to be shorter-statured than other shortleaf pine–oak woodlands, have more sparse herbaceous cover, dense short shrubs (particularly heathland plants), and more open tall shrubs, midstory and canopy. These ecosystems can occur on rugged slopes.
- West Gulf Coastal Plain Shortleaf Pine–Oak WoodlandsThese West Gulf Coastal Plain upland woodlands are dominated by a mix of shortleaf pine and loblolly pine with hardwoods, primarily the white oak (Quercus alba L.), southern red oak (Quercus falcata Michx.), post oak (Quercus stellata Wangenh.), as well as the scrub oaks, bluejack oak (Quercus incana W.Bartram), sand post oak (Quercus margaretta Small.), and Arkansas oak (Quercus arkansana Sarg.). Other trees include the black oak (Quercus velutina Lam.), mockernut hickory (Carya tomentosa K.Koch), black hickory (Carya texana Buckl.), hawthorn (Crataegus spp.), and hop hornbeam (Ostrya virginiana Mill.). The midstory, tall, and short shrub layers are open. The graminoid layer is from open to very dense; some typical grasses include woodoats, roundseed panicgrass (Dichanthelium sphaerocarpon Gould), and little bluestem.
- Southeastern Coastal Plain and Piedmont Shortleaf Pine–Oak WoodlandsThese southeastern coastal plain upland woodlands occur east of the Mississippi River. They are dominated by a mix of shortleaf pine with hardwoods, primarily white oak, southern red oak, post oak, scarlet oak, and scrub oaks such as the bluejack oak and sand post oak. Other trees include black oak, mockernut hickory, hawthorn, red maple (Acer rubrum), sourwood (Oxydendrum arboreum DC.), and hop hornbeam. The midstory, tall, and short shrub layers are open. The graminoid layer is open to very dense; some typical grasses include blackseed speargrass (Piptochaetium avenaceum Parodi.), poverty oatgrass (Danthonia spicata L.), woodoats, roundseed panicgrass, and little bluestem.
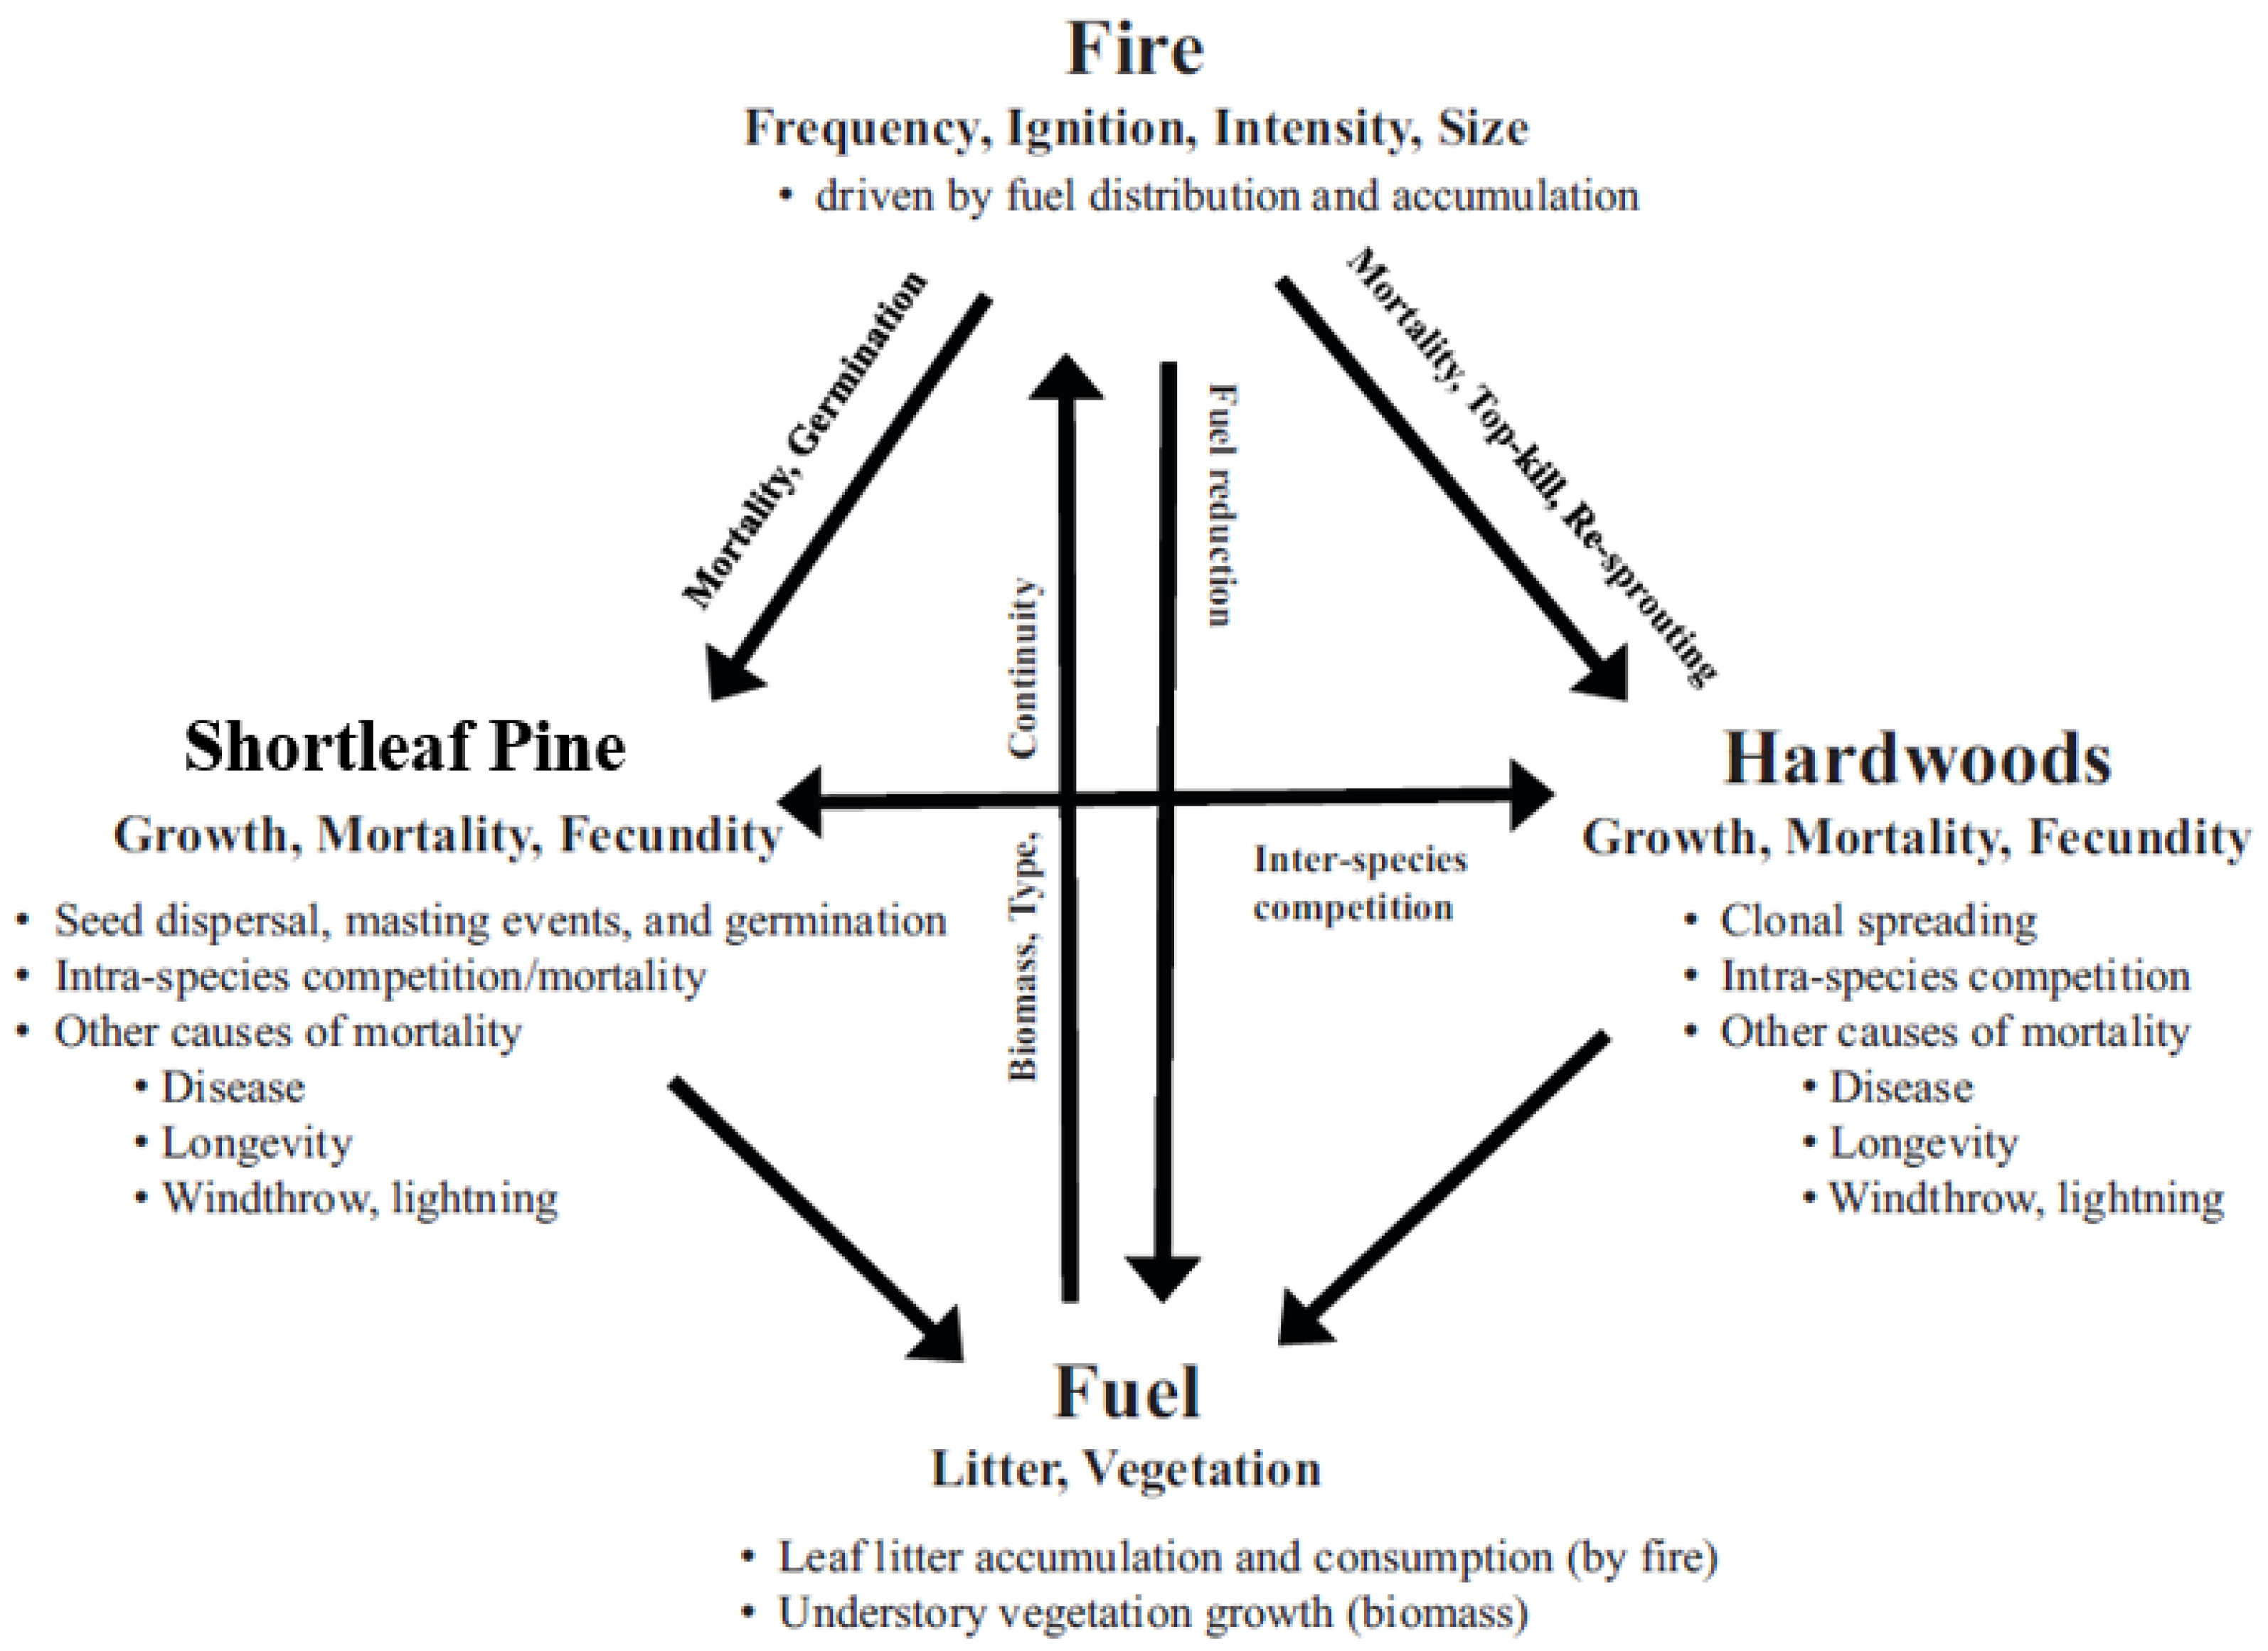
2.1.2. Develop Conceptional Models
- Canopy and midstory trees: indicators are needed that measure both pine and hardwood abundance and distinguish fire-tolerant pines and hardwoods from fire-intolerant pines and hardwoods; these measures track the degree to which woodland management and fire regime is maintaining a fire-tolerant tree composition.
- Canopy cover and size: Indicators are needed to assess the degree to which woodland management and the fire regime maintain an open and mature canopy structure.
- Indicators are needed to assess the amounts of tall and short shrub cover, graminoid and overall herbaceous cover, including the cover of invasive plants.
- Indicators are needed to assess damage to the soil profile caused by management and other activities (including past land use).
2.1.3. Specify the Level of Assessment
- Able to distinguish condition/ecological integrity of remnant stands and restored stands using metrics that are, where necessary, sensitive to particular types of open pine ecosystems
- Repeatable, based on clearly defined protocols
- Quick to apply in the field, with multiple locations assessed in a site visit of 2–4 h
- Relatively simple and easy for field crews to implement
- Able to detect change over time (for monitoring)
- Contribute information to regional assessments.
- Bark resistance to fire
- Ability to resprout after fire
- How well any downed leaves burn in fuel beds
- How fire influences recruitment
- Regular occurrences of fire in stands that have been frequently burned over a long period of time.
2.1.4. Select the Indicators and Metrics
2.1.5. Determine Metric Assessment Points/Thresholds
2.1.6. Provide Assessment Tools
2.2. Peer-Review Workshops to Refine the Metrics
2.3. Case Study of EIA Metrics
3. Results
3.1. Ecosystem Types
3.2. Metrics List
3.3. Metric Assessment Points
3.3.1. Canopy
3.3.2. Midstory/Shrub
3.3.3. Ground Layer
3.4. Metric Summaries by Open Pine Group
3.5. Case Study
4. Discussion
4.1. Metrics-Based Approach and Reference Conditions
- First, it is the knowledge of natural variability that informs our goals and evaluations of current conditions, but this knowledge does not a priori constrain how we state desired conditions for excellent or good ecological integrity or the level of ecosystem services.
- Second, to suggest that we can simply take over the management of natural ecosystems without understanding NRV is to invite failures in these complex systems.
- Third, the purpose of understanding NRV is not to lock us in the past but to ensure that we connect the historical ecological patterns and processes to the present and future.
- Fourth, understanding NRV will ensure that we can anticipate change and emphasize resilience in the face of future changes.
4.2. Wildlife and Ecological Integrity Assessments
4.3. Application of Metrics
Author Contributions
Funding
Data Availability Statement
Acknowledgments
Conflicts of Interest
Appendix A. Priority Wildlife Species

| Taxon | Scientific Name | Common Name | Nature Serve GRank | ESA Listing |
|---|---|---|---|---|
| Bird | Paucaea (Aimophila) aestivalis | Bachman’s sparrow | G3 | |
| Bird | Antrostomus vociferus | Whip-poor-will | G5 | |
| Bird | Bonasa umbellus | Ruffed grouse | G5 | |
| Bird | Buteo platypterus | Broad-winged hawk | G5 | |
| Bird | Antrostomus (Caprimulgus) carolinensis | Chuck-wills-widow | G5 | |
| Bird | Catharus fuscenscens | Verry | G5 | |
| Bird | Certhia ameriana | Brown creeper | G5 | |
| Bird | Chaetura pelagica | Chimney swift | G4 | |
| Bird | Colaptes auratus | Northern flicker | G5 | |
| Bird | Colinus virginianus | Northern bobwhite | G4 | |
| Bird | Contopus virens | Eastern wood-pewee | G5 | |
| Bird | Steophaga (Dendroica) dominica | Yellow-throated warbler | G5 | |
| Bird | Dryocopus pileatus | Pileated woodpecker | G5 | |
| Bird | Empidonax minimus | Least flycatcher | G5 | |
| Bird | Empidonax virescens | Acadian flycatcher | G5 | |
| Bird | Geothlypis formosa | Kentucky warbler | G5 | |
| Bird | Helmitheros vermivorum | Worm-eating warbler | G5 | |
| Bird | Hylocichla mustelina | Wood thrush | G4 | |
| Bird | Limnothlypis swainsonii | Swainson’s warbler | G4 | |
| Bird | Melanerpes erythrocephalus | Red-headed woodpecker | G5 | |
| Bird | Parkesia motacilla | Louisiana waterthrush | G5 | |
| Bird | Dryobates (Picoides) borealis | Red-cockaded woodpecker | G3 | EN |
| Bird | Pipilo erythrophthalmus | Eastern towhee | G5 | |
| Bird | Piranga olivacea | Scarlet tanger | G5 | |
| Bird | Scologpax minor | American woodcock | G5 | |
| Bird | Selurus aurocapilla | Ovenbird | G5 | |
| Bird | Setophaga pinus | Pine warbler | G5 | |
| Bird | Setophago discolor | Prairie warbler | G5 | |
| Bird | Sitta pusilla | Brown-headed nuthatch | G4 | |
| Bird | Spizella passerine | Chipping sparrow | G5 | |
| Bird | Spizella pusilla | Field sparrow | G5 | |
| Bird | Steophaga discolor | Prairie warbler | G5 | |
| Bird | Toxostoma rufum | Brown thrasher | G5 | |
| Invertebrate | Bombus spp. | Bumblebees | ||
| Invertebrate | Danaus plexippus | Monarch butterfly | G4 | |
| Invertebrate | Nicrophorus americanus | American burying beetle | G3 | EN |
| Invertebrate | Speyeria cybele | Great-spangled fritillary | G5 | |
| Invertebrate | Speyeria diana | Diana fritillary | G2 | |
| Mammal | Corynorhinus rafinesquii | Rafinesque’s big-eared bat | G3 | |
| Mammal | Eptesicus fuscus | Big brown bats | G5 | |
| Mammal | Lasionycteris noctivagans | Silver-haried bats | G3 | |
| Mammal | Lasiurus cinereus | Hoary bats | G3 | |
| Mammal | Lasiurus seminolus | Seminole bat | G5 | |
| Mammal | Microtus chrotorrhinus carolinensis | Southern rock vole | T3 | |
| Mammal | Myotis grisescens | Gray bat | G4 | EN |
| Mammal | Myotis leibii | Eastern small-footed bat | G4 | |
| Mammal | Myotis lucifugus | Little brown bat | G3 | |
| Mammal | Myotis septentrionalis | Northern long-eared bat | G1 | TH |
| Mammal | Myotis sodalis | Indiana bat | G2 | EN |
| Mammal | Neotoma floridana haematoria | Southern Appalachian woodrat | T4 | |
| Mammal | Neotoma magister | Alleghany woodrat | G3 | |
| Mammal | Perimyotis subflavus | Tri-colored bat | G2 | |
| Mammal | Silogale putorius | Spotted skunks | G4 | |
| Mammal | Ursus americanus | Black bear | G5 | |
| Amphibian | Plethodon welleri | Weller’s salamander | G3 | |
| Reptile | Crotalus horridus | Timber rattlesnake | G4 | |
| Reptile | Elaphe guttata guttata | Corn snake | G5 | |
| Reptile | Eumeces anthracinus | Coal Skink | G5 | |
| Reptile | Heterodon platirhinos | Eastern hognose snake | G5 | |
| Reptile | Lampropeltis triangulum triangulus | Eastern milk snake | G5 | |
| Reptile | Pituophis melanloeucas | Northern pinesnake | G4 | |
| Reptile | Regina septemvittata | Queen snake | G5 | |
| Reptile | Terrapene carolina | Eastern box turtle | G5 | |
| Reptile | Virginia valeriae valeriae | Eastern earthsnake | G5 |
| Taxon | Common Name | Scientific Name | Project Area States Where it Occurs | States Where Listed as SGCN in 2015 State Wildlife Action Plan |
|---|---|---|---|---|
| Bird | Peucaea (Aimophila) aestivalis | Bachman’s sparrow | All project area states | AL, AR, FL, GA, KY, LA, MO, MS, NC, OK, SC, TN, TX, VA |
| Bird | Colinus virginianus | Northern bobwhite | All project area states | AR, DC, DE, FL, GA, IA, IL, IN, KS, KY, LA, MA, MD, MO, MS, NC, NJ, NY, OH, OK, SC, TN, TX, VA, WI, WV |
| Bird | Dryobates (Picoides) borealis | Red-cockaded woodpecker | All project area states, except KY, MO, TN (Extirpated) | AL, AR, FL, GA, KY (Extirpated), LA, MD, MS, NC, OK, SC, TX, VA |
| Invertebrate | Bombus spp. | Bumblebees | All project area states | GA, NC, VA (Bombus affinus), GA (Bombus borealis) |
| Invertebrate | Danaus plexippus | Monarch butterfly | All project area states | AR, CA, CO, CT, DE, GA, IA, ID, IL, KS, LA, MD, ME, MI, MN, MO, NJ, OH, OR, NC, ND, NH, PA, RI, VT, WA |
| Invertebrate | Nicrophorus americanus | American burying beetle | AR, OK, TX (presumed or possibly extirpated from many states) | AL, AR, CT, DE, IL, KS, MA, MO, NC, NE, NJ, OH, OK, PA, RI, SD, TN, TX, VA |
| Invertebrate | Speyeria diana | Diana fritillary | AL, AR, GA, KY, NC, OK, SC, TN, VA, WV | AR, GA, OH, OK, SC, TN, VA, WV |
| Mammal | Corynorhinus rafinesquii | Rafinesque’s big-eared bat | All project area states | AL, AR, FL, GA, IL, IN, KY, LA, MO, MS, NC, OH, OK, SC, TN, TX, WV |
| Mammal | Lasionycteris noctivagans | Silver-haired bats | All project area states | AK, CT, DE, IA, ID, IN, LA, MA, MD, ME, MN, MO, MS, NH, NJ, NV, NY, OH, OR, PA, RI, SD, VA, VT, WA, WV |
| Mammal | Lasiurus cinereus | Hoary bats | All project area states | CO, CT, DE, ID, IN, MA, MD, ME, MS, MN, MS, NH, NJ, NV, NY, OH, OR, RI, SC, VA, VT, WA, WV |
| Mammal | Microtus chrotorrhinus carolinensis | Southern rock vole | MD, NC, TN, VA, WV | MD, NC, TN, VA, WV (Microtus chrotorrhinus) |
| Mammal | Myotis grisescens | Gray bat | AL, AR, FL, GA, KS, KY, IL, IN, MO, MS (possibly extirpated), NC, OK, SC, TN, VA | AL, AR, FL, GA, KS, KY, IL, IN, MO, MS, NC, OK, TN, VA |
| Mammal | Myotis lucifugus | Little brown bat | All project area states, except LA, TX | AK, AL, AR, CO, CT, DE, GA, IA, ID, IN, KS, MA, MD, ME, MI, MN, NC, ND, NE, NH, NJ, NV, NY, OH, PA, RI, SC, TN, TX, UT, VA, VT, WI, WV, WY |
| Mammal | Myotis septentrionalis | Northern long-eared bat | All project area states, except TX | All project area states, except FL, KY, TX |
| Mammal | Myotis sodalis | Indiana bat | All project area states, except FL, LA, TX | All project area states, except FL, LA, SC, TX |
| Mammal | Neotoma magister | Alleghany woodrat | AL, IN, KY, MD, NC, NJ, NY, OH, PA, TN, VA, WV | AL, IN, KY, MD, NC, NJ, NY, OH, PA, TN, VA, WV |
| Mammal | Perimyotis subflavus | Tri-colored bat | All project area states | AL, CT, FL, GA, IA, IN, LA, MA, MD, ME, MI, MN, NC, NE, NH, NJ, NY, OH, OK, PA, RI, SC, TX, VA, VT, WI, WV |
| Amphibian | Plethodon welleri | Weller’s salamander | NC, TN, VA | NC, TN, VA |
Appendix B. Metric and Metric Ratings for Each Shortleaf Pine–Oak Group and Southern Appalachian Pine–Oak Group
| A.1. Interior Highlands Shortleaf Pine–Oak Forests and Woodlands (Dry and Mesic Highlands Pine Woodlands) | ||||
|---|---|---|---|---|
| Canopy Metrics | ||||
| Excellent | Good | Fair | Poor | |
| 1. Canopy: Southern Yellow Pine Basal Area | >8.0 to 17.2 m2/ha basal area of shortleaf pine | 6.9 to 8.0 or >17.2 to 20.7 m2/ha basal area of shortleaf pine | 2.3 to <6.9 or >20.7 to 25.3 m2/ha basal area of shortleaf pine | <2.3 or >25.3 m2/ha basal area of shortleaf pine |
| 2. Southern Yellow Pine Canopy Cover | >25% to 70% canopy cover of shortleaf pine | 20%–25% or >70% to 80% canopy cover of shortleaf pine | 10% to <20% or >80 to 90% canopy cover of shortleaf pine | <10% or >90% canopy cover of shortleaf pine |
| 3. Southern Yellow Pine Stand Size Structure | Basal area ≥ 4.6 m2/ha of shortleaf pine trees > 35 cm DBH class | Basal area ≥ 2.3–4.6 m2/ha of shortleaf pine trees > 35 cm DBH class | Shortleaf pine trees > 35 cm DBH class are present, but < 2.3 m2/ha basal area of those large trees | No shortleaf pine trees > 35 cm DBH are present |
| 4. Canopy: Fire-Tolerant Hardwood Basal Area | ≤11.5 m2/ha BA of fire-tolerant hardwood trees | >11.5 to 13.8 m2/ha BA of fire-tolerant hardwood trees | >13.8 to 16.1 m2/ha BA of fire-tolerant hardwood trees | >16.1 m2/ha BA of fire- tolerant hardwood trees |
| 5. Canopy: Fire-Intolerant Tree Basal Area | ≤2.3 m2/ha BA of fire-intolerant trees | >2.3 to 4.6 m2/ha BA of fire-intolerant trees | >4.6 to 6.9 m2/ha BA of fire-intolerant trees | >6.9 m2/ha BA of fire-intolerant trees |
| 6. Stand Density Index (applies to shortleaf pine) (optional) | SDI = 65–135 (14%–30% of maximum SDI of 450) | SDI = 45–65 or 135–180 (10%–14% or 30%–40% of maximum SDI of 450) | SDI = 20–45 or 180–225 (4%–10% or 40%–50% of maximum SDI of 450) | SDI < 20 or >225 (<4% or >50%, 270 is 60% of maximum SD of 450) |
| Midstory/Shrub Metrics | ||||
| Excellent | Good | Fair | Poor | |
| 1. Midstory: Fire-Tolerant Hardwood Cover | 2% to <20% cover of midstory fire- tolerant hardwoods | 20% to 40% cover of midstory fire-tolerant hardwoods | >40% to 50%, or <2% cover of midstory fire- tolerant hardwoods | >50% cover of midstory fire-tolerant hardwoods |
| 2. Midstory: Fire-Intolerant Tree Cover | <10% cover of fire-intolerant tree midstory | 10% to 20% cover of fire-intolerant tree midstory | >20% to 30% cover of fire-intolerant tree midstory | >30% cover of fire-intolerant tree midstory |
| 3. Tall Shrub (3–10 ft tall) Cover | Tall shrubs average < 30% cover | Tall shrubs average 30%–40% cover | Tall shrubs average > 40% to 50% cover | Tall shrubs average > 50% cover |
| 4. Short Shrub (<3 ft tall) Cover | Short shrubs average < 20% cover | Short shrubs average 20%–30% cover | Short shrubs average > 30% to 45% cover | Short shrubs average > 45% cover |
| Ground Layer Metrics | ||||
| Excellent | Good | Fair | Poor | |
| 1. Overall Native Herbaceous Ground Cover | 35%–80% herbaceous cover | 20% to <35% or >80% herbaceous cover | 10% to <20% herbaceous cover | <10% herbaceous cover |
| 2. Native Graminoid Cover | >25% to 85% cover of all native graminoids | >20% to 25% or >85% cover of native graminoids | 10%–20% cover of all native graminoids | <10% cover of all native graminoids |
| 3. Floristic Quality Index, Mean C (Optional) | Mean C > 4.00 | Mean C is 3.01 to 4.00 | Mean C is 2.01 to 3.00 | Mean C < 2.00 |
| 4. Invasive Plant Presence/Distribution | Invasive nonnative plant species absent | Invasive nonnative plant species present in any stratum but sporadic (<1% cover) | Invasive nonnative plant species uncommon in any stratum (1%–5% cover) | Invasive nonnative plant species common in any stratum (>5% cover) |
| Soil Metric | ||||
| 1. Forest Soil Disturbance | Soil Disturbance Class 0 | Soil Disturbance Class 1 | Soil Disturbance Class 2 | Soil Disturbance Class 3 |
| A.2.Interior Highlands Shortleaf Pine–Bluestem Woodlands (Dry and Mesic Highlands Pine Woodlands) | ||||
|---|---|---|---|---|
| Canopy Metrics | ||||
| Excellent | Good | Fair | Poor | |
| 1. Canopy: Southern Yellow Pine Basal Area | >8.0 to 17.2 m2/ha basal area of shortleaf pine | 6.9 to 8.0 or >17.2 to 20.7 m2/ha basal area of shortleaf pine | 2.3 to <6.9 or >20.7 to 25.3 m2/ha basal area of shortleaf pine | <2.3 or >25.3 m2/ha basal area of shortleaf pine |
| 2. Southern Yellow Pine Canopy Cover | >25% to 70% canopy cover of shortleaf pine | 20%–25% or >70% to 80% canopy cover of shortleaf pine | 10% to <20% or >80% to 90% canopy cover of shortleaf pine | <10% or >90% canopy cover of shortleaf pine |
| 3. Southern Yellow Pine Stand Size Structure | Basal area ≥ 4.6 m2/ha of shortleaf pine trees > 35 cm DBH class | Basal area ≥ 2.3–4.6 m2/ha of shortleaf pine trees > 35 cm DBH class | Shortleaf pine trees > 35 cm DBH class are present, but < 2.3 m2/ha basal area of those large trees | No shortleaf pine trees > 35 cm DBH are present |
| 4. Canopy: Fire-Tolerant Hardwood Basal Area | ≤4.6 m2/ha BA of fire-tolerant hardwood trees | >4.6 to 6.9 m2/ha BA of fire-tolerant hardwood trees | >6.9 to 9.2 m2/ha BA of fire-tolerant hardwood trees | >9.2 m2/ha BA of fire- tolerant hardwood trees |
| 5. Canopy: Fire-Intolerant Tree Basal Area | ≤2.3 m2/ha BA of fire-intolerant trees | >2.3 to 4.6 m2/ha BA of fire-intolerant trees | >4.6 to 6.9 m2/ha BA of fire-intolerant trees | >6.9 m2/ha BA of fire-intolerant trees |
| 6. Stand Density Index (applies to shortleaf pine) (optional) | SDI = 65–135 (14%–30% of maximum SDI of 450) | SDI = 45–65 or 135–180 (10%–14% or 30%–40% of maximum SDI of 450) | SDI = 20–45 or 180–225 (4%–10% or 40%–50% of maximum SDI of 450) | SDI < 20 or >225 (<4% or >50%, 270 is 60% of maximum SD of 450) |
| Midstory/Shrub Metrics | ||||
| Excellent | Good | Fair | Poor | |
| 1. Midstory: Fire-Tolerant Hardwood Cover | 2% to <10% cover of midstory fire-tolerant hardwoods | 10%–30%, or <2% cover of midstory fire- tolerant hardwoods | >30% to 40% cover of midstory fire-tolerant hardwoods | >40% cover of midstory fire-tolerant hardwoods |
| 2. Midstory: Fire-Intolerant Tree Cover | <5% cover of fire-intolerant tree midstory | 5%–10% cover of fire-intolerant tree midstory | >10% to 20% cover of fire-intolerant tree midstory | >20% cover of fire-intolerant tree midstory |
| 3. Tall Shrub (3–10 ft tall) Cover | Tall shrubs average < 5% cover. | Tall shrubs average 5%–10% cover. | Tall shrubs average > 10% to 25% cover. | Tall shrubs average > 25% cover. |
| 4. Short Shrub (< 3 ft tall) Cover | Short shrubs average < 20% cover | Short shrubs average 20%–25% cover | Short shrubs average > 25% to 40% cover | Short shrubs average > 40% cover |
| Ground Layer Metrics | ||||
| Excellent | Good | Fair | Poor | |
| 1. Overall Native Herbaceous Ground Cover | >45% to 80% herbaceous cover | 30%–45% or >80% herbaceous cover | 15% to <30% herbaceous cover | <15% herbaceous cover |
| 2. Native Graminoid Cover | >25% to 85% cover of all native graminoids | 20% to 25% or >85% cover of native graminoids | 10% to <20% cover of all native graminoids | <10% cover of all native graminoids |
| 3. Floristic Quality Index, Mean C (Optional) | Mean C > 4.00 | Mean C is 3.01 to 4.00 | Mean C is 2.01 to 3.00 | Mean C < 2.00 |
| 4. Invasive Plant Presence/Distribution | Invasive non-native plant species absent | Invasive non-native plant species present in any stratum but sporadic (<1% cover) | Invasive non-native plant species uncommon in any stratum (1%–5% cover) | Invasive non-native plant species common in any stratum (>5% cover) |
| Soil Metric | ||||
| 1. Forest Soil Disturbance | Soil Disturbance Class 0 | Soil Disturbance Class 1 | Soil Disturbance Class 2 | Soil Disturbance Class 3 |
| B. Montane Longleaf Pine–Shortleaf Pine Woodlands | ||||
|---|---|---|---|---|
| Canopy Metrics | ||||
| Excellent | Good | Fair | Poor | |
| 1. Canopy: Southern Yellow Pine Basal Area | >8.0 to 17.2 m2/ha basal area of longleaf and/or shortleaf pine | 6.9 to 8.0 or >17.2 to 20.7 m2/ha basal area of longleaf and/or shortleaf pine | 2.3 to <6.9 or >20.7 to 25.3 m2/ha basal area of longleaf and/or shortleaf pine | <2.3 or >25.3 m2/ha basal area of longleaf and/or shortleaf pine |
| 2. Southern Yellow Pine Canopy Cover | >25% to 70% canopy cover of longleaf and/or shortleaf pine | 20%–25% or >70% to 80% canopy cover of longleaf and/or shortleaf pine | 10% to <20% or >80% to 90% canopy cover of longleaf and/or shortleaf pine | <10% or >90% canopy cover of longleaf and/or shortleaf pine |
| 3. Southern Yellow Pine Stand Size Structure | Basal area ≥ 4.6 m2/ha of longleaf pine and/or shortleaf pine trees > 35 cm DBH class or flat-top longleaf pine is present | BA ≥ 2.3–4.6 m2/ha of longleaf and/or shortleaf pine trees > 35 cm DBH class. No flat-top longleaf pine is present. | Longleaf and/or shortleaf pine trees > 35 cm DBH class are present, but at <2.3 m2/ha BA. No flat-top longleaf pine is present. | No longleaf and/or shortleaf pine trees > 35 cm DBH, nor is flat-top longleaf pine present |
| 4. Canopy: Fire-Tolerant Hardwood Basal Area | ≤4.6 m2/ha BA of fire- tolerant hardwood trees | >4.6 to 9.2 m2/ha BA of fire-tolerant hardwood trees | >9.2 to 11.5 m2/ha BA of fire-tolerant hardwood trees | >11.5 m2/ha BA of fire- tolerant hardwood trees |
| 5. Canopy Fire- Intolerant Tree Basal Area | ≤2.3 m2/ha BA of fire-intolerant trees | >2.3 to 4.6 m2/ha BA of fire-intolerant trees | >4.6 to 6.9 m2/ha BA of fire-intolerant trees | >6.9 m2/ha BA of fire-intolerant trees |
| 6. Stand Density Index (applies to longleaf pine) (optional) | SDI = 55–120 (14%–30% of maximum SDI of 400) | SDI = 40–55 or 120–160 (10%–14% or 30%–40% of maximum SDI of 400) | SDI = 15–40 or 160–200 (4%–10% or 40%–50% of maximum SDI) | SDI < 15 or >200 (<4% or >50%, 240 is 60% of maximum SD of 400) |
| Midstory/Shrub Metrics | ||||
| Excellent | Good | Fair | Poor | |
| 1. Midstory: Fire-Tolerant Hardwood Cover | 2% to <10% cover of midstory fire-tolerant hardwoods | 10%–30%, or <2% cover of midstory fire-tolerant hardwoods | >30% to 40% cover of midstory fire-tolerant hardwoods | >40% cover of midstory fire-tolerant hardwoods |
| 2. Midstory: Fire-Intolerant Tree Cover | <5% cover of fire-intolerant tree midstory | 5% to 10% cover of fire-intolerant tree midstory | >10% to 20% cover of fire-intolerant tree midstory | >20% cover of fire-intolerant tree midstory |
| 3. Tall Shrub (3–10 ft tall) Cover | Tall shrubs average < 15% cover. | Tall shrubs average 15%–20% cover. | Tall shrubs average > 20% to 30% cover. | Tall shrubs average > 30% cover. |
| 4. Short Shrub (<3 ft tall) Cover | Short shrubs average < 20% cover | Short shrubs average 20%–25% cover | Short shrubs average > 25% to 40% cover | Short shrubs average > 40% cover |
| Ground Layer Metrics | ||||
| Excellent | Good | Fair | Poor | |
| 1. Overall Native Herbaceous Ground Cover | >45% to 80% herbaceous cover | 30%–45% or >80% herbaceous cover | 15% to <30% herbaceous cover | <15% herbaceous cover |
| 2. Native Graminoid Cover | >25% to 85% cover of all native graminoids | 20%–25% or >85% cover of all native graminoids | 10% to <20% cover of all native graminoids | <10% cover of all native graminoids |
| 3. Floristic Quality Index, Mean C (Optional) | Mean C > 4.00 | Mean C is 3.01 to 4.00 | Mean C is 2.01 to 3.00 | Mean C < 2.00 |
| 4. Invasive Plant Presence/Distribution | Invasive non-native plant species absent | Invasive nonnative plant species present in any stratum but sporadic (<1% cover) | Invasive nonnative plant species uncommon in any stratum (1%–5% cover) | Invasive nonnative plant species common in any stratum (>5% cover) |
| Soil Metric | ||||
| 1. Forest Soil Disturbance | Soil Disturbance Class 0 | Soil Disturbance Class 1 | Soil Disturbance Class 2 | Soil Disturbance Class 3 |
| C. Southern Appalachian Pine–Oak Woodlands | ||||
|---|---|---|---|---|
| Canopy Metrics | ||||
| Excellent | Good | Fair | Poor | |
| 1. Canopy: Southern Yellow Pine Basal Area | >8.0 to 17.2 m2/ha basal area of pitch pine, Table Mountain pine and/or shortleaf pine | 4.6 to 8.0 or >17.2 to 20.7 m2/ha basal area of pitch pine, Table Mountain pine and/or shortleaf pine | 2.3 to <4.6 or >20.7 to 25.3 m2/ha basal area of pitch pine, Table Mountain pine and/or shortleaf pine | <2.3 or >25.3 m2/ha basal area of pitch pine, Table Mountain pine and/or shortleaf pine |
| 2. Southern Yellow Pine Canopy Cover | >25% to 70% canopy cover of pitch pine, Table Mountain pine and/or shortleaf pine | 20%–25% or >70% to 80% canopy cover of pitch pine, Table Mountain pine and/or shortleaf pine | 10% to <20% or >80% to 90% canopy cover of pitch pine, Table Mountain pine and/or shortleaf pine | <10% or >90% canopy cover of pitch pine, Table Mountain pine and/or shortleaf pine |
| 3. Southern Yellow Pine Stand Size Structure | BA ≥ 4.6 m2/ha of pitch pine, Table Mountain pine and/or shortleaf pines > 30 cm DBH class | BA ≥ 2.3–4.6 m2/ha of pitch pine, Table Mountain pine and/or shortleaf pines > 30 cm DBH class | Pitch pine, Table Mountain pine and/or shortleaf pines > 30 cm DBH class are present, but at < 2.3 m2/ha BA | No pitch pine, Table Mountain pine or shortleaf pines > 30 cm DBH |
| 4. Canopy: Fire-Tolerant Hardwood Basal Area | <4.6 m2/ha BA of fire-tolerant hardwood trees | >4.6 to 6.9 m2/ha BA of fire-tolerant hardwood trees | >6.9 to 9.2 m2/ha BA of fire-tolerant hardwood trees | >9.2 m2/ha BA of fire-tolerant hardwood trees |
| 5. Canopy: Fire-Intolerant Tree Basal Area | ≤2.3 m2/ha BA of fire-intolerant trees | >2.3 to 4.6 m2/ha BA of fire-intolerant trees | >4.6 to 6.9 m2/ha BA of fire-intolerant trees | >6.9 m2/ha BA of fire-intolerant trees |
| Midstory/Shrub Metrics | ||||
| Excellent | Good | Fair | Poor | |
| 1. Midstory: Fire-Tolerant Hardwood Cover | 2% to <10% cover of midstory fire-tolerant hardwoods | 10%–30%, or <2% cover of midstory fire-tolerant hardwoods | >30% to 40% cover of midstory fire-tolerant hardwoods | >40% cover of midstory fire-tolerant hardwoods |
| 2. Midstory: Fire-Intolerant Tree Cover | <10% cover of fire-intolerant tree midstory | 10% to 20% cover of fire-intolerant tree midstory | >20% to 30% cover of fire-intolerant tree midstory | >30% cover of fire-intolerant tree midstory |
| 3. Tall Shrub (3–10 ft tall) Cover | Tall shrubs average < 15% cover. | Tall shrubs average 15%–20% cover. | Tall shrubs average > 20% to 30% cover. | Tall shrubs average > 30% cover. |
| 4. Short Shrub (<3 ft tall) Cover | Short shrubs average < 50% cover | Short shrubs average 50%–70% cover | Short shrubs average > 70% to 80% cover | Short shrubs average > 80% cover |
| Ground Layer Metrics | ||||
| Excellent | Good | Fair | Poor | |
| 1. Overall Native Herbaceous Ground Cover | >15% herbaceous cover | 5 to 15% herbaceous cover | <5% herbaceous cover | Herbaceous cover absent |
| 2. Native Graminoid Cover | >10% cover of all native graminoids | 5% to 10% cover of all native graminoids | Native graminoids present, but with < 5% cover | Native graminoids absent |
| 3. Floristic Quality Index, Mean C (Optional) | Mean C > 4.00 | Mean C is 3.01 to 4.00 | Mean C is 2.01 to 3.00 | Mean C < 2.00 |
| 4. Invasive Plant Presence/Distribution | Invasive non-native plant species absent | Invasive non-native plant species present in any stratum but sporadic (<1% cover) | Invasive non-native plant species uncommon in any stratum (1%–5% cover) | Invasive non-native plant species common in any stratum (>5% cover) |
| Soil Metric | ||||
| 1. Forest Soil Disturbance | Soil Disturbance Class 0 | Soil Disturbance Class 1 | Soil Disturbance Class 2 | Soil Disturbance Class 3 |
| D. West Gulf Coastal Plain Shortleaf Pine–Oak Woodlands (Dry and Mesic Hilly Pine Woodlands) | ||||
|---|---|---|---|---|
| Canopy Metrics | ||||
| Excellent | Good | Fair | Poor | |
| 1. Canopy: Southern Yellow Pine Basal Area | 6.9–19.5 m2/ha basal area of shortleaf, loblolly, and/or longleaf pine | 4.6 to <6.9 or >19.5 to 23.0 m2/ha basal area of shortleaf, loblolly, and/or longleaf pine | 2.3 to <4.6 or >23.0 to 26.4 m2/ha basal area of shortleaf, loblolly, and/or longleaf pine | <2.3 or >26.4 m2/ha basal area of shortleaf, loblolly, and/or longleaf pine |
| 2. Southern Yellow Pine Canopy Cover | >25% to 75% canopy cover of shortleaf, loblolly, and/or longleaf pine | >15% to 25% canopy cover or >75% to 85% canopy cover of shortleaf, loblolly, and/or longleaf pine | 10%–15% canopy cover or >85 to 95% canopy cover of shortleaf, loblolly, and/or longleaf pine | <10% cover or >95% cover of shortleaf, loblolly, and/or longleaf pine |
| 3. Southern Yellow Pine Stand Size Structure | BA ≥ 4.6 m2/ha of shortleaf, loblolly, and/or longleaf pine trees > 35 cm DBH class | BA ≥ 2.3–4.6 m2/ha of shortleaf, loblolly, and/or longleaf pine trees > 35 cm DBH class | Shortleaf, loblolly, and/or longleaf pine trees > 35 cm DBH class are present, but < 2.3 m2/ha basal area of those large trees | No shortleaf, longleaf, or loblolly pine trees > 35 cm DBH are present |
| 4. Canopy: Fire-Tolerant Hardwood Basal Area | <4.6 m2/ha BA of fire-tolerant hardwood trees | >4.6 to 6.9 m2/ha BA of fire-tolerant hardwood trees | >6.9 to 9.2 m2/ha BA of fire-tolerant hardwood trees | >9.2 m2/ha BA of fire-tolerant hardwood trees |
| 5. Canopy: Fire- Intolerant Tree Basal Area | ≤2.3 m2/ha BA of fire-intolerant trees | >2.3 to 4.6 m2/ha BA of fire-intolerant trees | >4.6 to 6.9 m2/ha BA of fire-intolerant trees | >6.9 m2/ha BA of fire-intolerant trees |
| 6. Stand Density Index (applies to shortleaf and loblolly pine) (optional) | SDI = 55–155 (12%–34% of maximum SDI of 450) | SDI = 35–55 or 155–205 (8%–12% or 34%–45% of maximum SDI of 450) | SDI = 20–35 or 205–225 (4%–8% or 45%–50% of maximum SDI of 450) | SDI < 20 or >225 (<4% or >50%, 270 is 60% of maximum SD of 450) |
| Midstory/Shrub Metrics | ||||
| Excellent | Good | Fair | Poor | |
| 1. Midstory: Fire-Tolerant Hardwood Cover | 2% to <10% cover of midstory fire-tolerant hardwoods | 10%–20%, or <2% cover of midstory fire- tolerant hardwoods | >20% to 35% cover of midstory fire-tolerant hardwoods | >35% cover of midstory fire-tolerant hardwoods |
| 2. Midstory: Fire- Intolerant Tree Cover | <10% cover of fire-intolerant tree midstory | 10% to 20% cover of fire-intolerant tree midstory | >20% to 30% cover of fire-intolerant tree midstory | >30% cover of fire-intolerant tree midstory |
| 3. Tall Shrub (3–10 ft tall) Cover | Tall shrubs average < 15% cover. | Tall shrubs average 15% to 20% cover. | Tall shrubs average > 20% to 30% cover. | Tall shrubs average > 30% cover. |
| 4. Short Shrub (<3 ft tall) Cover | Short shrubs average < 20% cover | Short shrubs average 20%–30% cover | Short shrubs average > 30% to 45% cover | Short shrubs average > 45% cover |
| Ground Layer Metrics | ||||
| Excellent | Good | Fair | Poor | |
| 1. Overall Native Herbaceous Ground Cover | 35%–80% herbaceous cover | 20% to <35% or >80% herbaceous cover | 10% to <20% herbaceous cover | <10% herbaceous cover |
| 2. Native Graminoid Cover | 25%–100% cover of all native graminoids | >15% to <25% cover of all native graminoids | 10%–15% cover of all native graminoids | <10% cover of all native graminoids |
| 3. Floristic Quality Index, Mean C (Optional) | Mean C > 4.00 | Mean C is 3.01 to 4.00 | Mean C is 2.01 to 3.00 | Mean C < 2.00 |
| 4. Invasive Plant Presence/Distribution | Invasive nonnative plant species absent | Invasive nonnative plant species in any stratum present but sporadic (<1% cover) | Invasive nonnative plant species uncommon in any stratum (1%–5% cover) | Invasive nonnative plant species common in any stratum (>5% cover) |
| Soil Metric | ||||
| 1. Forest Soil Disturbance | Soil Disturbance Class 0 | Soil Disturbance Class 1 | Soil Disturbance Class 2 | Soil Disturbance Class 3 |
| E. Southeastern Coastal Plain and Piedmont Shortleaf Pine–Oak Woodlands (Dry and Mesic Hilly Pine Woodlands) | ||||
|---|---|---|---|---|
| Canopy Metrics | ||||
| Excellent | Good | Fair | Poor | |
| 1. Canopy: Southern Yellow Pine Basal Area | 6.9–19.5 m2/ha basal area of shortleaf and/or longleaf pine | 4.6 to <6.9 or >19.5 to 23.0 m2/ha basal area of shortleaf and/or longleaf pine | 2.3 to <4.6 or >23.0 to 26.4 m2/ha basal area of shortleaf and/or longleaf pine | <2.3 or >26.4 m2/ha basal area of shortleaf and/or longleaf pine |
| 2. Southern Yellow Pine Canopy Cover | >25% to 75% canopy cover of shortleaf and/or longleaf pine | >15% to 25% canopy cover or >75% to 85% canopy cover of shortleaf and/or longleaf pine | 10%–15% canopy cover or > 85% to 95% canopy cover of shortleaf and/or longleaf pine | <10% cover or >95% cover of shortleaf and/or longleaf pine |
| 3. Southern Yellow Pine Stand Size Structure | BA ≥ 4.6 m2/ha of shortleaf and/or longleaf pine trees > 35 cm DBH class | BA ≥ 2.3–4.6 m2/ha of shortleaf and/or longleaf pine trees > 35 cm DBH class | Shortleaf and/or longleaf pine trees > 35 cm DBH class are present, but < 2.3 m2/ha basal area of those large trees | No shortleaf or longleaf pine trees > 35 cm DBH are present |
| 4. Canopy: Fire-Tolerant Hardwood Basal Area | <4.6 m2/ha BA of fire-tolerant hardwood trees | >4.6 to 6.9 m2/ha BA of fire-tolerant hardwood trees | >6.9 to 9.2 m2/ha BA of fire-tolerant hardwood trees | >9.2 m2/ha BA of fire-tolerant hardwood trees |
| 5. Canopy: Fire- Intolerant Tree Basal Area | ≤2.3 m2/ha BA of fire-intolerant trees | >2.3 to 4.6 m2/ha BA of fire-intolerant trees | >4.6 to 6.9 m2/ha BA of fire-intolerant trees | >6.9 m2/ha BA of fire-intolerant trees |
| 6. Stand Density Index (applies to shortleaf pine) (optional) | SDI = 55–155 (12–34% of maximum SDI of 450) | SDI = 35–55 or 155–205 (8%–12% or 34%–45% of maximum SDI of 450) | SDI = 20–35 or 205–225 (4%–8% or 45%–50% of maximum SDI of 450) | SDI < 20 or >225 (< 4% or >50%, 270 is 60% of maximum SD of 450) |
| Midstory/Shrub Metrics | ||||
| Excellent | Good | Fair | Poor | |
| 1. Midstory: Fire-Tolerant Hardwood Cover | 2% to <10% cover of midstory fire- tolerant hardwoods | 10%–20%, or <2% cover of midstory fire- tolerant hardwoods | >20% to 35% cover of midstory fire-tolerant hardwoods | >35% cover of midstory fire-tolerant hardwoods |
| 2. Midstory: Fire- Intolerant Tree Cover | <10% cover of fire-intolerant tree midstory | 10% to 20% cover of fire-intolerant tree midstory | >20% to 30% cover of fire-intolerant tree midstory | >30% cover of fire-intolerant tree midstory |
| 3. Tall Shrub (3–10 ft tall) Cover | Tall shrubs average < 15% cover. | Tall shrubs average 15% to 20% cover. | Tall shrubs average > 20% to 30% cover. | Tall shrubs average > 30% cover. |
| 4. Short Shrub (<3 ft tall) Cover | Short shrubs average < 20% cover | Short shrubs average 20%–30% cover | Short shrubs average > 30% to 45% cover | Short shrubs average > 45% cover |
| Ground Layer Metrics | ||||
| Excellent | Good | Fair | Poor | |
| 1. Overall Native Herbaceous Ground Cover | 35%–80% herbaceous cover | 20% to <35% or >80% herbaceous cover | 10% to <20% herbaceous cover | <10% herbaceous cover |
| 2. Native Graminoid Cover | 25%–100% cover of all native graminoids | >15% to <25% cover of all native graminoids | 10%–15% cover of all native graminoids | < 10% cover of all native graminoids |
| 3. Floristic Quality Index, Mean C (Optional) | Mean C > 4.00 | Mean C is 3.01 to 4.00 | Mean C is 2.01 to 3.00 | Mean C < 2.00 |
| 4. Invasive Plant Presence/Distribution | Invasive nonnative plant species absent | Invasive nonnative plant species in any stratum present but sporadic (<1% cover) | Invasive nonnative plant species uncommon in any stratum (1%–5% cover) | Invasive nonnative plant species common in any stratum (>5% cover) |
| Soil Metric | ||||
| 1. Forest Soil Disturbance | Soil Disturbance Class 0 | Soil Disturbance Class 1 | Soil Disturbance Class 2 | Soil Disturbance Class 3 |
References
- USDA, NRCS. The PLANTS Database; National Plant Data Team: Greensboro, NC USA. Available online: https://plants.usda.gov (accessed on 9 September 2021).
- America’s Longleaf. Range-wide Conservation Plan for Longleaf Pine. Regional Working Group for America’s Longleaf. 2009. Available online: https://www.americaslongleaf.org/resources/conservation-plan/ (accessed on 24 March 2016).
- Noss, R.F.; Platt, W.J.; Sorrie, B.A.; Weakley, A.S.; Means, D.B.; Costanza, J.; Peet, R.K. How global biodiversity hotspots may go unrecognized: Lessons from the North American Coastal Plain. Divers. Distrib. 2015, 21, 236–244. [Google Scholar] [CrossRef]
- Oswalt, C.M. Spatial and temporal trends of the shortleaf pine resource in the eastern United States. In Proceedings of the Shortleaf Pine Conference: East Meets West; Kush, J., Barlow, R.J., Gilbert, J.C., Eds.; Special Report No. 11; Alabama Agricultural Experiment Station: Auburn, AL, USA, 2012; pp. 33–37. [Google Scholar]
- Guldin, J.M. Restoration of native fire-adapted southern pine-dominated forest ecosystems: Diversifying the tools in the silvicultural toolbox. For. Sci. 2019, 65, 508–518. [Google Scholar] [CrossRef] [Green Version]
- Platt, W.J. Southeastern Pine Savannas. In Savannas, Barrens, and Rock Outcrop Plant Communities of North America; Anderson, R.C., Fralish, J.S., Basin, J.M., Eds.; Cambridge University Press: New York, NY, USA, 1999; pp. 23–51. [Google Scholar]
- Peet, R.K.; Platt, W.J.; Costanza, J.K. Fire-maintained pine savannas and woodlands of the Southeastern United States coastal plain. In Ecology and Recovery of Eastern Old-Growth Forests; Barton, A.M., Keeton, W.S., Eds.; Island Press: Washington, DC, USA, 2018; pp. 39–62. [Google Scholar]
- Nordman, C.; White, R.; Wilson, R.; Ware, C.; Rideout, C.; Pyne, M.; Hunter, C. Rapid Assessment Metrics to Enhance Wildlife Habitat and Biodiversity within Southern Open Pine Ecosystems, Version 1.0; U.S. Fish and Wildlife Service: Washington, DC, USA; NatureServe: Arlington, VA, USA, 2016.
- Nature Serve. Southern Open Pine Rapid Assessment Metrics, Version 2.0. Appendix C. Full Descriptions of All Metrics; NatureServe for the South Atlantic Landscape Conservation Cooperative; NatureServe: Arlington, VA, USA, 2018. [Google Scholar]
- Nordman, C.; Pyne, M.; White, R. Rapid Assessment Metrics for Longleaf Pine Ecosystems on the Francis Marion National Forest; NatureServe with support from the U.S. Forest Service; National Forests in South Carolina; NatureServe: Arlington, VA, USA, 2017. [Google Scholar]
- Brown, K.Z. The LEO project: Making strides in range-wide mapping effort. Longleaf Lead. 2020, 13, 28–29. [Google Scholar]
- FNAI [Florida Natural Areas Inventory]. Southeast Longleaf Pine Ecosystem Occurrences Geodatabase. FNAI Final Report, April 2018–February 2020; Florida Natural Areas Inventory; Florida State University: Tallahassee, FL, USA, 2020. [Google Scholar]
- Anderson, M.; Hayes, L.; Keyser, P.D.; Lituma, C.; Sutter, R.D.; Zollner, D. Shortleaf Pine Restoration Plan: Restoring an American Forest Legacy; The Shortleaf Pine Initiative: Knoxville, TN, USA, 2016; 57p, Available online: http://shortleafpine.net/shortleaf-pine-initiative/shortleaf-pine-restoration-plan (accessed on 11 August 2021).
- Lindenmayer, D.; Messier, C.; Sato, C. Avoiding ecosystem collapse in managed forest ecosystems. Front. Ecol. Environ. 2016, 14, 561–568. [Google Scholar] [CrossRef] [Green Version]
- Bland, L.M.; Rowland, J.A.; Regan, T.J.; Keith, D.A.; Murray, N.J.; Lester, R.E.; Linn, M.; Rodriguez, J.P.; Nicholson, E. Developing a standardized definition of ecosystem collapse for risk assessment. Front. Ecol. Environ. 2018, 16, 29–36. [Google Scholar] [CrossRef]
- Andreasen, J.K.; O’Neill, R.V.; Noss, R.; Slosser, N.C. Considerations for the development of a terrestrial index of ecological integrity. Ecol. Indic. 2001, 1, 21–35. [Google Scholar] [CrossRef]
- Tierney, G.L.; Faber-Langendoen, D.; Mitchell, B.R.; Shriver, W.G.; Gibbs, J.P. Monitoring and Evaluating the Ecological Integrity of Forest Ecosystems. Front. Ecol. Environ. 2009, 7, 308–316. [Google Scholar] [CrossRef]
- Mitchell, B.R.; Tierney, G.L.; Schweiger, E.W.; Miller, K.M.; Faber-Langendoen, D.; Grace, J.B. Getting the message across: Using ecological integrity to communicate with resource managers. Chapter 10. In Application of Threshold Concepts in Natural Resource Decision Making; Guntenspergen, G.R., Ed.; Springer: Berlin/Heidelberg, Germany, 2014; pp. 199–230. [Google Scholar]
- Faber-Langendoen, D.; Nichols, W.; Rocchio, J.; Walz, K.; Lemly, J.; Smyth, R.; Snow, K. Rating the condition of reference wetlands across states: NatureServe’s Ecological Integrity Assessment method. Natl. Wetl. Newsl. 2016, 38, 12–16. [Google Scholar]
- Wurtzebach, Z.; Schultz, C. Measuring Ecological Integrity: History, Practical Applications, and Research Opportunities. BioScience 2016, 66, 446–457. [Google Scholar] [CrossRef] [Green Version]
- Unnasch, R.S.; Braun, D.P.; Comer, P.J.; Eckert, G.E. The Ecological Integrity Assessment Framework: A Framework for Assessing the Ecological Integrity of Biological and Ecological Resources of the National Park System; National Park Service: Fort Collins, CO, USA, 2018.
- Faber-Langendoen, D.; Lemly, J.; Nichols, W.; Rocchio, J.; Walz, K.; Smyth, R. Development and evaluation of NatureServe’s multi-metric Ecological Integrity Assessment method for wetland ecosystems. Ecol. Indic. 2019, 104, 764–775. [Google Scholar] [CrossRef]
- NatureServe. Element Occurrence Data Standard; NatureServe: Arlington, VA, USA, 2002. [Google Scholar]
- Parrish, J.D.; Braun, D.P.; Unnasch, R.S. Are we conserving what we say we are? Measuring ecological integrity within protected areas. BioScience 2003, 53, 851–860. [Google Scholar] [CrossRef] [Green Version]
- NatureServe. International Vegetation Classification: Terrestrial Vegetation; NatureServe Central Databases, NatureServe: Arlington, VA, USA, 2020. [Google Scholar]
- Noon, B.R. Conceptual issues in monitoring ecological systems. In Monitoring ecosystems: Interdisciplinary Approaches for Evaluating Ecoregional Initiatives; Busch, D.E., Trexler, J.C., Eds.; Island Press: Washington, DC, USA, 2003; pp. 27–71. [Google Scholar]
- Carter, S.K.; Carr, N.B.; Flather, C.H.; Fleishman, E.; Leu, M.; Noon, B.R.; Wood, D.J. Assessing ecological integrity using multiscale information from Bureau of Land Management Assessment and Monitoring Programs [Chapter 4]. In Multiscale Guidance and Tools for Implementing a Landscape Approach to Resource Management in the Bureau of Land Management. Open-File Report 2016-1207; Carter, S.K., Carr, N.B., Miller, K.H., Wood, D.J.A., Eds.; US Geological Survey: Reston, VA, USA, 2016; pp. 39–53. [Google Scholar]
- Lawson, E.R. Pinus echinata Mill., shortleaf pine. In Silvics of North America, vol. 1, Conifers. USDA Agricultural Handbook 654; Burns, R.M., Honkala, B.H., Eds.; U.S. Department of Agriculture, Forest Service: Washington, DC, USA, 1990. [Google Scholar]
- Moser, W.K.; Hansen, M.; McWilliams, W.H.; Birch, T.W. Shortleaf pine composition and structure in the United States. In Shortleaf Pine Restoration and Ecology in the Ozarks, Proceedings of a Symposium; Springfield, MO, USA, 7–9 November 2006; Kabrick, J.M., Dey, D.C., Gwaze, D., Eds.; NRS-P-15; U.S. Department of Agriculture, Forest Service, Northern Research Station: Newtown Square, PA, USA, 2007; pp. 19–27. [Google Scholar]
- FGDC (Federal Geographic Data Committee). National Vegetation Classification Standard, Version 2 FGDC-STD-005-2008 (Version 2); Vegetation Subcommittee, Federal Geographic Data Committee, FGDC Secretariat, U.S. Geological Survey: Reston, VA, USA, 2008.
- Faber-Langendoen, D.; Keeler-Wolf, T.; Meidinger, D.; Tart, D.; Hoagland, B.; Josse, C.; Navarro, G.; Ponomarenko, S.; Saucier, J.; Weakley, A. A new approach to vegetation description and classification. Ecol. Monogr. 2014, 84, 533–561. [Google Scholar] [CrossRef]
- McKerrow, A.; Davidson, A.; Rubino, M.; Faber-Langendoen, D.; Dockter, D. Quantifying the Representation of Plant Communities in the Protected Areas of the U.S.: An Analysis Based on the U.S. National Vegetation Classification Groups. Forests 2021, 12, 864. [Google Scholar] [CrossRef]
- Guyette, R.P.; Stambaugh, M.C.; Dey, D.C.; Muzika, R.M. Predicting fire frequency with chemistry and climate. Ecosystems 2012, 15, 322–335. [Google Scholar] [CrossRef] [Green Version]
- King, C.B.; Muzika, R.M. Historic fire and canopy disturbance dynamics in an oak-pine (Quercus-Pinus) forest of the Missouri Ozarks (1624-2010). Castanea 2014, 79, 78–87. [Google Scholar] [CrossRef]
- Guyette, R.P.; Muzika, R.M.; Voelker, S.L. The historical ecology of fire, climate, and the decline of shortleaf pine in the Ozarks. In Shortleaf Pine Restoration and Ecology in the Ozarks, Proceedings of a Symposium; Springfield, MO, USA, 7–9 November 2006; Kabrick, J.M., Dey, D.C., Gwaze, D., Eds.; Gen. Tech. Rep. NRS-P-15; U.S. Department of Agriculture, Forest Service, Northern Research Station: Newtown Square, PA, USA, 2007; pp. 8–18. [Google Scholar]
- Coleman, T.W.; Meeker, J.R.; Clarke, S.R.; Rieske, L.K. The suppression of Dendroctonus frontalis and subsequent wildfire have an impact on forest stand dynamics. Appl. Veg. Sci. 2008, 11, 231–242. [Google Scholar] [CrossRef]
- Clewell, A.F. Prior prevalence of Shortleaf Pine-Oak-Hickory Woodlands in the Tallahassee Red Hills. Castanea 2013, 78, 266–276. [Google Scholar] [CrossRef]
- Gnehm, P.C.; Hadley, B. The effects of a wildfire on pine seedling recruitment. In Shortleaf Pine Restoration and Ecology in the Ozarks, Proceedings of a Symposium; Springfield, MO, USA, 7–9 November 2006; Kabrick, J.M., Dey, D.C., Gwaze, D., Eds.; NRS-P-15; U.S. Department of Agriculture, Forest Service, Northern Research Station: Newtown Square, PA, USA, 2007; pp. 134–136. [Google Scholar]
- Land, A.D.; Rieske, L.K. Interactions among prescribed fire, herbivore pressure and shortleaf pine (Pinus echinata) regeneration following southern pine beetle (Dendroctonus frontalis) mortality. For. Ecol. Manag. 2006, 235, 260–269. [Google Scholar] [CrossRef]
- Loudermilk, E.L.; Cropper, P., Jr.; Mitchell, R.J.; Lee, H. Longleaf pine (Pinus palustris) and hardwood dynamics in a fire-maintained ecosystem: A simulation approach. Ecol. Model. 2011, 222, 2733–2750. [Google Scholar] [CrossRef]
- Hanberry, B.B.; Bragg, D.C.; Hutchinson, T.F. A reconceptualization of open oak and pine ecosystems of eastern North America using a forest structure spectrum. Ecosphere 2018, 9, 10. [Google Scholar] [CrossRef] [Green Version]
- Nordman, C.; Faber-Langendoen, D.; Baggs, J. Full Descriptions of all Shortleaf Pine-Oak Woodland Metrics. NatureServe and the USDA Forest Service. 2021. Available online: https://www.natureserve.org/projects/developing-rapid-assessment-metrics-measuring-open-pine-ecosystem-health-southeastern-0 (accessed on 12 November 2021).
- Bennetts, R.E.; Gross, J.E.; Cahill, K.; McIntyre, C.; Bingham, B.B.; Hubbard, A.; Cameron, L.; Carter, S.L. Linking monitoring to management and planning: Assessment points as a generalized approach. Georg. Wright Forum 2007, 24, 59–77. [Google Scholar]
- Lutes, D.C.; Keane, R.E.; Caratti, J.F.; Key, C.H.; Benson, N.C.; Sutherland, S.; Gangi, L.J. FIREMON: The Fire Effects Monitoring and Inventory System. Gen. Tech. Rep. RMRS-GTR-164-CD; U.S. Department of Agriculture, Forest Service, Rocky Mountain Research Station: Fort Collins, CO, USA, 2006.
- Forest Service. Southern Region Prescribed Fire Effects Monitoring Guidebook; U.S. Department of Agriculture, Forest Service, Southern Region: Atlanta, GA, USA, 2011; Unpublished report; pp. 1–13.
- Jennings, M.D.; Faber-Langendoen, D.; Loucks, O.L.; Peet, R.K.; Roberts, D. Standards for associations and alliances of the U.S. National Vegetation Classification. Ecol. Monogr. 2009, 79, 173–199. [Google Scholar] [CrossRef]
- Longleaf Partnership Council. Longleaf Pine Maintenance Condition Class Definitions: A Guide to Assess Optimal Forest Habitat Conditions for Associated Plant and Wildlife Species; America’s Longleaf Restoration Initiative; Longleaf Partnership Council: Atlanta, GA, USA, 2014. [Google Scholar]
- Higgs, E. Nature by Design: People, Natural Process, and Ecological Restoration; MIT Press: Cambridge, MA, USA, 2003; 341p. [Google Scholar]
- Higgs, E.S.; Hobbs, R.J. Wild design: Principles to guide interventions in protected areas. In Beyond Naturalness: Rethinking Park and Wilderness Stewardship in an era of Rapid Change; Cole, D.N., Yung, L., Eds.; Island Press: Washington, DC, USA, 2010; pp. 234–251. [Google Scholar]
- Brooks, R.P.; Faber-Langendoen, D.; Serenbetz, G.; Rocchio, J.; Stein, E.D.; Walz, K. Toward creating a national Reference Wetlands Registry. Natl. Wetl. Newsl. 2016, 38, 7–11. [Google Scholar]
- Woodley, S. Ecological Integrity and Canada’s national parks. Georg. Wright Forum 2010, 27, 151–160. [Google Scholar]
- GCPO LCC Adaptation Science Management Team. Integrated Science Agenda, Draft v4; Gulf Coastal Plains & Ozarks Landscape Conservation Cooperative: Starkville, MS, USA, 2013; Available online: https://lccnetwork.org/resource/gcpo-lcc-draft-integrated-science-agenda (accessed on 7 January 2016).
- Noss, R.; Cartwright, J.; Estes, D.; Witsell, T.; Elliott, G.; Adams, D.; Albrecht, M.; Boyles, R.; Comer, P.; Doffitt, C.; et al. Improving Species Status Assessments under the U.S. Endangered Species Act, with Implications for Multispecies Conservation Challenges Worldwide. Conserv. Biol. 2021, 35, 1715–1724. [Google Scholar] [CrossRef] [PubMed]
- FNAI [Florida Natural Areas Inventory]; FFS [Florida Forest Service]. Longleaf Pine Ecosystem Geodatabase v.1 Final Report; A cooperative project between Florida Natural Areas Inventory and the Florida Forest Service; Florida Natural Areas Inventory: Tallahassee, FL, USA, 2014. Available online: https://www.fnai.org/LongleafGDB.cfm (accessed on 28 March 2016).


| Southern Open Pine Groups | USNVC Group Name | USNVC Alliance Name |
|---|---|---|
| A. Interior Highlands Shortleaf Pine–Oak A.1 Interior Highlands Shortleaf Pine–Oak Forest and Woodlands | Interior Highlands Pine–Oak Forest and Woodland (G012a) | Ozark–Ouachita Shortleaf Pine–Oak Forest—Woodland (A2083) |
| A.2 Interior Highlands Shortleaf Pine–Bluestem Woodland | Ozark–Ouachita Shortleaf Pine–Bluestem Woodland (A2082) | |
| B. Montane Longleaf Pine–Shortleaf Pine Woodlands | Interior Highlands Pine–Oak Forest and Woodland (G012c) | Montane Longleaf Pine–Shortleaf Pine Woodland (A3272) |
| C. Southern Appalachian Pine–Oak Woodlands | Southern Appalachian Virginia Pine–Table Mountain Pine Woodland (G905) | Appalachian Table Mountain Pine–Pitch Pine–Chestnut Oak Woodland (A0677) |
| Appalachian Shortleaf Pine–Oak Woodland (A3269) | ||
| D. West Gulf Coastal Plain Pine–Oak Woodlands | Western Gulf Coastal Plain Pine–Oak Forest and Woodland (G013) | West Gulf Coastal Plain Scrub Oak–Shortleaf Pine Sandhill Woodland (A0386) |
| West Gulf Coastal Plain Shortleaf Pine–Post Oak Forest (A3129) | ||
| West Gulf Coastal Plain Loblolly Pine–White Oak Forest (A3130) | ||
| E. Southeast Coastal Plain and Piedmont Shortleaf Pine–Oak Woodlands | Interior Highlands Oak–Pine Forest and Woodland (G012b) | Upper Coastal Plain Shortleaf Pine–Oak Woodland (A3270) |
| Piedmont–Coastal Plain Oak–(Pine) Forest and Woodland (G165) | Piedmont Post Oak–Hickory–Pine Woodland (A3294) |
| Metric Rating | Southeast Coastal Plain and Piedmont Shortleaf Pine–Oak Woodlands | Southern Appalachian Pine–Oak Woodlands |
|---|---|---|
| EXCELLENT (A) | 2% to <10% cover of midstory fire-tolerant hardwoods | 2% to <10% cover of midstory fire-tolerant hardwoods |
| GOOD (B) | 10% to <20% cover of midstory fire-tolerant hardwoods | 10% to <30% cover of midstory fire-tolerant hardwoods |
| FAIR (C) | 20% to 35% cover of midstory fire-tolerant hardwoods | 30% to 40% cover of midstory fire-tolerant hardwoods |
| POOR (D) | >35% cover of midstory fire-tolerant hardwoods | >40% cover of midstory fire-tolerant hardwoods |
| Metric | Metric Definition | Metric Measures | # of Variants |
|---|---|---|---|
| CANOPY METRICS | Canopy trees, defined as any tree that has 5” diameter at breast height (DBH) or greater. | ||
| VCAN1. Canopy: Southern Yellow Pine Basal Area | Combined basal area in m2/ha of trees, 12.7 cm in DBH or greater, that are southern yellow pine species appropriate to the Southern Open Pine Group (broad ecosystems used in this document). | x m2/ha basal area of y pine | 2 |
| VCAN2. Southern Yellow Pine Canopy Cover | Percentage of the ground within the plot covered by the general extent of southern yellow pine canopy trees, as determined via a visual (ocular) estimate. Southern yellow pine canopy is defined as showing canopy trees primarily of shortleaf pine, or with mixed loblolly pine or (mountain) longleaf pine, with stems 12.7 cm in diameter or greater at 1.37 m, diameter at breast height (DBH). | x% canopy cover of y pine | 2 |
| VCAN3. Southern Yellow Pine Stand Size Structure | Southern yellow pine, especially shortleaf pine size structure, including the presence of large (greater than or equal to 35.6 cm DBH (30.5 cm for southern Appalachian pine–oak) southern yellow pines, characteristic of the assessed ecosystem. | Basal area ≥ x m2/ha of y pine trees ≥ z” DBH class | 3 |
| VCAN4. Canopy: Fire-Tolerant Hardwood Basal Area | Combined basal area (m2/ha) of all fire-tolerant canopy hardwood trees > 12.7 cm DBH. | x to y m2/ha BA of fire-tolerant hardwood trees | 4 |
| VCAN5. Canopy: Fire-Intolerant Tree Basal Area | Combined basal area (m2/ha of all fire-intolerant canopy hardwood and conifer trees > 12.7 cm DBH. | x to y m2/ha BA of fire-intolerant trees | 1 |
| VCAN6. Stand Density Index | An index of tree density that incorporates the size (quadratic mean diameter) and density (trees per acre) of trees in a stand. | SDI = x–y (x%–y% of maximum SDI of z) | 3 |
| MIDSTORY/SHRUB METRICS | Midstory is any fire-intolerant woody stem (including tall shrubs, trees, and woody vines) that is greater than 3.0 m tall, up to the height of the bottom of the tree canopy. Shrubs are woody stems < 3.0 m tall. | ||
| VMID1. Midstory: Fire-Tolerant Hardwood Cover | Percentage of the ground within the plot or assessment area covered by fire-tolerant hardwood tree midstory foliage, branches, and stems as determined by ocular (visual) estimate. | x% to y% cover of midstory fire-tolerant hardwoods | 3 |
| VMID2. Midstory: Fire-Intolerant Tree Cover | Percentage of the ground within the plot or assessment area covered by fire-intolerant hardwood and conifer tree midstory foliage, branches, and stems as determined by ocular (visual) estimate. | x% to y% cover of fire-intolerant hardwood midstory | 2 |
| VSHR1. Tall Shrub (0.9–3.0 m tall) Cover | An assessment of amount of cover of tall shrubs (0.9–3.0 m tall) and small broad-leaved trees less than 3.0 m tall. | Tall shrubs average x% to y% cover | 3 |
| VSHR2. Short Shrub (<0.9 m tall) Cover | An assessment of amount of cover of short shrubs (<0.9 m tall). | Short shrubs, average x%–y% cover | 3 |
| GROUND LAYER METRICS | Ground layer consisting of all herbaceous (non-woody) species. | ||
| VGRD1. Overall Native Herbaceous Ground Cover | Percentage cover of all (native) herbaceous species in the ground layer. | x% to y% herbaceous cover | 3 |
| VGRD2. Native Graminoid Cover | Percentage cover of all native graminoid cover in the ground layer. Native graminoids include grasses and grass-like plants (grasses, sedges, and rushes, including beaked rushes). | x% to y% cover of all native graminoids | 3 |
| VGRD3. Floristic Quality Index, Mean C (optional) | The Floristic Quality Index is based on the plant species that are present in an assessment area, and their coefficients of conservatism, or C-values. Each species has a C-value, which is an integer from 0 to 10 assigned by botanical experts. High C-values indicate a native plant’s fidelity to natural areas with natural processes. Low C-values indicate weedy plants that commonly occur in ruderal habitats, such as old fields or vacant lots. The integer 0 is typically reserved for exotics. | Mean C x to y | 1 |
| VGRD4. Invasive Plant Presence/Distribution | Percentage cover of all invasive species in all layers. | Invasive non-native plant species, x% to y% cover | 1 |
| SOIL METRICS | Measures of visible soil surface and profile disturbance | ||
| SDIS1. Forest Soil Disturbance | This metric describes surface conditions that affect site sustainability, hydrologic function, and site productivity, using standardized visual disturbance classes, with 0 showing no visual disturbance and 3 = severely disturbed. | Soil disturbance class = x | 1 |
| METRICS | Measures | Variant and Group Codes | Metric Rating | |||
|---|---|---|---|---|---|---|
| CANOPY METRICS | Excellent | Good | Fair | Poor | ||
| VCAN1. Canopy: Southern Yellow Pine Basal Area | x m2/ha basal area of y pine(s) | v1.IH-ML-AP | BA (8.0–17.2) | (6.9–8.0 or 17.2–20.7) | (2.3 to <6.9 or > 20.7 to 25.3) | (<2.3 or >25.3) |
| v2.WG-CP | BA (6.9–19.5) | (4.6 to <6.9 or >19.5–23.0) | (2.3 to <4.6 or >23.0 to 26.4) | (<2.3 or >26.4) | ||
| VCAN2. Southern Yellow Pine Canopy Cover | x% canopy cover of y pine(s) | v1.IH-ML-AP | >25%–70% | 20%–25% or >70%–80% | 10% to <20% or >80%–90% | <10% or >90% |
| v2.WG-CP | >25%–75% | >15%–25% or >75%–85% | 10%–15% or >85%–95% | <10% or >95% | ||
| VCAN3. Southern Yellow Pine Stand Size Structure | Basal area ≥ x m2/ha of y pine trees ≥ z cm DBH class | v1.IH-WG-CP DBH >35 cm | BA > (>4.6) | BA > (>2.3–4.6) | BA < (<2.3), but SP present | < SP absent |
| v2.ML DBH > 35 cm | As above but with flat-top longleaf | As above, but with no flat-top longleaf present | but no flat-top longleaf present | but no flat-top longleaf present | ||
| v3.AP DBH > 30 cm | BA > (>4.6) | BA > (>2.3–4.6) | BA < (<2.3), but SP present | < SP absent | ||
| VCAN4. Canopy: Fire-Tolerant Hardwood Basal Area | X to y m2/ha BA of fire-tolerant hardwood trees | v1.IH1 | BA < (<11.5) | BA > (>11.5–13.8) | BA > (13.8–16.1) | BA > (>16.1) |
| v2.IH2-AP-WG-CP | BA < (4.6) | BA > (4.6 to 6.9) | BA > (6.9 to 9.2) | BA > (9.2) | ||
| v3.ML | BA < (4.6) | BA > (4.6 to 9.2) | BA > (9.2 to 11.5) | BA > (11.5) | ||
| VCAN5. Canopy: Fire-Intolerant Tree Basal Area | X to y m2/ha BA of fire-intolerant trees | v1, All | BA < (2.3) | BA > (2.3 to 4.6) | BA > (4.6 to 6.9) | BA > (6.9) |
| VCAN6. Stand Density Index (not applied to AP) (optional) | SDI = x–y (x–y% of maximum SDI of z) | v1.IH | SDI = 65–135 | 45–65 or 135–180 | 20–45 or 180–225 | <20 or >225 |
| v2.ML | SDI = 55–120 | 40–55 or 120–160 | 15–40 or 160–200 | <15 or >200 | ||
| v3.WG-CP | SDI = 55–155 | 35–55 or 155–205 | 20–35 or 205–225 | <20 or >225 | ||
| MIDSTORY/SHRUB METRICS | Excellent | Good | Fair | Poor | ||
| VMID1. Midstory: Fire-Tolerant Hardwood Cover | x% to y% cover of midstory fire-tolerant hardwoods | v1.IH1 | 2% to <20% | 20% to 40% | 40% to 50%, or <2% | >50% |
| v2.IH2-ML-AP | 2% to <10% | 10%–30% or <2% | >30% to 40% | >40% | ||
| v3.WG-CP | 2% to <10% | 10%–20% or <2% | >20% to 35% | >35% | ||
| VMID2. Midstory: Fire-Intolerant Hardwood Cover | x% to y% cover of fire-intolerant hardwood midstory | v1.IH1-AP-WG-CP | <10% | 10%–20% | >20%–30% | >30% |
| v2.IH2-ML | <5% | 5%–10% | >10%–20% | >20% | ||
| VSHR1. Tall Shrub (3–10 ft tall) Cover | Tall shrubs average x% to y% cover. | v1.IH1 | <30% | 30%–40% | >40%–50% | >50% |
| v2.IH2 | <5% | 5%–10% | >10%–25% | >25% | ||
| v3. ML-AP-WG-CP | <15% | 15%–20% | >20%–30% | >30% | ||
| VSHR2. Short Shrub (< 3 ft tall) Cover | Short shrubs average x% to y% cover | v1.IH1-WG-CP | <20% | 20%–30% | >30%–45% | >45% |
| v2.IH2-ML | <20% | 20%–25% | >25%–40% | >40% | ||
| v3.AP | <50% | 50%–70% | >70%–80% | >80% | ||
| GROUND LAYER METRICS | Excellent | Good | Fair | Poor | ||
| VGRD1. Overall Native Herbaceous Ground Cover | x% to y% herbaceous cover | V1.IH1-WG-CP | 35%–80% | 20% to <35% or > 80% | 10% to <20% | <10% |
| v2.IH2-ML | >45%–80% | 30%–45% or >80% | 15% to <30% | <15% | ||
| v3.AP | >15% | 5%–15% | <5% | 0% | ||
| VGRD2. Native Graminoid Cover | x% to y% cover of all native graminoids | v1.IH-ML | >25%–85% | 20%–25% or >85% | 10% to <20% | <10% |
| v2.AP | >10% | 5%–10% | <5% | 0% | ||
| v3.WG-CP | 25%–100% | >15% to <25% | 10% to <15% | <10% | ||
| VGRD3. Floristic Quality Index, Mean C (optional) | Mean C x to y | v1, All | Mean C > 4.00 | 3.01 to 4.00 | 2.01 to 3.00 | <2.00 |
| VGRD4. Invasive Plant Presence/ Distribution | Invasive non-native plant species x% to y% cover | v1, All | Absent | Present < 1% | 1% to 5% | >5% |
| SOIL METRIC | Excellent | Good | Fair | Poor | ||
| SDIS1. Forest Soil Disturbance | Soil disturbance class = x | v1, All | Soil Disturbance Class 0 | 1 | 2 | 3 |
| Baseline (n = 5) | Prescribed Fire History (n = 6) | ||
|---|---|---|---|
| CANOPY AND MIDSTORY METRICS | No Fire | 4–7 Years after First Fire | 10–14 Years after 2 or More Fires |
| VCAN1. Canopy: Southern Yellow Pine Basal Area | 2.2 | 2.5 | 2.7 |
| VCAN3. Southern Yellow Pine Stand Size Structure | 2.6 | 2.7 | 2.7 |
| VCAN4. Canopy: Fire-Tolerant Hardwood Basal Area | 1.4 | 2.2 | 2.3 |
| VCAN5. Canopy: Fire-Intolerant Tree Basal Area | 1.6 | 1.8 | 2.0 |
| VMID1. Midstory: Fire-Tolerant Hardwood Cover | 4.0 | 3.7 | 3.7 |
| VMID2. Midstory: Fire-Intolerant Tree Cover | 3.8 | 3.3 | 4.0 |
| Overall Condition Score | 2.9 | 2.9 | 3.2 |
Publisher’s Note: MDPI stays neutral with regard to jurisdictional claims in published maps and institutional affiliations. |
© 2021 by the authors. Licensee MDPI, Basel, Switzerland. This article is an open access article distributed under the terms and conditions of the Creative Commons Attribution (CC BY) license (https://creativecommons.org/licenses/by/4.0/).
Share and Cite
Nordman, C.; Faber-Langendoen, D.; Baggs, J. Rapid Ecological Integrity Assessment Metrics to Restore Wildlife Habitat and Biodiversity for Shortleaf Pine–Oak Ecosystems. Forests 2021, 12, 1739. https://doi.org/10.3390/f12121739
Nordman C, Faber-Langendoen D, Baggs J. Rapid Ecological Integrity Assessment Metrics to Restore Wildlife Habitat and Biodiversity for Shortleaf Pine–Oak Ecosystems. Forests. 2021; 12(12):1739. https://doi.org/10.3390/f12121739
Chicago/Turabian StyleNordman, Carl, Don Faber-Langendoen, and Joanne Baggs. 2021. "Rapid Ecological Integrity Assessment Metrics to Restore Wildlife Habitat and Biodiversity for Shortleaf Pine–Oak Ecosystems" Forests 12, no. 12: 1739. https://doi.org/10.3390/f12121739
APA StyleNordman, C., Faber-Langendoen, D., & Baggs, J. (2021). Rapid Ecological Integrity Assessment Metrics to Restore Wildlife Habitat and Biodiversity for Shortleaf Pine–Oak Ecosystems. Forests, 12(12), 1739. https://doi.org/10.3390/f12121739